Embed Size (px)
Citation preview
Human capital spillovers: The importance of training
Mary O’Mahony* and Rebecca Riley**
*Birmingham Business School, University of Birmingham**National Institute of Economic and Social Research and LLAKES
18-19 October 2012LLAKES Conference, University of London
Disclaimer: This work contains statistical data provided by the European Commission, Eurostat (European Community Household Panel Longitudinal User's Database, 1994-2001, Waves 1-8). Eurostat bears no responsibility for the analysis or interpretation of the data reported here.
Acknowledgements: The financial support of the Economic and Social Research Council (ESRC) and the European Commission is gratefully acknowledged. The work was part of the programme of the Centre for Learning and Life Chances in Knowledge Economies and Societies (LLAKES), an ESRC-funded Research Centre – grant reference RES-594-28-0001, and the INDICSER project financed by the EU 7th Framework Programme – grant no. 244709.

Background & Motivation• Knowledge transfer between workers is thought
to be an important driver of economic growth– (Romer, 1986; Lucas, 1988; Jovanovic & Rob, 1989)
• Evidence of human capital externalities associated with formal learning – Geographical concentration of skilled workers (Moretti, 2004; Rosenthal &
Strange, 2008; Heuermann, 2011)– Industry concentration of skilled workers (Winter-Ebmer, 1994; Sakellariou
& Maysami, 2004; Kirby & Riley, 2008)– Establishment use of skilled workers (Battu, Belfield & Sloane, 2004;
Martins & Jin, 2010; Bauer & Vorell, 2010)

• What drives these knowledge spillovers?– Evidence on level at which these occur– Alternative theoretical explanations
• A role for intangibles in enhancing knowledge transfer and spillovers to wages?– Employer provided training may increase the relevance of knowledge
exchange to the production process– IT should facilitate the sharing of ideas, technologies, experience– Separate from the notion of production complementarities between IT
and skilled labour or between different aspects of skill
Background & Motivation

This study
• Analyses the extent of knowledge spillovers from tertiary education within broad sectors– Mincerian approach to identification (Rauch, 1993;
Moretti, 2004)– Using cross-country longitudinal data on individuals’ wages
• Explores the importance of intangibles such as IT and training in determining the extent of these knowledge spillovers

Identifying spillovers from education using wage equations
𝑙𝑛𝑊𝑖𝑎 = 𝛽𝐼𝑁𝐻𝑖 + 𝛽𝐸𝑋𝐻𝑎 + 𝑜𝑡ℎ𝑒𝑟 𝑐𝑜𝑛𝑡𝑟𝑜𝑙𝑠+ 𝑒𝑟𝑟𝑜𝑟 𝑡𝑒𝑟𝑚
𝐻𝑖 = indicator of tertiary education 𝐻𝑎 = share of individuals with tertiary education in unit 𝑎 𝛽𝐼𝑁= private return 𝛽𝐸𝑋= external return or spillover within unit 𝑎
Risks conflating complementarities between high and low educated groups with spillovers from education �֜ Restrict sample to 𝐻𝑖 = 1.

Estimating equation
𝑙𝑛𝑊𝑖𝑗𝑐𝑡 = 𝛽𝐸𝑋𝐻𝑗𝑐𝑡 + 𝛼𝑋𝑖𝑡 + 𝛾𝑍𝑗𝑐𝑡 + 𝛿𝑗𝑐 + 𝛿𝑡 + 𝑢𝑖𝑗𝑐𝑡
where 𝑢𝑖𝑗𝑐𝑡 = 𝜔𝑗𝑐𝜃𝑖 + 𝑣𝑗𝑐𝑡 + 𝜀𝑖𝑗𝑐𝑡
and 𝐻𝑖 = 1 ∀𝑖 𝑖 = 𝑖𝑛𝑑𝑖𝑣𝑖𝑑𝑢𝑎𝑙; 𝑗= 𝑖𝑛𝑑𝑢𝑠𝑡𝑟𝑦; 𝑐= 𝑐𝑜𝑢𝑛𝑡𝑟𝑦; 𝑡 = 𝑦𝑒𝑎𝑟
Based on Moretti (2004) Journal of Econometrics.

Identification issues
• Selection on unobserved ability into high-skilled industries so that cov(θi,Hjct)≠0
Solution: Include Individual*Country/Industry fixed effects
• Time-varying country/industry shocks correlated with skill levels so that cov(vjct,Hjct)≠0
Solution: Control for productivity and 5-year employment growth

The importance of intangibles for these spillovers
• First term captures a complementarity between highly educated labour and training
• Second term captures an association between training and spillovers from education
Include in estimating equation:
+𝜌𝐼𝑁𝑇𝑗𝑐𝑡 + 𝜋𝐻𝑗𝑐𝑡𝐼𝑁𝑇𝑗𝑐𝑡

Data sources
• European Community Household Survey– 8 waves 1994 – 2001 (can track individuals over time)– Contains information on earnings from employment and highest
educational qualification (as well as training; demographics)– NACE recorded at a relatively aggregate level
• EUKLEMS and INDICSER data items (from 1995)– Training capital stocks (O’Mahony, 2012) distinguished by qualification– IT capital services, tangible capital services, labour productivity,
employment growth, workforce qualifications, output price deflators (O’Mahony & Timmer, 2009)
Estimation sample
• Countries for which we have qualification specific training stocks: – France, Spain, Germany, UK– Denmark, Sweden, Netherlands excluded due to data issues
• Restrict sample to male full-time employees age 26-55 with one job– Who have tertiary education (ISCED 5-7) upon entering the sample
and throughout the sample
• Public and financial sector excluded
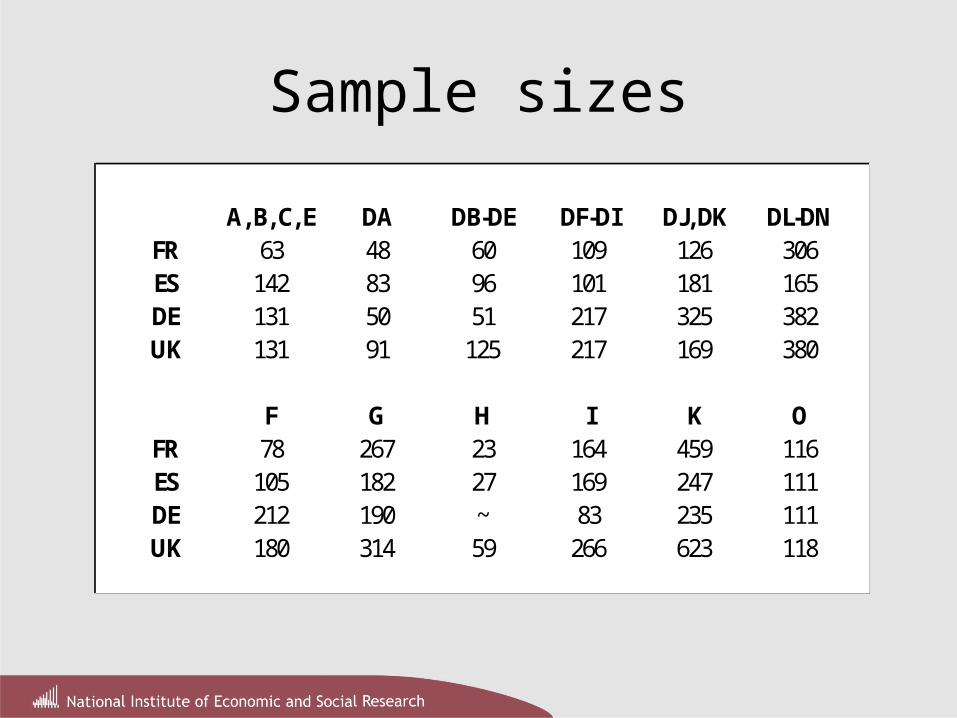
Sample sizes
A, B, C, E DA DB-DE DF-DI DJ, DK DL-DNFR 63 48 60 109 126 306ES 142 83 96 101 181 165DE 131 50 51 217 325 382UK 131 91 125 217 169 380
F G H I K OFR 78 267 23 164 459 116ES 105 182 27 169 247 111DE 212 190 ~ 83 235 111UK 180 314 59 266 623 118
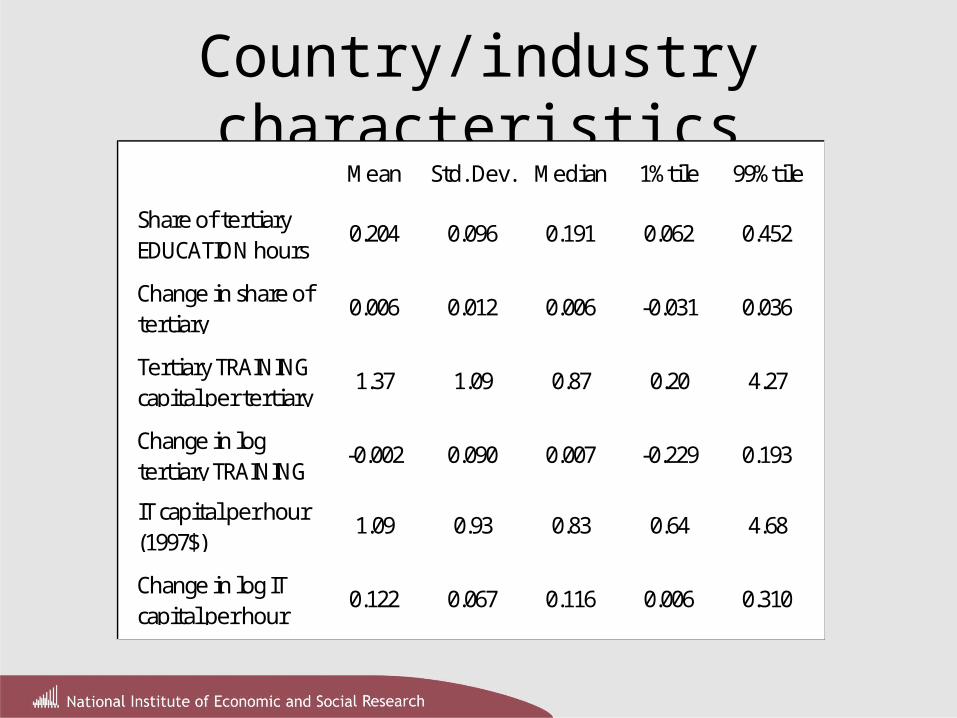
Country/industry characteristicsMean Std. Dev. Median 1%tile 99%tile
0.122 0.067 0.116 0.006 0.310
1.09 0.93 0.83 0.64 4.68
1.37 1.09 0.87 0.20 4.27
-0.002 0.090 0.007 -0.229 0.193
0.062 0.452
0.006 0.012 0.006 -0.031 0.036
Share of tertiary EDUCATION hours
Change in share of tertiary
Tertiary TRAINING capital per tertiary
Change in log tertiary TRAINING
IT capital per hour (1997$)
Change in log IT capital per hour
0.204 0.096 0.191

Spillovers from tertiary education(1) (2) (3) (4)
Share of tertiary EDUCATION hours 0.371 0.542* 0.869* 0.842***(0.467) (0.068) (0.098) (0.006)
Log tertiary TRAINING capital per tertiary hours 0.059 0.003 0.108* 0.040(0.341) (0.931) (0.088) (0.282)
Log IT capital-labour ratio 0.061 0.082*** 0.019 0.043(0.162) (0.003) (0.677) (0.132)
Person*Industry Fixed effects no yes no yesProductivity shocks no no yes yes
Fixed effects 48 2879 48 2879
Notes: Dependent variable is the log hourly wage; 8095 observations; Controls include log capital labour ratio, industry*country fixed effects, year effects, indicator for managerial and professional occupations, marriage, quadratic i age and quadratic in job tenure, workplace size, permanent contract, vocational training course; Controls for aggregate productivity shocks are log labour productivity and employment growth in the last 5 years; Standard errors corrected for clustering on country*industry*year cells.
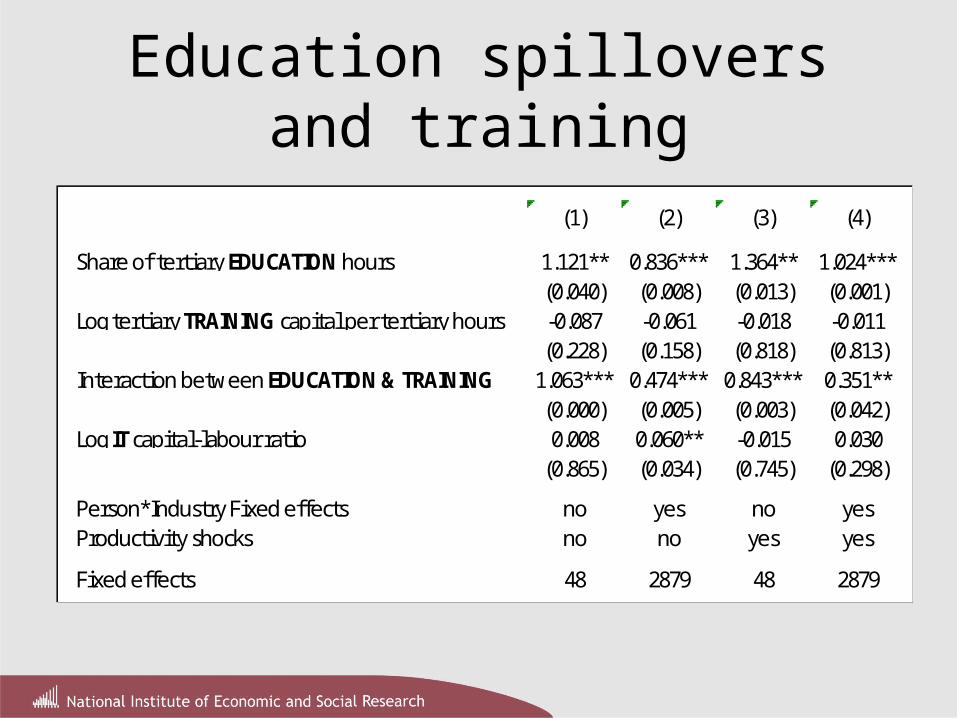
Education spillovers and training
(1) (2) (3) (4)
Share of tertiary EDUCATION hours 1.121** 0.836*** 1.364** 1.024***(0.040) (0.008) (0.013) (0.001)
Log tertiary TRAINING capital per tertiary hours -0.087 -0.061 -0.018 -0.011(0.228) (0.158) (0.818) (0.813)
Interaction between EDUCATION & TRAINING 1.063*** 0.474*** 0.843*** 0.351**(0.000) (0.005) (0.003) (0.042)
Log IT capital-labour ratio 0.008 0.060** -0.015 0.030(0.865) (0.034) (0.745) (0.298)
Person*Industry Fixed effects no yes no yesProductivity shocks no no yes yes
Fixed effects 48 2879 48 2879
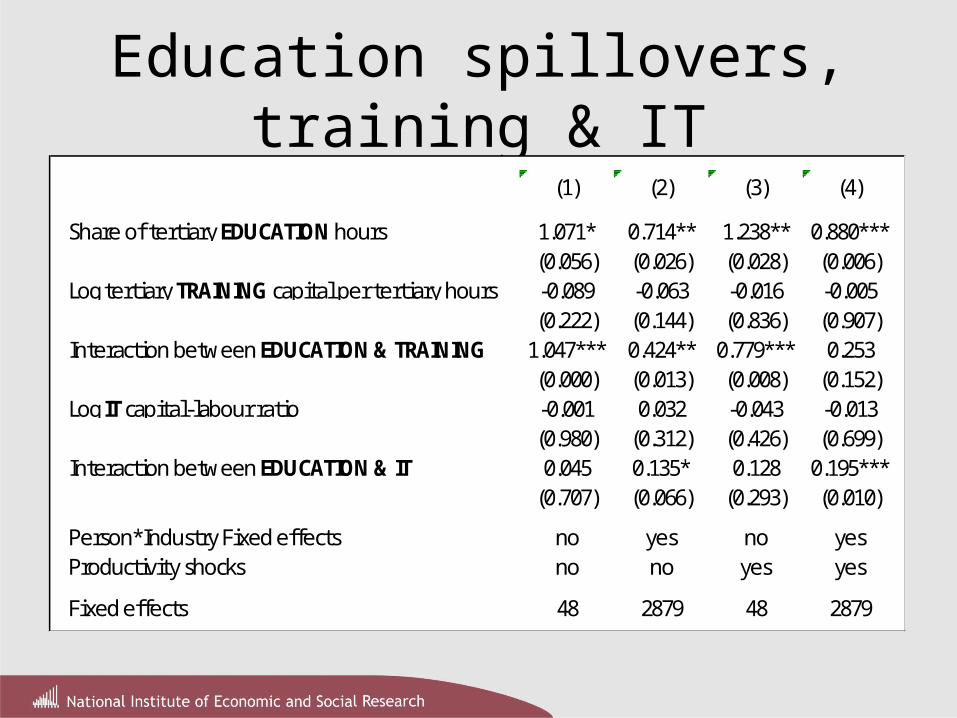
Education spillovers, training & IT(1) (2) (3) (4)
Share of tertiary EDUCATION hours 1.071* 0.714** 1.238** 0.880***(0.056) (0.026) (0.028) (0.006)
Log tertiary TRAINING capital per tertiary hours -0.089 -0.063 -0.016 -0.005(0.222) (0.144) (0.836) (0.907)
Interaction between EDUCATION & TRAINING 1.047*** 0.424** 0.779*** 0.253(0.000) (0.013) (0.008) (0.152)
Log IT capital-labour ratio -0.001 0.032 -0.043 -0.013(0.980) (0.312) (0.426) (0.699)
Interaction between EDUCATION & IT 0.045 0.135* 0.128 0.195***(0.707) (0.066) (0.293) (0.010)
Person*Industry Fixed effects no yes no yesProductivity shocks no no yes yes
Fixed effects 48 2879 48 2879
Conclusions • Evidence from wage equations using cross-country
longitudinal data is consistent with the presence of significant spillovers from tertiary education at sector level– A 1pp increase in the sector share of tertiary educated workers/hours raises
individuals’ wages by approx 0.8%.
– Individuals do not internalise the full benefits of their human capital investments
• We have highlighted some of the mechanisms through which intangibles may contribute to the growth process– Employers’ investments in training are positively associated with the extent of
spillovers from tertiary education
– In some models IT is positively associated with knowledge spillovers
– Agnostic about the direction of causality