Embed Size (px)
Citation preview

Human-Centered Interactivity of VisualizationTools: Micro- and Macro-level Considerations
Kamran Sedig, Paul Parsons, Mark Dittmer, and Robert Haworth
Abstract Visualization tools can support and enhance the performance of complexcognitive activities such as sense making, problem solving, and analytical reasoning.To do so effectively, however, a human-centered approach to their design and eval-uation is required. One way to make visualization tools human-centered is to makethem interactive. Although interaction allows a user to adjust the features of thetool to suit his or her cognitive and contextual needs, it is the quality of interactionthat largely determines how well complex cognitive activities are supported. In thischapter, interactivity is conceptualized as the quality of interaction. As interactivityis a broad and complex construct, we categorize it into two levels: micro andmacro. Interactivity at the micro level emerges from the structural elements ofindividual interactions. Interactivity at the macro level emerges from the combi-nation, sequencing, and aggregate properties and relationships of interactions as auser performs an activity. Twelve micro-level interactivity elements and five macro-level interactivity factors are identified and characterized. The framework presentedin this chapter can provide some structure and facilitate a systematic approach todesign and evaluation of interactivity in human-centered visualization tools.
K. Sedig (!)Associate Professor, Computer Science & Information and Media Studies,Western University, London, ON, Canadae-mail: [email protected]
P. Parsons • R. HaworthPh.D. Student, Computer Science, Western University, London, ON, Canadae-mail: [email protected]; [email protected]
M. DittmerM.Sc. Student, Computer Science, Western University, London, ON, Canadae-mail: [email protected]
W. Huang (ed.), Handbook of Human Centric Visualization,DOI 10.1007/978-1-4614-7485-2 29, © Springer ScienceCBusiness Media New York 2014
717

718 K. Sedig et al.
1 Introduction
A human-centered approach to visualization requires the consideration of a numberof issues, including the perceptual and cognitive characteristics of users, theirgoals and needs, and the nature of human tasks and activities. One way to makevisualization tools (VTs) human-centered is to design them with interactive features,so that users can engage in a dialogue with a VT through a back-and-forth flowof information. In this manner, users can adjust visualizations to suit their needsand preferences. Although it is widely acknowledged that making VTs interactiveenhances their utility, the degree of utility depends upon the quality of the interactionwith a VT.
Numerous contextual and ideological factors have influenced the manner inwhich the use of interactive technologies has been studied. For instance, Crystal andEllington [13] discuss how task analysis in human-computer interaction research hasits historical roots in early studies of physical activity, organizational management,and human factors. These influences led to a system-centric approach when charac-terizing interaction with technologies. Paul Dourish [14] describes the influence ofcomputational models of the mind on early HCI research, and how the result waswide adoption of procedural accounts of human activity. Consequently, such modelslargely informed the conceptualization and design of interactive technologies. Theseviews, however, have been challenged by recent research in cognitive science, whichposits that cognitive activity is distributed, embodied, and generally far richer andmore complex than previous models suggest. In addition, much research in the pastinvolving human activity has overlooked complexity in order to make objects ofstudy ‘researchable’ [17]. Such approaches have only limited utility, and althoughpotentially useful as analytic frameworks, cannot adequately characterize humancognitive activity.
In addition to these shifting views, interactive technologies are nowadays beingused to engage in more complex activities than the simple structured tasks of theearly days of HCI [2, 3, 22, 28, 47, 53, 56]. More recently, researchers in variousdomains related to human-centered visualization and informatics (e.g., [3, 17, 28,45]) have begun to focus more on the needs, characteristics, and activities of users.Technological advances in recent years have led to the development of highlyinteractive visualization tools that are used to engage in complex and unstructuredactivities. For instance, visualization tools are being used to support sense makingof large and complex social networks, solving open-ended problems in science,and making decisions regarding global distribution of resources. While researchersnow understand what leads to effective visualizations for simple and well-definedtasks, we still know very little about the dynamics of effective VTs for complexactivities [22, 53].
Part of the challenge of designing effective VTs is the lack of comprehensiveframeworks to inform the conceptualization and discussion of interactivity.Researchers investigating different aspects of human-centered informatics haverecently been emphasizing the need for theoretical frameworks. For instance,

Human-Centered Interactivity of Visualization Tools 719
Kaptelinin and Nardi [28] have proposed that there is currently “marked interest inframeworks that can provide an explanation of why and how certain subjectivephenomena are taking place in situations surrounding the use of interactivetechnologies”. A number of other researchers have identified the lack of theoreticalframeworks as a major research problem in information visualization, human-computer interaction, visual analytics, and other related areas over the past decade(see [16, 27, 29, 42, 54, 57, 68]).
Frameworks that thoroughly and methodically characterize interactivity inVTs can greatly assist designers and evaluators. Presently, there is no commonvocabulary for discussing the interactivity of VTs, and frameworks can providesuch a vocabulary. This chapter makes a contribution to address this need, andis part of a larger research plan to develop a comprehensive framework fordesign, analysis, and evaluation of interactive tools that mediate and facilitatethe performance of complex cognitive activities. This large framework is calledEDIFICE (Epistemology and Design of human InFormation Interaction in complexCognitive activitiEs). This chapter characterizes some aspects of interactivity invisualization tools, and is therefore referred to as EDIFICE–IVT—where IVTstands for interactivity in visualization tools. Interactivity is not exhaustivelycharacterized here, as such an endeavor is beyond the scope of a single chapter.However, this chapter does approach interactivity in a methodical manner andcan therefore provide some systematicity to interactivity research and design.Section 2 provides some necessary background information regarding interaction,interactivity, and some cognitive considerations. Section 3 examines some of thechallenges encountered by researchers when discussing interaction and interactivity,and proposes a categorization of interaction and interactivity into multiple levels todeal with some of these challenges. Section 4 identifies and characterizes elementsand factors of interactivity at a micro and at a macro level, and provides a designscenario. Finally, Sect. 5 provides a summary of the chapter.
2 Background
Modern visualization tools are used to support the performance of activities suchas analyzing terrorist threats [68], making sense of climate change patterns [29],and learning about complex mathematical concepts and structures [39, 40]. Suchactivities involve mental processes that derive new information from given informa-tion in order to reason, solve problems, make decisions, and plan actions [36]. Assuch activities emerge from the combination and interaction of elementary processes(e.g., perception, memory encoding and retrieval), and take place under complexconditions, they are referred to in the cognitive science literature as complex [18].In this chapter, we are concerned with how VTs best support complex cognitiveactivities rather than simpler and lower-level cognitive and perceptual processes. Ofparticular concern is the manner in which such activities emerge from interactionswith VTs. While using VTs, users interact with representations of information

720 K. Sedig et al.
displayed at the visually perceptible interface of the tool. Henceforth these arereferred to as visual representations (VRs). Examples of VRs include radialdiagrams, network graphs, tables, scatterplots, parallel coordinates, maps, and anyother visual form that encodes and organizes information. What constitutes a VRwithin an interface can vary depending on the level of granularity at which theinterface is viewed. For instance, the totality of an interface can be considered aVR. However, the interface may also be said to contain a number of distinct VRs(e.g., a map, a table, a scatterplot, and so on). Furthermore, each of these could beconsidered to be made up of different VRs (e.g., the map may contain any numberof glyphs). In this chapter we are concerned specifically with interactive VRs andnot with static representations. Henceforth, the term ‘VR’ implies ‘interactive VR’.
2.1 Interaction and Interactivity
Broadly speaking, interaction refers to a reciprocal active relationship—that is,action and reaction. The suffix ‘ity’ is used to form nouns that denote a qualityor condition. In this chapter, interactivity refers to the quality of interaction betweena user and a VT. By defining interaction and interactivity in this manner, a cleardistinction is made between them and each can be analyzed and developed in relativeindependence. The distinction is important since a VT may be highly interactive, butif the quality of the interaction is not good, the system will not support the cognitiveactivities of its users effectively.
One way to conceptualize this difference is in the context of a user performingan individual interaction. An interaction may be thought of as having both anontological and an operational aspect. The ontological aspect is concerned withwhat the interaction is and what its goal is. For instance, filtering refers to a useracting upon a VR to have only a subset of it displayed according to some criteria.The operational aspect is concerned with how an action is performed. For instance, auser may issue a textual command through a keyboard to operationalize the filteringinteraction. On the other hand, the user may click and drag on a slider to achieve thesame result. The manner in which an interaction is operationalized has been shownto have a significant effect on the quality of a user’s interaction with a VT (see [38]).The ontological aspect—what an interaction is and what its characteristics are—is concerned with the interaction itself, whereas the operational aspect—how theinteraction is put into use—is the concern of interactivity.
The concept of interactivity has been discussed previously in the literature of var-ious domains; its use and characterization, however, has often been vague and hap-hazard. Within the past decade researchers have referred to the characterizations ofinteractivity in the literature as “exceedingly scattered and incoherent” [31], “vagueand all-encompassing” [21], “blurry” [1], “lacking in an underlying model” [44],“lack[ing] a common language” [60], and “undertheorized” [8]. Although someresearchers have attempted to characterize interactivity, much of the research hasbeen done in the context of media and communication studies (e.g., [8,15,26,31,37])
Human-Centered Interactivity of Visualization Tools 721
and advertising and marketing (e.g., [20, 41, 72]). The focus of such research isoften on human-human communication, brand perception, communication medium,and social information exchange. As a result, the research in these areas does notnecessarily transfer well to the domain of interactive visualizations.
Although visualization researchers have been focusing on different elements ofinteraction in recent years (e.g., [5, 19, 43, 52, 66, 71]), very little attention has beenpaid to interactivity. Some effort has been made to characterize interactivity inthe context of educational technologies (e.g., [60]). However, as the function ofeducational technologies is often very specific (e.g., engaging users in deep andeffortful processing of information), such research is not necessarily generalizable toall VTs. In addition, these previous characterizations have not been exhaustive, andthe research community would likely benefit from a more systematic and thoroughcharacterization of interactivity that is applicable to all VTs.
As research from a human-centered perspective is fundamentally concernedwith how VTs best support human cognition, it is helpful to briefly examinedevelopments within cognitive science research and their implications for thedesign, use, and evaluation of VTs.
2.2 Cognitive Considerations
Research in various branches of cognitive science over the past few decades hasdemonstrated that human cognition is fundamentally influenced by the environmentin which one is situated [7, 11, 12, 24, 35, 55]. Recent characterizations of humancognition as a phenomenon that emerges from interactions among the brain,body, and external environment have supplanted older models depicting humancognition as an internal phenomenon consisting of symbolic computation—a type of‘software’ running on neural ‘hardware’. Indeed, research that has been conductedon the use of external resources for cognitive purposes has demonstrated that humancognition is deeply intertwined with phenomena that are external to the brain andbody (e.g., see [35]).
Although a deep understanding of human cognition is necessary for researchin human-centered visualization, the development of VTs is often uninformed byresearch in cognitive science [22]. This condition is being noticed by researchers inthe visualization community. For instance, recently Arias-Hernandez et al. [6] havestated that “these understandings [in visualization research] still rely on traditionalcognitive models that focus on universalisms and assumptions of humans as passivecognitive agents while downplaying recent models that emphasize the situated-ness and active role of humans in tight couplings with external representations-processes.” A more systematic incorporation of cognitive science research wouldcertainly benefit visualization researchers and practitioners.
One recent development in the study of human cognition that is particularlyrelevant for VTs is the theory of distributed cognition. This theory posits that theunit of analysis for cognition should include elements external to one’s brain and

722 K. Sedig et al.
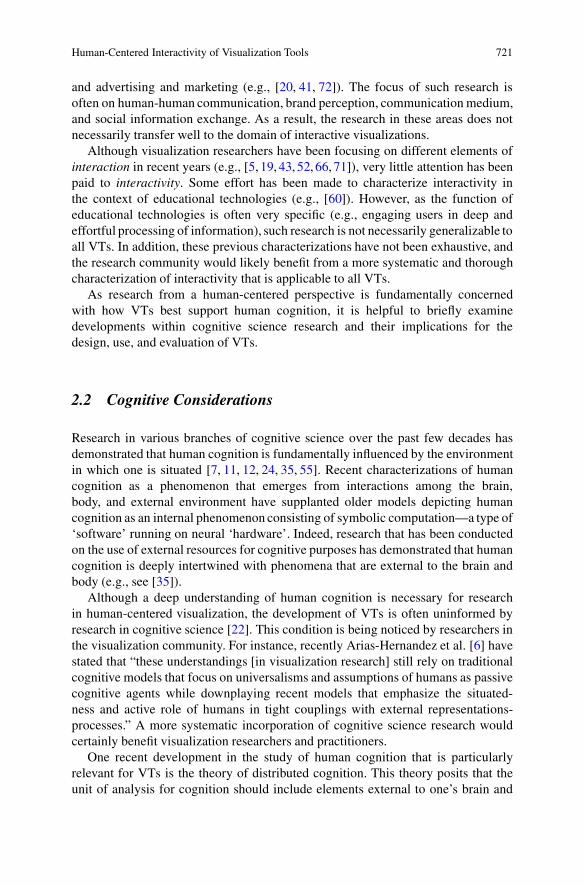
body that contribute to cognitive processes. Cognition may be socially distributed,temporally distributed, and/or distributed across internal and external structures andprocesses [23]. Consequently, the unit of analysis of cognition is not restricted to thebrain or even the body alone—it includes socio-technical systems such as the bridgeof a ship [24] or an airline cockpit [25], and human–artifact systems such as a personusing a pencil and paper [9]. The theory of distributed cognition is being used moreand more in recent years in the visualization community to conceptualize variousaspects of design and evaluation of VTs (e.g., see [29, 42, 52, 53, 59, 60, 62, 69]). Inthis chapter we are concerned with the distribution of cognitive processes across anindividual and a VT. As a result, the unit of analysis is the human–VT system, andof particular concern is the strength of the coupling among these two components.The quality of interaction—the interactivity—of a VT is a direct result of thestrength of the coupling of this human–VT system. In another chapter of thisbook, the distribution of information processing that occurs within the human–VTsystem during the performance of complex cognitive activities is analyzed in detail(see [50]).
When users interact with VTs, cognitive processes emerge from a coupling that isformed between the internal representations and processes of the user and externalrepresentations and processes at the interface [11, 34, 55]. Although research hasdetermined that the quality of this coupling is vital to the performance of complexcognitive activities, visualization researchers have tended to overemphasize theimportance of external representations (i.e., VRs) and underplay the importance ofinternal representations and how they are coupled through interaction [6]. This isnot to say that proper design and analysis of VRs is trivial; rather, the point is thatthe user and the VT must be considered as a dynamic system, and the effects of eachon the other must be given appropriate consideration (see [49] for a discussion ofthe cognitive utilities of different VRs).
Although working with a static representation to support cognitive activitiesengages external cognition and creates a coupling, the coupling is not very strong.During the performance of complex cognitive activities, users are forced to adaptto the characteristics of static representations and to make extrapolations regardinginformation that is not encoded. When representations are made interactive, how-ever, there is potential for strong coupling, and users can adjust VRs to meet theircontextual and cognitive needs. In addition, as cognitive processes are intrinsicallytemporal and dynamic, interactive VRs potentially create a harmony and a tighttemporal coupling with cognitive processes [32, 33]. As part of this dynamicallycoupled cognitive system, the user and the VT each have a causal influence—inother words, the user and the VT are continuously affecting and simultaneouslybeing affected by each another (see Clark’s discussion of continuous reciprocalcausation in [10]).
The ultimate implication here is that complex cognitive activities are circum-scribed by the features of the environment and, in particular, by the strength ofthe coupling between internal mental processes and external representations ofinformation. As interaction with VTs forms a coupled system in which there isreciprocal causal influence, we cannot understand or discuss complex cognitive
Human-Centered Interactivity of Visualization Tools 723
interface
visualization tooluser
induction,deduction,
apprehension,judgment, memory
encoding andretrieval,
classification,...
mental processes
computationsand storage
coupledc ognitive system
visualencoding
reac
tion
action
perceptionduc o
deductioappre
eret
classifi
on,emorynd
al,tion
VR
s tV
Rs t
+x
Fig. 1 The coupling that is formed between a user and a visualization tool
activities without examining the ways in which such activities are constrained,canalized, or enhanced by the tools that are supporting the activities. It is importantto realize that the process of performing activities is as much driven by thecharacteristics of tools as it is by the characteristics of users [33]. It is necessary,therefore, to examine the elements and factors that affect the quality of interactionwith a VT. Some elements and factors will be identified and developed in Sect. 4 (seeFig. 1).
3 Levels of Interaction
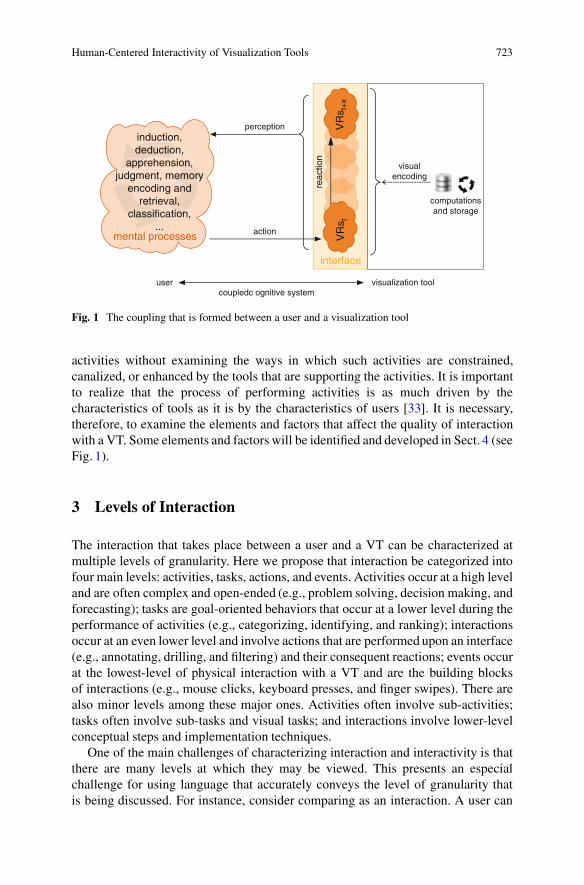
The interaction that takes place between a user and a VT can be characterized atmultiple levels of granularity. Here we propose that interaction be categorized intofour main levels: activities, tasks, actions, and events. Activities occur at a high leveland are often complex and open-ended (e.g., problem solving, decision making, andforecasting); tasks are goal-oriented behaviors that occur at a lower level during theperformance of activities (e.g., categorizing, identifying, and ranking); interactionsoccur at an even lower level and involve actions that are performed upon an interface(e.g., annotating, drilling, and filtering) and their consequent reactions; events occurat the lowest-level of physical interaction with a VT and are the building blocksof interactions (e.g., mouse clicks, keyboard presses, and finger swipes). There arealso minor levels among these major ones. Activities often involve sub-activities;tasks often involve sub-tasks and visual tasks; and interactions involve lower-levelconceptual steps and implementation techniques.
One of the main challenges of characterizing interaction and interactivity is thatthere are many levels at which they may be viewed. This presents an especialchallenge for using language that accurately conveys the level of granularity thatis being discussed. For instance, consider comparing as an interaction. A user can
724 K. Sedig et al.
compare at the level of an individual interaction, by acting upon a VR and receivinga reaction that communicates its degree of similarity to another VR. The user canalso compare at the higher level of performing a task, by combining and linkingmultiple interactions together to determine the degree of similarity of a numberof VRs. Additionally, although not an interaction, the user can compare at thelevel of perceptual tasks that involve pre-attentive visual comparisons. It is oftenthe case in the visualization literature that no distinction is made among theselevels. This simple example highlights the necessity of having an accurate languagefor discussing interaction. Conceptualizing interaction as having multiple levelscan mitigate this issue and facilitate more consistent discourse using a commonvocabulary. In this chapter, we have attempted to discuss these levels in a consistentmanner. The catalog discussed below, for instance, attempts to give some structureto interaction at a particular level—at a level that is higher than physical events,low-level conceptual steps, and interaction techniques, but is lower than tasks andcomplex activities. This type of consistency can help to clarify and give structure tothe landscape of interaction and interactivity design.
In previous years, researchers were concerned with designing and evaluatinginteractive technologies to effectively support relatively simple and highly struc-tured tasks, such as entering data into spreadsheets, composing letters and otherdocuments, sending emails, locating particular files on a hard drive, and organizingfiles and folders. Numerous models were constructed and/or used to characterizeuser activity. Hierarchical task analysis, GOMS, and cognitive task analysis areexamples of models that were used in the HCI community to characterize userinteraction with technology. The utility of such models is their rigorous and highlystructured characterizations of user activity. Their descriptive and prescriptiveabilities, however, seem to fall short in the context of open-ended, unstructured, andcomplex activities. Visualization researchers have also devised descriptive modelsof user activity. Examples include the Information Seeking Mantra [67]: overview,zoom, filter, and details on demand and the Visual Analytics Mantra [30]: analyzefirst, show the important, zoom, filter and analyze further, details on demand. In asimilar manner, these models are not sufficient for capturing the richness of deepand complex activities.
Characterizing interaction at multiple levels in order to discuss interactivity canhelp deal with some of the challenges mentioned above. For example, the dynamicsof complex cognitive activities in a user-VT system can be conceptualized interms of both embeddedness and emergence. That is, lower levels are embeddedwithin one another. A ranking task, for instance, may involve the actions offiltering, selecting, and arranging. Each action may involve any number of low-level conceptual steps and physical events. Conceptualizing interactivity in termsof embeddedness allows for clear decomposition of phenomena into constituentcomponent parts at lower levels. This analytical approach is typical of much ofthe early research in interaction as mentioned in the previous paragraph. Such anapproach is highly useful for analysis, and allows for precise characterizationsof interaction, especially at lower levels of granularity. Unlike simple tasks,however, complex cognitive activities are nonlinear and emergent phenomena [46].

Human-Centered Interactivity of Visualization Tools 725
planningreasoning
problemsolving
learningactivitiessub-activities
drilling comparing
taskssub-tasks
filtering measuringinteractions
events
macro
microtransforming
categorizing
browsing locating
identifying
swiping pinchingclicking tapping dragging
...
...
...
...
emer
genc
y
Fig. 2 Interaction categorized into four main levels
Accordingly, the manner in which users perform interactions with a VT to engagein complex activities are often nonlinear and do not follow a pre-determinedpath [32, 63, 68]. During the course of such activities, although user goals typicallyhave some stability over time, they often undergo changes—in other words, theconstituents of an activity are not fixed but can dynamically change as conditions ofthe activity change [48]. If interaction with tools is treated as a rigid and formulaicprocess, then we risk missing the dynamics that emerge from sustained interactionwith a tool [32]. Therefore, at higher levels, emergent properties occur as a resultof the combination of phenomena at lower levels. As complex cognitive activitiesoften do not follow a pre-determined plan, precisely describing the path of anactivity is not possible. What can be done, however, is to understand the elementsand factors that contribute to the interactivity of a VT and create an environmentthat best supports the emergence of complex cognitive activities. Such an approachcombines the strength of an analytic strategy of decomposing lower levels of activityinto component states and processes as well as a synthetic strategy that supportsemergence at higher levels (Fig. 2).
In this chapter, interactions are viewed at the level of general patterns of actionand reaction that have an epistemic benefit, rather than as more concrete techniquesor instantiations of patterns. Sedig and Parsons [63] have recently devised aframework that contains a catalog of over 30 epistemic action patterns, and havediscussed the utility of each for performing complex cognitive activities. Table 1provides a list of some of these patterns. In this catalog, each action is characterizedin a conceptual, pattern-based fashion in terms of its epistemic benefit. As a result,there can be many variations of a pattern and many techniques for implementingan instance of an action pattern in a VT. For example, consider the action patternof arranging that is identified and characterized in the catalog. This action patternrefers to a user acting upon VRs to change their ordering and spatial organizationwithin the interface. Variations of this pattern include moving, ranking, ordering,and sorting. In other words, each of these variations consists of a user actingupon VRs to change their ordering and spatial organization within the interface.In addition, each of these may consist of any number of conceptual steps and/orevents at the physical level of interaction with the VT.

726 K. Sedig et al.
Table 1 Some action patterns from the catalog of Sedig and Parsons [63]
Action DescriptionAnimating Generating movement within VRsAnnotating Augmenting VRs with additional visual marks and coding schemes, as
personal meta-informationArranging Changing the ordering and organization of VRs, either spatially or temporallyBlending Fusing VRs together such that they become one indivisible, single, new VRCloning Creating one or more copies of VRsDrilling Bringing latent, interior information to the surface of VRsFiltering Displaying only a subset of information in VRsMeasuring Quantifying VRs in some way (e.g., by area, length, mass, temperature, or
speed)Searching Seeking out the existence of or locating information in VRsScoping Dynamically working forwards and backwards to view the compositional
development and growth of VRsTransforming Changing the geometric form of VRsTranslating Converting VRs into alternative informationally- or conceptually-equivalent
forms
4 Characterizing Interactivity
Just as interaction can be conceptualized as having multiple levels, so can interac-tivity be conceptualized in this manner. In this chapter we categorize interactivityinto two main levels: a micro level and a macro level. Interactivity at the microlevel emerges from the structural elements of individual interactions. Interactivityat the macro level emerges from the combination of individual interactions toperform tasks and activities. Sections 4.1 and 4.3 will characterize and discuss someconsiderations of interactivity at the micro level and at the macro level respectively.
4.1 Micro-level Interactivity
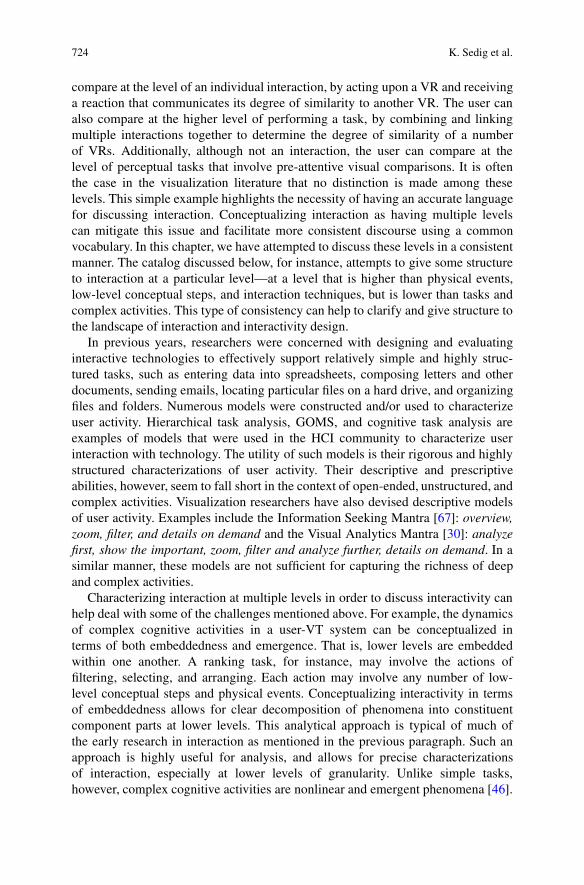
As we are concerned with individual interactions at a general, pattern-basedlevel (see Sect. 3), any interaction has a number of elements that collectivelygive it structure. Interactivity at the micro-level emerges from these elements.As discussed earlier, each individual interaction has two components: action andreaction. The manner in which the action and reaction components of an interactionare operationalized affects the strength of the coupling between a user and a VT.Each element has different operational forms, and varying the operationalizationof these structural elements determines the quality of the interaction. Currently, wehave identified 12 elements—6 for action and 6 for reaction. The elements of actionare: presence, agency, granularity, focus, flow, and timing. The elements of reactionare: activation, flow, transition, spread, state, and context. In what follows, we willcharacterize each element and discuss some possible ways in which each can beoperationalized (Fig. 3).

Human-Centered Interactivity of Visualization Tools 727
VRst VRst+x
actio
n
reaction
perc
eptio
n
mental processesent oces
interface
actionelementspresenceagency
granularityfocusflow
timing...
reactionelementsactivation
flowpropagation
transitionstate
context...
Fig. 3 Some structural elements of an individual interaction
4.1.1 Action Component
There are at least six elements that make up the action component of an interaction.These are discussed next.
Presence. This element is concerned with the existence and advertisement of anaction. In other words, this element is about the cue or signal from the visualizationused to prompt the user or advertise the existence of the interaction. Two of themain forms of this element are: explicit and implicit. If presence of an actionis explicit, the availability, existence, or provision of the interaction is explicitlyadvertised by the tool, such as when a label or tool tip is used to let the user knowthat the interaction exists. When presence is implicit, the interaction exists, but itsavailability is either not easily perceptible by the user, or it is not visible at theinterface level. In this case, the user must know of the existence of the interaction,or it would seem to the user that the interaction were non-existent.
Agency. This element is concerned with the metaphoric agency through which anaction is expressed. Once the user knows of the existence of an action, the action
728 K. Sedig et al.
must be articulated in some manner. Some of the main forms that this element canassume include: verbal, manual, pedal, and aerial. Through verbal agency, actionsare expressed through the user’s ‘mouth’ (e.g., text menus, commands, or natural-language speech); that is, it is as if the user speaks to the VRs. Using this form, theVRs are viewed as entities that understand linguistic commands and react to them.Through manual agency, actions are expressed through the user’s ‘hands’ (e.g., apointing cursor); that is, it is as if the user’s hand reaches into the VRs and touchesand grasps their visual components. Using this form, the VRs are thought of asobjects that can be handled and manipulated. Through pedal agency, actions areexpressed through the user’s ‘feet’ (e.g., an avatar that walks); that is, it is as ifthe user walks on a terrain. Using this form, the VRs can be regarded as maps onwhich the user moves. Finally, through aerial agency, actions are expressed throughthe user’s ‘wings’; that is, it is as if the user flies over or through the VRs. Usingthis form, the VRs are thought of as space through which the user can navigate.It is important to note that the last two forms are very similar as they both expressan interaction through navigation. An example of aerial means of an interaction iswhen the user can fly in a 3D VR and gets near a visual element. Upon reachinga certain distance, the visual element can be drilled to provide extra information tothe user. As the user flies away, the extra information can disappear.
Granularity. This element is concerned with the constituent steps of an action.There are two main forms of granularity: atomic and composite. If the granularityof an action is atomic, the action cannot be decomposed into further steps—i.e.,there is only one step. If the granularity of an action is composite, the actionrequires more than one step. As the interaction construct is at a higher level thanlow-level physical events, an action may be operationalized in different ways suchthat there are different granularities in different contexts. In other words, sinceinteractions are not characterized at the lowest possible level, the constituent parts ofan action pattern are variable. To clarify and illustrate this element, let us examinea VT, Super Tangrams (see [58]). This is an interactive game in which childrenuse transformation geometry operations to rearrange visual shapes and fit theminto an outline without the shapes overlapping. Solving each puzzle requires a setof interactions. Consider the user moving a shape—a variation of the arranginginteraction pattern discussed above. In order to move the shape (i.e., perform oneinteraction), the user must go through the following steps: choose the shape, choosean operation (e.g., rotation), adjust the parameters of the operation (e.g., angleof rotation and center of rotation), and finally press a ‘Go’ button. In this case,the action has composite granularity. This same interaction can be designed tohave atomic granularity. For instance, the user can choose a shape that has pre-determined parameters simply by clicking on the shape, and then the reaction ensuesautomatically without the need to press a ‘Go’ button. In other words, the action inthis case cannot be decomposed into multiple steps.
Focus. This element is concerned with the focal point of an action. Two of themain forms of focus are: direct and indirect. If focus of an action is direct, the

Human-Centered Interactivity of Visualization Tools 729
action is expressed by the user directly acting upon the VR. If the focus of actionis indirect, the action is expressed by the user operating on other intermediaryinterface representations in order to communicate with and cause a change in theVR of interest. As an example, consider a VR of a human heart that a user wishes toslice open to make sense of its internal components. If the focus of action is direct,the user could click on the VR to open the heart. If the focus of action is indirect, theuser may select an anatomical feature from a list to have the VR of the heart opento expose that feature.
Flow. This element is concerned with how an action is parsed in time. Two mainforms of flow are: discrete and continuous. If the flow of an action is discrete,the action occurs instantaneously and/or is punctuated. If flow of an action iscontinuous, the action occurs over a span of time in a fluid manner. For example,a user may be viewing a VR of a scientific co-citation network for the year 2005and want the VR to display the network for 2010. The user may click on a buttonthat says ‘2010’—that is, the action flow is discrete. The user may also click on aslider at its current position and drag it until it is at 2010—an example of continuousaction flow. One study found that the manner in which action flow is operationalizedhas a significant impact on the cognitive processes of the user (see [38]).
Timing. This element is concerned with the amount of time the user is given tocompose and/or commit an action. There are two main forms of action timing: user-paced and system-paced. User-paced timing allows the user to compose and commitan action at his or her own pace. Using this form of timing, the user has as muchtime as needed to think about and examine a situation before committing an action.Even when the flow of action is discrete, the user may choose to take any amount oftime before the discrete submission of the action. If action timing is system-paced,however, the user has a limited time to compose and perform an action.
4.1.2 Reaction Component
There are at least six elements that make up the reaction component of aninteraction. Collectively these six elements can also be referred to as feedback.Even though feedback is discussed by many researchers, it is often presented asan all-encompassing construct that does not distinguish between different levelsof interaction and interactivity. Visualization researchers and practitioners wouldbenefit from having a clearer characterization of the elements that make up thestructure of feedback at the level of each interaction. As this chapter is concernedwith human-centered interactivity, reaction refers to the effects of an action that arevisually perceptible at the interface, and not those that may take place internallyin the VT and are hidden from view of the user. In addition, as users and VTsare coupled into one cognitive system, using language from systems theory canfacilitate conceptualization of the reaction component and its elements. Interfacesare subsystems of a broader user-VT system. Interfaces are also open systems—they receive some input from the user (i.e., an action) and provides some output to

730 K. Sedig et al.
the user (i.e., a reaction). During the reaction process, the interface goes throughfluctuations before reaching equilibrium. As a result, some of the reaction elementsdeal with the reaction during fluctuation while others deal with the reaction as theinterface reaches equilibrium.
Activation. This element is concerned with the point at which the reactionbegins. There are at least three main forms of activation: immediate, delayed, andon-demand. If activation is immediate, the interface reacts to the user’s actioninstantaneously. If activation is delayed, there is a temporal gap between the user’saction and the reaction. Finally, if activation is on-demand, the reaction does not takeplace until requested by the user. Immediate activation of reaction is often discussedin the literature—and is often referred to as ‘immediate feedback’—as the onlydesirable form of activation. While this may be true for most productivity VTs, thereare applications in which delayed and on-demand activation are useful (see [4]).
Flow. This element is concerned with how a reaction is parsed in time. There aretwo main forms of flow: discrete and continuous. In discrete flow, the reaction occursinstantaneously and/or is punctuated. In continuous flow, the reaction occurs overa span of time in a fluid manner. For example, consider a user making sense ofclimate change patterns with a 3D VR of the earth. If the user is viewing temperaturepatterns at a point in time (e.g., 1950), during the activity she can perform an actionto request that the VR display the temperature at a different point in time (e.g.,2010). The flow of the reaction may be discrete—that is, the temperature patterns for2010 appear instantaneously or the change is punctuated and has discrete intervals.On the other hand, the flow of the reaction may be continuous—that is, the changefrom 1950 to 2010 takes place over a span of time in a fluid manner. One studyfound that the manner in which reaction flow is operationalized has a significantimpact on the cognitive processes of the user (see [38]).
Transition. This element is concerned with how change is presented. As aninteractive VR is a spatio-temporal entity, its changes can be presented either bydistorting its temporal dimension or its spatial dimension. Hence, there are twogeneral types of transition: stacked and distributed. With stacked transition, changesare sequentially stacked on top of one another so that only the current frame of thechanging VR is visible. In distributed transition, a number of visualizations captureand preserve instances of the changing VR and present them spatially—in otherwords, the temporal dimension of the changing VR is distorted and is presentedas parallel visualizations distributed in space. To examine the difference betweenthe two forms, consider an educational VT that supports learning about molecularbiology. Such a VT may display a VR of a cell with which the user can learn aboutmitosis. A user can act upon the VR so that there is a transition from the current stateof the cell to the end of a mitosis process. If the transition of the reaction is stacked,the subsequent states of the mitosis process will be displayed on top of one another.If the transition is distributed, subsequent phases of the transition will be displayedspatially in different locations. One study found that the different forms of transitionhad significantly different effects on cognitive processes of the user (see [64]).
Human-Centered Interactivity of Visualization Tools 731
Spread. This element is concerned with the spread of effect that an action causes.When an action is performed, it can cause change not only in the VR of interest,but also in other VRs. There are two main forms of spread: self-contained andpropagated. In the self-contained form, the VR of interest is the only VR that isaffected by the action. In the propagated form, the effect of the action propagatesto other VRs in the interface. Consider a VT that supports forecasting of financialoutcomes for a company. The interface may contain five separate VRs—one foreach of accounting records, projected revenue, sales data, market indicators, and theperiod of time that is being considered. If an action is performed, the spread mayaffect only the VR of interest (e.g., acting upon the VR of market indicators to showor hide a subset of the possible indicators). The effect may also be propagated toother VRs (e.g., acting upon the VR of accounting records and having the changespread to the VR of projected revenue so that it is updated).
State. This element is concerned with the conditions of the interface (i.e., theinterface’s VRs) once the reaction process is complete and the interface reachesequilibrium. There are three main states that VRs affected by an action can take:created, deleted, and altered. VRs that have been affected by an action may be ina created state—that is, they did not exist before the activation of the reaction, butwere created during the reaction process and are now visually perceptible at theinterface. VRs that have been affected by an action may also be in a deleted state—that is, they did exist before the activation of reaction, but were deleted during thereaction process and are no longer visible. Finally, VRs that have been affected byan action may be in an altered state—that is, they did exist before the activationof reaction, and still exist as the interface reaches equilibrium, but some of theirproperties have been altered.
Context. This element is concerned with the general context in which VRs existas the interface reaches equilibrium. Before the activation of a reaction, there issome context in which a VR exists. A reaction either maintains this general contextor effects a change in context. Hence, there are two main forms of this element:changed and unchanged. There is an important difference between context andstate. A VR may be created or deleted, for instance, but the general context inwhich the VR exists can remain unchanged. As an example, consider a VT forpublic health informatics. A user can perform an annotating action on a VR byhighlighting or attaching a note to it. As the interface reaches equilibrium (i.e., thereaction has occurred and the annotation is displayed), the context in which the VRexists is unchanged and is the same as it was prior to the reaction. The user mayperform a drilling action on the same VR that results in new information abouta particular disease appearing and temporarily replacing the previous information,thus changing the context.
As was mentioned above, these 12 elements collectively contribute to thestructure of any individual interaction. In addition, as discussed in Sect. 2, theinterface of a VT can contain any number of individual VRs. Consequently, thedifferent forms of these structural elements are not necessarily mutually exclusive.For instance, in the study conducted by Sedig et al. [64], in one of the test versionsof the VT, an action resulted in both forms of transition in two different VRs.

732 K. Sedig et al.
Table 2 Micro-level interactivity considerations
Component Element Concern FormsAction Presence Existence and advertisement of
actionExplicit, implicit
Agency Metaphoric agency through whichaction is expression
Verbal, manual, pedal,aerial
Granularity Constituent steps of action Atomic, compositeFocus Focal point of action Direct, indirectFlow Parsing of action in time Discrete, continuousTiming Time available for user to compose
and/or commit actionUser-paced,
system-pacedReaction Activation Point at which reaction begins Immediate, delayed,
on-demandFlow Parsing of reaction in time Discrete, continuousTransition Presentation of change Stacked, distributedSpread Spread of effect that action causes Self-contained,
propagatedState Condition of VRs as interface
reaches equilibriumCreated, altered, deleted
Context Context in which VRs exist asinterface reaches equilibrium
Changed, unchanged
The study showed that operationalizing these different forms simultaneously indifferent VRs had a significant effect on the cognitive processes of the users.Moreover, different operational forms can be combined in a single interaction.In another tool, Super Tangrams [58], an action that has composite granularitycan exhibit both continuous and discrete flow as the steps are put together toperform the action. These combinations and their effects on the strength of couplingbetween users and VTs requires further explication in future research. Whenthese elements and their forms are brought together and used in the design andevaluation of VTs that support cognitive activities many combinations are possible.For instance, an interaction may be operationalized with direct focus of action,discrete flow of action, and continuous flow of reaction. The same interaction maybe operationalized with indirect focus of action and the same forms of action andreaction flow. Alternatively, the focus of action may be direct, the flow of actiondiscrete, and the flow of reaction also discrete. Section 4.2 gives a design scenarioto facilitate thinking about the combination of different operational forms of thestructural elements that are listed in Table 2.
4.2 EDIFICE–IVT: Design Scenario for Micro-levelInteractivity
The following scenario illustrates the potential for micro-level interactivityconsiderations to inform the design of visualization tools. An awareness of thedifferent interaction elements and some of their possible forms enables designers

Human-Centered Interactivity of Visualization Tools 733
Fig. 4 A user filtering a VR
to operationalize them in a deliberate manner. Consider the design of a map-basedvisualization tool that supports analysis and sense making of sales data for differentcities in a region. At some point the user will need to drill into the map VR tobring to the surface information about sales data for particular cities. Figure 4, forexample, depicts an interface after the user has drilled into a city, causing two VRsto appear: a three-dimensional bar graph and a table. The rest of the scenario willdescribe how further interactions with such a VT may be operationalized usingdifferent forms. Figures 4–7 depict different ways of operationalizing the sameinteraction: filtering out all of the sales data except for a particular time period.
Figure 4 depicts the user filtering the VR to show sales data during the periodof 2005–2008 only. The operational forms of the action component are: implicitpresence—the user performs an unadvertised action and must know the properinput command; verbal agency—the user types a linguistic command to the VR;composite granularity—there are two constituent steps of the filtering interaction:typing the command and then pressing ‘enter’; indirect focus—the VR of interest isthe bar graph and the focal point of action is the command line; continuous flow—the action takes place over a period of time while the user is typing; and, user-pacedtiming—the user has no time limit on committing the action. The operational formsof the reaction component are: immediate activation—once the user commits theaction the reaction begins without any delay; continuous flow—the reaction occursfluidly (shown as transparent sections of the bars); stacked transition—change is

734 K. Sedig et al.
Table 3 Operational forms of action elements in Figs. 4 –7
Figure Presence Agency Granularity Focus Flow Timing4 Implicit Verbal Composite Indirect Continuous User-paced5 Explicit Manual Composite Indirect Continuous User-paced6 Explicit Manual Atomic Direct Continuous User-paced7 Explicit Manual Atomic or composite Indirect Continuous User-paced
Table 4 Operational forms of reaction elements in Figs. 4 –7
Figure Activation Flow Transition Spread State Context4 Immediate Continuous Stacked Propagated Altered Unchanged5 Immediate Continuous Stacked Propagated Altered Unchanged6 Immediate Continuous Stacked Propagated Altered Unchanged7 Immediate Discrete Distributed Propagated Altered Unchanged
presented by stacking frames on top of one another and not by distributing themspatially; spread is propagated—the table is also affected by the action; alteredstate—no VRs are created or deleted but are only altered as the interface reachesequilibrium; and, unchanged context—the context in which the VRs exist stays thesame as the interface reaches equilibrium.
The previous paragraph should give readers an idea of how an individualinteraction can be analyzed according to its structural elements. It should also givethe reader a sense of how the operationalization of these elements can affect theinteractivity of a VT at a micro level. For the sake of brevity, the next few exampleswill not identify the form of every element, but will discuss only a subset. All of theelements and their operational forms are listed, however, in Tables 3 and 4.
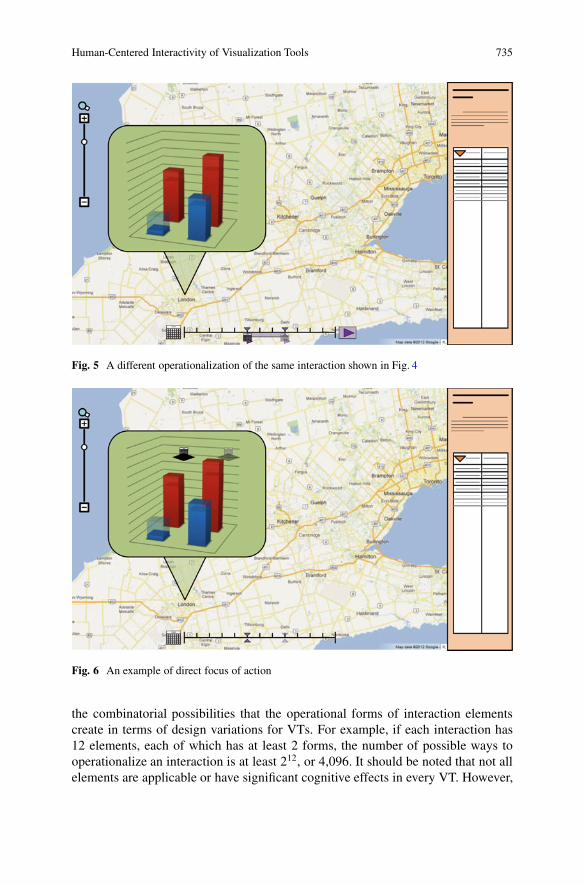
Figure 5 depicts the user performing the same interaction—filtering—but witha different operationalization. In this case, the user chooses the filtering periodby dragging a slider from one spot to another (2005–2008) and then presses a‘go’ button. Unlike the interaction described above and shown in Fig. 4, the actionpresence is explicit and the agency is manual; the granularity, focus, flow, andtiming, however, are all the same. In this case, the operational forms of reactionelements are exactly the same as in Fig. 4. In the case of Fig. 6, the focus of action isdirect—the user acts directly upon the bar graph VR to filter it—and the granularityis atomic. The other elements are operationalized the same as in Fig. 5. The reactionelements are also operationalized in the same manner. In the case of Fig. 7, theaction is the same, but the reaction is operationalized differently. In all previousexamples the transition of reaction was stacked; in this case, however, the transitionis distributed. Multiple visualizations capture and preserve instances of the changingVR and present them spatially—that is, the temporal dimension of the changing VRis distorted and is presented as parallel visualizations distributed in space.
The examples discussed above do not constitute an exhaustive design scenario.This section only briefly explores a small number of design options to demonstratehow EDIFICE–IVT can facilitate analysis and design of micro-level interactivityin visualization tools. Using such a framework, designers can methodically analyze
Human-Centered Interactivity of Visualization Tools 735
Fig. 5 A different operationalization of the same interaction shown in Fig. 4
Fig. 6 An example of direct focus of action
the combinatorial possibilities that the operational forms of interaction elementscreate in terms of design variations for VTs. For example, if each interaction has12 elements, each of which has at least 2 forms, the number of possible ways tooperationalize an interaction is at least 212, or 4,096. It should be noted that not allelements are applicable or have significant cognitive effects in every VT. However,

736 K. Sedig et al.
Fig. 7 An example of distributed transition of change
even if only half the elements have a significant influence on cognitive processesin a particular context, the possible combinations are at least 26, or 64. Without adescriptive, analytical framework, such as the one presented here, it would be verydifficult to consider the many possibilities for design in a systematic manner.
4.3 Macro-level Interactivity
In this section, we analyze macro-level interactivity—interactivity at the levelof multiple interactions being combined and put together to perform tasks andactivities. This analysis deals with the factors that affect the overall quality ofinteraction, as well as the properties and relationships of its aggregated interactionsand how interactivity emerges from these. As discussed in Sect. 3, activities canbe viewed at multiple levels of granularity, with phenomena at lower levels beingembedded within those at higher levels. For instance, the activity of making senseof a complex 3D geometric structure may include a task, such as identifyingdifferent objects and sub-structures. This task may in turn have several interactionsembedded in it, such as filtering, scoping, and annotating [63]. Therefore, macro-level interactivity emerges from the whole interface of a VT—that is, the propertiesof all its interactions and the relationships of these interactions with each other.In what follows, we will characterize and discuss five of the factors that we believeaffect the quality of interaction at a macro level. These five factors are: diversity,complementarity, fitness, flexibility, and genre.

Human-Centered Interactivity of Visualization Tools 737
Diversity. This factor is concerned with the number and diversity of interactionsthat are available to the user. A multiplicity of interactions allows the user toperform different types of cognitive tasks. Some studies show that providing adiverse set of interactions in a VT can have a positive effect on reasoning and othercognitive activities [40, 65]. Such diversity can encourage more autonomous andself-regulated cognitive processes. However, van Wijk [70] points out that althoughinteraction is generally good it should be used carefully, as there are costs associatedwith the number of interactions. Both too few as well as too many interactionscan be costly. In an empirical study involving mathematical visualizations, Liangand Sedig [40] demonstrate that lack of interactions can make exploration of thevisualizations ineffective and inefficient. The same study also shows that havingmany interactions may result in some costs due to high time consumption andcognitive demand. When there are too many interactions, the user may need to spendtime trying out all available interactions, figuring out their functions and benefits,and remembering how and when to use them. As such, even though some degree ofdiversity can generally result in positive benefits, it should be balanced.
Complementarity. This factor is concerned with harmonious and reciprocal rela-tionships among interactions, and how well they work with and supplement eachother. This factor affects the quality of interaction of a tool by allowing the user toconduct more coordinated and integrated cognitive activities. That is, although eachindividual interaction independently supports one particular action, collectively theinteractions can work together and assist the user to perform more complicatedtasks and activities. For instance, in a study [40] of an interactive VT for exploringand reasoning about 3D lattices, it was observed that two interactions, filteringand annotating, were used to complement each other in performing certain tasks.Annotating was used to reason about paths by providing mechanisms for labelingand tracing nodes and edges of lattices, while filtering was used to isolate and focuson certain node types and patterns within 3D lattices.
Fitness. This factor is concerned with the appropriateness of interactions for thegiven VRs, the tasks and the activity, and the user’s needs and characteristics. Thisis a complex and multi-faceted factor, each of its facets may need analysis. Someof these facets include: semantic-fitness, task-fitness, user-fitness, and context-fitness [61]. The first facet, semantic-fitness, deals with whether an interaction canenhance the communicative and semantic utility of a VR. For instance, a VR maybe designed to display a 3D geometric shape to communicate its structure—thatis, its constituent polygonal faces and their relationships. In such a case, providingrotation as an interaction may not be good for better communicating the semanticfeatures of the 3D shape. This is because the 3D shape is symmetric; rotation mayonly allow the user to observe partial structures of the VR, while some parts mayremain occluded from view. This can make it difficult for the user to fully perceivethe structural semantics of the 3D shape. Providing decomposing as an interaction,however, can be more semantically appropriate for communicating the structuralsemantics of this 3D shape, as it allows the user to break the shape apart and display

738 K. Sedig et al.
it as a flat 2D representation, thereby allowing the user to observe and examine itsstructural semantics with more ease—e.g., observing that the shape has 20 faces,and these are all triangles. In a similar manner, the other facets allow an analysisof the fitness of interactions: task-fitness deals with the suitability of interactions tosupport a task that involves given VRs; user-fitness deals with whether interactionsmatch the cognitive needs and characteristics of the user (e.g., a child versus anadult); and context-fitness is about whether interactions support the psychological,cognitive, and structural requirements of an environment (e.g., a visual game versusa visual analytics tool). These facets provide a more organized way of thinkingabout the relevance, conceptual correspondence, cognitive cost, and appropriatenessof interactions—and hence the quality and utility of interactions.
Flexibility. This factor is concerned with the range and availability of adjustabilityoptions. A highly flexible tool provides options for the user to be able to adjustthe properties of the interface to suit his/her needs, characteristics, and goals. Forinstance, a tool that allows the user to adjust the dimensions of VRs, such as theirappearance or density (see [51]), is more flexible than one that does not. Anotherfacet of flexibility is with regard to the order of interactions when performing a taskor activity. Some tools can have a very rigid sequencing and path of interactions.However, the final goal of many complex activities can be reached via differenttrajectories through the representation space of a tool. This is called the principleof equifinality. The interactive features of a flexible tool support this principle. Yetanother facet of flexibility is the degree of control that the user has over the micro-level forms of some of the elements of interaction, such as agency, flow, activation,and transition. The flexibility factor can play an important role in the overall qualityof interaction.
Genre. This factor is concerned with the types of transactions that are availableto the user—that is, interactions through which the user makes exchanges with theVRs. The types of interactions that are provided can be placed on a continuum:allowing the user to only access VRs to allowing the user to only create VRs.As such, a VT’s interactions can be classified into different genres: access-based,annotation-based, modification-based, construction-based, and combination-based.Using access-based interactions, the user accesses the stored, available, existent VRsalready contained in the tool. Using annotation-based interactions, the user adds fur-ther notations or codes to the existing VRs. Using modification-based interactions,the user alters the properties of existing VRs such as by adding to or removingfrom them. Using construction-based interactions, the user constructs new VRs—VRs that are not necessarily provided in the tool, but rather created, synthesized,and composed from scratch. Finally, using combination-based interactions, the useroperates upon VRs with two or more of the previous types of transactions. Considerthe interactions listed in Table 1. Arranging, drilling, and filtering are all examplesof access-based interactions. With these interactions a user typically does not create,destroy, add to, or modify VRs in any way. Annotating is an example of anannotation-based interaction. The user is not inserting new information in the tools,

Human-Centered Interactivity of Visualization Tools 739
VRst
Rt
At
At+1
At+x
...
...
perc
eptio
n
diversitycomplementarity
fitnessflexibility
genre...
mental processesnta cess
interface
VRst+1
Rt+1 Rt+x-1 Rt+xVRst+x VRst+x+1
Fig. 8 Some macro-level interactivity factors
but rather is adding meta-information—i.e., a layer of information that highlightsand describes—to the existing VRs. Assigning, transforming, and inserting are allexamples of modification-based interactions. With these interactions a user addsproperties to VRs, removes properties from VRs, adjusts the value of the propertiesof VRs, and so on. Composing is an example of a construction-based interaction.Once again, as can be seen, the genre of interactions has an overall effect on themacro-level interactivity of a VT (Fig. 8).
5 Summary
For visualization tools to be human-centered, they must be designed with a well-informed understanding of human cognition. However, visualization research isoften based on traditional models of cognition that do not emphasize its situatednature and the role that interaction with the external world plays in performingcomplex cognitive activities. When users interact with visualization tools, cognitiveprocesses emerge from a coupling that is formed between the internal representa-tions and processes of the user and the external representations and processes thatexist at the tool’s interface. In this chapter, interactivity has been conceptualized asthe strength of the coupling—in other words, the quality of the interaction—betweena user and a visualization tool.
740 K. Sedig et al.
The framework presented here is a component of a larger framework calledEDIFICE (Epistemology and Design of human InFormation Interaction in complexCognitive activitiEs), and has been referred to as EDIFICE–IVT—where IVT standsfor interactivity in visualization tools. EDIFICE–IVT has characterized interactivityat two levels: micro and macro. Twelve structural elements of interaction thataffect micro-level interactivity have been identified and characterized. Some of theoperational forms that these elements can take have also been identified, and ascenario to demonstrate how these may be considered collectively in the design ofVTs has been examined. At the macro level, five factors that affect macro-levelinteractivity and some possible operational forms of each have been examined.The manner in which these elements and factors are operationalized in a VTaffects the quality of interaction and ultimately affects how well cognitive activitiesare performed. Therefore, having an awareness of the elements and factors thatinfluence interactivity, as well as some of their operational forms, can facilitatesystematic thinking about interactivity and deliberate and methodical design prac-tices. In addition, as the discussion of interactivity in the research literature is oftenvague and inaccurate, EDIFICE–IVT can contribute to a common vocabulary thatvisualization researchers and practitioners can use to discuss interactivity.
References
1. Aigner, W.: Understanding the role and value of interaction: First steps. In: S. Miksch,G. Santucci (eds.) International Workshop on Visual Analytics (2011)
2. Albers, M.: Design for effective support of user intentions in information-rich interactions.Journal of Technical Writing and Communication 39(2), 177–194 (2009)
3. Albers, M.: Human-information interactions with complex software. Design, User Experience,and Usability. pp. 245–254 (2011)
4. Alessi, S.M., Trollip, S.R.: Multimedia for Learning: Methods and Development. Allyn andBacon (2001)
5. Amar, R., Eagan, J., Stasko, J.: Low-level components of analytic activity in informa-tion visualization. IEEE Symposium on Information Visualization, 2005. INFOVIS 2005.pp. 111–117 (2004)
6. Arias-Hernandez, R., Green, T., Fisher, B.: From cognitive amplifiers to cognitive prostheses:Understandings of the material basis of cognition in visual analytics. Interdisciplinary ScienceReviews 37(1), 4–18 (2012)
7. Brown, J., Collins, A., Duguid, P.: Situated cognition and the culture of learning. Educationalresearcher 18(1), 32 (1989)
8. Bucy, E.: Interactivity in society: Locating an elusive concept. The Information Society 20(5),373–383 (2004)
9. Clark, A.: Microcognition: Philosophy, Cognitive Science, and Parallel Distributed Processing.Explorations in cognitive science. MIT Press (1991)
10. Clark, A.: Time and mind. The Journal of Philosophy 95(7), 354 (1998)11. Clark, A.: Supersizing the Mind: Embodiment, Action, and Cognitive Extension. Philosophy
of Mind Series. Oxford University Press (2008)12. Clark, A., Chalmers, D.: The extended mind. Analysis 58(1), 7–19 (1998)13. Crystal, A., Ellington, B.: Task analysis and human-computer interaction: Approaches,
techniques, and levels of analysis. In: Tenth Americas Conference on Information Systems,pp. 1–9. New York, New York, USA (2004)

Human-Centered Interactivity of Visualization Tools 741
14. Dourish, P.: Where The Action Is: The Foundations Of Embodied Interaction. Bradford Books.MIT Press (2004)
15. Downes, E.J., McMillan, S.J.: Defining interactivity: A qualitative identification of keydimensions. New Media & Society 2(2), 157–179 (2000)
16. Fabrikant, S.I.: Persistent problem in geographic visualization: Evidence of geovis(ual analyt-ics) utility and usefulness. In: ICA Geovis Commission ICC2011, vol. 44, pp. 2009–2011.Paris, France (2011)
17. Fidel, R.: Human Information Interaction: An Ecological Approach to Information Behavior.MIT Press (2012)
18. Funke, J.: Complex problem solving: A case for complex cognition? Cognitive Processing11(2), 133–42 (2010)
19. Gotz, D., Zhou, M.: Characterizing users visual analytic activity for insight provenance. IEEESymposium on VAST pp. 123–130 (2008)
20. Hang, H., Auty, S.: Children playing branded video games: The impact of interactivity onproduct placement effectiveness. Journal of Consumer Psychology 21(1), 65–72 (2011)
21. Hannon, J., Atkins, P.: All about interactivity. Tech. rep., Victoria, Australia (2002)22. Hegarty, M.: The cognitive science of visual-spatial displays: Implications for design. Topics
in Cognitive Science 3(3), 446–474 (2011)23. Hollan, J., Hutchins, E., Kirsh, D.: Distributed cognition: Toward a new foundation for human-
computer interaction research. ACM Transactions on Computer-Human Interaction (TOCHI)7(2), 174–196 (2000)
24. Hutchins, E.: Cognition in the Wild. Bradford Books. MIT Press (1995)25. Hutchins, E., Klausen, T.: Distributed cognition in an airline cockpit. Cognition and Commu-
nication at Work pp. 15–34 (1996)26. Jensen, J.: Interactivity: Tracking a new concept in media and communication studies.
Nordicom Review 19(1), 185–204 (1998)27. Johnson, C., Moorhead, R., Munzner, T., Pfister, H., Rheingans, P., Yoo, T.: NIH-NSF
Visualization Research Challenges. Tech. rep., Los Alamitos, CA (2006)28. Kaptelinin, V., Nardi, B.: Activity Theory in HCI. Morgan & Claypool Publishers (2012)29. Keim, D., Kohlhammer, J., Ellis, G.: Mastering The Information Age-Solving Problems with
Visual Analytics (2010)30. Keim, D., Mansmann, F., Schneidewind, J., Thomas, J., Ziegler, H.: Visual analytics: Scope
and challenges. In: Visual Data Mining: Theory, Techniques and Tools for Visual Analytics,lncs edn. Springer (2008)
31. Kiousis, S.: Interactivity: a concept explication. New Media & Society 4(3), 355–383 (2002)32. Kirsh, D.: Interactivity and multimedia interfaces. Instructional Science 25(2), 79–96 (1997)33. Kirsh, D.: Metacognition, distributed cognition and visual design. Cognition, Education, and
Communication Technology pp. 1–22 (2005)34. Kirsh, D.: Problem solving and situated cognition. The Cambridge handbook of situated
cognition pp. 264–306 (2009)35. Kirsh, D., Maglio, P.: On distinguishing epistemic from pragmatic action. Cognitive Science:
A Multidisciplinary Journal 18(4), 513–549 (1994)36. Knauff, M., Wolf, A.G.: Complex cognition: The science of human reasoning, problem-
solving, and decision-making. Cognitive Processing 11(2), 99–102 (2010)37. Laine, P., Phil, L.: Explicitness and interactivity. Proceedings of the 1st international
symposium on Information and communication technologies p. 426 (2003)38. Liang, H.N., Parsons, P., Wu, H.C., Sedig, K.: An exploratory study of interactivity in
visualization tools: Flow of interaction. Journal of Interactive Learning Research 21(1),5–45 (2010)
39. Liang, H.N., Sedig, K.: Can interactive visualization tools engage and support pre-universitystudents in exploring non-trivial mathematical concepts? Computers & Education 54(4),972–991 (2010)
40. Liang, H.N., Sedig, K.: Role of interaction in enhancing the epistemic utility of 3D mathe-matical visualizations. International Journal of Computers for Mathematical Learning 15(3),191–224 (2010)

742 K. Sedig et al.
41. Liu, Y., Shrum, L.J.: A dual-process model of interactivity effects. Journal of Advertising38(2), 53–68 (2009)
42. Liu, Z., Nersessian, N., Stasko, J.: Distributed cognition as a theoretical framework forinformation visualization. IEEE transactions on visualization and computer graphics 14(6),1173–80 (2008)
43. Liu, Z., Stasko, J.: Mental models, visual reasoning and interaction in information visualiza-tion: a top-down perspective. IEEE transactions on visualization and computer graphics 16(6),999–1008 (2010)
44. Mann, S.: Conversation as a basis for interactivity. In: Proceedings of the 15th AnnualConference of the National Advisory Committee on Computing Qualifications, pp. 281–288.Hamilton, NZ (2002)
45. Marchionini, G.: Information Concepts: From Books to Cyberspace Identities (2010)46. McClelland, J.L.: Emergence in cognitive science. Topics in Cognitive Science 2(4), 751–770
(2010)47. Mirel, B.: Interaction Design for Complex Problem Solving: Developing Useful and Usable
Software. The Morgan Kaufmann Series in Interactive Technologies. Morgan Kaufmann(2004)
48. Nardi, B.: Studying context: A comparison of activity theory, situated action models, anddistributed cognition. Context and consciousness: Activity theory and human-computerinteraction pp. 69–102 (1996)
49. Parsons, P., Sedig, K.: Common visualizations: Their cognitive utility (this volume)50. Parsons, P., Sedig, K.: Distribution of information processing while performing complex
cognitive activities with visualization tools (this volume)51. Parsons, P., Sedig, K.: Properties of visual representations: Improving the quality of human-
information interaction in complex cognitive activities. Journal of the American Society forInformation Science and Technology (under review)
52. Pike, W.a., Stasko, J., Chang, R., OConnell, T.A.: The science of interaction. InformationVisualization 8(4), 263–274 (2009)
53. Pohl, M., Wiltner, S., Miksch, S., Aigner, W., Rind, A.: Analysing interactivity in informationvisualisation. KI - Kunstliche Intelligenz 26(2), 151–159 (2012)
54. Purchase, H., Andrienko, N., Jankun-Kelly, T., Ward, M.: Theoretical foundations of infor-mation visualization. In: A. Kerren, J.T. Stasko, J.D. Fekete, C. North (eds.) InformationVisualization: Human-Centered Issues and Perspectives, Lecture Notes in Computer Science,vol. 4950, pp. 46–64. Springer Berlin Heidelberg, Berlin, Heidelberg (2008)
55. Scaife, M., Rogers, Y.: External cognition: how do graphical representations work? Interna-tional Journal of Human-Computer Studies 45(2), 185–213 (1996)
56. Scholtz, J.: Beyond usability: Evaluation aspects of visual analytic environments. In: IEEESymposium on Visual Analytics Science and Technology, pp. 145–150 (2006)
57. Sedig, K.: Need for a prescriptive taxonomy of interaction for mathematical cognitive tools.Lecture Notes in Computer Science pp. 1030–1037 (2004)
58. Sedig, K.: From play to thoughtful learning: A design strategy to engage children withmathematical representations. Journal of Computers in Mathematics and Science Teaching27(1), 65–101 (2008)
59. Sedig, K., Klawe, M., Westrom, M.: Role of interface manipulation style and scaffoldingon cognition and concept learning in learnware. ACM Transactions on Computer-HumanInteraction (TOCHI) 8(1), 34–59 (2001)
60. Sedig, K., Liang, H.N.: Interactivity of visual mathematical representations: Factors affectinglearning and cognitive processes. Journal of Interactive Learning Research 17(2), 179 (2006)
61. Sedig, K., Liang, H.N.: On the design of interactive visual representations: Fitness ofinteraction. In: C. Seale, J. Montgomerie (eds.) World Conference on Educational Multimedia,Hypermedia and Telecommunications, pp. 999–1006. AACE (2007)
62. Sedig, K., Liang, H.N.: Learner-information interaction: A macro-level framework character-izing visual cognitive tools. Journal of Interactive Learning Research 19(1), 147–173 (2008)

Human-Centered Interactivity of Visualization Tools 743
63. Sedig, K., Parsons, P.: Interaction design for complex cognitive activities with visualrepresentations: A pattern-based approach. AIS Transactions on Human-Computer Interaction(2013, to appear)
64. Sedig, K., Rowhani, S., Liang, H.N.: Designing interfaces that support formation of cognitivemaps of transitional processes: an empirical study. Interacting with Computers 17(4),419–452 (2005)
65. Sedig, K., Rowhani, S., Morey, J., Liang, H.N.: Application of information visualizationtechniques to the design of a mathematical mindtool: A usability study. InformationVisualization 2(3), 142–159 (2003)
66. Sedig, K., Sumner, M.: Characterizing interaction with visual mathematical representations.International Journal of Computers for Mathematical Learning 11(1), 1–55 (2006)
67. Shneiderman, B.: The eyes have it: A task by data type taxonomy. Tech. rep., University ofMaryland, College Park (1996)
68. Thomas, J., Cook, K.: Illuminating the path: The research and development agenda for visualanalytics. IEEE Press (2005)
69. Ware, C.: Visual Thinking for Design. Morgan Kaufmann Series in Interactive Technologies.Morgan Kaufmann (2008)
70. van Wijk, J.J.: Views on visualization. IEEE transactions on visualization and computergraphics 12(4), 421–32 (2006)
71. Yi, J., Kang, Y., Stasko, J., Jacko, J.: Toward a deeper understanding of the role of interaction ininformation visualization. IEEE Transactions on Visualization and Computer Graphics 13(6),1224–1231 (2007)
72. Yoo, W.S., Lee, Y., Park, J.: The role of interactivity in e-tailing: Creating value and increasingsatisfaction. Journal of Retailing and Consumer Services 17(2), 89–96 (2010)