Embed Size (px)
Citation preview

Human-Computer Interaction
Statistics IIIntroduction to Inferential Statistics
Professor Bilge Mutlu© Human-Computer Interaction | Professor Mutlu | Week 13: Methods: Statistics II: Introduction to Inferential Statistics 1

Today's Agenda» Topic overview: introduction to inferential statistics
» Hands-on activity
© Human-Computer Interaction | Professor Mutlu | Week 13: Methods: Statistics II: Introduction to Inferential Statistics 2
Recap: Why do we need to use statistics?
Statistical methods enable us to analyze quantitative data, specifically (1) to inspect data quality and characteristics and (2) to discover relationships (e.g., causal) among experimental variables or to estimate population characteristics.
1 ↠ Descriptive statistics
2 ↠ Inferential statistics
© Human-Computer Interaction | Professor Mutlu | Week 13: Methods: Statistics II: Introduction to Inferential Statistics 3

Recap: What is the difference between descriptive and inferential statistics?
A descriptive statistic is a summary statistic that quantitatively describes or summarizes features of collected data, while descriptive statistics is the process of using and analyzing those statistics.1
Inferential statistics, or statistical inference (or modeling), is the process making propositions about a population using data drawn from the population through sampling.2
Simply put, using descriptive statistics, we summarize a sample of data; using inferential statistics, we make propositions about the population.
2 Wikipedia: Inferential Statistics
1 Wikipedia: Desciptive Statistics
© Human-Computer Interaction | Professor Mutlu | Week 13: Methods: Statistics II: Introduction to Inferential Statistics 4

Recap: When do we use descriptive and inferential statistics?
Usually, descriptive and inferential statistics are used together.
Descriptive statistics:
» To assess data quality and structure
» To describe population characteristics
» To assess dependence among variables
Inferential statistics:
» To test hypotheses
» To estimate parameters
» To perform clustering or classification
© Human-Computer Interaction | Professor Mutlu | Week 13: Methods: Statistics II: Introduction to Inferential Statistics 5

How do we apply inferential statistics?
Inferential statistics involves families of statistical tests that aim to establish statistically significant differences between distributions.
What is a statistical test?
Definition: A statistical test is a mechanism for assessing whether data provides support for particular hypotheses.
How do we test a hypothesis?
Hypotheses are provisional statements about relationships among concepts. In hypothesis testing, we seek to determine which statement data is consistent with.
© Human-Computer Interaction | Professor Mutlu | Week 13: Methods: Statistics II: Introduction to Inferential Statistics 6
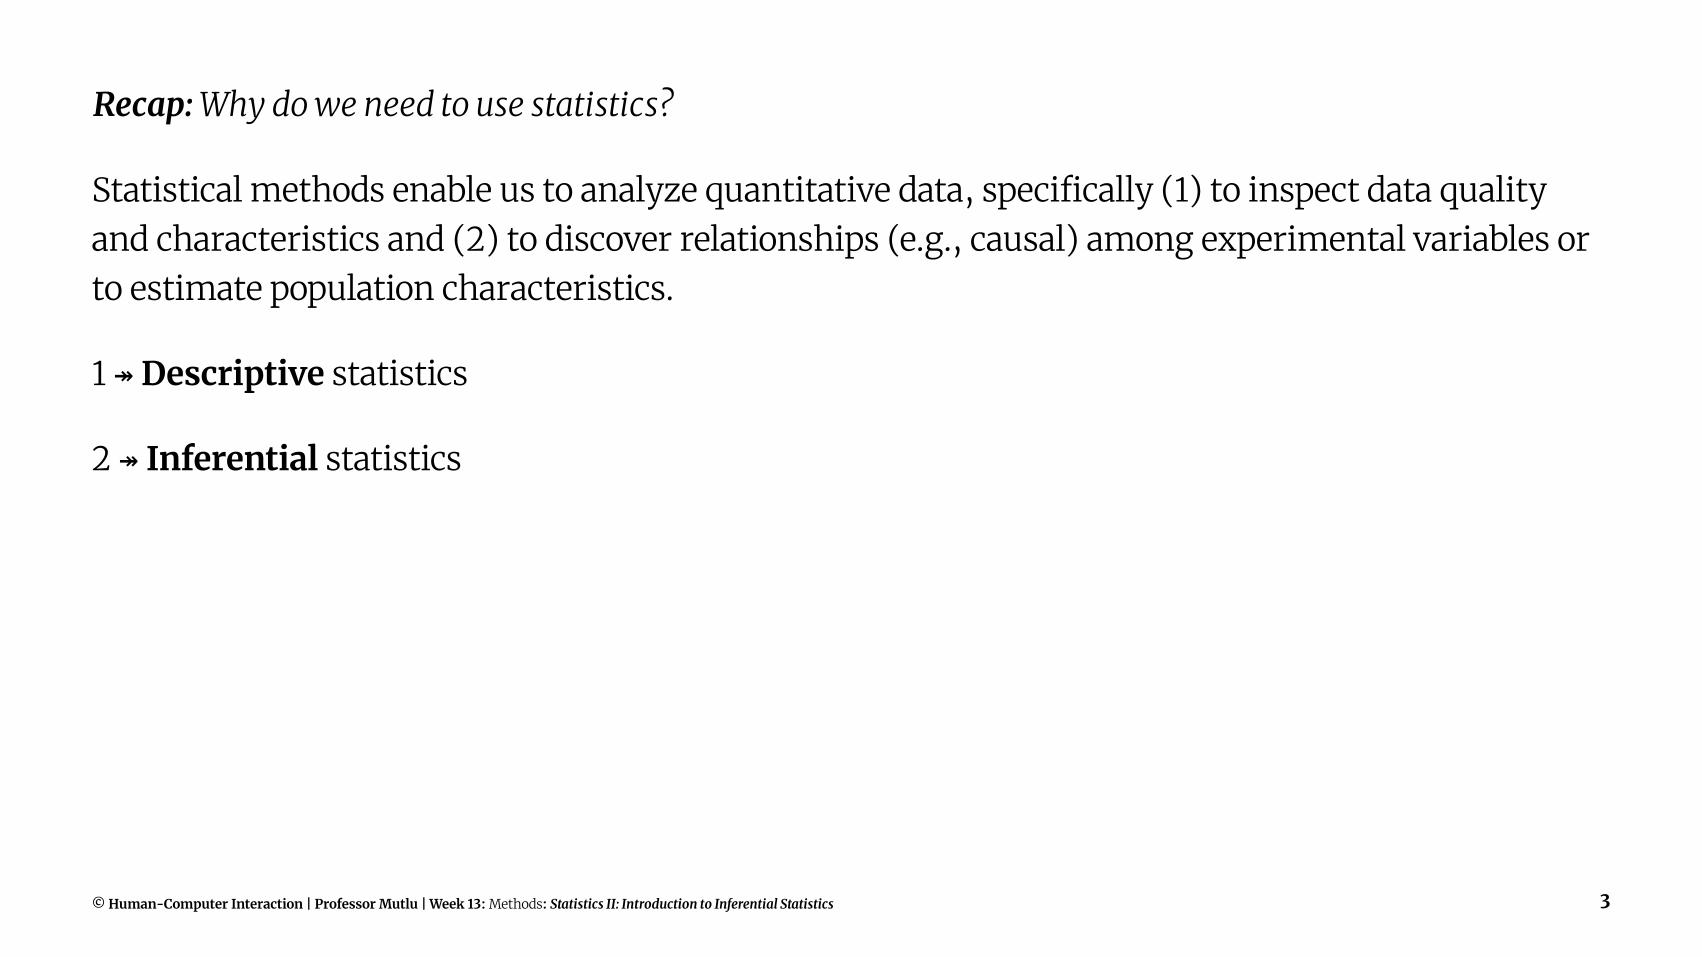
How many hypotheses do we have consider?
Two mutually exclusive hypotheses/statements about a population:
1. Null Hypothesis: Denoted by , it states that a population parameter (e.g., the mean) is equal to a hypothesized value.
2. Alternative Hypothesis (or Research Hypothesis): Denoted by or , it states that the population parameter is smaller, greater, or simply different than the hypothesized value in the null hypothesis.
» One-sided hypothesis: where the population parameter differs in a particular direction, e.g., higher or lower.
» Two-sided hypothesis: where the population parameter simply differs in a nondirectional way.
© Human-Computer Interaction | Professor Mutlu | Week 13: Methods: Statistics II: Introduction to Inferential Statistics 7
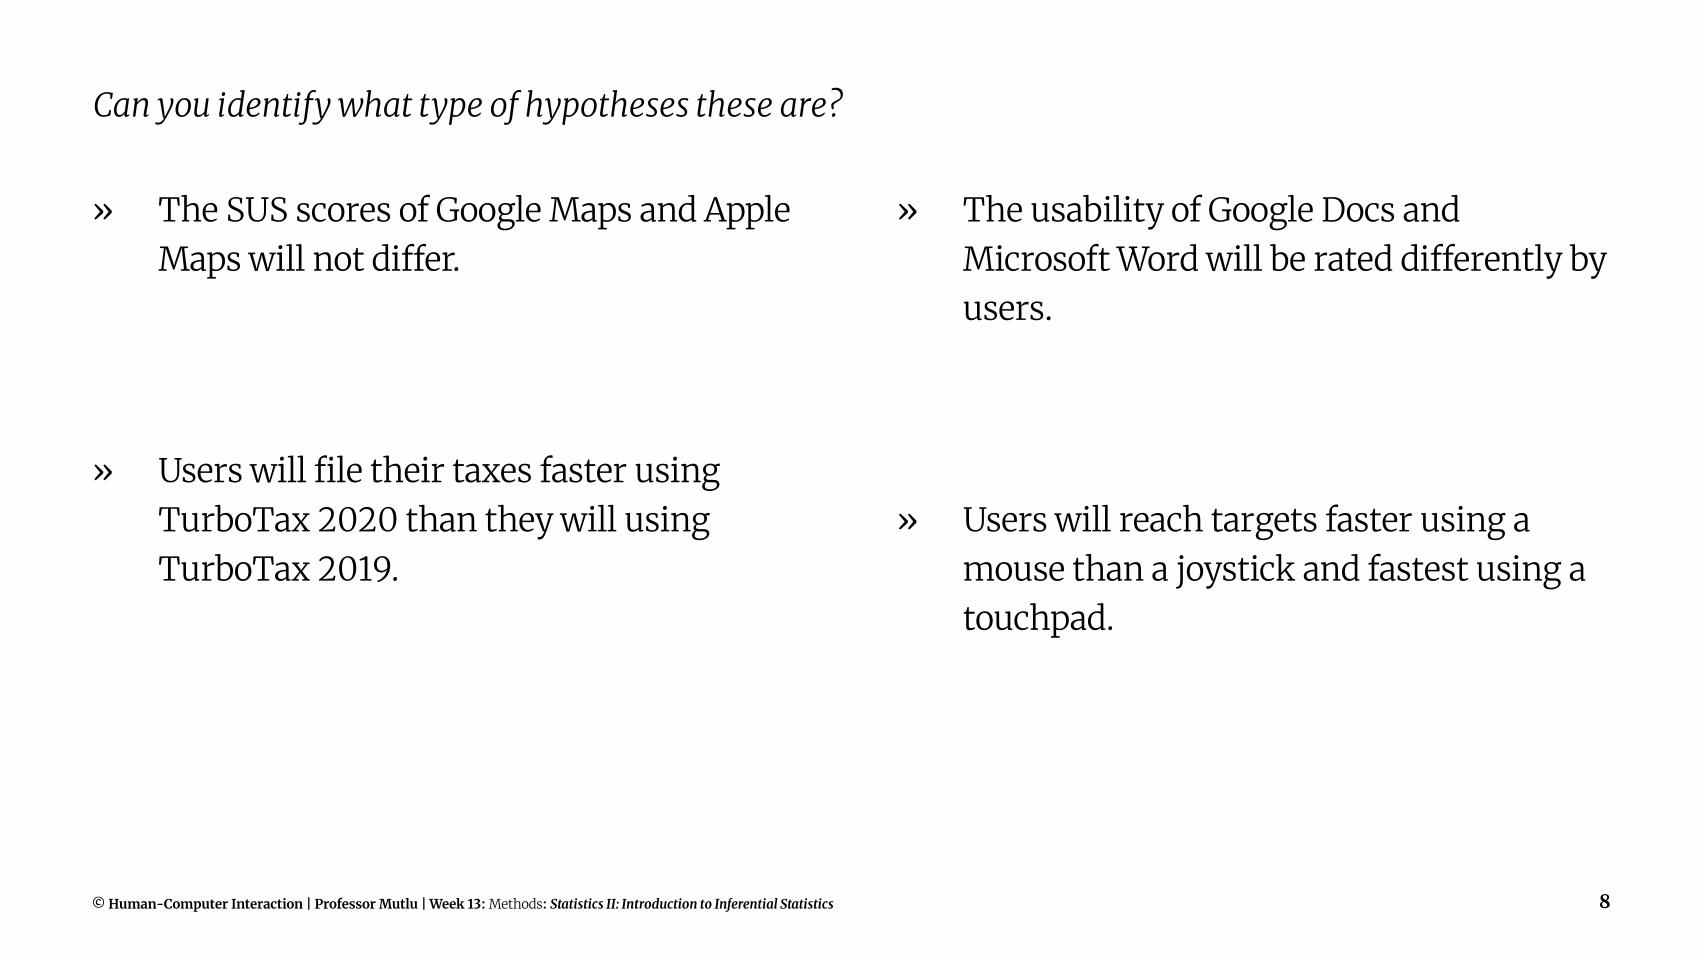
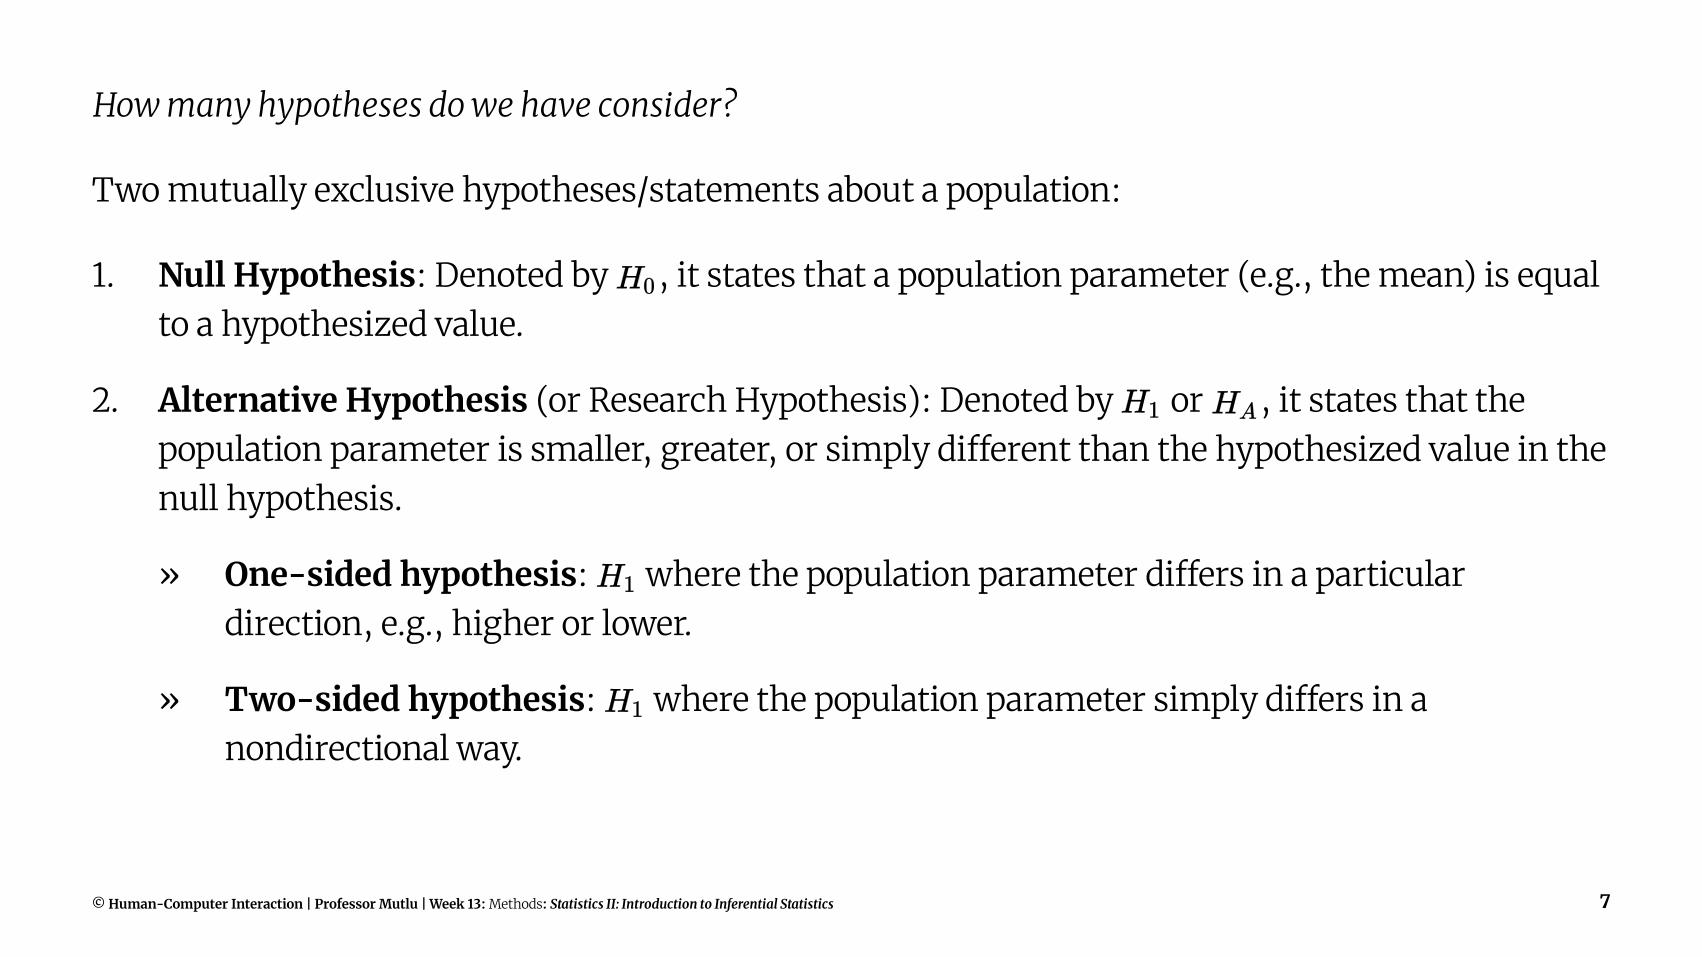
Can you identify what type of hypotheses these are?
» The SUS scores of Google Maps and Apple Maps will not differ.
» Users will file their taxes faster using TurboTax 2020 than they will using TurboTax 2019.
» The usability of Google Docs and Microsoft Word will be rated differently by users.
» Users will reach targets faster using a mouse than a joystick and fastest using a touchpad.
© Human-Computer Interaction | Professor Mutlu | Week 13: Methods: Statistics II: Introduction to Inferential Statistics 8
So how do we determine what test to use?
The appropriate test for a given hypothesis-testing scenario is determined by the data types of the input and output variables.
Recap: Data types include:
» Nominal
» Ordinal
» Interval
» Ratio
The distribution of internal and ratio data can be normal or non-normal.
© Human-Computer Interaction | Professor Mutlu | Week 13: Methods: Statistics II: Introduction to Inferential Statistics 9

Nominal Categorical (2+) Ordinal Quantitative Discrete
Quantitative Non-Normal
Quantitative Normal
Nominal Chi-squared, Fisher's
Chi-squared Chi-squared Trend, Mann-Whitney
Mann-Whitney Mann-Whitney, log-rank *
Student's t
Categorical (2+) Chi-squared Chi-squared Kruskal-Wallis** Kruskal-Wallis** Kruskal-Wallis** ANOVA***
Ordinal Chi-squared Trend, Mann-Whitney
***** Spearman rank Spearman rank Spearman rank Spearman rank, linear regression
Quantitative Discrete
Logistic regression ***** ***** Spearman rank Spearman rank Spearman rank, linear regression
Quantitative Non-Normal
Logistic regression ***** ***** ***** Plot data-Pearson, Spearman rank
Plot data-Pearson, Spearman rank & linear regression
Quantitative Normal
Logistic regression ***** ***** ***** Linearregression****
Pearson, linear regression
© Human-Computer Interaction | Professor Mutlu | Week 13: Methods: Statistics II: Introduction to Inferential Statistics 10

Footnotes
Rows are input variables, columns are output variables.3
If data are censored.
** The Kruskal-Wallis test is used for comparing ordinal or non-Normal variables for more than two groups, and is a generalisation of the Mann-Whitney U test. The technique is beyond the scope of this book, but is described in more advanced books and is available in common software (Epi-Info, Minitab, SPSS).
*** Analysis of variance is a general technique, and one version (one way analysis of variance) is used to compare Normally distributed variables for more than two groups, and is the parametric equivalent of the Kruskal-Wallis test.
3 Hinton, 2014, Statistics explained
© Human-Computer Interaction | Professor Mutlu | Week 13: Methods: Statistics II: Introduction to Inferential Statistics 11

**** If the outcome variable is the dependent variable, then provided the residuals (see ) are plausibly Normal, then the distribution of the independent variable is not important.
***** There are a number of more advanced techniques, such as Poisson regression, for dealing with these situations. However, they require certain assumptions and it is often easier to either dichotomise the outcome variable or treat it as continuous.
© Human-Computer Interaction | Professor Mutlu | Week 13: Methods: Statistics II: Introduction to Inferential Statistics 12

Which methods will we cover in this class?
»
» Student's
» ANOVA
» Regression
© Human-Computer Interaction | Professor Mutlu | Week 13: Methods: Statistics II: Introduction to Inferential Statistics 13
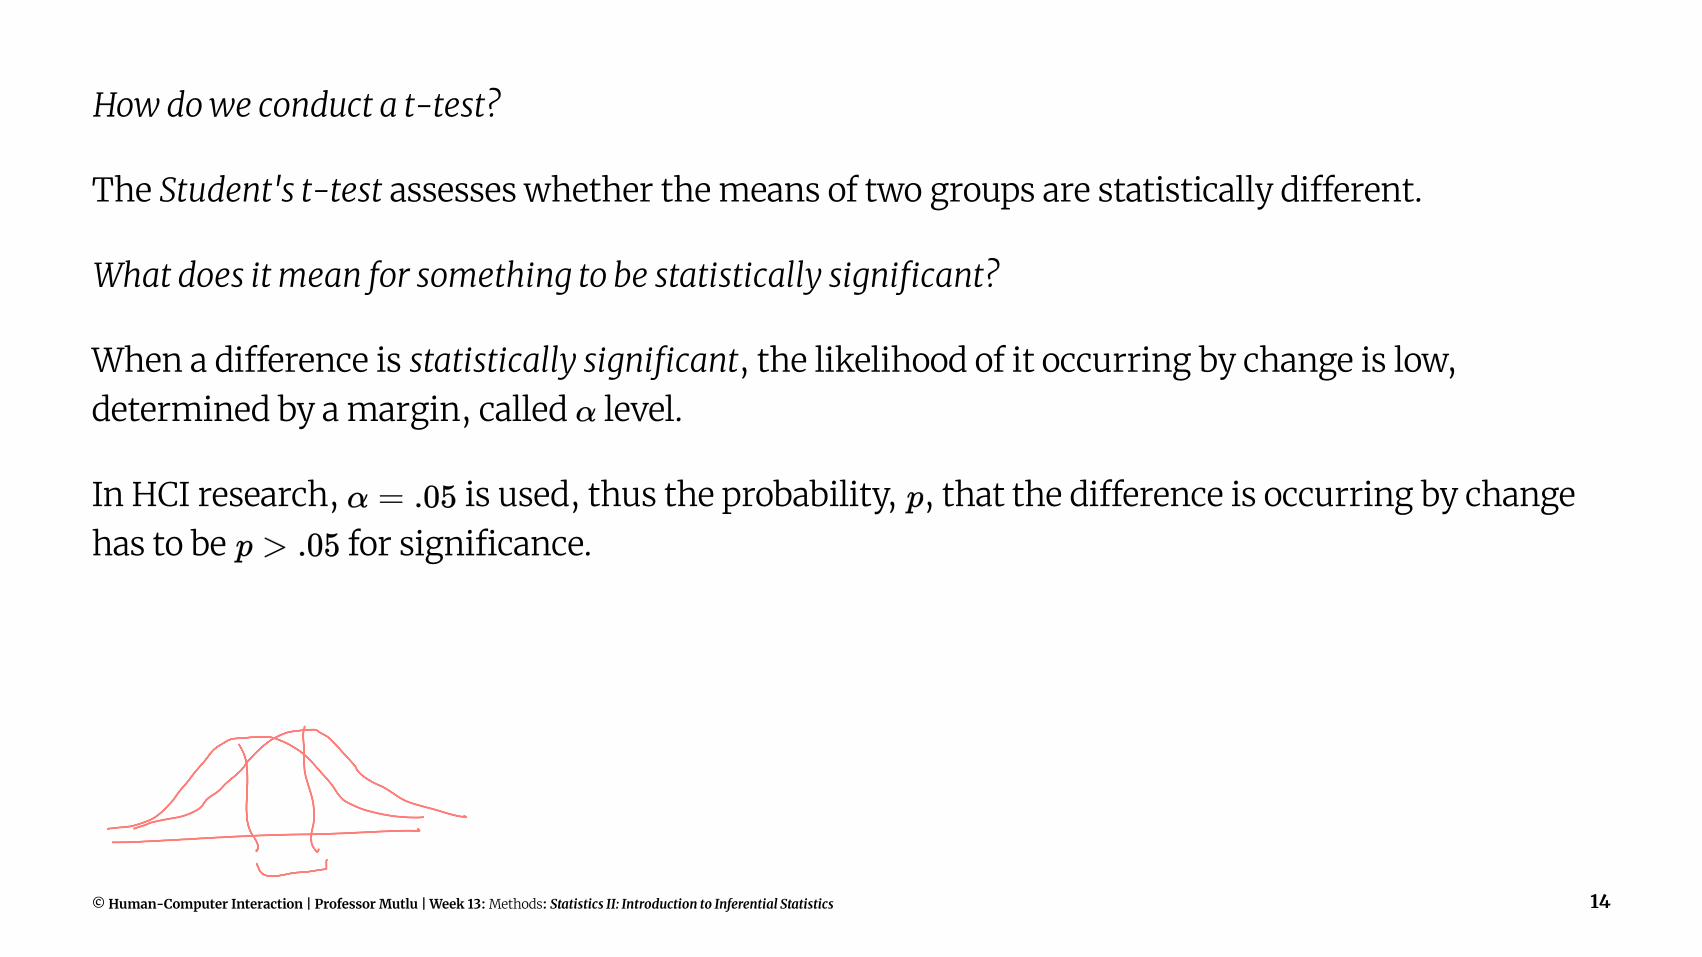
How do we conduct a t-test?
The Student's t-test assesses whether the means of two groups are statistically different.
What does it mean for something to be statistically significant?
When a difference is statistically significant, the likelihood of it occurring by change is low, determined by a margin, called level.
In HCI research, is used, thus the probability, , that the difference is occurring by change has to be for significance.
© Human-Computer Interaction | Professor Mutlu | Week 13: Methods: Statistics II: Introduction to Inferential Statistics 14
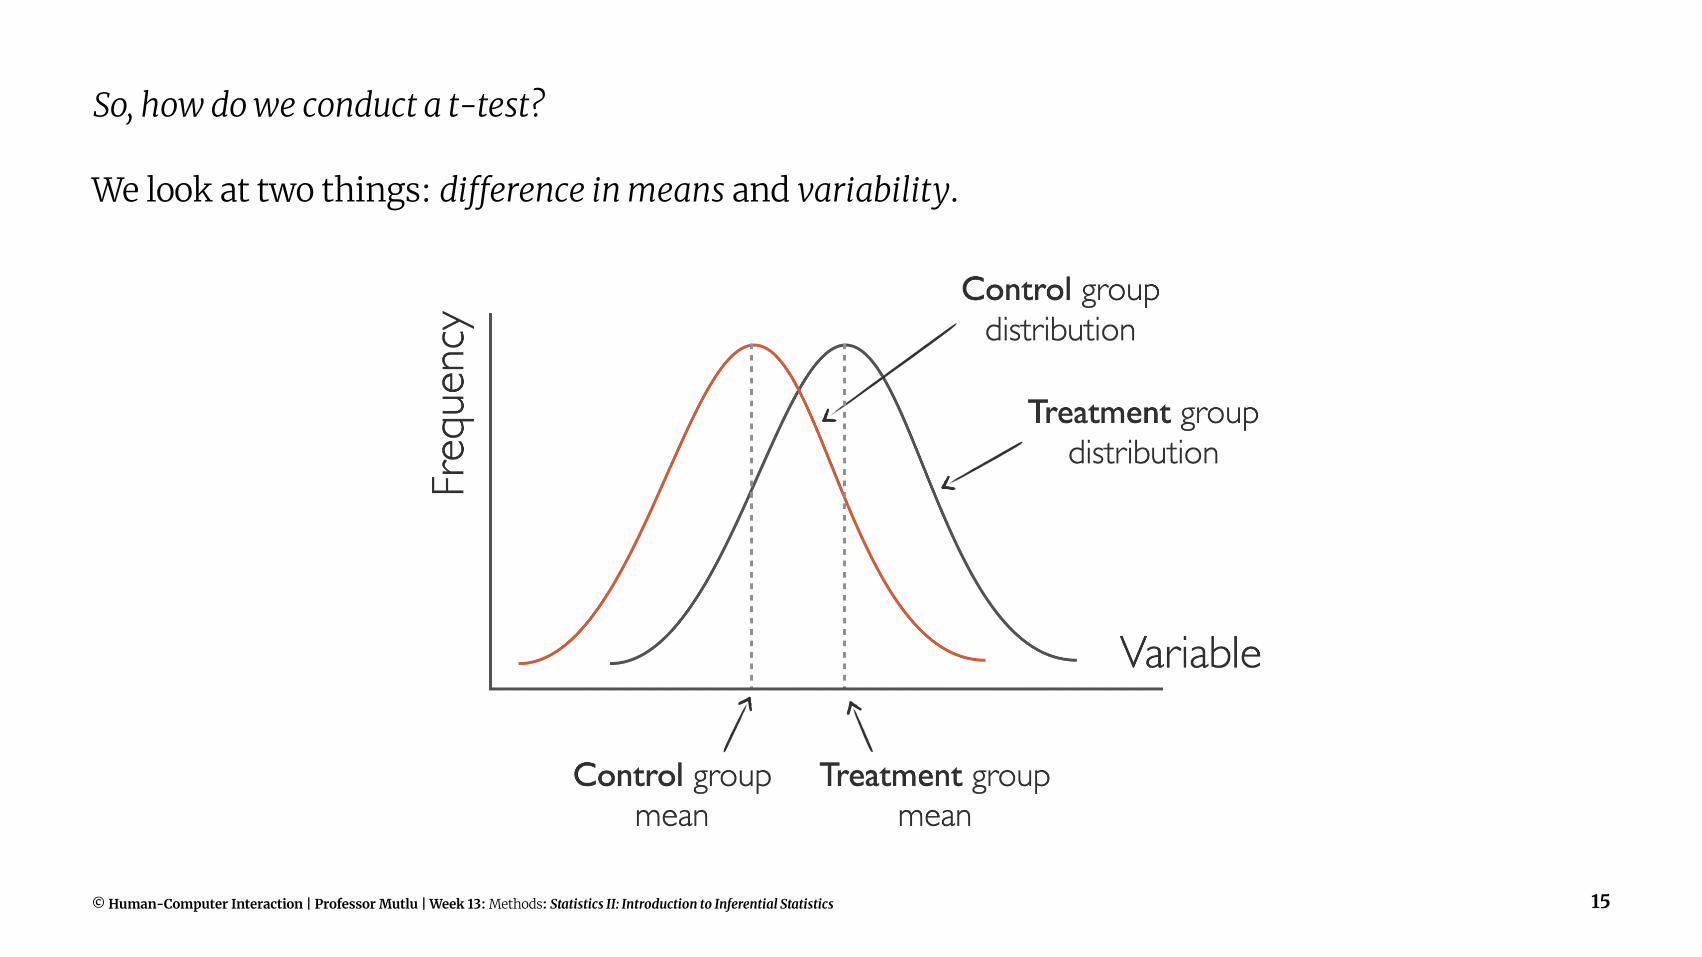
So, how do we conduct a t-test?
We look at two things: difference in means and variability.
© Human-Computer Interaction | Professor Mutlu | Week 13: Methods: Statistics II: Introduction to Inferential Statistics 15
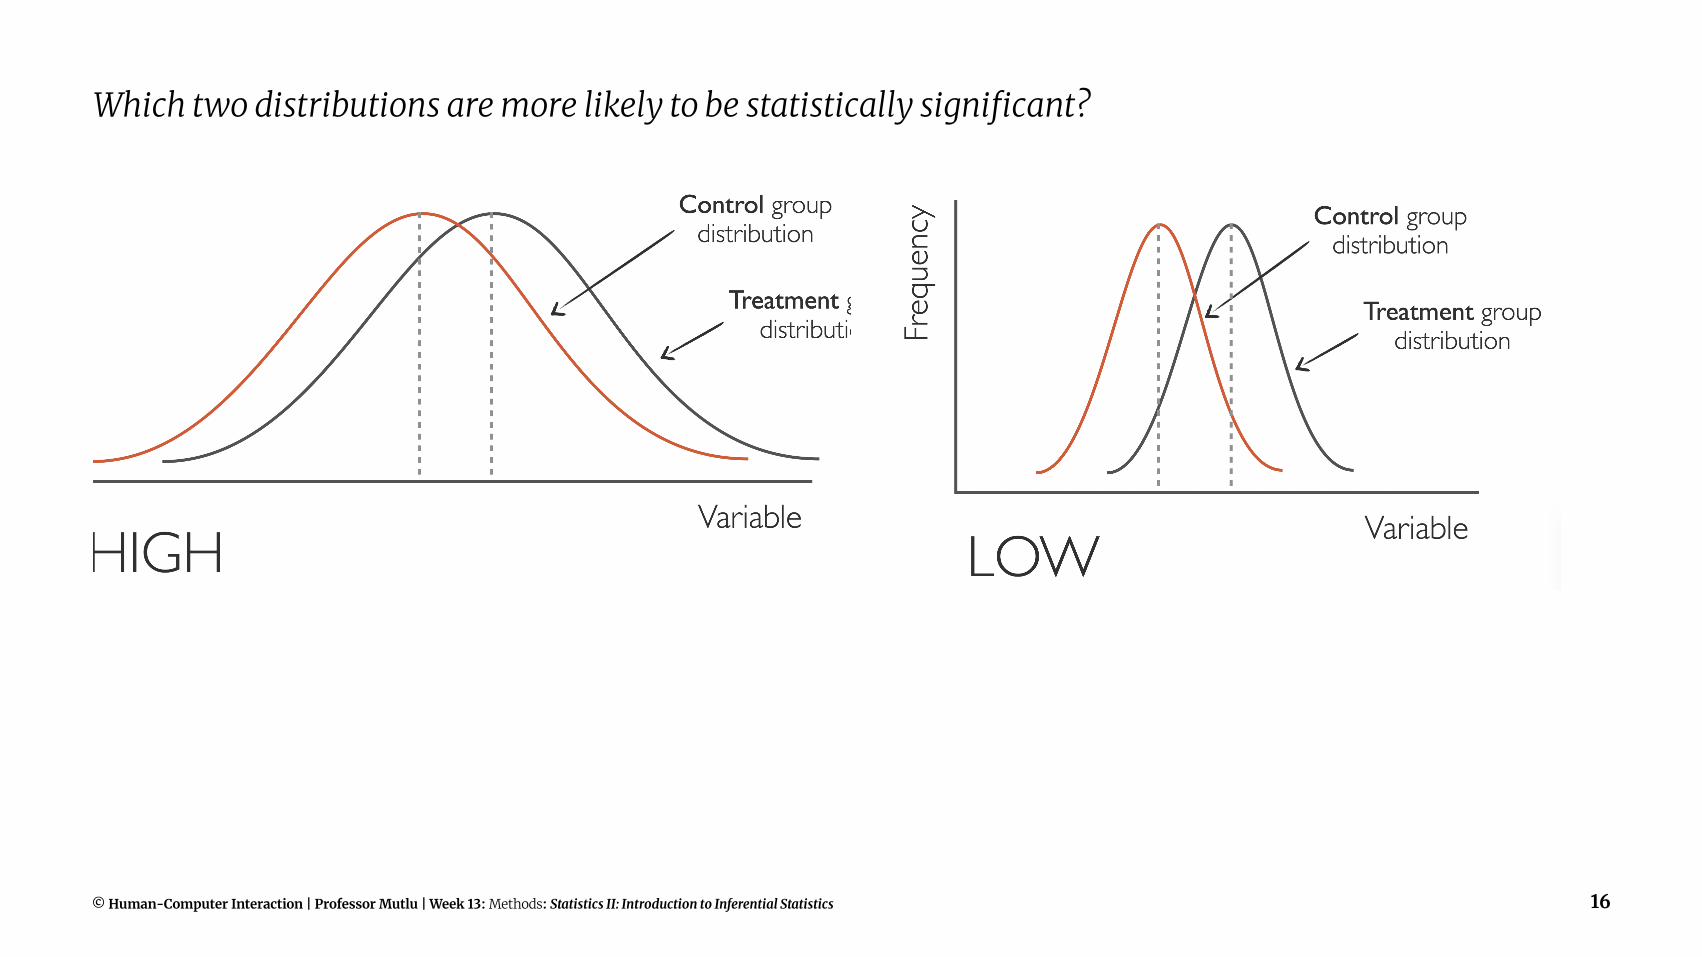
Which two distributions are more likely to be statistically significant?
© Human-Computer Interaction | Professor Mutlu | Week 13: Methods: Statistics II: Introduction to Inferential Statistics 16

We need to calculate the t-statistic:
and are mean and variance of the treatment group, and are mean and variance of the control group.
© Human-Computer Interaction | Professor Mutlu | Week 13: Methods: Statistics II: Introduction to Inferential Statistics 17

The t-test will return the values of: (1) a t-statistic that will indicate signal/noise ratio, and (2) a p-value that indicates significance.
In one- and two-tailed tests, the p-value is interpreted differently.9
9 Image sources: left, right
© Human-Computer Interaction | Professor Mutlu | Week 13: Methods: Statistics II: Introduction to Inferential Statistics 18
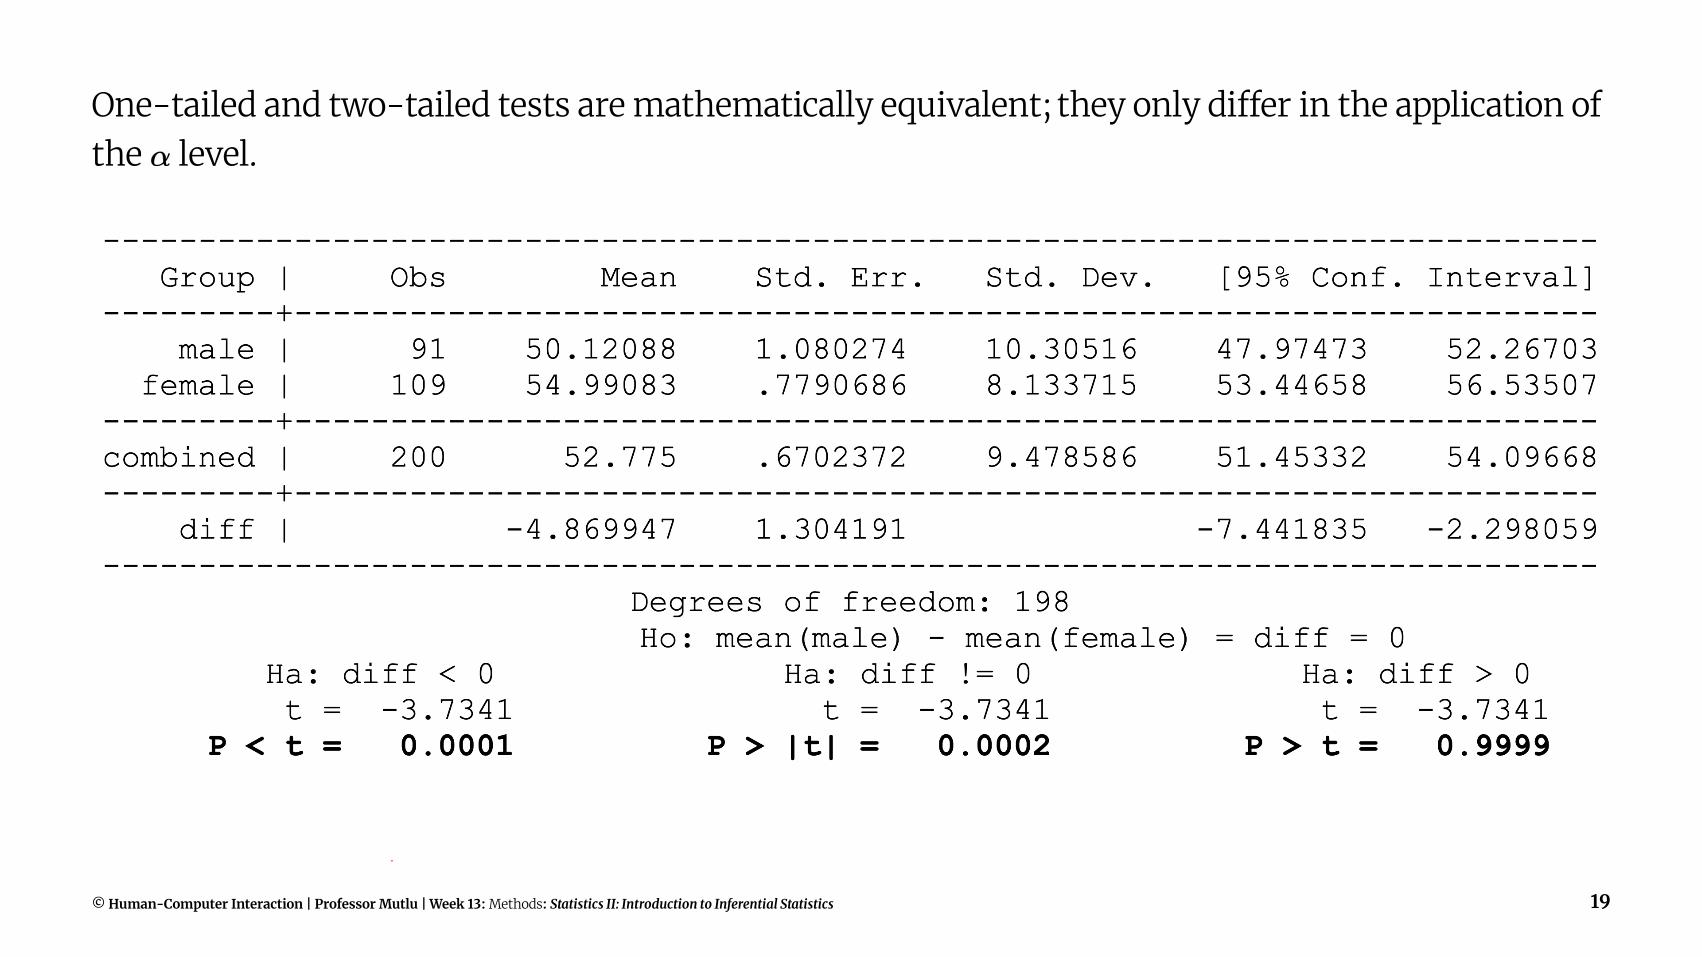
One-tailed and two-tailed tests are mathematically equivalent; they only differ in the application of the level.
© Human-Computer Interaction | Professor Mutlu | Week 13: Methods: Statistics II: Introduction to Inferential Statistics 19

Does experimental design change how we perform the t-test?
Yes! There are two types of t-tests:
1. Unpaired t-test: When the data in the two distributions come from different populations.
2. Paired t-test: When the data in the two distributions come from the same population.
© Human-Computer Interaction | Professor Mutlu | Week 13: Methods: Statistics II: Introduction to Inferential Statistics 20

Unpaired t-test example
One-tailed
» :
» :
Two-tailed
» :
» :
© Human-Computer Interaction | Professor Mutlu | Week 13: Methods: Statistics II: Introduction to Inferential Statistics 21

Unpaired t-test in R
data <- read.csv("t-test.csv")t.test(data$Task.Completion.Time~data$Group)
Welch Two Sample t-test
data: data$Task.Completion.Time by data$Groupt = 2.1688, df = 13.648, p-value = 0.04829alternative hypothesis: true di!erence in means is not equal to 095 percent confidence interval: 0.364964 83.885036sample estimates: mean in group No prediction mean in group With prediction 270.125 228.000
© Human-Computer Interaction | Professor Mutlu | Week 13: Methods: Statistics II: Introduction to Inferential Statistics 22

Unpaired t-test in JMP
Analyze > Fit X by Y
© Human-Computer Interaction | Professor Mutlu | Week 13: Methods: Statistics II: Introduction to Inferential Statistics 23

Paired t-test example
One-tailed
» :
» :
Two-tailed
» :
» :
© Human-Computer Interaction | Professor Mutlu | Week 13: Methods: Statistics II: Introduction to Inferential Statistics 24

Unpaired t-test in R
data <- read.csv("t-test-paired.csv")t.test(data$No.Prediction,data$With.Prediction,paired=TRUE)
Paired t-test
data: data$No.Prediction and data$With.Predictiont = 2.6313, df = 7, p-value = 0.03385alternative hypothesis: true di!erence in means is not equal to 095 percent confidence interval: 4.268751 79.981249sample estimates:mean of the di!erences 42.125
© Human-Computer Interaction | Professor Mutlu | Week 13: Methods: Statistics II: Introduction to Inferential Statistics 25

Unpaired t-test in JMP
Analyze > Specialized Modeling > Matched Pairs
© Human-Computer Interaction | Professor Mutlu | Week 13: Methods: Statistics II: Introduction to Inferential Statistics 26

What about when we have nominal output variables?
Nominal Categorical (2+) Ordinal Quantitative Discrete Quantitative Non-Normal
Quantitative Normal
Nominal Chi-squared, Fisher's Chi-squared Chi-squared Trend, Mann-Whitney
Mann-Whitney Mann-Whitney, log-rank *
Student's t
Categorical (2+) Chi-squared Chi-squared Kruskal-Wallis** Kruskal-Wallis** Kruskal-Wallis** ANOVA***
Ordinal Chi-squared Trend, Mann-Whitney
***** Spearman rank Spearman rank Spearman rank Spearman rank, linear regression
Quantitative Discrete Logistic regression ***** ***** Spearman rank Spearman rank Spearman rank, linear regression
Quantitative Non-Normal
Logistic regression ***** ***** ***** Plot data-Pearson, Spearman rank
Plot data-Pearson, Spearman rank & linear regression
Quantitative Normal Logistic regression ***** ***** ***** Linearregression****
Pearson, linear regression
© Human-Computer Interaction | Professor Mutlu | Week 13: Methods: Statistics II: Introduction to Inferential Statistics 27
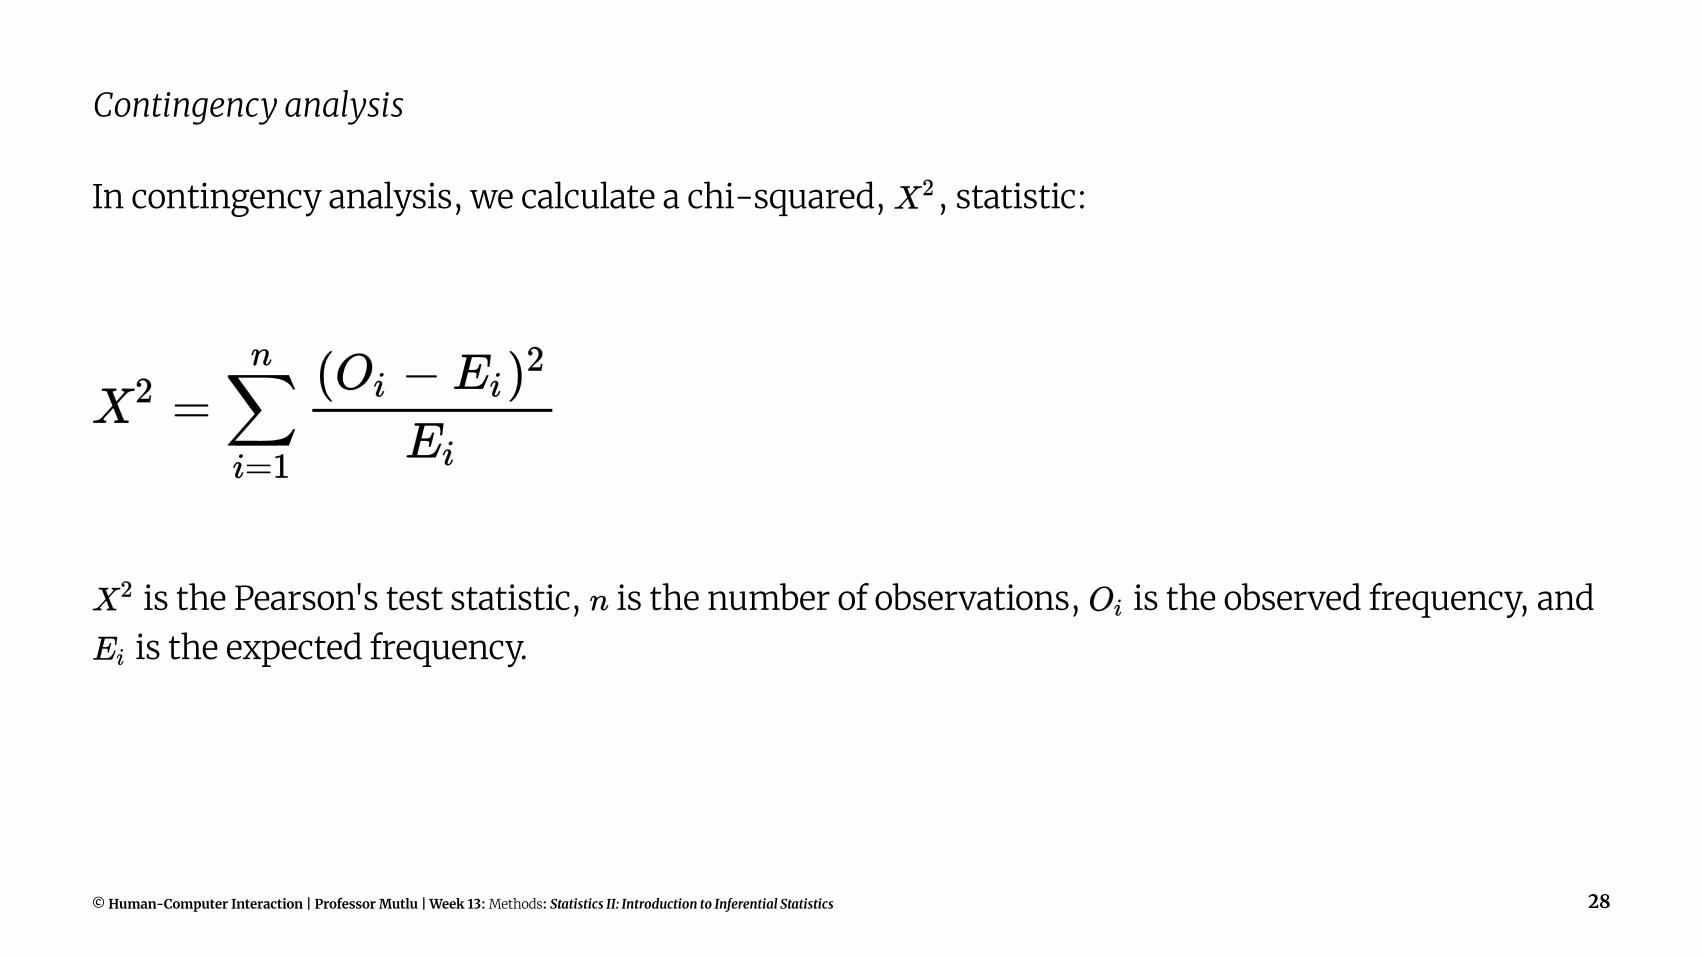
Contingency analysis
In contingency analysis, we calculate a chi-squared, , statistic:
is the Pearson's test statistic, is the number of observations, is the observed frequency, and is the expected frequency.
© Human-Computer Interaction | Professor Mutlu | Week 13: Methods: Statistics II: Introduction to Inferential Statistics 28
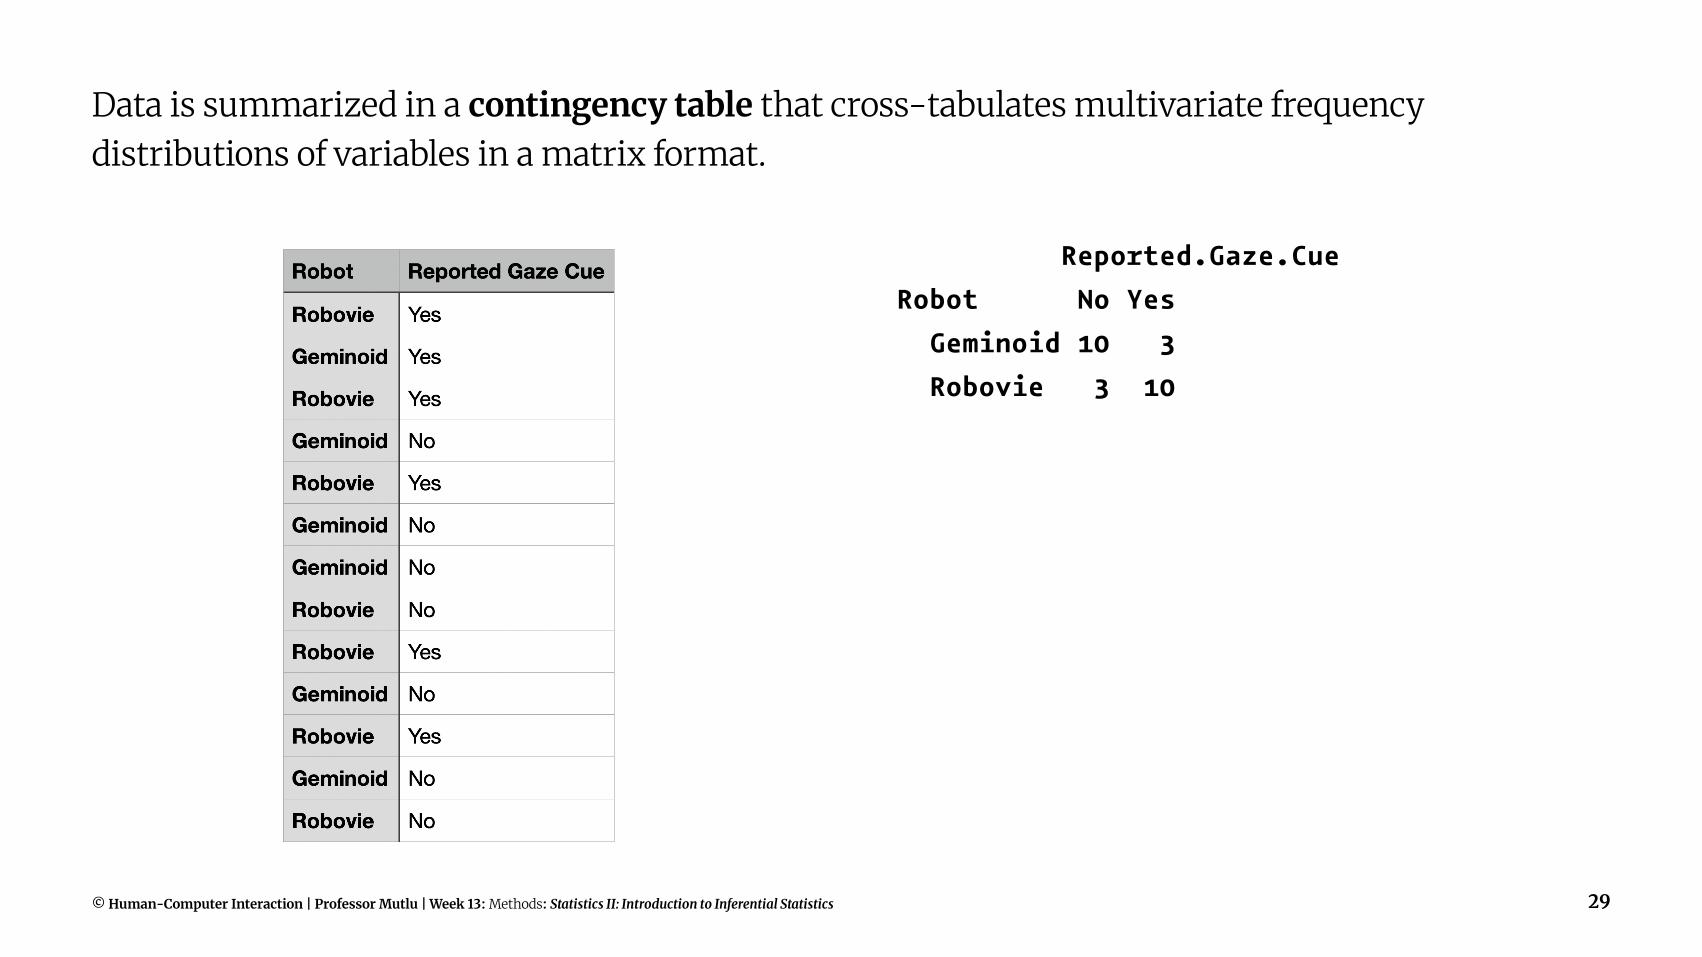
Data is summarized in a contingency table that cross-tabulates multivariate frequency distributions of variables in a matrix format.
Reported.Gaze.CueRobot No Yes Geminoid 10 3 Robovie 3 10
© Human-Computer Interaction | Professor Mutlu | Week 13: Methods: Statistics II: Introduction to Inferential Statistics 29

Chi-squared test in R
gaze <- read.table('robot-gaze.csv', sep=",", header=TRUE)chisq.test(table(gaze))
Pearson's Chi-squared test with Yates' continuity correction
data: table(gaze)X-squared = 5.5385, df = 1, p-value = 0.0186
© Human-Computer Interaction | Professor Mutlu | Week 13: Methods: Statistics II: Introduction to Inferential Statistics 30
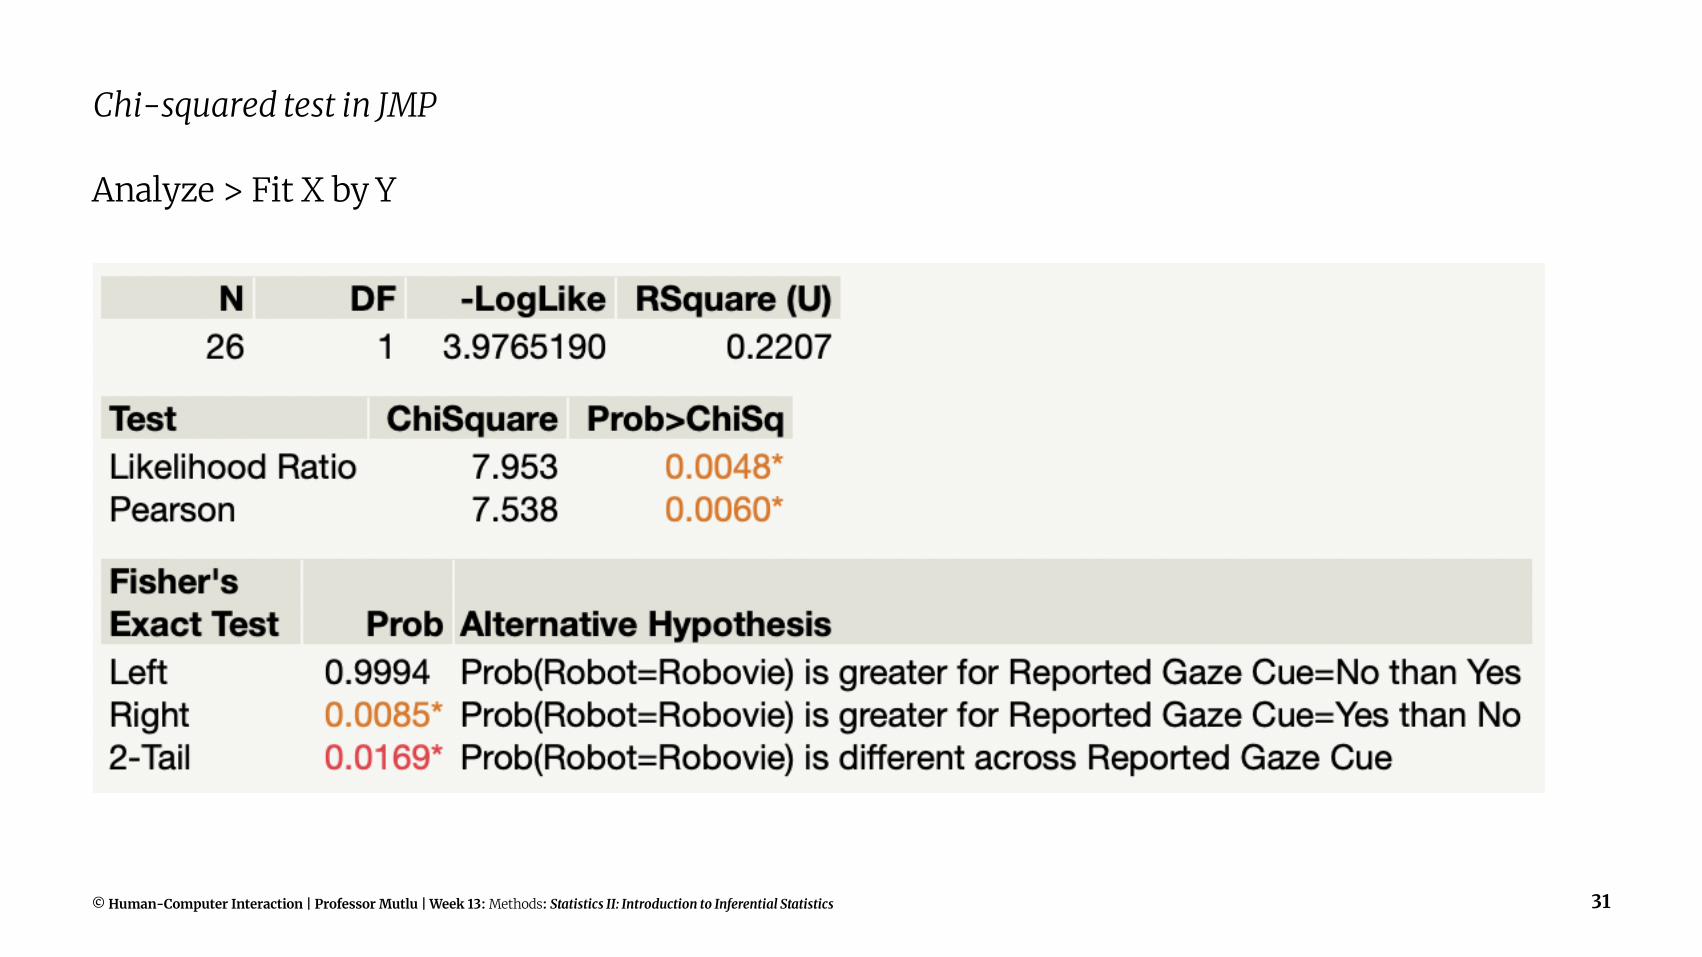
Chi-squared test in JMP
Analyze > Fit X by Y
© Human-Computer Interaction | Professor Mutlu | Week 13: Methods: Statistics II: Introduction to Inferential Statistics 31

Hand-on activity
For your project, identify the input/output variable and appropriate statistical test for independent (unpaired) or dependent (paired) observations.
© Human-Computer Interaction | Professor Mutlu | Week 13: Methods: Statistics II: Introduction to Inferential Statistics 32