Embed Size (px)
Citation preview
Human Genetics, part II
Liisa Kauppi (Keeney lab)
Human populations: origins
Implications of population history for disease mapping
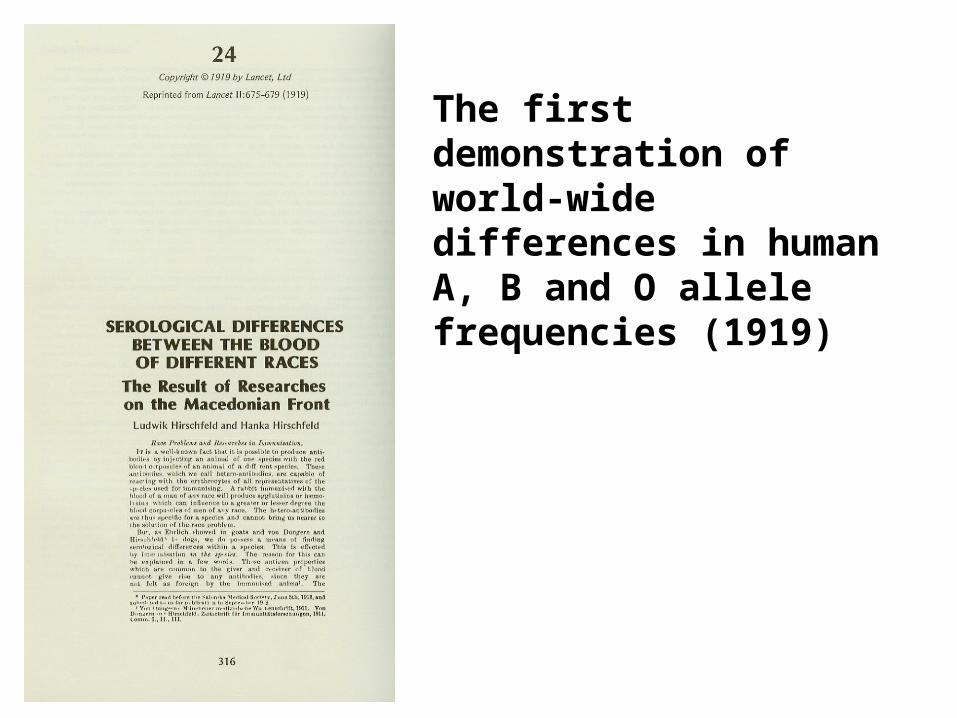
The first demonstration of world-wide differences in human A, B and O allele frequencies (1919)
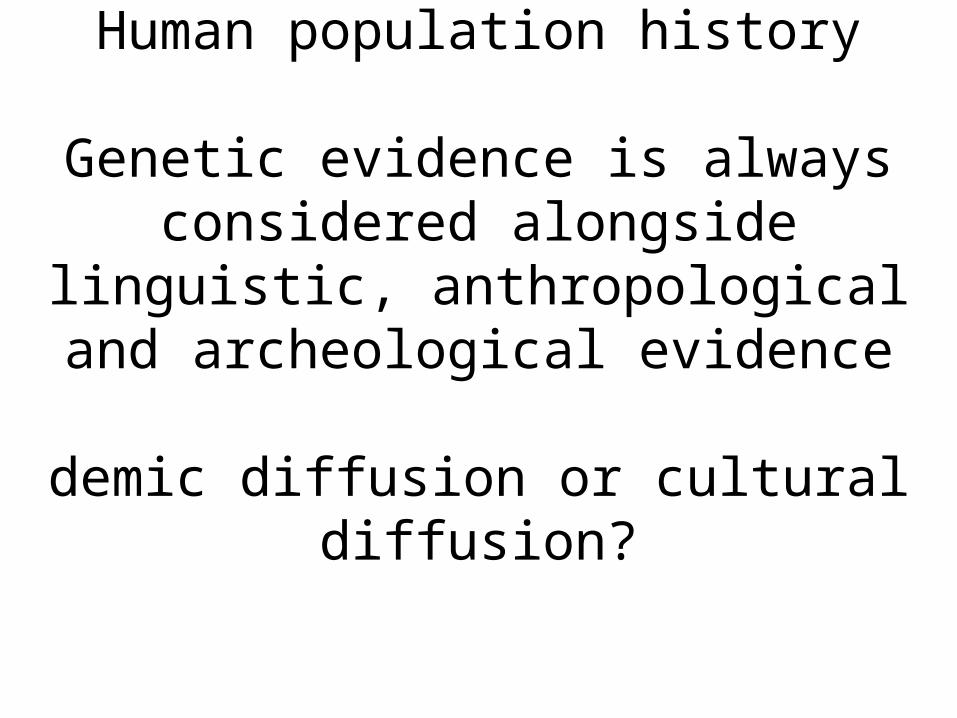
Human population history
Genetic evidence is always considered alongside linguistic,
anthropological and archeological evidence
demic diffusion or cultural diffusion?
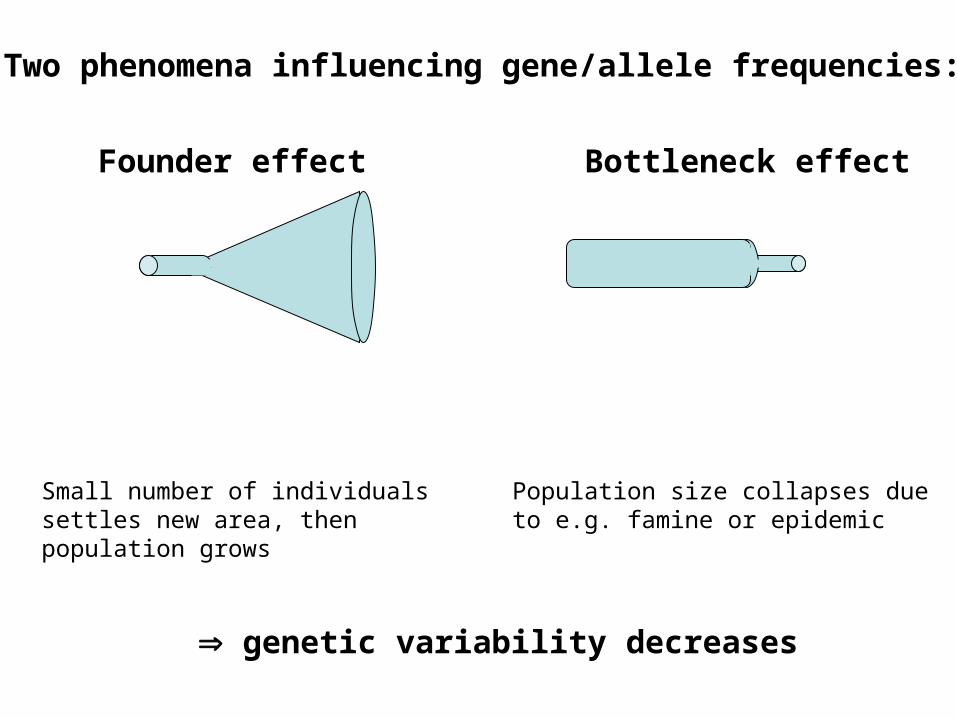
Founder effect
Small number of individuals settles new area, then population grows
Bottleneck effect
Population size collapses due to e.g. famine or epidemic
genetic variability decreases
Two phenomena influencing gene/allele frequencies:
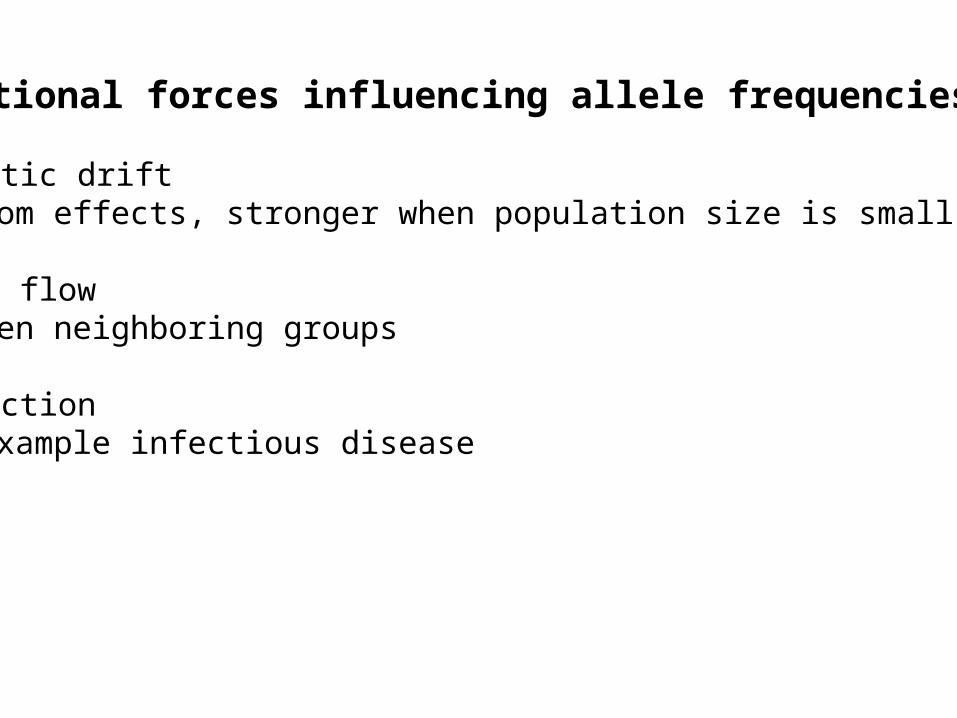
Additional forces influencing allele frequencies: ・ Genetic drift random effects, stronger when population size is small
・ Gene flow between neighboring groups
・ Selection For example infectious disease
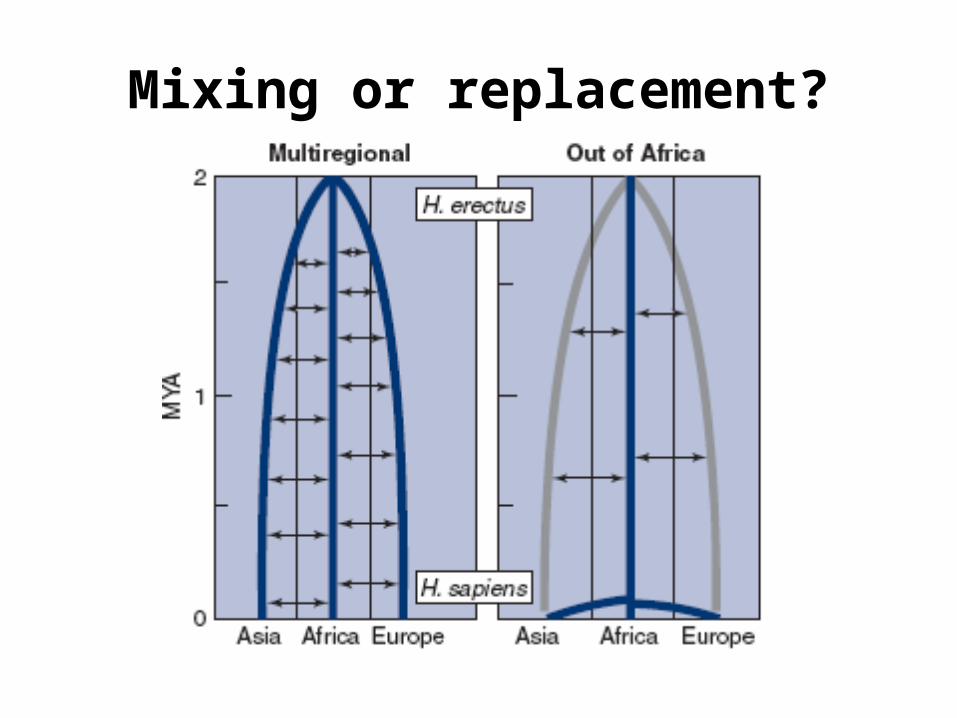
Mixing or replacement?
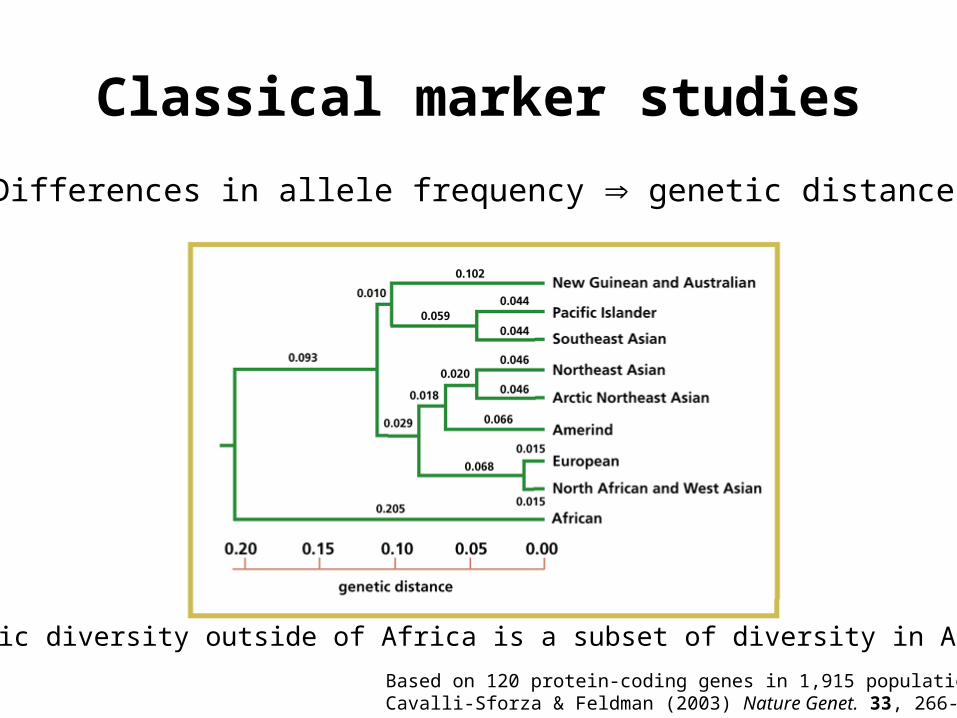
Classical marker studies
Based on 120 protein-coding genes in 1,915 populationsCavalli-Sforza & Feldman (2003) Nature Genet. 33, 266-275
Genetic diversity outside of Africa is a subset of diversity in Africa
Differences in allele frequency genetic distances
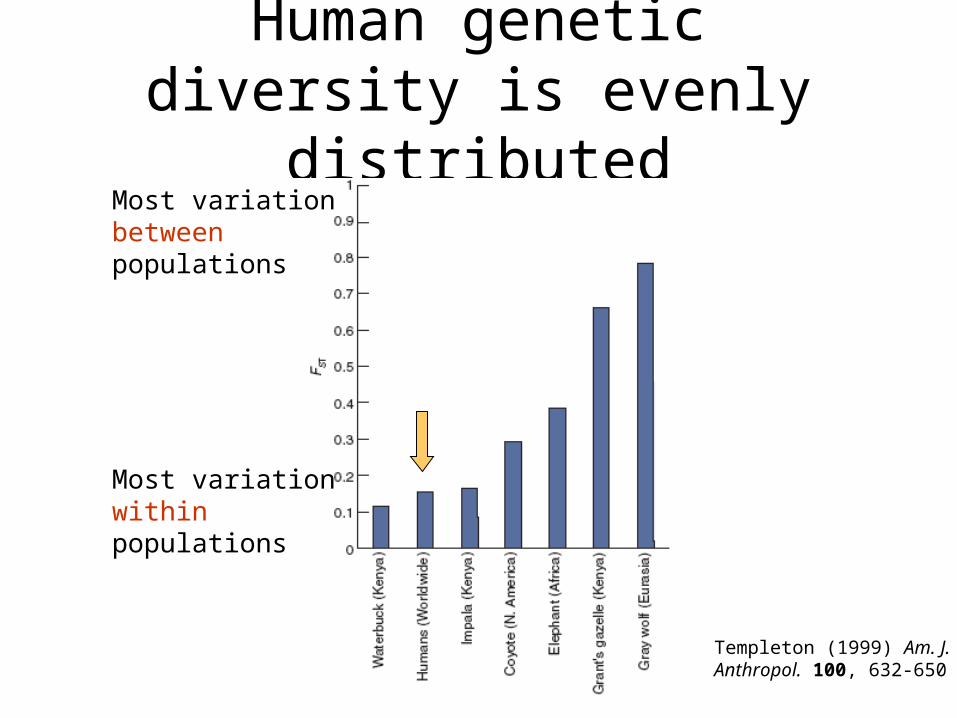
Human genetic diversity is evenly distributed
Most variationbetweenpopulations
Most variationwithinpopulations
Templeton (1999) Am. J.Anthropol. 100, 632-650
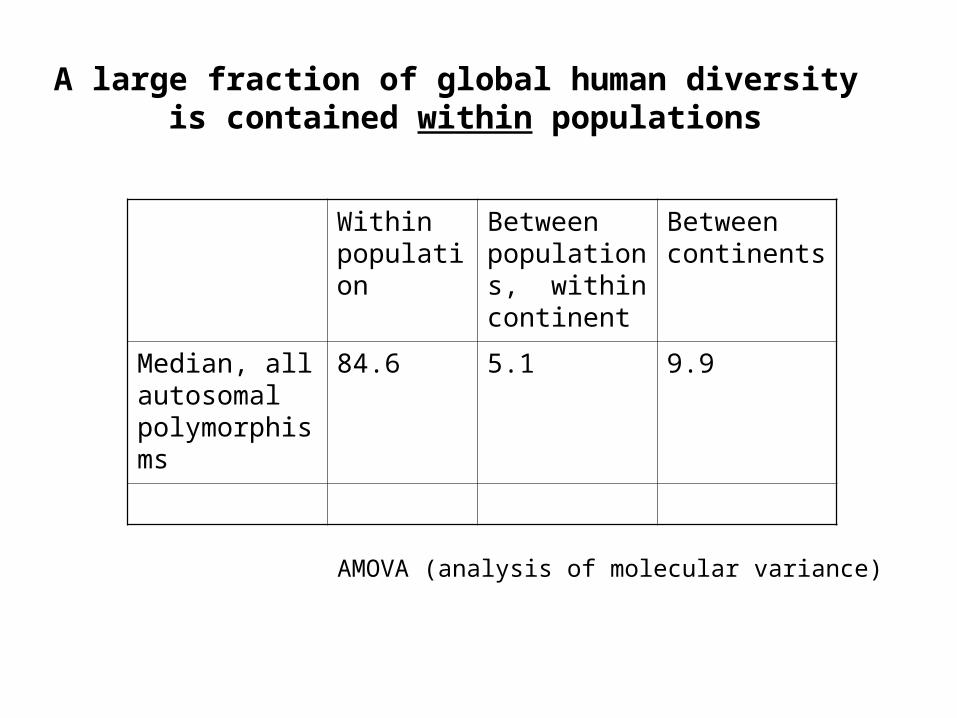
Within population
Between populations, within continent
Between continents
Median, all autosomal polymorphisms
84.6 5.1 9.9
A large fraction of global human diversity is contained within populations
AMOVA (analysis of molecular variance)
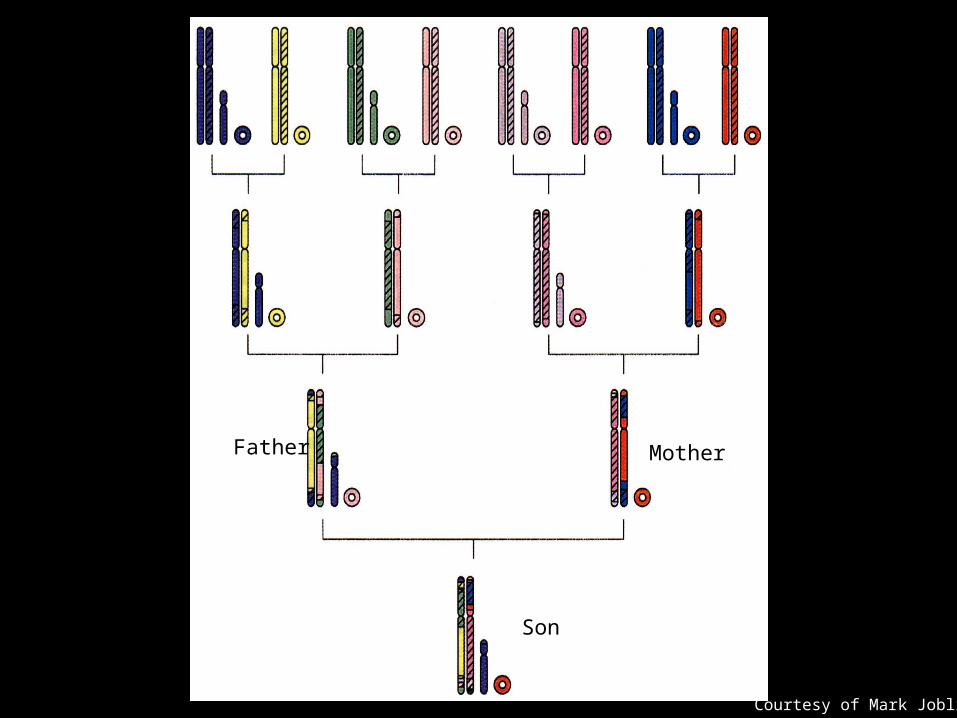
Father Mother
Son
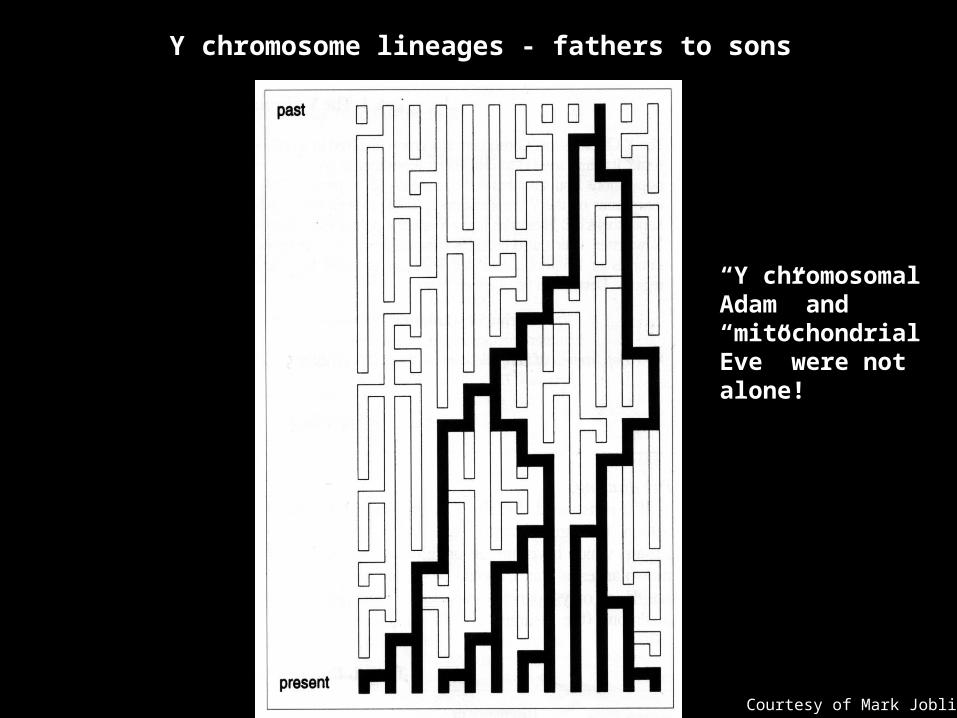
Courtesy of Mark Jobling
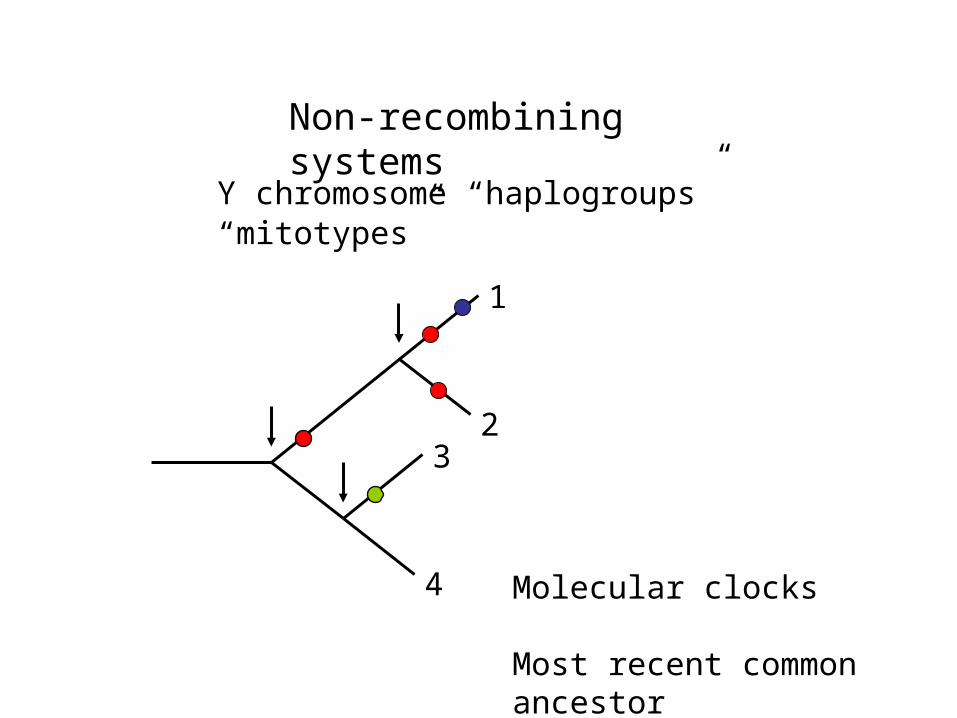
Non-recombining systems
Y chromosome “haplogroups”
1
23
4
“mitotypes”
Molecular clocks
Most recent common ancestor
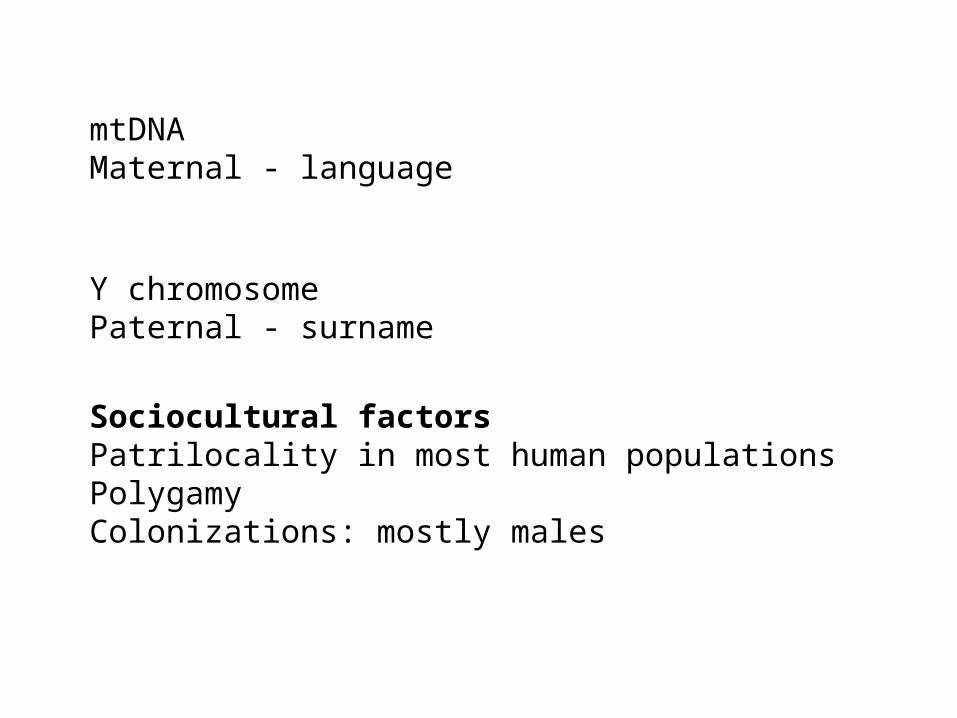
mtDNAMaternal - language
Y chromosomePaternal - surname
Sociocultural factorsPatrilocality in most human populationsPolygamyColonizations: mostly males
Courtesy of Mark Jobling
Y chromosome lineages - fathers to sons
“Y chromosomal Adam” and “mitochondrial Eve” were not alone!
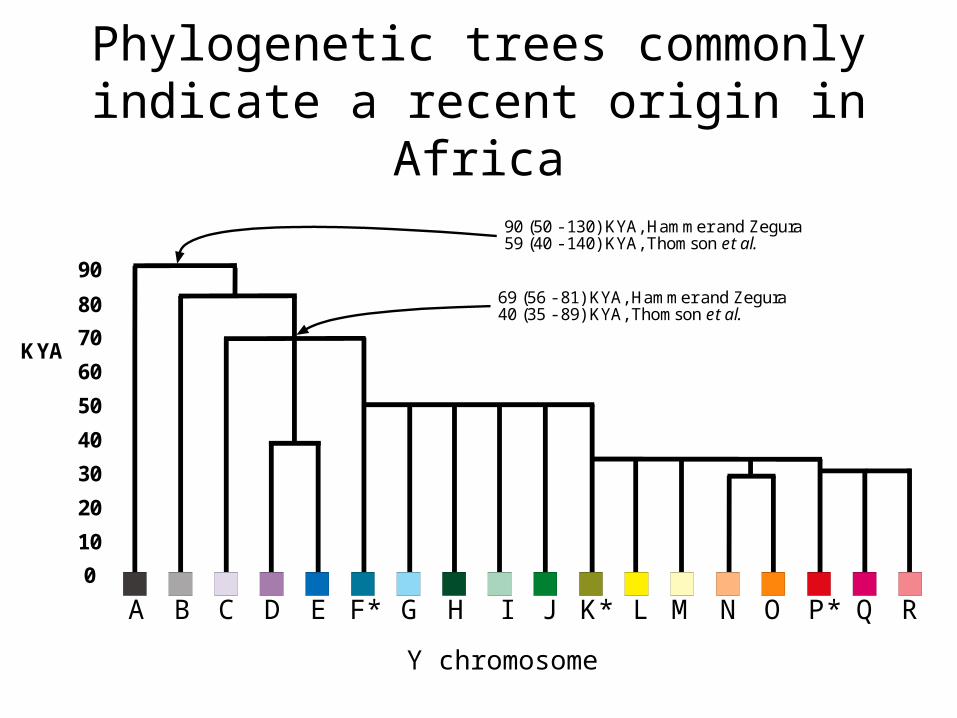
Phylogenetic trees commonly indicate a recent origin in Africa
A B C D E F* G H I J K* L M N O P* Q R
10
20
30
40
60
50
70
90
80
0
KYA
90 (50 - 130) KYA, Hammer and Zegura59 (40 - 140) KYA, Thomson et al.
69 (56 - 81) KYA, Hammer and Zegura40 (35 - 89) KYA, Thomson et al.
Y chromosome
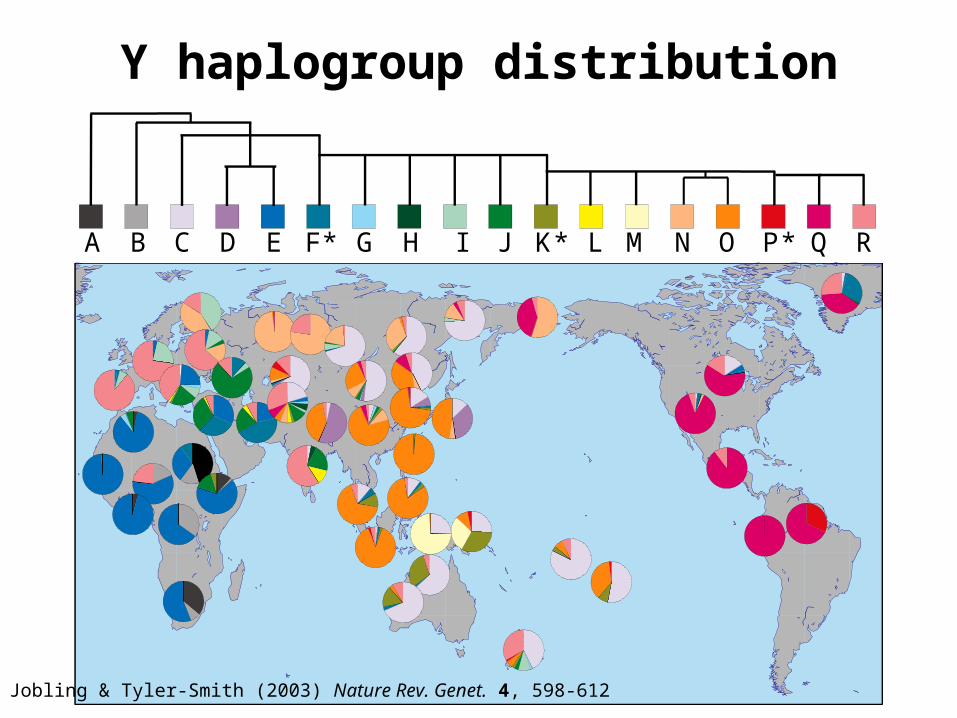
Y haplogroup distribution
Jobling & Tyler-Smith (2003) Nature Rev. Genet. 4, 598-612
A B C D E F* G H I J K* L M N O P* Q R

An African origin
A B C D E F* G H I J K* L M N O P* Q R
QuickTime™ and aTIFF (LZW) decompressor
are needed to see this picture.
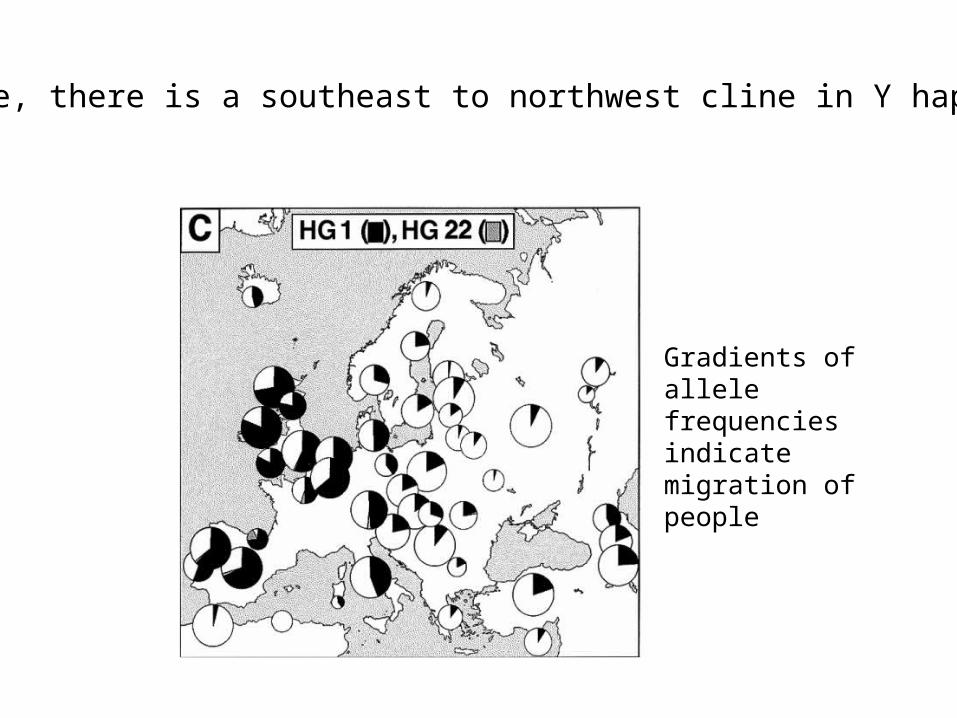
In Europe, there is a southeast to northwest cline in Y haplogroups
Gradients of allele frequencies indicate migration of people
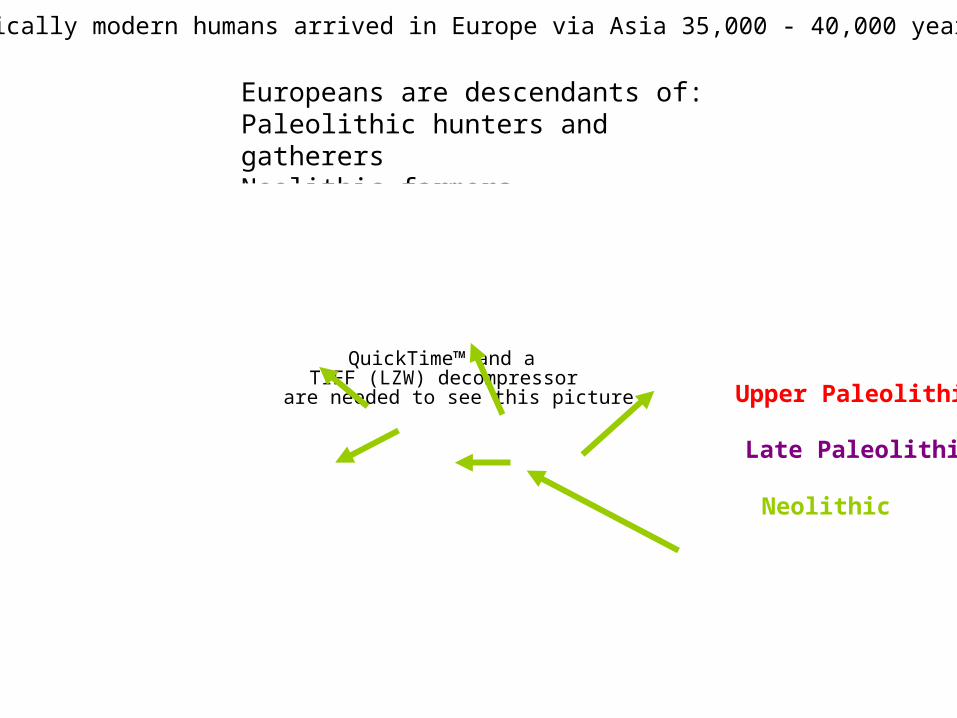
Europeans are descendants of:Paleolithic hunters and gatherersNeolithic farmers
QuickTime™ and aTIFF (LZW) decompressor
are needed to see this picture.
Late Paleolithic
Upper Paleolithic
Neolithic
Anatomically modern humans arrived in Europe via Asia 35,000 - 40,000 years ago.
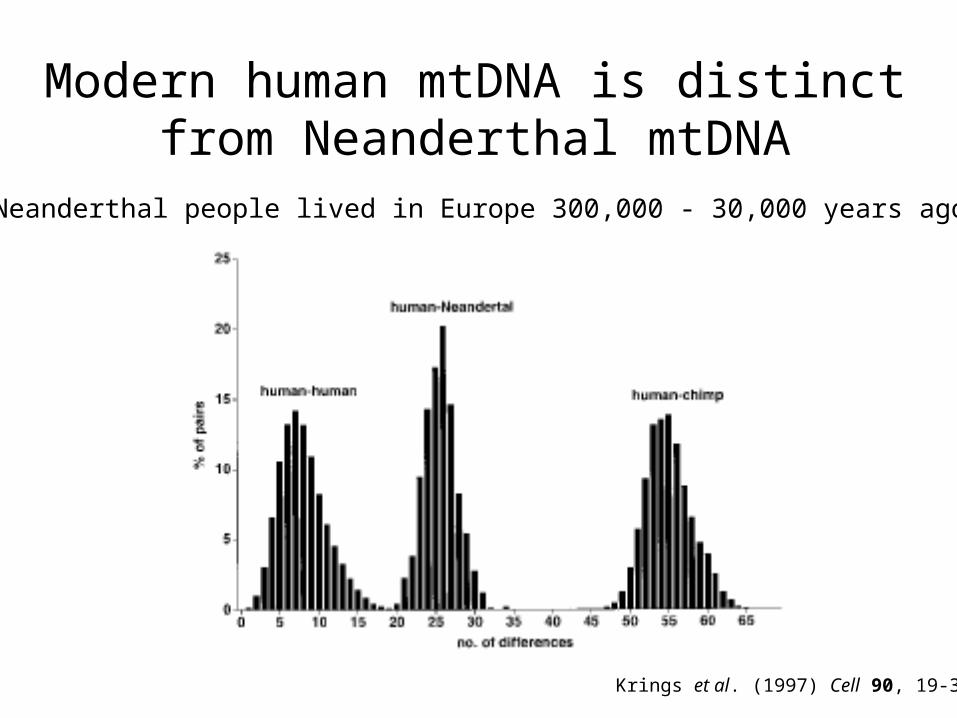
Modern human mtDNA is distinct from Neanderthal mtDNA
Krings et al. (1997) Cell 90, 19-30
Neanderthal people lived in Europe 300,000 - 30,000 years ago
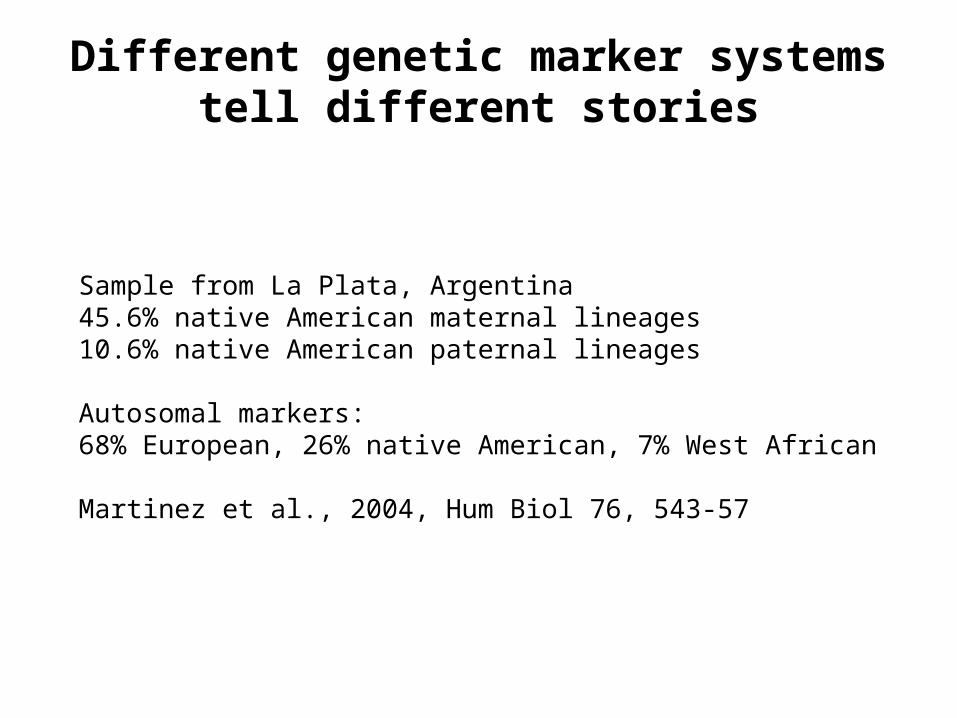
Different genetic marker systems tell different stories
Sample from La Plata, Argentina45.6% native American maternal lineages 10.6% native American paternal lineages
Autosomal markers:68% European, 26% native American, 7% West African
Martinez et al., 2004, Hum Biol 76, 543-57
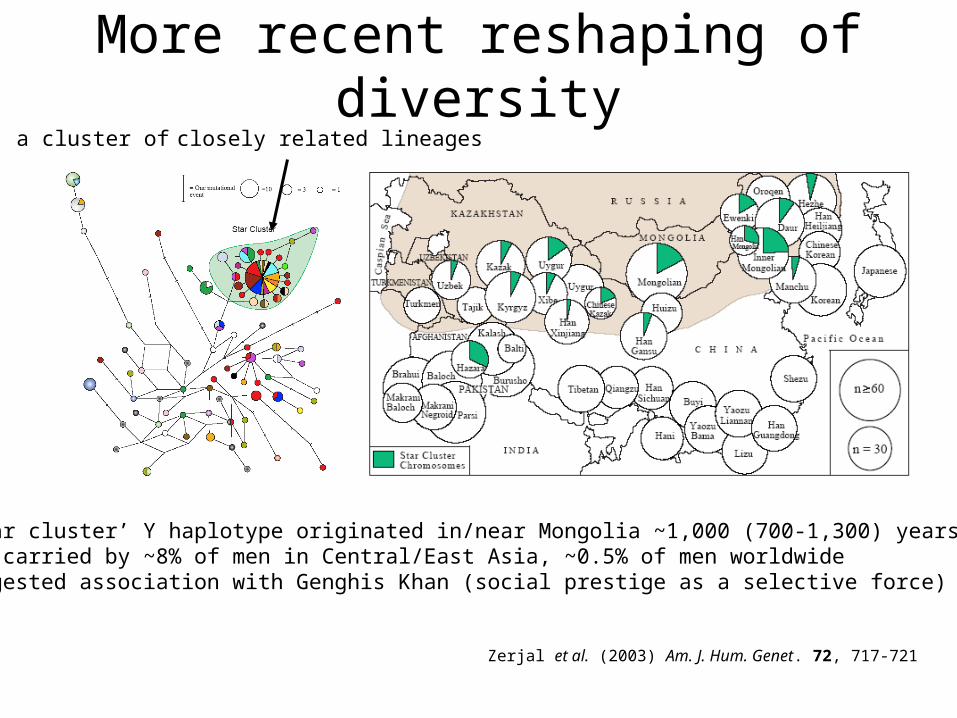
More recent reshaping of diversity
• ‘Star cluster’ Y haplotype originated in/near Mongolia ~1,000 (700-1,300) years ago• Now carried by ~8% of men in Central/East Asia, ~0.5% of men worldwide• Suggested association with Genghis Khan (social prestige as a selective force)
Zerjal et al. (2003) Am. J. Hum. Genet. 72, 717-721
a cluster of closely related lineages
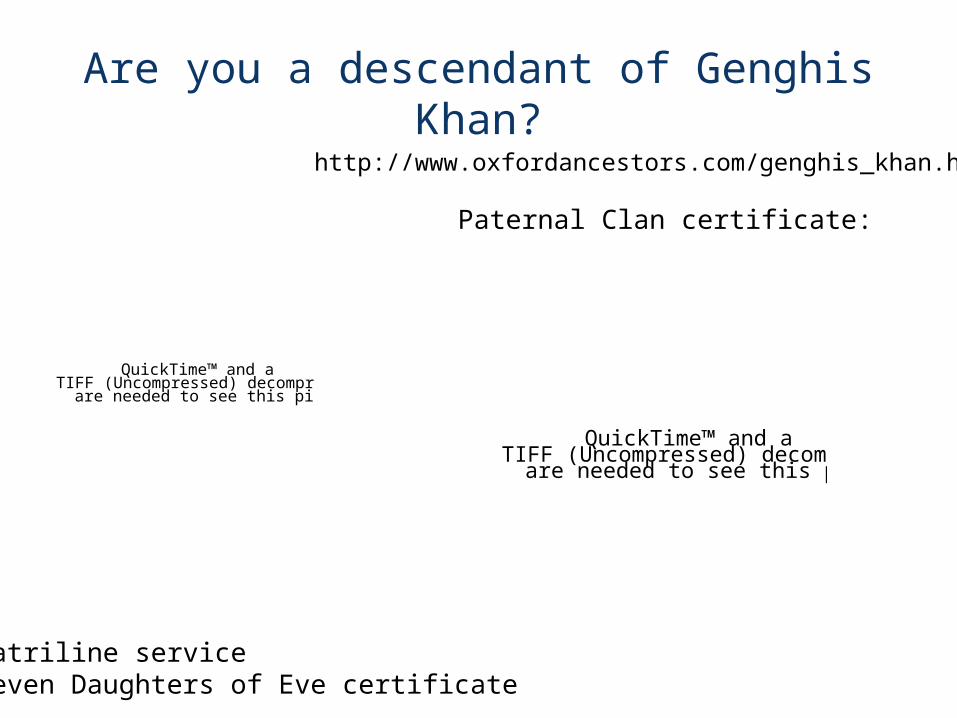
Are you a descendant of Genghis Khan?
http://www.oxfordancestors.com/genghis_khan.html
QuickTime™ and aTIFF (Uncompressed) decompressor
are needed to see this picture.
QuickTime™ and aTIFF (Uncompressed) decompressor
are needed to see this picture.
Paternal Clan certificate:
Matriline serviceSeven Daughters of Eve certificate
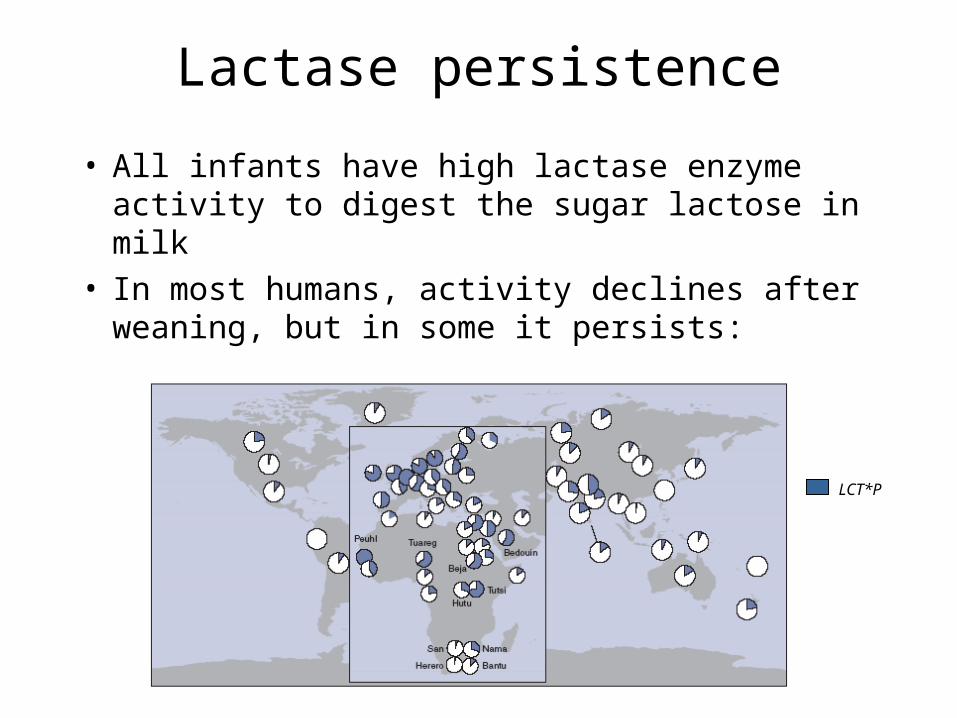
Lactase persistence
• All infants have high lactase enzyme activity to digest the sugar lactose in milk
• In most humans, activity declines after weaning, but in some it persists:
LCT*P
Population history and mapping of genetic diseases
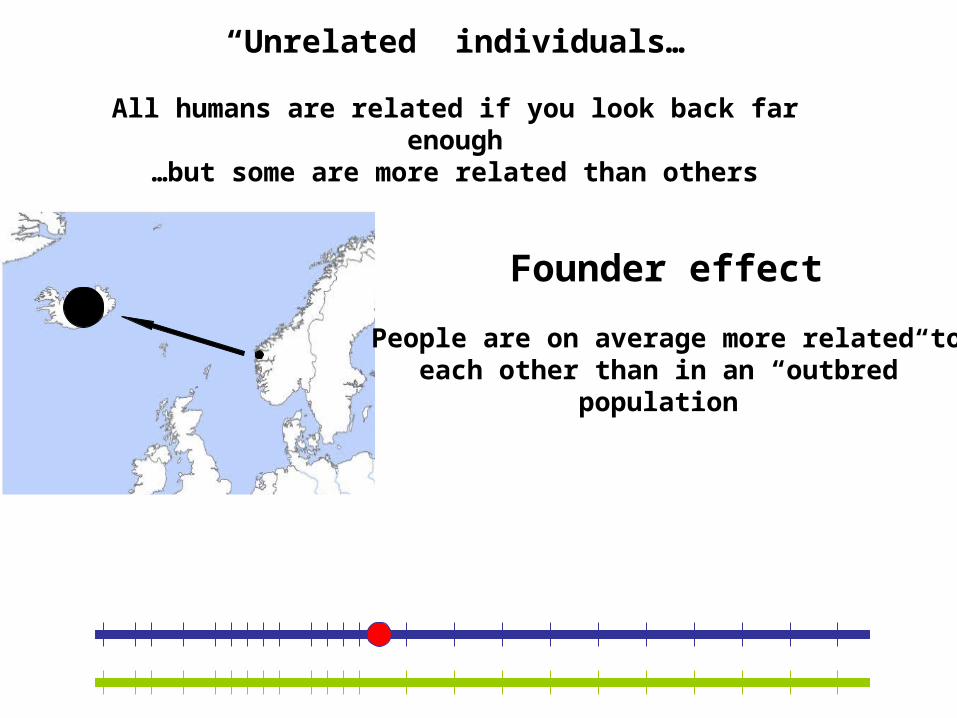
Founder effect
People are on average more related to each other than in an “outbred” population
“Unrelated” individuals…
All humans are related if you look back far enough…but some are more related than others
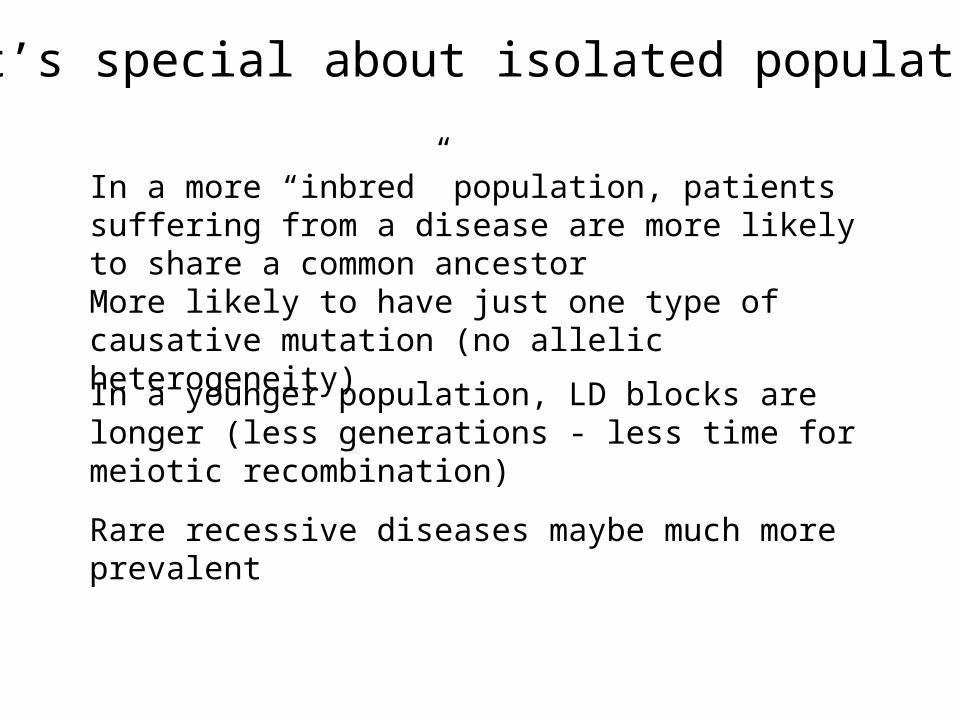
In a more “inbred” population, patients suffering from a disease are more likely to share a common ancestorMore likely to have just one type of causative mutation (no allelic heterogeneity)
In a younger population, LD blocks are longer (less generations - less time for meiotic recombination)
What’s special about isolated populations?
Rare recessive diseases maybe much more prevalent
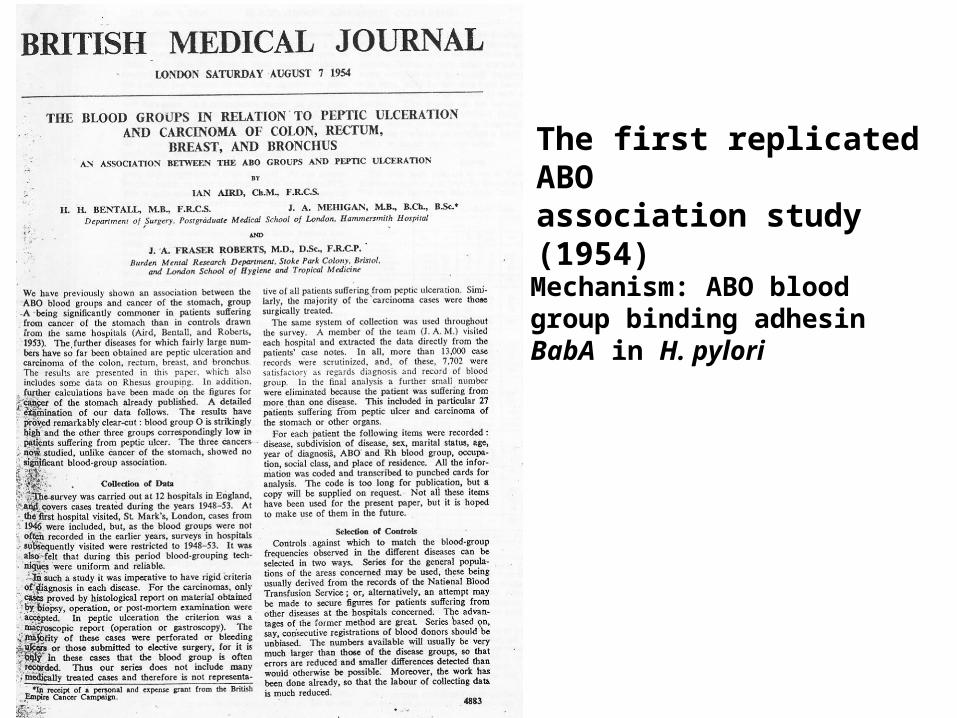
The first replicated ABOassociation study (1954)
Mechanism: ABO blood group binding adhesin BabA in H. pylori
Admixture Mapping
• “Admixed” population is homogeneous but each individual’s genome is a mosaic of segments from different populations
• May be used to map disease loci– multiple sclerosis susceptibility (Reich et al. 2005)
Admixture Mapping - requirements
• Disease has to show a difference in incidence between the two “ancestral” populations, for example: multiple sclerosis in Africans vs. Europeans, hypertension in Africans vs. Europeans
• Must have polymorphic markers that differ in frequency in the ancestral populations (HapMap SNPs)
• Must have at least 10% admixture
Smith and O’Brien (2005) Nat Rev Genet 6, 623-632
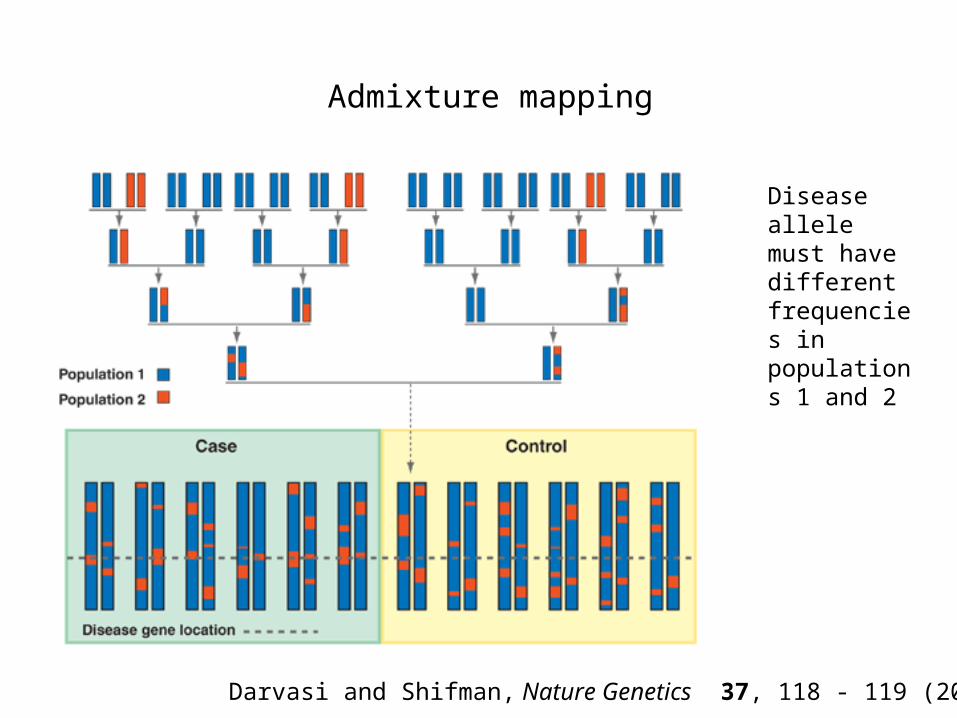
Admixture mapping
Darvasi and Shifman, Nature Genetics 37, 118 - 119 (2005)
Disease allele must have different frequencies in populations 1 and 2
Smith and O’Brien (2005) Nat Rev Genet 6, 623-632
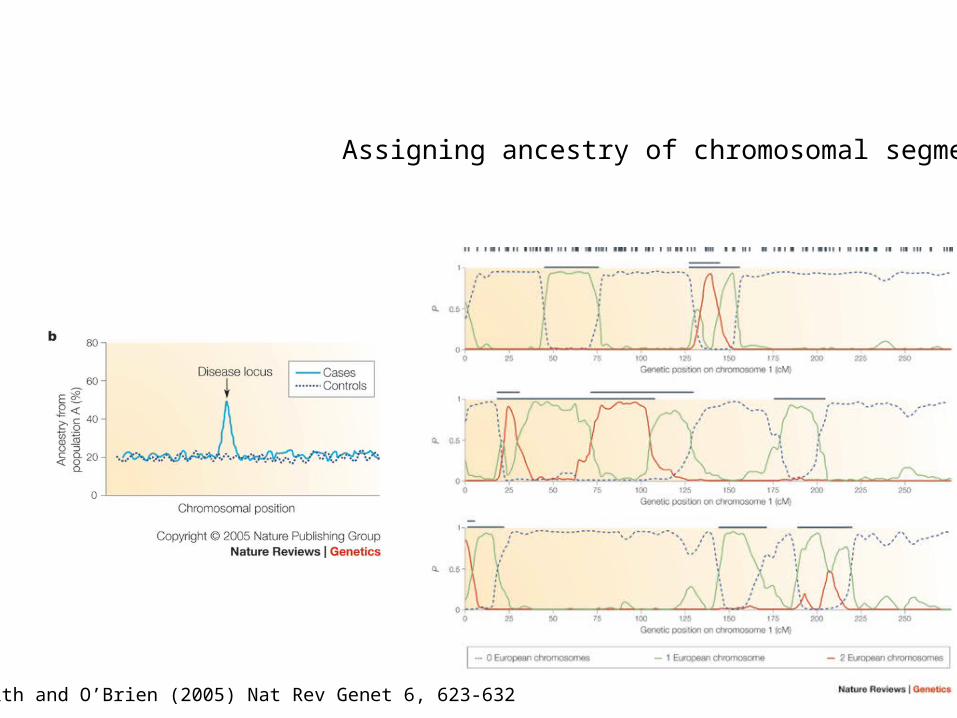
Assigning ancestry of chromosomal segments
Admixture Mapping
• Patient cohort of black Americans with multiple sclerosis (MS)
• MS in Africans vs. Europeans
• Admixture: 20% European, 80% African
• Assign chromosomal segments (haplotypes) as “African” or “European”
• Patients with MS should show an excess of “European” chromosome segments across disease locus
“individualized medicine/therapy”
Optimize drug efficacy and minimize toxicity
Pharmacogenetics
Clinical trial: GSK3-beta gene and bipolar disorderSNP (-50 T/C) in promoter region
Recurring episodes reduced with lithium in C/C homozygotes and C/T heterozygotes
Benedetti et al., (2005) Neurosc Lett 376, 51-55
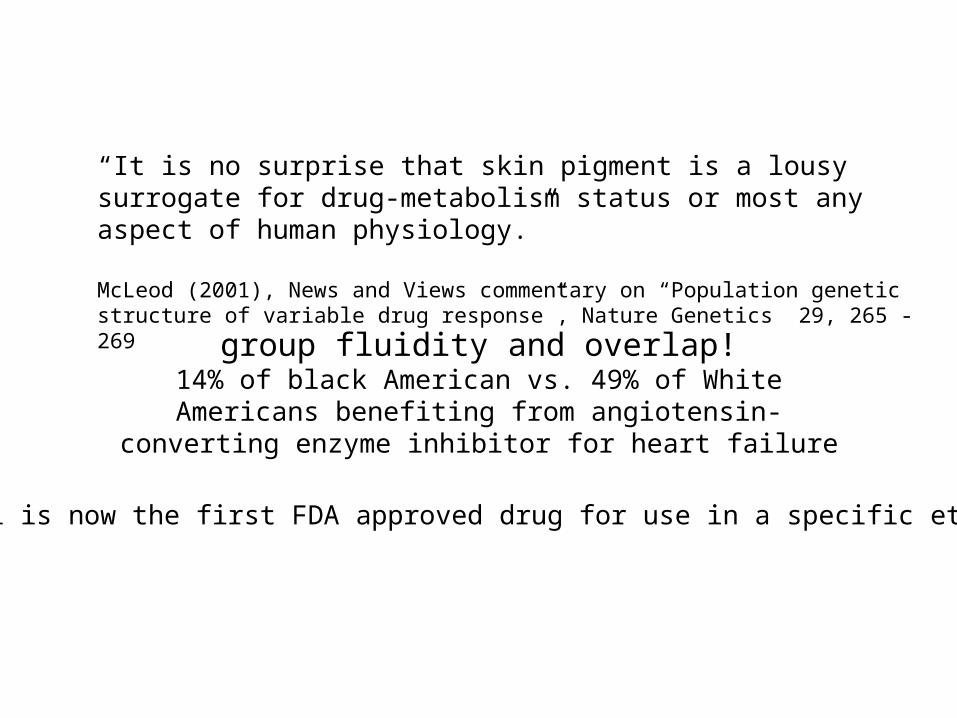
“It is no surprise that skin pigment is a lousy surrogate for drug-metabolism status or most any aspect of human physiology.”
McLeod (2001), News and Views commentary on “Population genetic structure of variable drug response”, Nature Genetics 29, 265 - 269
Yet - BiDil is now the first FDA approved drug for use in a specific ethnic group
group fluidity and overlap!14% of black American vs. 49% of White Americans benefiting from angiotensin-converting enzyme inhibitor for heart failure