Embed Size (px)
Citation preview

359
CONTEMPORARY RESEARCH IN INDIA (ISSN 2231-2137): VOL. 7: ISSUE: 2 (2017)
HUMAN INDUCED CHANGES IN NATURAL LANDSCAPE
OF UTTAR KANNADA DISTRICT, KARNATAKA
Mr. M. M. Kurubar, Research Scholar, Dept. of Studies in Geography, Karnatak University,
Dharwad, Karnataka
Dr. L. T. Nayak, Associate Professor and Research Guide, Dept. of Geography, Karnatak
Science College, Dharwad, Karnataka
Received: 24/05/2017 Edited: 29/05/2017 Accepted: 07/06/2017
Abstract: Human-caused environmental changes are creating regional combinations of environmental conditions that, within the
next 50 to 100 years. These environmental modifications might become a greater cause of global species extinction than direct
habitat destruction. The environmental constraints undergoing human modification include levels of soil physical and chemical
characteristics. Increasing land-use by humans (e.g. forestry, grazing and agriculture) in recent decades has resulted in the loss,
subdivision and reduction in size of large natural areas. Conversion of natural and moderately managed lands into intensively
managed landscapes has drastically altered the availability and quality of animal habitats, potentially causing population declines.
In the light of this ground in the present study an attempt has been made to study spatial pattern of land use and land cover for
the four decades, establish the relationship between population, urbanization, industrialization, agriculture, and land use (Causes
and effects) and to analyze the interrelation ship between the land use /land cover classes with the help of fourteen variables in the
Uttar Kannada district. The study is based on secondary data.The study area reported 80.9 per cent of area under forest to the
total geographical area indicates that the area under study has more than the national average of 66 per cent (only in Western
Ghats) as a result it has maintained the ecological balance. There has been small increase in the net sown area during the thirty
years. The current fallow land and Land not available for cultivation recorded increase from 12,014 hectares and 36,443
hectares in 1991 to 20,120 hectares and 50,781 hectares in 2011 respectively.
Keywords: LULC, Pattern, Inter-Relationships, Density, Urbanization, Industrialization.
Introduction:
The role of human beings in creating and
modifying landform is a theme of great importance
(Goudie, 1993). The impact of man on both forms
and processes on land is considerable, especially in
case of areas of environment fragile. The high
altitude mountain ecosystems are very fragile and
sensitive to changes that are introduced by human
beings. The critical balance of such ecosystem has
largely been offset by the land use / land cover
changes by man for development purposes. The
natural processes are accelerated out of proportion
by strong anthropogenic modifications of landscape
through clearance of forest for agriculture,
settlement, pasturing, mining and quarrying, tapping
of water resources, road construction and the like to
invite hazardous events which have dramatic impact
on human property and lives. Thus humans have
been instrumental for significant increase in the
frequency and magnitude of these hazardous events.
An assessment of anthropogenic impact on the
landscape is necessary for sustainability of the
mountainous landscape, particularly in those areas
where large number of people depend together for
their livelihood. The Uttar Kannada district falls
under Western coast and malnad region of Karnataka
state. The present study is a humble attempt to assess
the extent of human impacts on change in natural
landscape of Uttar Kannada district.
Land use is the surface utilization of all
developed and undeveloped land at a specific point
of time. This “leads one back to the village farm and
farmer to the fields, gardens, pastures, fallow land,
and forest land and to the isolated farmstead”
(Freeman, 1968).
360
CONTEMPORARY RESEARCH IN INDIA (ISSN 2231-2137): VOL. 7: ISSUE: 2 (2017)
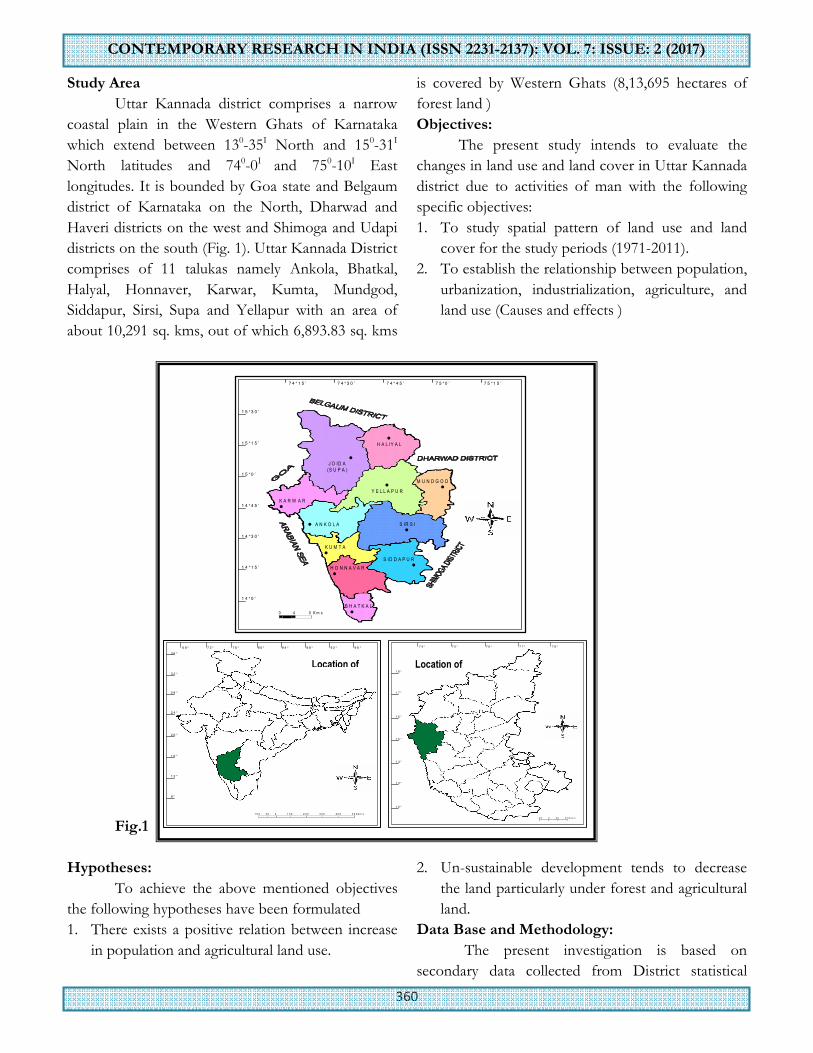
Study Area
Uttar Kannada district comprises a narrow
coastal plain in the Western Ghats of Karnataka
which extend between 130-35I North and 150-31I
North latitudes and 740-0I and 750-10I East
longitudes. It is bounded by Goa state and Belgaum
district of Karnataka on the North, Dharwad and
Haveri districts on the west and Shimoga and Udapi
districts on the south (Fig. 1). Uttar Kannada District
comprises of 11 talukas namely Ankola, Bhatkal,
Halyal, Honnaver, Karwar, Kumta, Mundgod,
Siddapur, Sirsi, Supa and Yellapur with an area of
about 10,291 sq. kms, out of which 6,893.83 sq. kms
is covered by Western Ghats (8,13,695 hectares of
forest land )
Objectives:
The present study intends to evaluate the
changes in land use and land cover in Uttar Kannada
district due to activities of man with the following
specific objectives:
1. To study spatial pattern of land use and land
cover for the study periods (1971-2011).
2. To establish the relationship between population,
urbanization, industrialization, agriculture, and
land use (Causes and effects )
Fig.1
Hypotheses:
To achieve the above mentioned objectives
the following hypotheses have been formulated
1. There exists a positive relation between increase
in population and agricultural land use.
2. Un-sustainable development tends to decrease
the land particularly under forest and agricultural
land.
Data Base and Methodology:
The present investigation is based on
secondary data collected from District statistical
7 4 ° 1 5 ′ 7 4 ° 3 0 ′ 7 4 ° 4 5 ′ 7 5 ° 1 5 ′
1 5 ° 3 0 ′
1 5 ° 1 5 ′
1 5 ° 0 ′
� H A L IY A L
7 5 ° 0 ′
1 4 ° 4 5 ′
1 4 ° 3 0 ′
1 4 ° 1 5 ′
1 4 ° 0 ′
� J O ID A
(S U P A )
� Y E L L A P U R
M U N D G O D �
S IR S I �
S ID D A P U R �
B H A T K A L �
H O N N A V A R �
K U M T A �
� A N K O L A
K A R W A R �
0 4 0 K m s
7 4 ° 7 5 ° 7 6 ° 7 7 ° 7 8 °
1 8 °
1 7 °
1 6 °
1 5 °
1 4 °
1 3 °
4 0 0 4 0 8 0 k m s
1 2 °
Location of
Uttara
6 8 ° 7 2 ° 7 6 ° 8 0 ° 8 4 ° 8 8 ° 9 2 ° 9 6 °
3 6 °
3 2 °
2 8 °
2 4 °
2 0 °
1 6 °
1 2 °
8 °
1 0 0 5 0 0 1 0 0 2 0 0 3 0 0 4 0 0 5 0 0 k m s
Location of

361
CONTEMPORARY RESEARCH IN INDIA (ISSN 2231-2137): VOL. 7: ISSUE: 2 (2017)
office Uttar Kannada District, forest annual reports, forest conservator office, Sirsi and field visits.
Sources of data
Secondary data primary data
1. District statistical office, Uttar Kannada General/Field Observation
2. Census, Uttar Kannada District
3. Gazetteer, Uttar Kannada District
4. Forest Department Sirsi
Following techniques have been used to find out the results
Concentration
R = ∑�� � �∑�2∑�2
Relation of variation
Ai = ����
∑ ����� Rate of changes of LULC
Ci = ����
� LULC change intensity index
Di = (Ubi - Uai ) / Uai (1/T) 100% Land use/ Land cover dynamic index
Id= 100 � ∑ �������� Land use/ Land cover integrated index.
Results and Analysis:
Spatial distribution of General land use pattern
There has been constant change in the
pattern and type of land use with the increasing
pressure of population and consequent demand for
cereals, development activities and technological
improvement. Fig.2, 3 & 4 depict the trends and
pattern of land use between 1991 and 2011. The
study area reported 80.9 per cent of area under forest
to the total geographical area of the district in 1991.
This proportion strongly indicates that the area
under study has more than the national average of 66
per cent (only in Western Ghats) as a result it has
maintained the ecological balance. But unfortunately
in the subsequent years the area under forest has
decreased to 79.5 per cent in 2001 and 79.4 per cent
in 2011.
There has been small increase in the net
sown area during the thirty years. In 1991 the net
sown area was 1, 12,976 hectares (11.01%) which
increase to 1, 18,519 (11.56%) hectares in 2001 and
1,23,533 hectares (12.05%) in 2011showing an
increase of 10,559 hectares (1.05%). This is a positive
sign for increasing population of the study area.
There have been varying trends in the extent of
current fallow but it has recorded increase from
12,014 hectares in 1991 to 20,120 hectares in 2011.
Land not available for cultivation has recorded
increase from 36,443 hectares in 1991 to 50,781
hectares in 2011. Other uncultivable land in the study
region reported sharp decline from 33,833 hectares
in 1991 to 27,880 hectares in 2011.
Forest:
Most of the land in the district is under
forest. Out of the total geographical area forest
covers is more than 80 per cent, which is the highest
of all the districts of Karnataka, and more than
double that of the country’s average of 33.33 per
cent. It is pertinent to note that the distribution of
forest cover is highest i.e more than the national
average in all the taluks of the district. However,
some of the taluks recorded less than the average of
L.Q TFt ÷ TGAt
-------------------
TFd ÷TGAd

CONTEMPORARY RESEARCH IN INDIA (ISSN 2231
malnad region i.e., 66 per cent.(malnad region should
have of 66%) Joida Yellapur, Siddapur, Sirsi taluks
Uttar Kannada District- Land-Use Changes 1991
Talukwise spatial distribution of forest in the
district noticed variation. Supa covers 92.30 per cent
to the total geographical area of the taluk in 1991and
in 2011 it decreased to 86.81 per cent. Yellapur, Sirsi
and Siddapur, taluks recoded more area und
i.e. 90.46 per cent, 78.09 per cent and 79.42 per cent
in 1991, where as in 2001 these taluks witnessed
89.91 per cent, 78.09, 79.28 per cent and maintained
the same status in 2011 respectively. From last two
11%
Forest
Net area sown
Fallow land
not available for cultivation
un cultivable land
forest
net area sown
follow land
land not available for cultivaton
other un cultible land
Forest
Net area sown
Fallow land
not available for cultivation
un cultivable land
362
CONTEMPORARY RESEARCH IN INDIA (ISSN 2231-2137): VOL. 7: ISSUE:
malnad region i.e., 66 per cent.(malnad region should
have of 66%) Joida Yellapur, Siddapur, Sirsi taluks
located in malnad region has recorded more than
minimum requirement of forest i.e, 66 per cent.
Changes 1991 -2011
Fig. 2
Fig.3
Fig.4
Talukwise spatial distribution of forest in the
district noticed variation. Supa covers 92.30 per cent
to the total geographical area of the taluk in 1991and
in 2011 it decreased to 86.81 per cent. Yellapur, Sirsi
and Siddapur, taluks recoded more area under forest
i.e. 90.46 per cent, 78.09 per cent and 79.42 per cent
in 1991, where as in 2001 these taluks witnessed
89.91 per cent, 78.09, 79.28 per cent and maintained
the same status in 2011 respectively. From last two
decades the least area of forest is f
with 67.95 per cent. Fig.5).
Net area Sown
Cropped area in the year under consideration
is called net area sown. It is important to note that
net area sown in the study region has increased from
11 per cent in 1991 to 12.05 per cent in 2011. Thus
there has been an increase of about 1.05 per cent in
net sown area in about three decades from 1991 to
81%
11%
1% 4% 3% 1991
not available for cultivation
79%
11%
2% 5% 3% 2001
land not available for cultivaton
other un cultible land
78%
12%
2% 5% 3% 2011
not available for cultivation
: ISSUE: 2 (2017)
located in malnad region has recorded more than
minimum requirement of forest i.e, 66 per cent.
Fig. 2
Fig.3
Fig.4
decades the least area of forest is found in Kumta
Cropped area in the year under consideration
is called net area sown. It is important to note that
net area sown in the study region has increased from
11 per cent in 1991 to 12.05 per cent in 2011. Thus
there has been an increase of about 1.05 per cent in
net sown area in about three decades from 1991 to

363
CONTEMPORARY RESEARCH IN INDIA (ISSN 2231-2137): VOL. 7: ISSUE: 2 (2017)
2011. It shows that “There exists a positive relation
between increase in population and agricultural land
use”. Net area sown of the district varies from one
taluk to another, mainly because of soil condition
and rainfall variation and increasing population
pressure. Haliyal records highest i.e., 23.74 per cent
net area sown in 1991.which has slightly decrease to
23.12 per cent in 2001 and in 2011 it increased to
25.19 per cent (Fig.6). The least Net area sown is
found in Supa with 2.74 per cent to total
geographical area of the district in 1991, and 3.05 per
cent in 2001. During the study period taluk-wise
distribution of net area sown indicates less than ten
per cent in 1991 in Ankola (9.49), Supa (2.74)
Yellapur (6.01) but during the same period, Bhatkal,
Haliyal, Honnavar, Karwar, Kumta, Mundgod,
Siddapur and Sirsi showed more than ten per cent
increase in net area sown. In the subsequent years
most of the taluks showed increasing trend in the net
area sown. It is a healthy trend and must be
maintained at all cost so that the attainment of food
for the rapid growing population can be met and
food balance is maintained in the study region.There
exist a positive correlation between population and
net area sown, to get the value the Pearson’s
correlation coefficient technique is applied and
accordingly a value of 0.29 is found. It shows the
relation is positive.
Fallow Land
The category includes all that which was used
for cultivation but it is temporarily out of cultivation.
Fallow land is left uncultivated from 1 to 5 years to
help soil recoup its fertility. Taluka-wise distribution
of Fallow land shows varying trends. The land is left
for uncultivated for a period of one to five years due
to soil erosion, silting, salinity and alkalinity of the
soil, marshy land, flooding. In 1991 the fallow land
was 1.17 per cent in the study area district. Whereas
in 2001 it increased to 2.16 per cent and 1.96 per
cent in 2011.This accounts for 13.94 per cent to the
total cultivable land of the district
Taluk-wise distribution of fallow land in the
district varies from one taluk to another. The highest
fallow land is recorded in Karwar i.e., 4.42 per cent
in 1991, 8.08 per cent in 2001 and 11.3 per cent in
2011. Only 0.06 per cent land was recorded in
Bhatkal taluk in 1991 and 0.74 per cent and 0.44 per
cent of fallow land was recorded in 2001 and 2011
respectively. Other taluks namely Ankola registered
1.27 per cent in 1991, 2.16 per cent and 2.33 per cent
in 2001 and in 2011. It increased to 1.06 per cent.
Haliyal taluka accounts for 0.61 per cent, 4.29 per
cent and 2.65 per cent in 1991, 2001 and in 2011
respectively. Honnavar records 0.97 per cent in 1991,
1.27 per cent in 2001 and 0.86 per cent in 2011.
Kumta taluk accounts for 1.73 per cent in 1991,
which increase to 2.75 per cent in 2001 and 3.23 per
cent in 2011. Mundgod taluk recorded 0.33 per cent
in 1991, where as in 2001 and 2011 it has increased
to 0.1.59 per cent and 1.44 per cent respectively.
Land Not Available For Cultivation
Area not available for cultivation includes
land that is either useless from the point of view of
agriculture or is being used for other purposes more
economically otherwise. More specifically, under this
head the land stretches are occupied by water bodies,
human settlements, transport and communication
networks, graveyards, rocky surfaces and other
barren and unproductive areas. Definitely, then, the
land under this category is permanently out of
cultivation.
In 1991 the district had 3.55 per cent of its
total available land as area not available for
cultivation over time the area not available for
cultivation increased to 4.92 per cent in 2001 and
4.95 per cent in 2011. The area not available for
cultivation has increased by 1.4 per cent during 1991
to 2011. The spatial distribution of the area not
available for cultivation exhibits high degree of
unevenness at local and regional levels, depending on
the complexity rendered by geographical factors. It
can be aptly justified through its shares. Ankola taluk
shared 4.01 per cent in 1991 it increased to 4.10 per
cent in 2001 and 4.11 per cent in 2011. Bhatkal taluk
accounted for 4.42 per cent in 1991, which decrease
to 4.31 per cent in 2001and steep increased to 4.41
per cent in 2011. Haliyal accounted for 2.98 per cent
in 1991 where as increase to 4.58 in 2001 and 4.64

364
CONTEMPORARY RESEARCH IN INDIA (ISSN 2231-2137): VOL. 7: ISSUE: 2 (2017)
per cent in 2011. Honnavar recorded 6.32 per cent in
1991, which as in 2001 and 2011it showed decrease
to 6.69 and 6.73 per cent. It is pertinent to note that
Karwar,. Kumta, Mundgod, Siddapur, and Sirsi
taluks witnessed decrease in land not available for
cultivation during the study period. (Fig.7). Among
all the taluks Supa accounts for the largest and
Kumta taluk accounts for the lowest share of the
category. The existence of the highest proportion in
Supa taluk may be attributed partly to extensive hilly
tracts and water bodies.
Other uncultivable land
These lands are those which cannot be
brought under cultivation without bringing radical
changes in environment. Uncultivable land in the
district is the area which is occupied by the forest.
“Cultivable waste” is a waste land owing to the
number of severe limitations noticed in the district
including excessive sandiness, water logging, weed
jungle, salinity and alkalinity etc. The area under
study recorded 33,833 hectares (3.28 per cent) of
other uncultivable land in 1991, and in 2001 and
2011 it decreased to 33633 hectares (3.27)
respectively. Sirsi having highest uncultivated land
i.e., 8,609 hectares (0.84 per cent) in 1991, which
increased to 9,025 hectares (0.88 per cent) in 2001
and decreased to 6,903 hectares (0.67 per cent)
recorded in 2011. The least uncultivated land in
Karwar with 1358 hectares (0.13per cent) in 1991,
which decreased to 376 hectares (0.04 per cent) in
2001 and 359 hectares (0.04 per cent) are recorded in
2011 (Fig.8).
Taluk-wise distribution of uncultivable land
showed a greater variation. Of all the taluks Sirsi
taluk has highest uncultivable land in the district with
6.51 per cent which increased to 6.82 per cent in
2001 and decreased to 5.22 per cent in 2011. The
least uncultivable land is found in Karwar taluk with
1.85 per cent in 1991, in 2001 it decreased to 0.51 per
cent and 0.49 per cent in 2011, Rest of the taluks
namely Ankola. Bhatkal. Haliyal. Honnavar..
Mundgod. Siddapurand Supa taluks exhibits
increasing trends. accounted for 1.31 per cent in
1991, which decrease to 0.93 in 2001 and 0.94 per
cent in 2011. Yellapur accounts 1.24 per cent in
1991, which increase to 1.40 per cent in 2001 and
1.45 per cent in 2011.
Cause and effect analysis by mathematical indices.
The formula used for computing the indexes are as follows:
1 .Rate of change of LULC (Ai)
�� �Ubi � Uai∑Ubi � Uai
Where Ai = rate of change of ¡th land use/land cover Ua i= ¡thLULC area at beginning of study period Ubi = ¡thLULC area at end of study period
2 Land use/ land cover change intensity index (Ci)
Ci = ����
�
Where i (1,2,…………,9) no of LULC classes. Ci = LULC intensity index for ith l and use type Uai = ith LULC area at the beginning of study area Ubi = ith LULC area at the end of study area B= Total study area
3 Landuse/landcover Dynamic Index (Di) Di=(Ubi-Uai)/ (1/T) 100% Where I (1,2,…………,9)= LULC dynamic Index for ith LULC type Uai = ith LULC area at beginning of study period. Ubi = ith LULC area at end of study period T= Total study period in years.
4 Land use / land cover integrated index(Id)
�� � 100�∑9i=1 AiXCi Where limits (100………..600) Id= LULC integrated index A i= percentage of ith level/land cover Assignment of Ci level is based on Ci values.

365
CONTEMPORARY RESEARCH IN INDIA (ISSN 2231-2137): VOL. 7: ISSUE: 2 (2017)
The changes in land use are estimated and
summarized in table 2 the land not available for
cultivation and fallow land showed increasing trend.
While the forest land, net area sown, and
uncultivated land showed decreasing trends. The
major driving forces of these LULC changes is the
socio-economic factor of urbanization processes
such as population, economic, technological and
institutional growth which have triggered
competition for space for various urban
development purposes such as residential, industrial,
commercial, institutional, recreation, transportation
thereby increasing built up area resulting in
corresponding increase in area not available for
cultivation.
Forest land showed decreasing trend by 1.93
per cent (6018 ha.) because this land is used for
developmental works, such as roads, railway lines,
power stations, mining and many on-going projects
acquired the forest land. Net area sown and un-
cultivated land showed decreasing trend i.e. -826
hactares
Fig.5
Fig.6

366
CONTEMPORARY RESEARCH IN INDIA (ISSN 2231-2137): VOL. 7: ISSUE: 2 (2017)
Fig.7
Fig.8
(0.73%) and -5952 hactares (17.59%) from 1991 to
2011 respectively. Contributing reasons for this
negative growth are urbanization and developmental
works (Table.1). Table 1 shows that the forest area
has the highest land use change intensity index of
about 1.56 per cent followed by area not available for
cultivation 1.39 per cent LULC dynamic index
showed fallow land having the highest of 3.45 per
cent followed by area not available for cultivation
and un-cultivated lands as 1.96 per cent and 0.87 per
cent respectively. Table 1 shows that the forest area
has the highest land use change intensity index of
about 1.56 per cent followed by area not available for
cultivation 1.39 per cent LULC dynamic index
showed fallow land having the highest of 3.45 per
cent followed by area not available for cultivation
and un-cultivated lands as 1.96 per cent and 0.87 per
cent respectively.

367
CONTEMPORARY RESEARCH IN INDIA (ISSN 2231-2137): VOL. 7: ISSUE: 2 (2017)
Table 1: Analysis of Growth rate of LULC: 1991-2011 (Area in hectares)
Sl No
LULC 1991 2001 2011 Change in extent
(hectares) 1991-2011
Extent (In per cent)
1 Forest land 829613 81478 813595 -06018 1.93 2 Net sown area 112976 108610 112150 -826 0.73 3 Area not available for
cultivation 36443 50393 50748 14305 39.25
4 Un-cultivated land 33833 31394 27881 -5952 17.59 5 Follow land 12014 19564 20305 8291 69.01 1024679 1024679 1024679 Rbi
Rai=35392
In table 2LULC integrated has shown
temporal variants over the years with the highest in
2011 of 498.42 followed by 2001 of 491.49 in an
upper limit of 500 signifies very high impact of both
natural and human factors in the breadth and depth
of the study area and thus an indication of
degradation of biophysical environment.
Table 2: Summary of analysis of integrated Land use index (LD) for different years
2001 2011 Sl no LULC Ai Ci Ai*Ci LDi Ai Ci Ai*Ci LDi 1 Forest land 0.96 5 4.8 480 0.99 5 4.95 495 2 Net sown area 0.005 2 0.01 1 0.005 4 0.07 2
3 Area not available for cultivation
0.017 4 0.07 6.8 0.0004 1 0.00 0.02
4 Un-cultivated land 0.003 1 0.003 0.99 0.004 3 0.12 1.2 5 Follow land 0.009 3 0.03 207 0.001 2 0.002 0.2 491.49 498.42
NB Ci=levels of ith land use were based on Ai values with given 5 and least 1 based on 5 classes of LULC
Table 3: Analysis of LULC structure index
Sl no LULC Ti(%) Ki(%) Ai Ai(%) 1 Forest land 1.56 0.097 0.35 35 2 Net sown area 0.08 0.037 0.01 1
3 Area not available for cultivation
1.39 1.96 0.31 31
4 Un-cultivated land 0.58 0.87 0.13 13 5 Follow land 0.80 3.45 0.18 18.26
Inter-Relationships between Population and
land use:
Multiple correlation analysis and factor
analysis are taken into consideration for analyzing the
relationship between population and land use.
Correlation matrix brings out the pair-wise
relationships between the selected fourteen variables.
The results are summarized below. Relationship
between rural population density per sq km (1971-
1991) and village density per 100 sq kms (1991) is
most significant and this is also correlated with
population growth 1971-1991 32.25 per cent, 1991-
2011 9.99 per cent and consequent increase in
population density from 68 per Sq,Km in 1971 to 91
per sq km in 1991and 99 per sq km in 2011 for the
district. Rural population density, village density,
cultivated areas and irrigated area are significantly
correlated. This brings out the distinctive structure of
the agriculture landscape; in the Uttar Kannada
district. About 52 per cent in 1971-1991 and 39 per

368
CONTEMPORARY RESEARCH IN INDIA (ISSN 2231-2137): VOL. 7: ISSUE: 2 (2017)
cent in 1991-2011, of the total rural population in the
countryside is engaged in agricultural activities mostly
as cultivators and agricultural laborers’.
Percentage of non-agricultural workers to the
total workers is significantly correlated with
economic density, that is, rural population density
per 100 acres of cultivated area (Table.10.a). This is
also correlated with the percentage of waste land area
to total area of the district. Percentage of non-
agricultural workers to the total workers in Uttar
Kannada district is much below i.e., 48 per cent
(1971-1991) and 61 per cent (1991-2011). This
relationship indicates the spread of the non-
agricultural population not only in the areas where
the population pressure on cultivated land is high,
but also in the waste lands where the population
pressure is relatively low. Thus, one can see the
spread of non-agricultural population along with the
transport arteries to the waste lands as one traverses
along the coastal taluks namely Bhatkal (51.67% &
72.85%), Honnavar (52.92% &76.22%), Karwar
(54.44%, & 78.77%), Kumta (38.80% & 67.31%),
and little low in Ankola (36.60& 45.83%). In
siddapur (44.85% & 64.22%), Sirsi (44.51 %,
&68.35%), and Haliyal (18.45% & 46.03%),
Mundgod (18.57% & 27.63%), Supa (33.72, &
43.41%), Yellapur (28.30% & 52.71%) in 1971-1991
and 1991 to 2011 respectively. This again emphasizes
the excursiveness of land-scape.
Forest area is negatively correlated with rural
population density and wasteland is negatively
correlated with cultivated area both irrigated and un-
irrigated. The supa taluk has the maximum
concentration of forest area (92.31% & 86.81%)
followed by Yellapur (90.46 & 89.91% ), Kumta
(68.03% & 67.95%) rest of the taluks have more than
70 per cent forest cover. while waste land is mostly
concentrated in Mundgod taluk (1.70% & 1.48%)
followed by Kumta (1.58% & 1.31%) and Honnavar
taluks (1.34% & 0.63%) in 1971-1991 and 1991-2011
respectively .Forests accounts for 80.96 per cent &
79.39 per cent and waste land 0.76 per cent and 0.63
per cent of the total area in 1991 & 2011 respectively.
The negative correlation indicates that both in the
forest area and waste lands, cultivated area has not
expanded. The very character of the hill -forest
environment and the low or no productivity of waste
land is constraints on the expansion of agricultural
land use in them.
Table 4: Correlation between variables
Sl no Positive correlation Negative correlation 1 Rural population density and village density Forest and population density 2 Cultivated area and irrigated area Wasteland and cultivated area 3 Total rural population and total population
engaged in agricultural activity
4 Rural population density and cultivated area 5 Non-agricultural workers and total workers
Reference
1) Free man 1968 – Landuse / Land cover and Environmental change Ware house Publication 426p
2) IGBP 1993 – Report – International, Geosphere, Biosphere Programme Report
3) A Yode – 2002 – Environmental Change in South Africa, climate Digest 9 (1) Pp7-9.
4) Houghton (1991) (The Influence of Land use on Green house Gas sources)