Embed Size (px)
Citation preview
Human Machine InterfaceVisualization Enhancement of
an ABB Quality ControlSystem
Nils Johansson and Filip Williamsson
October 25, 2009Master’s Thesis in Computing Science, 2*30 ECTS credits
Supervisor at CS-UmU: David SjolieExaminer: Per Lindstrom
Umea University
Department of Computing Science
SE-901 87 UMEA
SWEDEN

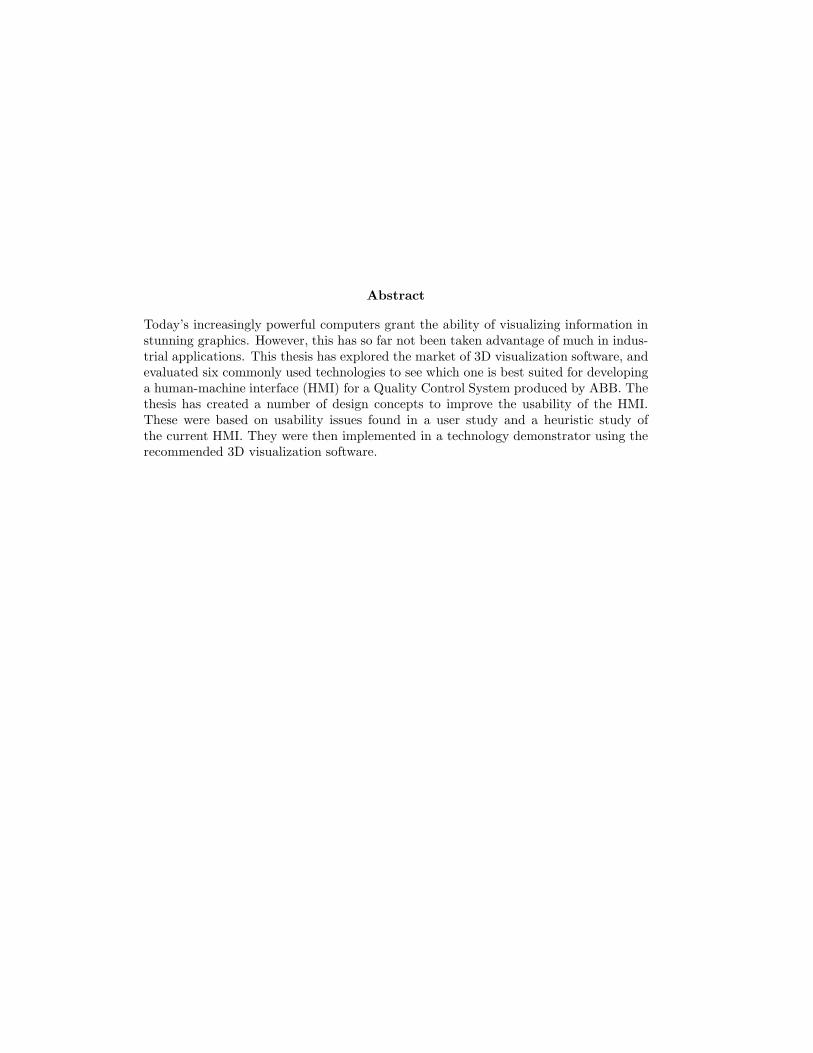
Abstract
Today’s increasingly powerful computers grant the ability of visualizing information instunning graphics. However, this has so far not been taken advantage of much in indus-trial applications. This thesis has explored the market of 3D visualization software, andevaluated six commonly used technologies to see which one is best suited for developinga human-machine interface (HMI) for a Quality Control System produced by ABB. Thethesis has created a number of design concepts to improve the usability of the HMI.These were based on usability issues found in a user study and a heuristic study ofthe current HMI. They were then implemented in a technology demonstrator using therecommended 3D visualization software.

ii
Contents
1 Introduction 1
1.1 Purpose . . . . . . . . . . . . . . . . . . . . . . . . . . . . . . . . . . . . 2
1.2 Process . . . . . . . . . . . . . . . . . . . . . . . . . . . . . . . . . . . . 2
1.3 Outline . . . . . . . . . . . . . . . . . . . . . . . . . . . . . . . . . . . . 3
2 Quality Control System 5
3 The 3D development process 7
4 Data visualization in 3D environments 11
4.1 Visualizing data . . . . . . . . . . . . . . . . . . . . . . . . . . . . . . . 11
4.2 Overview and Zoom . . . . . . . . . . . . . . . . . . . . . . . . . . . . . 12
4.3 Filtering . . . . . . . . . . . . . . . . . . . . . . . . . . . . . . . . . . . . 13
4.4 Details-on-demand . . . . . . . . . . . . . . . . . . . . . . . . . . . . . . 14
4.5 Relations . . . . . . . . . . . . . . . . . . . . . . . . . . . . . . . . . . . 14
4.6 History . . . . . . . . . . . . . . . . . . . . . . . . . . . . . . . . . . . . 14
4.7 Extraction . . . . . . . . . . . . . . . . . . . . . . . . . . . . . . . . . . . 15
4.8 Discussion . . . . . . . . . . . . . . . . . . . . . . . . . . . . . . . . . . . 15
4.9 Summary . . . . . . . . . . . . . . . . . . . . . . . . . . . . . . . . . . . 15
5 Augmented reality 17
5.1 Background . . . . . . . . . . . . . . . . . . . . . . . . . . . . . . . . . . 17
5.2 Displays . . . . . . . . . . . . . . . . . . . . . . . . . . . . . . . . . . . . 18
5.3 Common pitfalls and design issues . . . . . . . . . . . . . . . . . . . . . 19
5.3.1 Object identification . . . . . . . . . . . . . . . . . . . . . . . . . 19
5.3.2 Object occlusion . . . . . . . . . . . . . . . . . . . . . . . . . . . 19
5.3.3 User interaction . . . . . . . . . . . . . . . . . . . . . . . . . . . 20
5.3.4 User acceptance . . . . . . . . . . . . . . . . . . . . . . . . . . . 20
5.4 Industrial case study . . . . . . . . . . . . . . . . . . . . . . . . . . . . . 20
5.5 Summary . . . . . . . . . . . . . . . . . . . . . . . . . . . . . . . . . . . 21
iii
iv CONTENTS
6 Method 23
6.1 User study . . . . . . . . . . . . . . . . . . . . . . . . . . . . . . . . . . . 23
6.1.1 Procedure . . . . . . . . . . . . . . . . . . . . . . . . . . . . . . . 23
6.2 Technology evaluation . . . . . . . . . . . . . . . . . . . . . . . . . . . . 23
6.2.1 Market scan . . . . . . . . . . . . . . . . . . . . . . . . . . . . . . 23
6.2.2 Deeper evaluation . . . . . . . . . . . . . . . . . . . . . . . . . . 24
6.3 Activity checklist . . . . . . . . . . . . . . . . . . . . . . . . . . . . . . . 25
6.4 Heuristic evaluation . . . . . . . . . . . . . . . . . . . . . . . . . . . . . 26
6.4.1 Procedure . . . . . . . . . . . . . . . . . . . . . . . . . . . . . . . 27
6.5 Brainstorming . . . . . . . . . . . . . . . . . . . . . . . . . . . . . . . . . 27
6.6 Design concepts . . . . . . . . . . . . . . . . . . . . . . . . . . . . . . . . 27
6.7 Technology Demonstrator . . . . . . . . . . . . . . . . . . . . . . . . . . 28
7 Results 29
7.1 Technology Overview . . . . . . . . . . . . . . . . . . . . . . . . . . . . . 29
7.2 Technology Evaluation . . . . . . . . . . . . . . . . . . . . . . . . . . . . 30
7.2.1 Adobe Director . . . . . . . . . . . . . . . . . . . . . . . . . . . . 30
7.2.2 Adobe Flash . . . . . . . . . . . . . . . . . . . . . . . . . . . . . 31
7.2.3 Microsoft Windows Presentation Foundation (WPF) . . . . . . . 32
7.2.4 OGRE . . . . . . . . . . . . . . . . . . . . . . . . . . . . . . . . . 33
7.2.5 JMonkey Engine . . . . . . . . . . . . . . . . . . . . . . . . . . . 35
7.2.6 Unity 3D . . . . . . . . . . . . . . . . . . . . . . . . . . . . . . . 36
7.2.7 Summary . . . . . . . . . . . . . . . . . . . . . . . . . . . . . . . 37
7.3 User Study . . . . . . . . . . . . . . . . . . . . . . . . . . . . . . . . . . 39
7.4 Activity Checklist . . . . . . . . . . . . . . . . . . . . . . . . . . . . . . 39
7.5 Heuristic Evaluation . . . . . . . . . . . . . . . . . . . . . . . . . . . . . 39
7.6 Brainstorming Session . . . . . . . . . . . . . . . . . . . . . . . . . . . . 39
7.7 Design concepts . . . . . . . . . . . . . . . . . . . . . . . . . . . . . . . . 39
7.7.1 Process overview . . . . . . . . . . . . . . . . . . . . . . . . . . . 39
7.8 Technology Demonstrator . . . . . . . . . . . . . . . . . . . . . . . . . . 40
8 Conclusion 41
8.1 Future Work . . . . . . . . . . . . . . . . . . . . . . . . . . . . . . . . . 41
8.2 Limitations . . . . . . . . . . . . . . . . . . . . . . . . . . . . . . . . . . 41
9 Acknowledgements 43
References 45
A 3D technology overview 49
A.1 Modeling tools . . . . . . . . . . . . . . . . . . . . . . . . . . . . . . . . 49
A.1.1 Cinema 4D . . . . . . . . . . . . . . . . . . . . . . . . . . . . . . 49
CONTENTS v
A.1.2 Google SketchUp . . . . . . . . . . . . . . . . . . . . . . . . . . . 49
A.1.3 Rhinoceros . . . . . . . . . . . . . . . . . . . . . . . . . . . . . . 49
A.1.4 Modo . . . . . . . . . . . . . . . . . . . . . . . . . . . . . . . . . 50
A.1.5 Milkshape . . . . . . . . . . . . . . . . . . . . . . . . . . . . . . . 50
A.1.6 AC3D . . . . . . . . . . . . . . . . . . . . . . . . . . . . . . . . . 50
A.1.7 Blender . . . . . . . . . . . . . . . . . . . . . . . . . . . . . . . . 51
A.1.8 Autodesk Maya . . . . . . . . . . . . . . . . . . . . . . . . . . . . 51
A.1.9 Autodesk SoftImage . . . . . . . . . . . . . . . . . . . . . . . . . 51
A.1.10 Autodesk 3ds Max . . . . . . . . . . . . . . . . . . . . . . . . . . 52
A.1.11 Newtek LightWave . . . . . . . . . . . . . . . . . . . . . . . . . . 52
A.2 Real-time 3D engines . . . . . . . . . . . . . . . . . . . . . . . . . . . . . 52
A.2.1 RealmForge . . . . . . . . . . . . . . . . . . . . . . . . . . . . . . 52
A.2.2 Visual3D.NET . . . . . . . . . . . . . . . . . . . . . . . . . . . . 52
A.2.3 Blade 3D . . . . . . . . . . . . . . . . . . . . . . . . . . . . . . . 53
A.2.4 Truevision 3D . . . . . . . . . . . . . . . . . . . . . . . . . . . . . 53
A.2.5 Microsoft Silverlight . . . . . . . . . . . . . . . . . . . . . . . . . 53
A.2.6 WebGL . . . . . . . . . . . . . . . . . . . . . . . . . . . . . . . . 54
A.2.7 Valve Source . . . . . . . . . . . . . . . . . . . . . . . . . . . . . 54
A.2.8 Google O3D . . . . . . . . . . . . . . . . . . . . . . . . . . . . . . 54
A.2.9 DX Studio . . . . . . . . . . . . . . . . . . . . . . . . . . . . . . . 54
A.2.10 Esperient Creator . . . . . . . . . . . . . . . . . . . . . . . . . . 55
A.2.11 Quest 3D . . . . . . . . . . . . . . . . . . . . . . . . . . . . . . . 55
A.2.12 Microsoft XNA . . . . . . . . . . . . . . . . . . . . . . . . . . . . 55
A.2.13 Trinigy Vision Engine . . . . . . . . . . . . . . . . . . . . . . . . 56
A.2.14 Torque Game Engine . . . . . . . . . . . . . . . . . . . . . . . . . 56
A.2.15 G3D Engine . . . . . . . . . . . . . . . . . . . . . . . . . . . . . . 56
A.2.16 Panda 3D . . . . . . . . . . . . . . . . . . . . . . . . . . . . . . . 56
A.2.17 Unigine . . . . . . . . . . . . . . . . . . . . . . . . . . . . . . . . 57
A.2.18 NeoAxis Game Engine . . . . . . . . . . . . . . . . . . . . . . . . 57
A.2.19 Unreal Engine . . . . . . . . . . . . . . . . . . . . . . . . . . . . 57
A.2.20 Adobe Air . . . . . . . . . . . . . . . . . . . . . . . . . . . . . . . 57
A.2.21 OpenSceneGraph . . . . . . . . . . . . . . . . . . . . . . . . . . . 58
A.2.22 Irrlicht . . . . . . . . . . . . . . . . . . . . . . . . . . . . . . . . . 58
A.2.23 Genesis 3D . . . . . . . . . . . . . . . . . . . . . . . . . . . . . . 58
A.2.24 Crystal Space . . . . . . . . . . . . . . . . . . . . . . . . . . . . . 59
A.2.25 Java FX . . . . . . . . . . . . . . . . . . . . . . . . . . . . . . . . 59

vi CONTENTS
List of Figures
1.1 Overview of project activities . . . . . . . . . . . . . . . . . . . . . . . . 2
3.1 First create static graphics in 3D modeling software . . . . . . . . . . . 8
3.2 Program the graphics in a 3D engine to make the environment alive . . 8
3.3 Compile, distribute and run . . . . . . . . . . . . . . . . . . . . . . . . . 8
3.4 Advanced overview of the 3D development process . . . . . . . . . . . . 9
5.1 Reality-Virtuality (RV) Continuum . . . . . . . . . . . . . . . . . . . . . 18
7.1 Evaluated technologies . . . . . . . . . . . . . . . . . . . . . . . . . . . . 29
vii

viii LIST OF FIGURES
Chapter 1
Introduction
Visualizing and presenting information to users is a significant part of product develop-ment. Today’s graphics in ABB’s software products are mainly in 2D. Standard GUItechnologies such as Microsoft WPF are often used in the development of product’s userinterfaces.
The goal of this master thesis is to explore the market for technologies used in 3Dgraphics development, evaluate these technologies and recommend a suitable tool. Thefinal part was to develop a demonstrator, using the selected technology, to demonstratea vision of how one of ABB’s products could present information in the future.
The tool in focus for the project was a Quality Control System from ABB. Theproduct uses a specific human-machine interface (HMI), currently implemented using2D graphics, to display information about the process. A part of the project was topropose concepts on how 3D graphics could solve some of the issues with this interface.
The 3D development process consists of three major steps; building graphics usingmodeling tools, programming the application to use the graphics, and finally compilingand deploying the application. This process in generalized but is applicable for most 3Ddevelopment processes. The evaluation of 3D tools focuses mainly on the second step:programming the application, and thus the software evaluated was different types of 3Dengines.
The evaluation of the engines was performed by first gathering general informationon commonly used software for 3D development. The next step in the process wasto narrow down the selection to the six technologies best fitting to ABB’s purposesaccording to nine criteria. These six technologies were then evaluated by one person fortwo weeks each and compliance to the criteria was tested. After the period ended therecommended technology was Unity 3D. It was chosen mainly for its high productivityand powerful library of functionalities.
Before and during the project a user study was conducted on users of the QualityControl System. The study sought to find out what the requirements were on a futureHMI, and what kind of issues the users of the current HMI experienced. The results fromthis study in combination with a heuristic evaluation of today’s HMI and a brainstormingsession resulted in a number of design concepts for a future interface. These designconcepts aims to resolve the issues found in the study.
The final part of the project was to implement a concept demonstrator in the rec-ommended technology (Unity 3D). The concept demonstrator is an application builtentirely using 3D graphics and it implements some of the suggested design concepts.
1
2 Chapter 1. Introduction
The purpose of the application is to propose how 3D graphics can be used in the futurefor visualizing data in an industrial process.
1.1 Purpose
This study was conducted upon request from ABB; the purpose was to evaluate how thecurrent HMI of one their Quality Control Systems could be improved using 3D graphics.
Tons of different engines can be found for creating 3D applications and some aremore or less useful, the challenge was to identify one that was powerful and productiveenough to meet the requirements of ABB’s production standards.
As one part of this project was to propose concepts on how to solve some issues withthe current user interface, the study provides a concept demonstrator. This demonstra-tor is an example of a future HMI in 3D, built in the recommended technology. Allconcepts are based on issues found in a user study that was realized within the scope ofthis project. Requests from ABB were also weighted into the design proposals.
1.2 Process
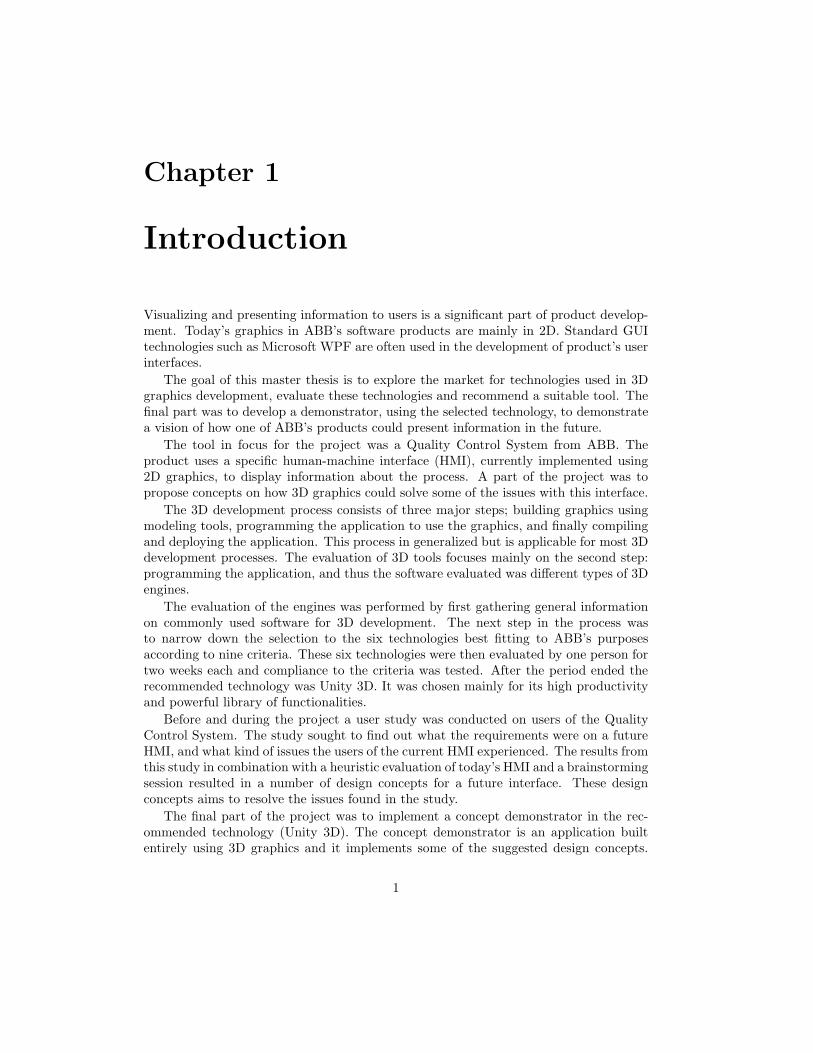
This is the initial time plan for the thesis work, it is shown in figure 1.1.
Figure 1.1: Overview of project activities
In the first phase, background information was gathered. Information was details onthe Quality Control System and its HMI and the 3D application development process.
In the next phase, the evaluation planning, a large list of 3D development technologieswas created and nine different criteria for evaluating them were decided.
During the 3D technology evaluation phase six technologies were evaluated accordingto the criteria in a deeper study. Once this phase was done, one technology was chosenfor recommendation.
1.3. Outline 3
The HCI planning phase consisted of analyzing the current HMI, the user study andanalyzing the method of the user study.
The interface design phase consisted of analyzing the results from the HCI planningphase, and creating design concepts for the upcoming technology demonstrator.
The final phase of the project consisted of creating a technology demonstrator in therecommended technology.
1.3 Outline
This is a description of the contents in each chapter of this report.
Quality Control System This chapter describes one part of the background research.It contains information about the specific ABB Quality Control System; its pur-pose, how it is used and its current graphical user interface.
The 3D development process This chapter describes the necessary steps in the pro-cess of creating a 3D application.
Data visualization in 3D environments This chapter holds information of infor-mation visualization systems and how usability should be considered when creatinga technology demonstrator for this project.
Augmented reality A general overview of the concept of Augmented Reality and anin-depth survey on how it could be applied in a future HMI of the Quality ControlSystem.
Method This chapter covers the methods used in the various phases of the project.This includes the user study, brainstorming session, heuristic evaluation and thedevelopment of the technology demonstrator.
Results This is the results of the project including results from the 3D technology eval-uation, the heuristic evaluation, the user study and a number of design concepts.
Conclusion This chapter is a conclusion of the results. It answers the research ques-tions from the introduction and presents future work and limitations.

4 Chapter 1. Introduction
Chapter 2
Quality Control System
CENSORED BY ABB CORPORATE RESEARCH.
5

6 Chapter 2. Quality Control System
Chapter 3
The 3D development process
A part of the background research consisted in finding out how to develop 3D appli-cations. This chapter describes important steps and the general procedure of creatingsuch software.
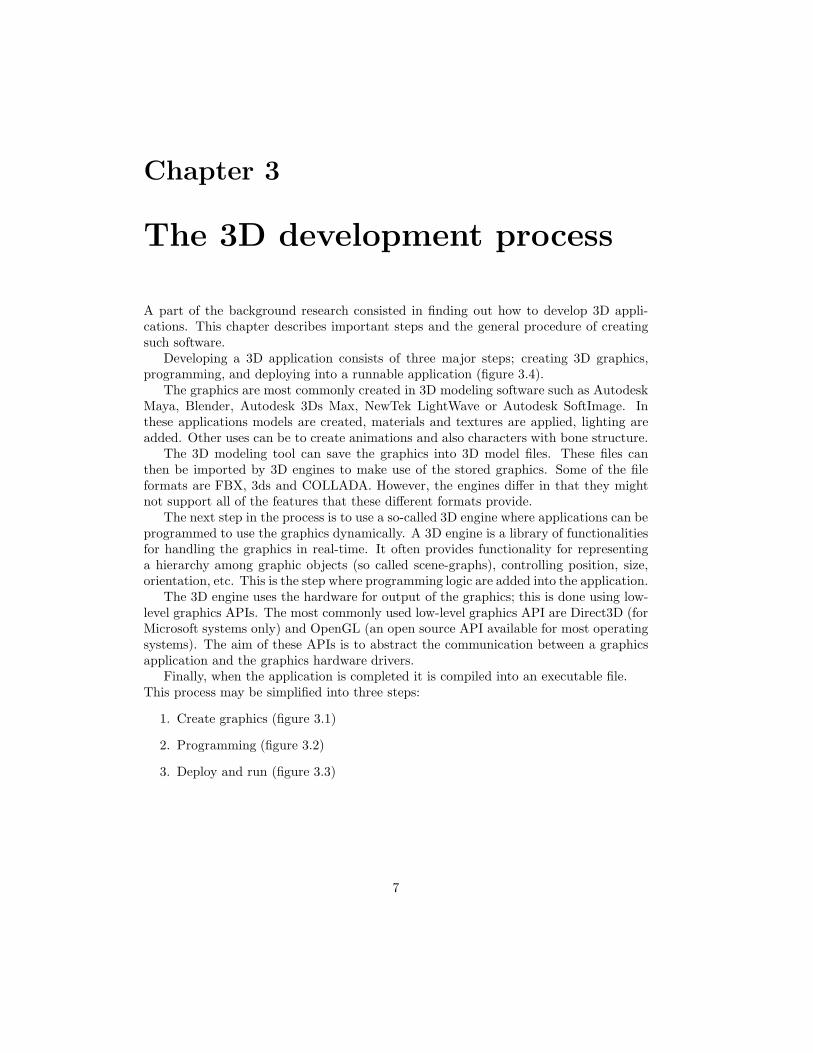
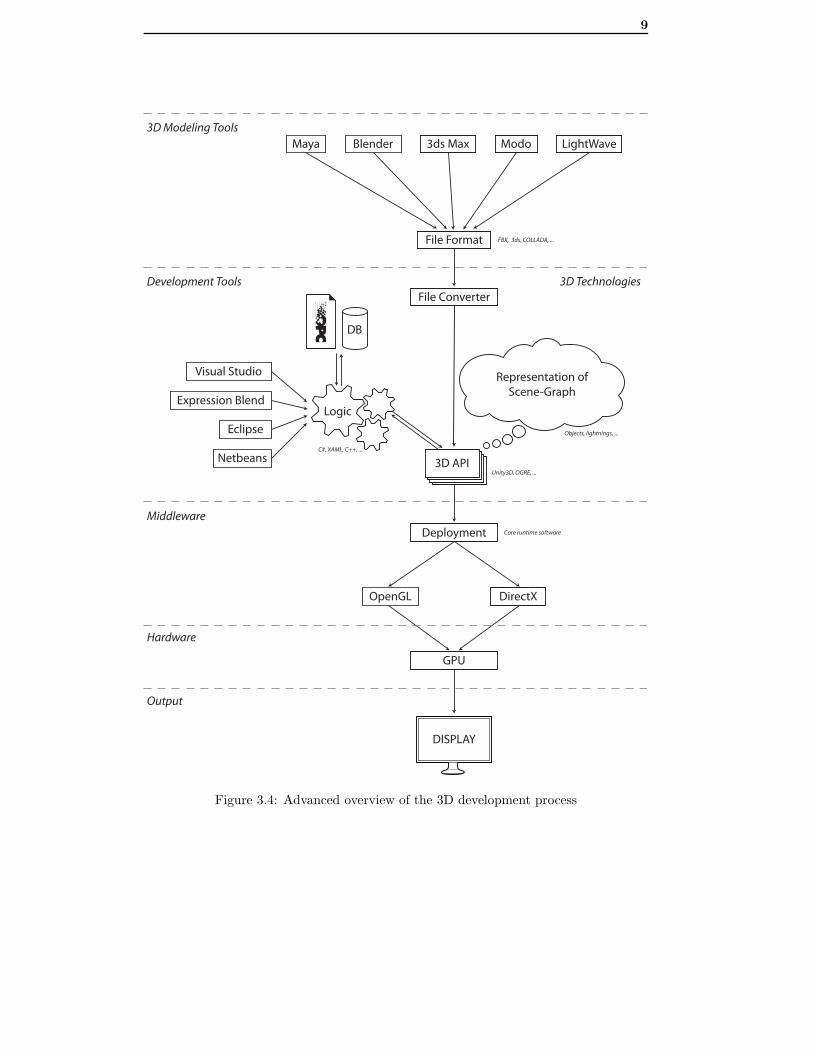
Developing a 3D application consists of three major steps; creating 3D graphics,programming, and deploying into a runnable application (figure 3.4).
The graphics are most commonly created in 3D modeling software such as AutodeskMaya, Blender, Autodesk 3Ds Max, NewTek LightWave or Autodesk SoftImage. Inthese applications models are created, materials and textures are applied, lighting areadded. Other uses can be to create animations and also characters with bone structure.
The 3D modeling tool can save the graphics into 3D model files. These files canthen be imported by 3D engines to make use of the stored graphics. Some of the fileformats are FBX, 3ds and COLLADA. However, the engines differ in that they mightnot support all of the features that these different formats provide.
The next step in the process is to use a so-called 3D engine where applications can beprogrammed to use the graphics dynamically. A 3D engine is a library of functionalitiesfor handling the graphics in real-time. It often provides functionality for representinga hierarchy among graphic objects (so called scene-graphs), controlling position, size,orientation, etc. This is the step where programming logic are added into the application.
The 3D engine uses the hardware for output of the graphics; this is done using low-level graphics APIs. The most commonly used low-level graphics API are Direct3D (forMicrosoft systems only) and OpenGL (an open source API available for most operatingsystems). The aim of these APIs is to abstract the communication between a graphicsapplication and the graphics hardware drivers.
Finally, when the application is completed it is compiled into an executable file.This process may be simplified into three steps:
1. Create graphics (figure 3.1)
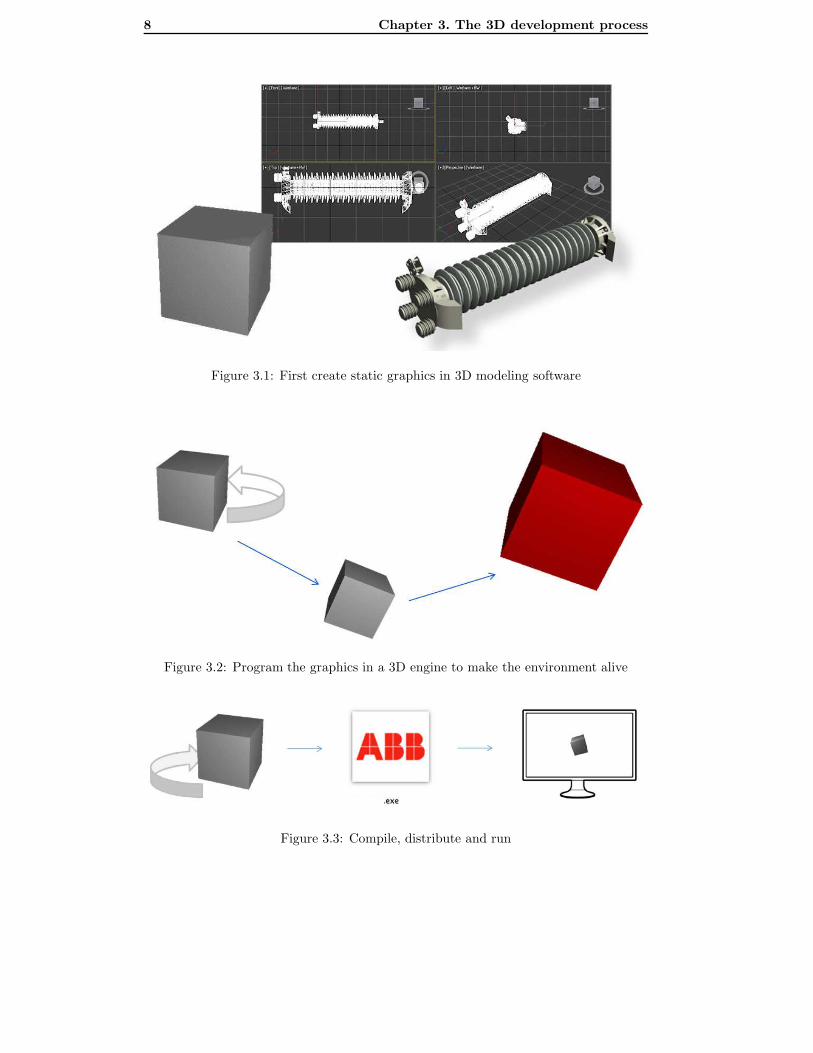
2. Programming (figure 3.2)
3. Deploy and run (figure 3.3)
7
8 Chapter 3. The 3D development process
Figure 3.1: First create static graphics in 3D modeling software
Figure 3.2: Program the graphics in a 3D engine to make the environment alive
Figure 3.3: Compile, distribute and run
9
Maya Blender LightWaveModo3ds Max
File Format
File Converter
FBX, 3ds, COLLADA, ...
Deployment Core runtime software
OpenGL DirectX
GPU
Visual Studio
Expression BlendLogic
C#, XAML, C++, ...
Eclipse
Netbeans 3D APIUnity3D, OGRE, ...
DB
Middleware
Development Tools
Hardware
Output
3D Modeling Tools
3D Technologies
Representation of
Scene-Graph
Objects, lightnings, ...
DISPLAY
Figure 3.4: Advanced overview of the 3D development process

10 Chapter 3. The 3D development process
Chapter 4
Data visualization in 3Denvironments
When building an artifact that in some way interacts with a human, the usability ofthe interaction is important in order to avoid usage problems with annoyance, time-consuming tasks and in some cases safety issues [18]. This does of course also applyto computer software with graphical user interfaces. In this thesis we are interested inbuilding a user interface that is based on 3D graphics. The purpose of this section is tofind out how the system could be designed in order to provide good usability. Workingwith 3D graphics gives the designer a different kind of toolset for providing functionalityadapted to users’ needs than with compared to 2D graphics, so. So what can this toolsetbring to the table in terms of usability? This short review attempts to find interestingexamples of usable functionality that can be achieved in 3D environments, and alsoexamples and recommendations on how 3D graphics can provide better usability ingeneral in a graphical user interface.
A goal of this thesis is to design a conceptual system that visualizes data, so the firststep was to find fitting guidelines on what is important when designing such a system. Acommonly adopted set of guidelines is Schneiderman’s taxonomy for data visualization[29]. He describes seven important tasks that a user will perform when interacting witha system for data visualization.
It is desirable to provide good usability in the interface and therefore an article studywas made to find fitting functionality or guidelines that could be used in the system inorder to fulfill the requirements of these tasks.
4.1 Visualizing data
An article by Schneiderman, 1996 discusses how to visually represent data of differenttypes and what methods of representation that is commonly used and are suitable foreach type [29]. He claims that there are seven different tasks that are important whenworking with data; Overview, zooming, filtering, details-on-demand, relations, historyand extraction. Each of these tasks is important for the user’s performance and forthe understanding of a system, and therefore the system’s support for performing thesetasks should be well designed.A short description of each of these tasks follows.
11
12 Chapter 4. Data visualization in 3D environments
Overview is the task of gaining an overview of a collection of items. Along with anoverview there is need for navigation tools to navigate through the data.A Zoom function is useful for getting a detailed view of items of interest. Smooth zoom-ing helps users preserve their sense of position and context.A filter for filtering out uninteresting items. Allowing the user to eliminate unwanteditems will reduce the risk of information overload.Details-on-demand. Details should be available when the user needs them.Relations. The relations between different items displayed should be apparent.History. A history of actions should be kept, in order to support undo, redo and pro-gressive refinement.Extraction. It should be possible to extract data for uses outside of the system, such assaving to a file for emailing, printing etc.
In order to make sure that software for data visualization provides good usability,all these tasks should be supported with carefully designed functionality. As this thesisaims to make a design proposal of such a system, each of these tasks will be consideredin the design. The rest of this study attempts to find examples of functionality for 3Dsystems that can be used to fulfill each of these tasks.
4.2 Overview and Zoom
Overview and zoom are both concerned with the navigation in an information visualiza-tion system. A number of suggestions are described below that show how the navigationcould be handled in terms of both overview and zoom, which is why they both have beencombined into a single chapter.
One problem when navigating through a 3D interface is that the wrong combinationof navigation operations can make the user lose orientation. For example, when anobject is zoomed in, the pivot point for rotation can be outside of the current view. Ifthe user then uses an orbiting tool, the camera moves around the pivot point and thuscauses the object to move out of the view. These kind of problems are common fornovices, but are sometimes also encountered by more experienced users [23].
Some approaches to solve these issues are presented in an article by (Fitzmaurice,2008). A number of tools for navigation in CAD software have been developed, and someof the classical tools have been redesigned in order to provide ”safe” 3D navigation thatkeeps the user away from losing orientation. The tools were developed over a time oftwo years, and have been thoroughly tested. The end result of the study show that theuse of these tools can help new users in learning to use 3D software, as well as improvingthe usage experience for expert users.
There are three different toolsets for 3D navigation described in the article. A shortdescription of the functionality of each tool is provided below
The View Object tool has four functions: Center, Zoom, Orbit and Rewind. TheCenter function sets the pivot point of the model with a single mouse click; this pivotpoint is used by orbit and zoom. There is no point zoom, i.e., zooming in towards thelocation of the mouse pointer. Such a function could cause the user to zoom in besidethe object and thus making it disappear from view, instead zooming always focuses onthe pivot point. The orbit tool lets the user circle around the object using the mouse,this function occupies a larger space in the control bar than the other tools, in order toshow that it is more important and more frequently used than the others.
The Rewind tool is available in all toolsets, and lets the user see a history of cameraactions. The history is displayed through thumbnails of old camera states. The user
4.3. Filtering 13
can reset the camera to a particular state by clicking it. This feature was appreciatedby both beginners and experienced users in the tests.
The Tour building tool also has four functions; Forward, Look, Up/Down and Rewind.The forward tool is used to move the camera closer to an object. One mouse clickmoves the camera 50% closer to the point chosen on the object’s surface with a 0.5 secanimation. If the mouse button is held down, a slider appears that can be used to movetowards and from the object. The closest the camera can be moved towards the objectis 95% of the distance between the starting point and the object; this is to prevent theuser from seeing through the graphics. The Look tool lets the users turn the camerato look around, like they would turn their own head. The Up/Down tool acts like anelevator and provides a graphical slider that allows the user to adjust their height inthe scene. The forward tool is the largest of the tools in this toolset, again emphasizingimportant and frequently used tools.
The Full toolset has all the previously described tools available with a few changes.Instead of Forward it has a Walk function that lets the user move forward at the sametime as changing the viewing direction. The zooming function in this toolset is a pointzoom, which means that the zoom function centers on the position of the mouse pointerin the view when zooming in.
In the article, some users (some of which were experienced Photoshop users) hadtrouble with orienting themselves in a 3D environment. When the view changed withoutany animated camera rotation or movement they lost their orientation. This problemcould probably be avoided by illustrating the camera movement with an animationwhen views change in the 3D application, and thus make the users understand how thedifferent views are related. This is shown to reduce the cognitive load of understandingthe transitions between pre-zoomed and post-zoomed state in [14].
The article makes a comparison between graphical icons and text. When there aremany graphical icons with no text, a new user of the system can get confused and findit difficult to understand the purpose of each icon. To resolve this problem, text wasused instead of icons to describe functionality in the system. This removes the need forinexperienced users to learn the meaning of several new graphical icons.
Error prevention is a part of usability in an artifact, by preventing errors time, effortand annoyance can be saved. Some examples of error prevention are that the user wasnot allowed to move forward through an object and not moving too far from it. Anotherexample was cursor wrapping; when the cursor were at the far end of the screen, theposition was reset at the other end. This lets the user for example use the Orbit toolwithout the screen limiting the amount of movement that can be performed.
4.3 Filtering
Filtering is an important issue in information visualization systems; it lets the user filterout irrelevant data and focus on important information. If there is no filtering functionavailable and the amount of data is large, the user can experience information overload[25]. Another important reason for having filtering is the occlusion problem. This is aphenomenon that occurs when objects in the foreground cover (occlude) objects behindthem, further back in the environment.
There are many attempts to solve this problem, and one of them is called the Bal-lonProbe [15]. The principle of this technique is that the user selects a point in 3Dspace, preferably in an area with a high population of objects; this point is the center of
14 Chapter 4. Data visualization in 3D environments
the balloon and the objects are then ”exploded” out to the surface of the balloon, thusgiving the user a better overview of what objects that are available.
Other common approaches are transparency and layers. An attempt with semi-transparency was made by Marcus (2003) in order to provide filtering. The intentionwas to make irrelevant objects in the foreground see-through to shift the focus to moreimportant objects in the background. The article claims to have overcome many of theshortcomings of traditional 3D data visualization systems such as occlusion.
In the recommended 3D development software it is possible to add layers to a scenein a 3D application [10]. Layers are commonly used in 3D engines, and are often used bycameras to only render parts of a scene, and by lights to selectively illuminate objectsin the scene. It is also used in cases where ray casting is used for collision detection;the objects in certain layers of the scene are not taken into account when detectingcollisions. Layers contain graphical objects and can be turned on and off in cameras etc.during runtime using code.
4.4 Details-on-demand
When the user has found information using the overview, zoom and filtering functions,he/she will want to see the details of the selected items. Detailed information shouldnot be provided at all times, but the user should always have the ability to accessinformation when it is needed in order to reduce the risk for information overload [25].
The display of detailed information about current selections could be provided in awindow on the side. This was used to provide information in Marcus, 2003 [23]. Someof the users in the study (chapter 2) suggested that help could be provided about someparts of the interface by using a combination of pressing keys on the keyboard andclicking a component of the interface with the computer mouse. The users did not wantto read the manual of the HMI, but they believed that if the information was availabledirectly in the interface they would be more likely to use it.
4.5 Relations
Relations between information and objects should be displayed in such a way that auser can see the connection. In most articles reviewed here, the primary ways of dealingwith inter-object relations were to use colors, size, focus and grouping, when displayingdata, such as in Marcus (2003) [23]. E.g., this could be used to map out which objectsin the environment are related, by organizing them in groups where they are in closeproximity, or displaying them in the same color when the user needs to know which onesthat are related.
This is used in Chang, D 2002 [13] to improve learning in an interface. Some ofthe laws of gestalt theory are the law of balance, continuation, closure, proximity andsimilarity. These laws could be used to organize and design the interface in order toprovide information about relation among objects. Related objects should be kept inclose proximity.
4.6 History
Functionality that covers history-related tasks is important in order for users to havecontrol over their work in the software. History related tasks are for example undoing
4.7. Extraction 15
and redo functionality that allows a user to revert from a faulty decision. The ”rewind”function described in the overview and zoom chapter, as part of the overview function,is one example. This functionality allows the user to see a history of camera states andrevert to those states by clicking a thumbnail picture.
Besides navigation in 3D space, there are few tasks that could implement undo andredo functionality. Almost all changes and inputs made in the HMI cause actions in thephysical system and can therefore not be undone.
4.7 Extraction
At this stage the design is focused on representation and user interaction. Extractionfeatures will be added in the future. Examples of extraction for this application couldbe CENSORED BY ABB CORPORATE RESEARCH.
4.8 Discussion
When looking at the amount of research found on each of Schneiderman’s [29] tasksrelated to usability in 3D, it can be noted that the most research has been performed onnavigation in 3D environments and how to keep the user from losing his/her orientation.However, this is not very strange, as overview is the least abstract and context-dependenttask of those listed in the taxonomy [29]. For example, it is hard to find general conceptson how to provide details-on-demand and filtering that can be applied to any system,as they have to be very system specific. It can be differences in what type of datais displayed, how it is measured; bars, graphs etc. and therefore these tasks must bedesigned individually for each system and then tested for usability and evaluated insteadof using concepts from other systems.
4.9 Summary
The literature that was reviewed in this study suggests that an interface built with3D graphics can benefit from a number of concepts. The tasks for viewing data in asystem should be divided in the categories Overview, Zoom, Filter, Details-on-demand,Relations, History and Extraction. And for most of these categories, examples of howthe interaction can be designed have been found in the study.
Overview & Zoom Concepts that could be used for supporting this kind of task areones described under the overview chapter for users new to 3D navigation, forexample the View object and the Tour building toolsets. These are designed tokeep the users from losing their orientation which could be useful for a future HMIfor the Quality Control System. The users of the HMI should not need to beexperienced with 3D navigation to be able to use the interface.
Filter There are at least two different scenarios in the design proposal of this thesisthat could require filtering: CENSORED BY ABB CORPORATE RESEARCH.
The second would be when the user wants to monitor a particular function of thesystem; in this case the data from all the other functions would be irrelevant andthus should be filtered out.
16 Chapter 4. Data visualization in 3D environments
In the Filter chapter, a layering system in Unity 3D is described. This could beused for filtering by creating a number of layers in the application and add relatedobjects to each one. Then the user will only see the currently relevant layers whileusing the application.
Details-on-demand To provide details-on-demand in the design, detailed informationcould be provided on the side of an object when it is selected. Another solutionwould be to use a search function in the interface that finds information from themanual, and all sources of information that could be relevant for the user. Searchresults could be settings, visible objects in the view and manual information.
Relations In the design proposal, relations are displayed by providing preset views thatcan be automatically zoomed in on. When a view is selected, the camera zoomsin and displays only objects relevant for that view. These objects are placed inclose proximity and irrelevant objects are filtered out.
History By providing the users with a ”rewind” function in the interface, they canstep back through history and reset camera angles and positions. This would giveusers an additional degree of freedom in the use of the system, as they can enterany view of their choice without the need to worry about whether or not they canreturn from a view.
Extraction As stated in the Extraction chapter, this is not a relevant issue at this timefor the system. Possible extraction functionality could be CENSORED BY ABBCORPORATE RESEARCH.
Chapter 5
Augmented reality
Virtual Reality (VR) and 3D visualization is one approach for visualizing informationin a way that is natural for the user. By making information appear in a familiar way,things become easier to understand [17]. Augmented Reality (AR) is a way of creating avirtual reality which augments the real world and creates a mix of reality and computer-generated images. AR allows real-time overlaying of visual objects on the real world,providing an augmented knowledge about the surrounding world.
Today AR systems are commonly seen using the combination of sense of sight andvisual virtual information, but in fact; AR is based on any sense. Examples of AR couldbe speed information about passing cars projected onto the wind shield for a driver, ora real-time language translation system built into a pair of headphones.
This study focuses on vision and investigates if it’s possible to apply this approachto improve ABB’s Quality Control System. What issues must be taken into accountwhen building such industrial AR system?
This chapter is structured as follows. First, we will look into AR, mixed reality andcommon AR displays. Second, an industrial research study will be reviewed. Basedon the article studies, a conclusion will be drawn concerning implementation for ABB’sQuality Control System.
5.1 Background
In 1964 Ivan E. Sutherland invented the first see-through head-mounted display (HMD)system [11]. The HMD was primitive and the user’s virtual environment were builtwith simple wireframes, displayed in two miniature CRT’s. Since then, the AR area hasgrown significantly. Thanks to today’s development tools [3] and computer performancethe availability of technologies for AR has increased dramatically. AR is used in a widerange of areas, both research and profitable applications. The systems used nowadaysare far more complex and diverse.
When research was started, AR was lacking a definition. Soon both Azuma andMilgram made great effort to establish such criteria. Azuma et al. describes AR asbased on any sense if the following criteria are fulfilled;
– combine real and virtual objects in a real environment;
– run interactively in real-time;
17
18 Chapter 5. Augmented reality
– and register real and virtual objects with each other [24].
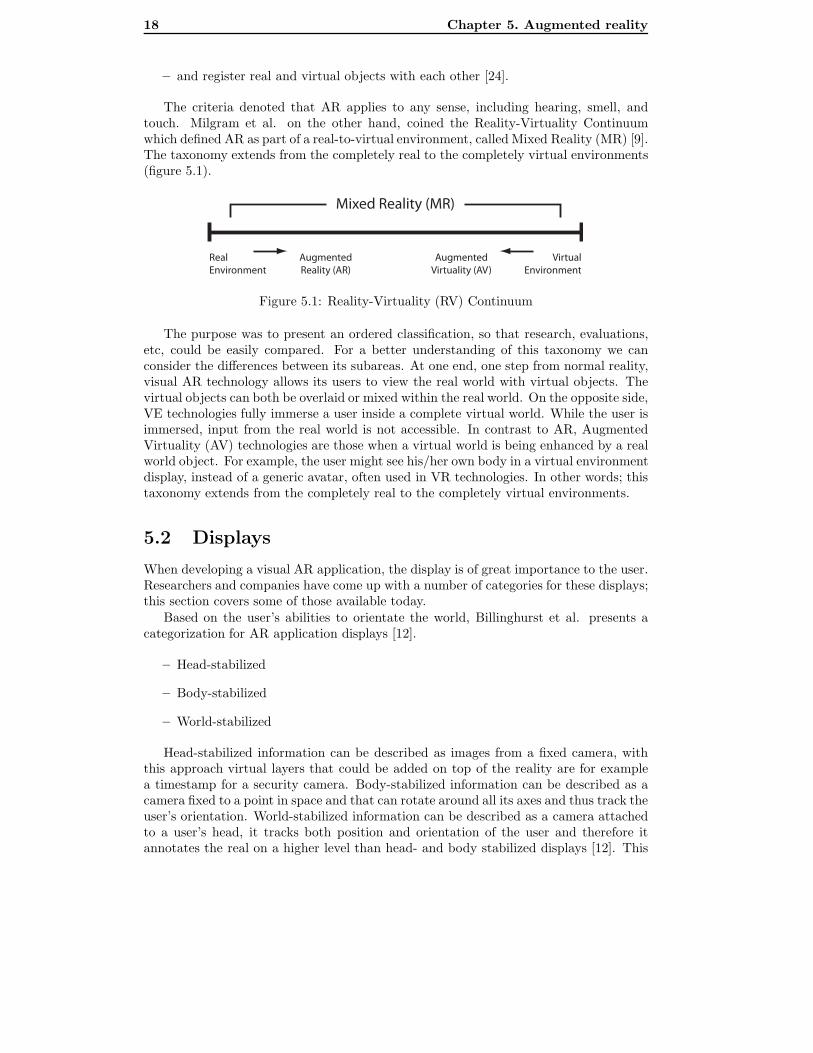
The criteria denoted that AR applies to any sense, including hearing, smell, andtouch. Milgram et al. on the other hand, coined the Reality-Virtuality Continuumwhich defined AR as part of a real-to-virtual environment, called Mixed Reality (MR) [9].The taxonomy extends from the completely real to the completely virtual environments(figure 5.1).
Mixed Reality (MR)
Real
Environment
Augmented
Reality (AR)
Augmented
Virtuality (AV)
Virtual
Environment
Figure 5.1: Reality-Virtuality (RV) Continuum
The purpose was to present an ordered classification, so that research, evaluations,etc, could be easily compared. For a better understanding of this taxonomy we canconsider the differences between its subareas. At one end, one step from normal reality,visual AR technology allows its users to view the real world with virtual objects. Thevirtual objects can both be overlaid or mixed within the real world. On the opposite side,VE technologies fully immerse a user inside a complete virtual world. While the user isimmersed, input from the real world is not accessible. In contrast to AR, AugmentedVirtuality (AV) technologies are those when a virtual world is being enhanced by a realworld object. For example, the user might see his/her own body in a virtual environmentdisplay, instead of a generic avatar, often used in VR technologies. In other words; thistaxonomy extends from the completely real to the completely virtual environments.
5.2 Displays
When developing a visual AR application, the display is of great importance to the user.Researchers and companies have come up with a number of categories for these displays;this section covers some of those available today.
Based on the user’s abilities to orientate the world, Billinghurst et al. presents acategorization for AR application displays [12].
– Head-stabilized
– Body-stabilized
– World-stabilized
Head-stabilized information can be described as images from a fixed camera, withthis approach virtual layers that could be added on top of the reality are for examplea timestamp for a security camera. Body-stabilized information can be described as acamera fixed to a point in space and that can rotate around all its axes and thus track theuser’s orientation. World-stabilized information can be described as a camera attachedto a user’s head, it tracks both position and orientation of the user and therefore itannotates the real on a higher level than head- and body stabilized displays [12]. This
5.3. Common pitfalls and design issues 19
type can be used for giving additional information to a fighter pilot inside their helmetetc.
When it comes to devices itself, Azuma et al. distinguishes three types: head-worn displays (HWD), handheld displays and projection displays. HWD displays aremainly presented in front of the user’s eyes (called HMD when used in VR) and areused in several industrial AR projects today [28]. There are two common see-throughapproaches for HWD’s. Video see-through captures the reality environment with helpof a camera and displays it with an LCD, or any equivalent displaying technique. Theoptical approach, on the other hand, eliminates the video part by adding an optical layer,known. This means that the users see the reality with their own eyes, but through atransparent layer that acts as a display. This approach is commonly used in militaryflight cockpits.
Handheld displays are of a type that is becoming increasingly more common. Thisderives from the modern mobile phones and wearable computers available for customersnowadays. Modern phones and computers are often shipped with built in cameras,which makes it easy to present a video see-through system. Commercial applicationsfor Apple iPhone for instance are under development that is intended for navigation[6]. The application recognizes locations by using the phone’s built in camera, GPS andcompass and displays information such as distance and names.
Finally, projection displays shows the desired information right upon the real worldobject One interesting approach is laser head-up displays. These displays are availablefor vehicles, and work by projecting information directly onto the wind shield. Driversget valuable information such as driving assistance and speed information, by overlayingthe real world.
5.3 Common pitfalls and design issues
This section presents common pitfalls and design issues that researches have shown aresignificant.
5.3.1 Object identification
Tracking mechanisms in AR systems are of great relevance for obtaining a highly func-tional environment. For example, positioning of real-world objects requires correct reg-istrations for displaying proper information onto it. However, registration errors areoften unavoidable [11]. Under such conditions, error estimation is useful. By estimatingvirtual object’s position in real-world, changes in view may give enough info for keepingan acceptable position tracking. One common approach is to add artificial or physicalmarkers to the environment, often black and white symbols in a very specific pattern.Marker tracking is widely applied in both commercial and non-commercial systems.These solutions are straight-forward, less time consuming, and cost-effective in mannerof performance [20] [3]. Studies show that deterministic environments (such as indoorusages) are functioning better for tracking mechanisms [9].
5.3.2 Object occlusion
Several AR systems use virtual objects to overlap the real world. These systems areeasy to implement and straight-forward. However, important information of the realworld risk getting occluded using overlaid virtual objects. Correct occlusion is needed
20 Chapter 5. Augmented reality
to provide an authentic real environment superimposed with virtual objects for the user.This is vital for achieving a correct view of objects’ position [31].
Numerous methods for estimating correct object occlusion involving real and virtualobjects are available. Zhu et al. uses model registration to construct a virtual repre-sentation of the real environment [31]. In order to estimate depth, two different cameraangles are used. Results show that this approach can efficiently and correctly registerboth virtual and real objects in an AR environment.
5.3.3 User interaction
Since AR present a way of displaying information next to the real world, researchersoften claim that the interaction techniques also need to be revisited. 2D graphics canbe difficult to present in such real-world environments. Interaction design and usabilityhave been mainly focused on 2D graphical interfaces and virtual environments. ARsystems can be very different from time to time as the physical environment change;positions of objects, angles etc is not always the same. An approach to interacting withsuch a system is by using tangible interfaces [20] [11] [22]. Tangible interfaces presentthe user interfaces as a virtual tool in the real environment, instead as for example astatic 2D button. Interaction with objects is designed to imitate physical manipulationof objects. By using such an approach the interaction becomes more integrated withthe reality, which is shown in Looser et al.’s [22] work.
5.3.4 User acceptance
According to Nilsson and Johansson [26] attention must be put on creating user accep-tance towards AR technology. By providing a smooth integration between virtual andreal world objects, Liarokapis et al. claims that a high accuracy and rendering qualityis key elements for a successful system, that is, the system must appear as believable tothe user. They claim that tracking of light sources and correct reflections applied to thevirtual objects is one solution. Also realistic shading and shadowing of those objects areof importance for the users to accept the system.
5.4 Industrial case study
A study by Traskback and Haller [30] illustrates some important issues to address whendesigning an AR system for an industrial environment. They introduce AR into asafety-critical environment; an oil refinery. Oil refineries are demanding environmentsand require highly trained personnel. The purpose of their study was to train employeesin a specific refinery process with the help of AR. The ultimate goal was to develop ausable training application which could be used during processing.
In order to reveal user requirements for such an AR system a field observation wasconducted in the refinery. The study revealed a number of interesting requirements,which the application needs to meet in order to be efficient and usable:
– The AR tool should not draw the user’s attention while the trainee moves aroundin the refinery.
– It is of great importance that the AR system is wearable, accurate, and can workin harsh environmental conditions.
5.5. Summary 21
– The user interface must offer information on the flow direction in the pipes.
A safety-critical and large environment needs to take these requirements into accountin addition to basic user requirements.
5.5 Summary
In this article study we have seen that there are multiple displays and ways of orientatingthe user in an AR system. AR enhances a user’s perception of the real world. The virtualobjects display information that the user cannot directly detect with own senses andhelps a user to perform real-world tasks.
The literature study does also show that AR applications have multiple error sources.Common pitfalls are object identification, interaction, occlusion avoidances of real worldobjects, etc. When it comes to the scope of preventing tracking errors, the article studyshows that fixed indoor environments is well suited for AR applications. This will limittracking mechanism issues and more. Other benefits of having a static or semi-staticenvironment are the ability to reach realistic lightning and reflections on visual objectsto obtain a realistic view. Imagine an operator or engineer receives an alarm, insteadof stopping the whole production the information can be visualized in relation to thespecific real object using an AR interface. For instance, information that is encapsulatedbehind covers etc can be viewable for the operator.
When designing AR applications, it is important to consider how to make the inte-gration of real and virtual as seamless as possible. Each application must choose the bestcombination of techniques for detecting information from the real world and presentingelectronic information to the user.
CENSORED BY ABB CORPORATE RESEARCH.In future, operators might find the window in the control room as a perfect spot
for both receiving and interacting with information. For example, using a projectiondisplay would allow see-through capabilities.
We have seen an interesting head-up laser display for in-vehicle use. This kind ofnon-mounted solution is appealing for use on the control room window, but there aremultiple limitations with this approach. For example, how should the system verify theoperator’s orientation to achieve appropriate alignment of virtual objects? Thus, howshould two operators be able to use this technique accurately? Probably alarm systems,etc would be easier to use instead of positioned virtual contextual data.
However, the control room is an ideal spot to begin looking into AR for solving bothusability and monitoring issues for the future.

22 Chapter 5. Augmented reality
Chapter 6
Method
6.1 User study
Prior to our arrival in ABB’s project a number of field studies and interviews with usersof the Quality Control System interface were performed [27]. The results from this studywere made available for the authors of this report.
The purpose of using these results is to identify important issues with usage of thesystem. This information is also important in order to know which areas of the graphicaluser interface that should be in focus.
A field study is conducted in the user’s natural environment, where the system inquestion is used. This type of study can reveal tacit knowledge, which is knowledge thatcan only be revealed in an environment that the user is familiar with. These are thingsthat the users themselves aren’t aware of, for example habits, and company culture.
Other pros with this approach are that the user can feel more comfortable whenanswering questions in a well known environment. This provides more accurate results.
6.1.1 Procedure
CENSORED BY ABB CORPORATE RESEARCH.
6.2 Technology evaluation
6.2.1 Market scan
The first step in the technology evaluation was to perform a market scan. The initialstudy (or market scan) was performed by gathering data on 3D development software toget a large list of names with a brief description of relevant information for each. Thiswas done by searching on the Internet, in forums and on relevant sites. When the listwas done, six technologies were chosen for deeper evaluation.
The following criteria were established in cooperation with the project group at ABBCorporate Research, they were used to select technologies for deeper evaluation.
Support Support should be provided for the developers. Documentation such as man-uals, tutorials and examples must be included either in the tool or be easily ac-cessible online.
23
24 Chapter 6. Method
Licensing The license for a technology is optimally free of cost for development anddistribution. Source code should be included with the license.
Productivity It should be time efficient to develop applications in the tool. The soft-ware should give the developer good feedback. Examples are error, and graphicshandling (position, rotation, etc).
Established Technology The technology should be commonly used in modern appli-cations. The company or organization that produces the tool must have existedfor several years, with a stable history.
Performance The technology should make use of the computers’ hardware for accel-erating the graphics.
Installation The installation must be easy to perform and deployable applications mustbe stable for future system updates. There should not be any need for a server forrunning the software.
Deployment The technology should preferably be deployable on all computer plat-forms (Windows, Linux and Mac) and also in some kind of web format that canbe run on all popular internet browsers.
Development procedure Development should be done in a modern and commonlyused high level language, e.g. C++, C# or Java that has an official API easilyaccessible. It should be possible to write the code in a powerful editor such asMicrosoft Visual Studio 2008 or Eclipse.
3D Visualization Capabilities The technology has to support 3D graphics in a non-limiting way. There should be libraries for graphical features without the needfor creating them yourself. It is important that the engine can import the mostcommonly used graphic formats (3ds Max, Maya, Blender, etc).
6.2.2 Deeper evaluation
The in-depth studies of the technologies chosen in the market scan were performed by oneperson for two weeks per technology. Trial versions of each technology was obtained bydownloading them from their respective websites, and installed on a Windows computer.The procedure was to explore the possibilities with the technology and evaluate it furtherwith the criteria from the market scan.
The explored issues were: support for importing graphics from modeling software,adding lighting to the scene, implementing movement and control of objects and thecamera (for example: spinning around the object with the mouse), accessing propertiesof objects and using external libraries.
A grading system was used to rate the technology’s compliance with each criterion.A number ranging from 1 - 5 is set for each of the criteria described above, for eachtechnology. The grades are then summarized to represent an overall grade of the tech-nology. As there are 10 criteria the maximum grade is 50 for a single technology.
The grading scale is described below.
Score 1: Very low or no compliance with this criteria
Score 2: Low compliance with this criteria
6.3. Activity checklist 25
Score 3: Average, the expected level
Score 4: Better than expected
Score 5: Impressing and beyond expectations
The 3D technology with the highest grade was recommended and used for an imple-mentation of a conceptual future HMI.
6.3 Activity checklist
When designing systems, it is important to have an understanding of the context inwhich computer-related tasks are performed. This knowledge can reveal what users do,and how they most effectively can make use of a technology.
This kind of understanding should be gained before the design process has progressedtoo far, while it still is easy to modify and improve the design [19].
This type of contextual knowledge can be gained using activity theory [19] and theactivity checklist [19]. Activity theory is a framework of theories for understanding thehuman mind, claiming that the human mind can only be understood in the contextof human interaction with the world, and that activities are socially and culturallydetermined.
The activity checklist is a tool for analyzing an existing system or for supportingdevelopers in designing a new system. It helps the evaluator comprehend how the usersuse the system. The structure of the checklist reflects five basic principles of the activitytheory, and by using it one can ensure that most aspects of the theory have been coveredin the analysis of the system.
In this thesis the activity checklist is used for evaluating a data gathering method.This method is used in the user study, described in chapter 6.1.
The activity checklist consists of four different categories of how context could in-fluence the way users interact with the system. Each category covers various aspectsof how the target technology supports human actions. Aspects could be the physicalenvironment, purpose of the system, how usage evolves with experience and also howsocial factors affect the usage.
Means and ends This section covers how the system supports the users in achievingtheir goals. Does the system create conflicts between different goals?
Social and physical aspects of the environment How does the context affect theusage of the system?
Learning, cognition, and articulation Does the system reflect the users’ mentalrepresentation on how things are done? Is users’ learning process stimulated bythe technology?
Development This area covers development of users’ usage of the system. What fac-tors affect users’ behavior with the system? For example: what makes a usersuddenly use CTRL + C instead of the right click + copy text?
26 Chapter 6. Method
6.4 Heuristic evaluation
Heuristic evaluation means having a small set of evaluators examine an interface andjudge its compliance with recognized usability principles (the ”heuristics”). The goalis to identify and isolate usability problems in the design and through these improvethe user interface to enhance usability [21]. The heuristics used in this thesis is basedon Nielsen’s ten heuristics [17] from 1994, which is the most commonly used evaluationmethod today.
Visibility of system status The system should always keep users informed aboutwhat is going on, through appropriate feedback within reasonable time.
Match between system and the real world The system should speak the users’language, with words, phrases and concepts familiar to the user, rather thansystem-oriented terms. Follow real-world conventions, making information appearin a natural and logical order.
User control and freedom Users often choose system functions by mistake and willneed a clearly marked ”emergency exit” to leave the unwanted state without havingto go through an extended dialogue. Support undo and redo.
Consistency and standards Users should not have to wonder whether different words,situations, or actions mean the same thing. Follow platform conventions.
Error prevention Even better than good error messages is a careful design whichprevents a problem from occurring in the first place. Either eliminate error-proneconditions or check for them and present users with a confirmation option beforethey commit to the action.
Recognition rather than recall Minimize the user’s memory load by making ob-jects, actions, and options visible. The user should not have to remember infor-mation from one part of the dialogue to another. Instructions for use of the systemshould be visible or easily retrievable whenever appropriate.
Flexibility and efficiency of use Accelerators – unseen by the novice user – mayoften speed up the interaction for the expert user such that the system can caterto both inexperienced and experienced users. Allow users to tailor frequent actions.
Aesthetic and minimalist design Dialogues should not contain information which isirrelevant or rarely needed. Every extra unit of information in a dialogue competeswith the relevant units of information and diminishes their relative visibility.
Help users recognize, diagnose, and recover from errors Error messages shouldbe expressed in plain language (no codes), precisely indicate the problem, andconstructively suggest a solution.
Help and documentation Even though it is better if the system can be used withoutdocumentation, it may be necessary to provide help and documentation. Any suchinformation should be easy to search, focused on the user’s task, list concrete stepsto be carried out, and not be too large.
6.5. Brainstorming 27
6.4.1 Procedure
Before the analysis, the evaluators need to have information about the purpose of thesystem and who the intended users are. In this case the ABB Quality Control userinterface and the operators which use the system.
When performing a heuristic evaluation a proper list of guidelines is chosen. In thiscase Nielsen’s ten heuristics were chosen. The analysis was performed by two personswith human-computer interaction experience.
The procedure was as follows; the evaluators walked through the entire user interfacebriefly to get an overview and collect general usability issues. Next, the evaluators walkedthrough the user interface once for each item in the list of guidelines. The data gatheredwere noted during the process and finally documented as a list of identified results.
6.5 Brainstorming
The brainstorming method used in this work is a variant of brainwriting. It is a methodfor rapidly generating ideas about products or processes by asking participants to writetheir ideas down rather than shouting them out as they would in a traditional groupbrainstorming session. Studies have shown that brainwriting can generate approximately40% more ideas than traditional brainstorming [16]. This session was conducted withtwo persons for one hour in a private room. The participants wrote their ideas on post-it notes in silence, and after 40 minutes the ideas were presented. The results werecompared and combined into a list of ideas for improving the current ABB QualityControl System HMI.
Collaboration is an important part of brainstorming session when finding new cre-ative ideas. Participants may generate new and unexpected ideas by combining themwith others. The aim of the method is to produce a large number of ideas [16]. Toachieve a successful brainstorming, C. E. Wilson writes about the two most basic prin-ciples; quantity prior to quality and no criticism of ideas. This is something that wasemployed in this brainstorming session to find creative solutions for the design concepts.
Data from the user study and the heuristic evaluation of the current user interfacewere used as a basis for discussion in the brainstorming session. This basis for thediscussion was used in order to make sure the participants produced ideas that fulfillthe usability demands from the user study and the requirements from ABB.
6.6 Design concepts
A number of design concepts for a future HMI for the Quality Control System weredeveloped. The results from the user study and the heuristic evaluation were taken intoaccount while brainstorming for these concepts. The results from the brainstorming werethen sorted, combined and further developed into a number of applicable functionalitiesfor the upcoming concept demonstrator. The functionalities were collected and drawnby hand to sketches of a potential system, which were then used as blueprints for theimplementation. The concept demonstrator contains a number of the design conceptspresented in the results chapter 7.7; some of the concepts were not implemented due totime limitations.

28 Chapter 6. Method
6.7 Technology Demonstrator
The final part of the project involved implementing a concept demonstrator in the rec-ommended 3D technology. The focus was on implementing the concepts that illustratethe 3D capabilities of the tool.
The graphics used in the application were originally used for marketing, such asbrochures and ads. They were built in the modeling tool Cinema 4D and were optimizedfor real-time use in 3ds Max. Microsoft Visual Studio 2008 was used for coding and thelanguage used was mainly C# on top of the Mono platform.
Chapter 7
Results
7.1 Technology Overview
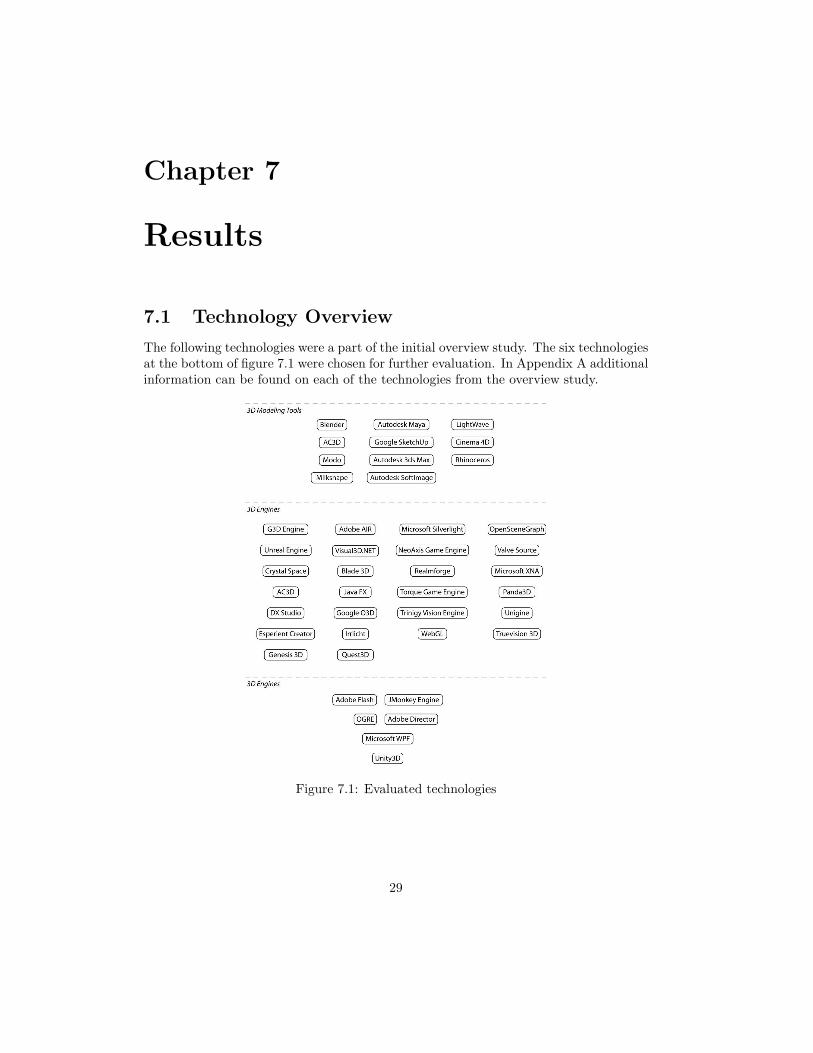
The following technologies were a part of the initial overview study. The six technologiesat the bottom of figure 7.1 were chosen for further evaluation. In Appendix A additionalinformation can be found on each of the technologies from the overview study.
Figure 7.1: Evaluated technologies
29
30 Chapter 7. Results
7.2 Technology Evaluation
This section shows the result of the in-depth 3D technology evaluation. Each technologyhas a list showing the score and motivation of every criteria.
7.2.1 Adobe Director
Adobe Director is a developing tool for creating rich internet applications (RIA) [1].It exports into a format called Shockwave which runs on web browsers primarily inWindows and Mac environments. It is not primarily intended for 3D development butcan still offer decent 3D effects.
Evaluation
Support: 4
The documentation is good. Online documentation exists which contains info onall elements of the software and the scripting language.
Licensing: 4
The software development kit has a price of $999. Distribution is royalty-free.
Productivity: 4
Programming interaction in 3D is quite easy to accomplish with Adobe Director.Operations such as moving cameras and objects, handling input from mouse andkeyboard, creating, grouping and removing objects, handling collisions, etc., wereall quite easy to use.
Deployment: 3
The only output format is Shockwave, which is a RIA format It supports hardware3D graphics and can be compiled to standalone applications in Windows andMacintosh environments and also be played in internet browsers that has theShockwave plugin.
Performance: 5
Adobe Director uses hardware acceleration
Installation: 5
The install is a simple download from the developer’s website.
Established technology: 3
Adobe Director is the predecessor of Flash, and has been around in the RIA scenesince the early 90’s. The latest version of the software was released in March,2009. It is mostly used for presentations, mockups for GUI’s and simple gamedevelopment.
Development procedure: 2
All development is done in either Lingo or JavaScript. Lingo is scripting lan-guage mainly developed for Director. Applications built in Adobe Director can bedeveloped on Windows and Mac OS platforms.
3D visualization capabilities: 2
The engine has problems importing graphics without losing important informationsuch as textures. It does not support advanced textures or lighting. It only hasvery basic 3D support.
7.2. Technology Evaluation 31
Summary
Because of the programming environment, the limited 3D capabilities and the lack oftraditional GUI components, Adobe Director would not be a very good choice for a largeproject such as the Quality Control System HMI.
CENSORED BY ABB CORPORATE RESEARCH.
7.2.2 Adobe Flash
Adobe Flash is the most used multimedia plug-in for Internet web browsers today.The technology aims to enrich the experience for web users. Common usage areas areanimations, movies, etc [2].
First version of Flash was released in 1997 by Macromedia. In 2005 Adobe Systemsacquired Macromedia and have continued the developing process ever since.
The 3D support itself is limited in Adobe Flash Player 10. The technology supportsbasic 3D effects, not intended to interact with a scene-graph. Third party 3D librarieshas therefore been created, for example Sandy 3D, Away 3D, Alternativa 3D and Pa-pervision 3D. These libraries are commonly used for games, advertisement campaignsand further interactive 3D visualizations for the web.
Evaluation
Support: 5
Flash is a widely used technology. A tremendous amount of tutorials, documentsand more are available online. There are over one million designers and developerswithin communities such as Adobe Developer Connection. Professional support isavailable for enterprises at a cost.
Licensing: 4
Flash as a technology and SDK is free to use under Adobe product license. Thedeveloper tool Flash Builder Professional costs US $699 for one license.
Productivity: 3
The available 3D libraries are easy to use and supply the developer with a lot ofreadymade functionalities. Compiling is quick, which makes it easy to see results.
Deployment: 4
Flash Player supports Windows, Mac OS X, Linux and Solaris platforms. Stan-dalone versions of Flash are available by using Adobe AIR technology.
Performance: 1
Flash Player 3D graphics is not fully hardware accelerated, this means that theaverage performance of the graphics are slow, and high-level effects such as pixellighting and particle systems cannot be used.
Installation: 3
Installing Flash Builder is easy, but third party libraries make the process morecomplicated.
Established technology: 2
Adobe has existed since 1982 and Flash since 1997. The 3D libraries on the otherhand are all new and developed and maintained by third parties, which makes theavailable technology unreliable.
32 Chapter 7. Results
Development procedure: 3
Programming is mainly done in ActionScript using the Adobe Flash Builder editorfor developers. Flash Builder is built upon the open-source editor Eclipse.
3D visualization capabilities: 1
Because of the lack of hardware accelerated graphics, the libraries functionalitiesare limited.
Summary
Software acceleration makes it impossible to create high performance 3D visualizationsystems. None of the third party 3D libraries provides the developer with a robust 3Dgraphics editor. The compiler is on the other hand quick, which makes it possible to getvisual results within a short amount of time.
CENSORED BY ABB CORPORATE RESEARCH.The developing tool Adobe Flash Builder (formerly Adobe Flex) is easy to use and
supplies the developer with code completion. Flash is a superior technology for Internetmultimedia distribution, but the lack of essential 3D libraries makes it difficult to use.The software acceleration limits the third party libraries to further extend and addpowerful 3D functionalities. In the future, WebGL might be used to add hardwareacceleration for Flash Player on the web.
7.2.3 Microsoft Windows Presentation Foundation (WPF)
WPF is a graphical subsystem for Microsoft’s .NET framework. WPF contains a hugebuilt-in graphical user interface (GUI) library and it also comes with a built-in 3Dvisualization library, called Viewport3D [5].
Microsoft Visual Studio is the recommended developing tool. Logic programmingcan be done in procedural (C#, VB.NET) or mark-up (XAML) code. The results aredisplayed in a viewport by Visual Studio.
WPF itself does not support 3D model importing. This means that some 3rd partyvendor applications are needed when developing 3D applications for this system. Blend-ables, Right Hemisphere Deep Exploration and ZAM 3D are three proprietary exportersavailable on the market. The most widely spread, ZAM 3D, supports creation of modelsand exporting functionalities for 3ds and dxf files.
Evaluation
Support: 5
Developers can share their thoughts together in Microsoft’s online community,MSDN. Documentation about the 3D environment and how to control Viewport3Dis available with multiple examples. The API is well documented. ABB alsoalready has agreements for direct support from Microsoft today.
Licensing: 4
Developer licenses are needed. Developing is done under Microsoft Visual Studioand Microsoft Expression Blend. Application distributions are royalty-free.
Productivity: 4
It is quick and easy to implement 3D functionalities using Viewport3D in VisualStudio. A design mode can be used to display scene changes etc.
7.2. Technology Evaluation 33
Deployment: 3
A WPF application runs on Windows XP SP2 or newer as standalone versions.Applications can also be deployed for the web, as a XAML Browser Applications(XBAP). However, these applications run only in browsers using the Windowsplatform.
Performance: 5
WPF Viewport3D uses hardware accelerated graphics.
Installation: 4
All Windows versions above XP SP2 are prepared for using WPF and Viewport3Dapplications. Visual Studio is easy to install.
Established technology: 4
Today WPF is mainly used for developing Windows GUI applications and is wellestablished as such. However, the 3D part of WPF cannot yet compete withtechnologies primarily focused on 3D development. Viewport3D has existed since.NET version 3.0, released in 2006.
Development procedure: 5
Viewport3D can be developed in both procedural and mark-up based code, suchas C#, VB.NET and XAML. The entire process of developing can be done ineither Microsoft Visual Studio or Microsoft Expression Blend.
3D visualization capabilities: 3
Viewport3D is not fully loaded with 3D visualization functionalities. It includesonly the basics.
Summary
Developing for WPF Viewport3D is straight forward. Mark-up makes it easier and fasterfor developers to build the scene-graph and resources. Separation between code andmodels are easily done by adding models to the resource folder as DynamicResources.
One other interesting feature in WPF is UIElement3D. The UIElement3D class li-brary makes it possible to wrap interactive 2D content on 3D surfaces in WPF. Manytimes like a texture being mapped over a mesh.
This evaluation has focused on Microsoft Expression Blend 2. Compared to previousversion, Expression Blend 3 has been updated with more 3D capabilities which make iteasier to use.
CENSORED BY ABB CORPORATE RESEARCH.
7.2.4 OGRE
OGRE is one of the most popular open-source 3D engines available today [7]. Thou-sands of developers are collaborating and sharing their thoughts together at OGRE’sonline community. A tremendous amount of add-ons and ready-made scripts are alsoretrievable online.
OGRE deploys on multiple platforms such as Windows, Linux and Mac. Underlyinggraphical low-level libraries are DirectX and OpenGL and developing is done by codingin C++.
34 Chapter 7. Results
Evaluation
Support: 3
The online community is both huge and active. Currently OGRE has five teammembers working. Purchasable consultations are available through the founders’companies.
Licensing: 5
OGRE is free to use under their open-source license. Alternative license withoutany restrictions is available for an unknown amount.
Productivity: 2
OGRE is mainly a 3D engine without any additional support. By using thirdparty add-ons, productivity may increase. During evaluation many third partyprojects were unreliable.
Deployment: 5
OGRE supports both OpenGL and Direct3D which makes projects deployable onmultiple platforms: Windows, Mac and Linux.
Performance: 5
OGRE is hardware accelerated using both Direct3D and OpenGL.
Installation: 3
The installation is relatively easy when using the installer version. Due to OGRE’snature with a community of multiple developers; add-on tools etc are all installedindividually.
Established technology: 3
The team is constantly under change and they are all working on other projectsnext to developing the engine, which makes it future unreliable.
Development procedure: 2
The OGRE installer makes it easy to compile and deploy within Microsoft VisualStudio.
3D visualization capabilities: 4
OGRE supports a wide range of 3D visualization functionalities.
Summary
The scene-graph and API are both easy to understand and quick to start working with,compared to other code-based engines. However, OGRE lacks visual feedback and itforces the developer to recompile for every running. There are third party graphicalscene editors, but many of these are developed by independent persons causing the toolto only contain a limited amount of functionalities. The documentation is well written,but there is a huge amount of poorly organized information that is difficult to navigateand read. While OGRE third party tools offer support for almost everything, the qualityvaries. Some of the tools crashed repeatedly during evaluation.
In conclusion, OGRE supports a high range of 3D functionalities and makes almosteverything possible to develop with its add-on library, but the lack of consistent qualitymakes it unreliable, non-productive and time consuming.
7.2. Technology Evaluation 35
7.2.5 JMonkey Engine
The JMonkey Engine is a Java library for programming 3D games and environments [4].It is very popular in the independent game development community and is commonlyused for smaller game projects. It is an open source technology and is thus developedby independent developers and fans. It is a well recognized technology and Sun plansto use it in their project: ”Project Wonderland”, a toolkit for building collaborative3D worlds. Sun is currently using this toolkit for building software that their remoteemployees can use to work and collaborate together with in a 3d environment.
Evaluation
Support: 2
There are Javadocs on the classes and a small wiki on the project’s website. Thesecontain some helpful information, but since it is community driven, not everythingis documented properly. There are very few comments in the javadoc about func-tionality of library classes and the user’s guide with instructions is not complete.The forums are active and give fast responses.
Licensing: 5
The engine is open source under the BSD License.
Productivity: 1
The concept of the workflow with this engine is simple; write code, compile, seeresults and repeat. This workflow gives low feedback to the developer and thuswhen there is a problem it takes a lot of time to figure out how to resolve it.
Deployment: 4
The projects can be deployed on any platform that has the Java Runtime Envi-ronment and supports the LWJGL (Lightweight Java Graphics Library).
Performance: 5
JMonkey engine uses hardware acceleration through OpenGL for its graphics.
Installation: 2
The install consists of downloading a number of Java libraries and importing theminto a project in an appropriate Java editor. There is no editor for the JMonkeyengine.
Established technology: 3
The JMonkey Engine has a big community of users, and has a big forum. Ithas existed since 2003. However, it is currently a community-driven open sourceproject with no supporting company.
Development procedure: 4
All development is done in Java. Thus, all functionality that can be implementedin Java can be implemented in the applications produced. The engine is writtenin Java, and all coding is done in the same language. Therefore, the engine canbe developed on all platforms with the Java Runtime Environment.
3D visualization capabilities: 3
The engine comes with a number of converters that can be used for importinggraphics. External converters can also be found. There are examples of games
36 Chapter 7. Results
made in this engine that makes use of almost all modern graphical features avail-able for OpenGL.
Summary
This engine has produced a number of powerful 3d graphic applications, but has asteep learning curve and is poorly documented. It is primarily a game engine and itsfunctionality is optimized for that purpose. It could probably be used for building a 3DHMI but there are better options available.
7.2.6 Unity 3D
Unity is a 3d game development environment [8]. It has a graphical user interface andallows the user to represent the 3d scene graphically before the code is compiled. Ituses an ”asset library” which contains all elements of the application. The assets canbe models, materials, scripts, cameras, lights etc. These assets can easily be added tothe scene using drag-and-drop technology and programmed using C#, JavaScript andBoo. All game logic runs on the open source .NET platform Mono project.
Evaluation
Support: 5
The support is very good, the entire API can be found on the website. There aresections both for the scripting and for more general information describing thestructure of the software and all the different functions in the editor. The enginehas a big active community and bug reports are handled quickly.
Licensing: 5
The standalone runtime may be redistributed royalty-free, as long as it is producedusing a licensed installation of the Software. A license for Unity Pro costs $1499. Acollaboration system ”Unity Asset Server” cost $499. It is possible to buy licensesfor deploying to both Apple iPhone and Nintendo Wii. Source code license is alsoavailable for an unknown cost.
Productivity: 5
Unity has a graphical editor in which all available graphics, sounds and assets canbe accessed easily. Applications are designed in a graphical editor; objects, scriptsand graphics can be placed using drag-n-drop. This is an important advantagecompared to engines based only on code. The remaining coding can be done in anexternal editor (such as VS2008) that provides code completion.
Deployment: 4
Unity can export to a web format. This web format is played using unity’s ownplugin for browsers; this can be downloaded from their website. It can also bedistributed as a streaming service, a standalone application for Windows and MacOS X, and also as an OS X Dashboard Widget. Unity can also deploy applicationsfor the Apple iPhone and Nintendo Wii. It cannot produce standalone applicationsfor Linux.
Performance: 5
Unity uses hardware acceleration for its graphics.
7.2. Technology Evaluation 37
Installation: 4
Unity is installed by downloading it from the website. The asset server for versioncontrol and collaboration must be run on a Linux, Unix or Mac server.
Established technology: 3
Unity has been used by several commercial game projects. The editor seems verypopular in the game development community. It is developed by Unity Technolo-gies, Denmark.
Development procedure: 5
Scripting is done with either JavaScript or C#. C# can be edited in externaleditors. The engine for compiling C# is Mono. The Unity editor can be run ateither Mac OS X or in Windows environments. It can deploy to Mac, Windows andfor browsers. Details can be found under the ”deployment” requirement above.
3D visualization capabilities: 5
Unity has support for importing the most popular graphics formats. It has supportfor almost all graphical features that are used in commercial games.
Summary
Unity’s biggest strength is that it provides a graphical interface for programming theapplications, in which the user can easily design the application visually. This enableshigher productivity than purely code-based graphic engines. Other advantages are itsability to import most popular graphics formats, good support and deployment to theweb as well as to standalone applications.
7.2.7 Summary
This chapter presents a summary of the evaluated technologies (figure 7.2.7). Thehighest result got a total score of 40. The score was based on the criteria presentedin chapter 6.2.1. The technology with the highest score was Unity 3D, and the biggestreason that it is recommended is its productivity and rich library of 3D visualizationfeatures. More details and a motivation of how the requirements were evaluated togetherwith a motivation to the ranking scheme are presented in chapter 6.2.2 and 7.2.6.
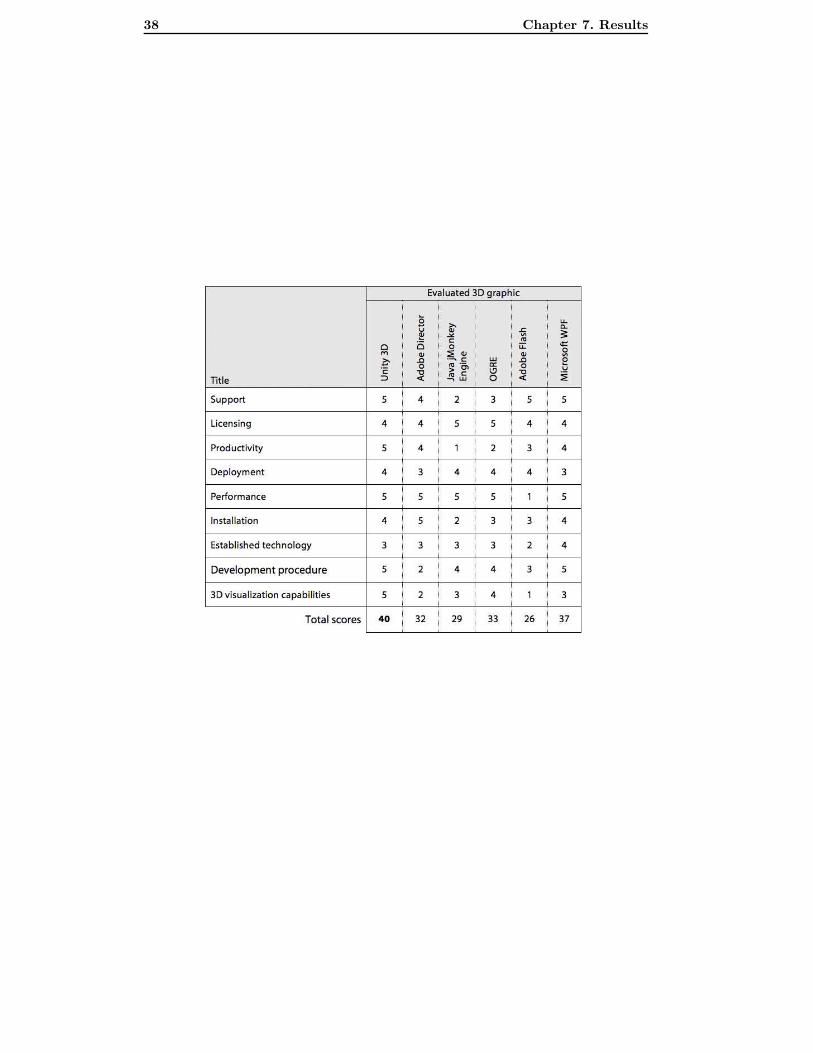
38 Chapter 7. Results
7.3. User Study 39
7.3 User Study
CENSORED BY ABB CORPORATE RESEARCH.
7.4 Activity Checklist
In an attempt to verify the user study’s validity in accordance to the activity theoryan analysis was performed. This analysis was based on the evaluation version of theactivity checklist [19] to find out whether the key areas of context (specified by activitytheory) were covered in the interviews. The purpose of performing this analysis was toidentify areas that might need further attention in this thesis.
The strategy of performing the analysis was to first select areas on the checklist thatwas relevant for this work. The questions used in the interview were analyzed accordingto the chosen areas.
CENSORED BY ABB CORPORATE RESEARCH.
7.5 Heuristic Evaluation
The following results describe a heuristic evaluation of the current Quality ControlSystem HMI. The method used is described in chapter 6.4. Results are organized undereight categories corresponding to Nielsen’s heuristics, and indicate where and how thecurrent system could be improved in terms of usability.
CENSORED BY ABB CORPORATE RESEARCH.
7.6 Brainstorming Session
The brainstorming session was conducted in a private room were the participants wroteideas on notes for a limited time (45 minutes). When the time was up each participantpresented their ideas and the notes were put on a billboard and the ideas were discussedand combined.These are the results: CENSORED BY ABB CORPORATE RESEARCH.
7.7 Design concepts
The following section describes a number of design concepts for a future Quality ControlSystem HMI built on 3D graphics. The concepts are all based on a user study [27] and/orrequirements from ABB. The procedure of developing these concepts is described in themethod chapter 6. For each design concept a motivation is included and a descriptionon what issues the concept could possibly solve.
7.7.1 Process overview
CENSORED BY ABB CORPORATE RESEARCH.

40 Chapter 7. Results
7.8 Technology Demonstrator
A technology demonstrator was created to show some of the previously presented designconcepts, this demonstrator was implemented using Unity 3D.
CENSORED BY ABB CORPORATE RESEARCH.
Chapter 8
Conclusion
This report has evaluated a number of technologies based on nine criteria, each technol-ogy was graded according to how well it complied with the criteria with a score between1 - 5 for each. The total score indicate that Unity 3D is the most appropriate technol-ogy for the purpose of building a HMI for the ABB Quality Control System out of theevaluated technologies. Unity 3D was chosen primarily because of its high productivityand big library of 3D functionalities.
A few design concepts have been developed. These are described in the resultschapter. They are based on issues found in a user study, in a heuristic evaluation of thecurrent HMI and produced in a brainstorming session. The concepts are suggestions onhow to solve these issues.
Finally, a technology demonstrator was implemented in the recommended technology.It was built to demonstrate the design concepts in a 3D environment and to show thepower of Unity 3D. The demonstrator was presented and received good criticism forQuality Control professionals at five separate occasions within ABB.
8.1 Future Work
In order to cover more important aspects of system usage, the user study conductedin this project could be modified and repeated. It was evaluated in chapter 6.3 withthe activity checklist method. The purpose of this was to determine the validity andsee how a future user study should be designed to take the context into account. Theresults of this study show (among other things) that information should be gathered onwhich operations require most time and effort to learn, it should also investigate howexternal tools conflicts with the system.
8.2 Limitations
This thesis report has been conducted with the following limitations.
– The design concepts must be evaluated in a proper user study to determine whetherthey have any value in practice compared to the current solution.
– The evaluation of the 3D development tools only covers six technologies. Therefore,it cannot be guaranteed that the ideal solution has been found.
41

42 Chapter 8. Conclusion
– All technologies have been evaluated in how well they comply with some chosencriteria and graded thereafter. The grading was done in a subjective way and itcan thus not be compared with a similar study with other evaluators.
– The evaluation does only cover performance in that hardware accelerated technolo-gies receives a higher score than software accelerated ones. No other performancehas been measured.
Chapter 9
Acknowledgements
We would like to thank Susanne Timsjo for being our supervisor and giving us theopportunity of doing our thesis at ABB Corporate Research. She has always been posi-tive and helpful and has helped us a lot with ideas, feedback and structure when it wasneeded.
Martin Olausson who was our project manager in our time at ABB helped us alot with structuring the project, arranging meetings and presentations and making surethe project was on the right track.
George Fodor for providing us with visions and ideas on how a future system shouldwork.
Daniel Sjolie for providing us with support from Umea Universitet and correctingand commenting the final report.
Magnus Larsson for letting us do our master thesis work at ABB Corporate Re-search.
Dilip Kota for providing us with the opportunity to do our master thesis at ABB.
Markus Holm for teaching us how the physical process was working and sharing hiswisdom about regulation.
Christine Mikkelsen for the information about the HMI of the Quality Control Sys-tem, and teaching us how to use it.
Anders Hanberg for supporting and arranging meetings with XA at ABB.
Daniel Rosendal & Johan Ziprus for introducing us to ABB Corporate Research.
43

44 Chapter 9. Acknowledgements
References
[1] Adobe Director homepage. http://www.adobe.com/products/director/ (visited2009-05-15).
[2] Adobe Flash homepage. http://www.adobe.com/products/flash/ (visited 2009-05-12).
[3] ARToolKit is a software library for building Augmented Reality (AR) applications.http://www.hitl.washington.edu/artoolkit/ (visited 2009-09-29).
[4] jMonkey Engine homepage. http://www.jmonkeyengine.com/ (visited 2009-05-12).
[5] Microsoft Windows Presentation Foundation homepage.http://windowsclient.net/wpf/default.aspx (visited 2009-05-14).
[6] Nearest Tube is an Augmented Reality (AR) applications for iPhone 3GS.http://www.acrossair.com/artoolkit/ (visited 2009-08-11).
[7] OGRE homepage. http://www.ogre3d.org/ (visited 2009-05-12).
[8] Unity 3D homepage. http://www.unity3d.com/ (visited 2009-05-13).
[9] Antti Aaltonen and Juha Lehikoinen. Exploring augmented reality visualizations.In AVI ’06: Proceedings of the working conference on Advanced visual interfaces,pages 453–456, New York, NY, USA, 2006. ACM.
[10] Unity Technologies ApS. Unity 3D web site.http://unity3d.com/support/documentation/Components/Layers.html (visited2009-06-29).
[11] Ronald Azuma, Yohan Baillot, Reinhold Behringer, Steven Feiner, Simon Julier,and Blair MacIntyre. Recent advances in augmented reality. IEEE Comput. Graph.Appl., 21(6):34–47, 2001.
[12] M. Billinghurst, J. Bowskill, N. Dyer, and J. Morphett. An evaluation of wear-able information spaces. In VRAIS ’98: Proceedings of the Virtual Reality AnnualInternational Symposium, page 20, Washington, DC, USA, 1998. IEEE ComputerSociety.
[13] Dempsey Chang, Laurence Dooley, and Juhani E. Tuovinen. Gestalt theory invisual screen design: a new look at an old subject. In CRPIT ’02: Proceedings ofthe Seventh world conference on computers in education conference on Computersin education: Australian topics, pages 5–12, Darlinghurst, Australia, Australia,2002. Australian Computer Society, Inc.
45
46 REFERENCES
[14] Andy Cockburn, Amy Karlson, and Benjamin B. Bederson. A review ofoverview+detail, zooming, and focus+context interfaces. ACM Comput. Surv.,41(1):1–31, 2008.
[15] Niklas Elmqvist. Balloonprobe: reducing occlusion in 3d using interactive spacedistortion. In VRST ’05: Proceedings of the ACM symposium on Virtual realitysoftware and technology, pages 134–137, New York, NY, USA, 2005. ACM.
[16] Elizabeth Gerber. Using improvisation to enhance the effectiveness of brainstorm-ing. In CHI ’09: Proceedings of the 27th international conference on Human factorsin computing systems, pages 97–104, New York, NY, USA, 2009. ACM.
[17] Nielsen J and Mack R. Usability Inspection Methods. Wiley, New York City, NY,1994.
[18] Patrick W. Jordan. An Introduction to Usability. Taylor & Francis, London, 1998.
[19] Victor Kaptelinin, Bonnie A. Nardi, and Catriona Macaulay. Methods & tools:The activity checklist: a tool for representing the “space” of context. interactions,6(4):27–39, 1999.
[20] Fotis Liarokapis and Robert M. Newman. Design experiences of multimodal mixedreality interfaces. In SIGDOC ’07: Proceedings of the 25th annual ACM interna-tional conference on Design of communication, pages 34–41, New York, NY, USA,2007. ACM.
[21] G. Lindgaard. Usability testing and system evaluation. London: Chapman andHall, 1994.
[22] Julian Looser, Raphael Grasset, and Mark Billinghurst. A 3d flexible and tangiblemagic lens in augmented reality. In ISMAR ’07: Proceedings of the 2007 6th IEEEand ACM International Symposium on Mixed and Augmented Reality, pages 1–4,Washington, DC, USA, 2007. IEEE Computer Society.
[23] Andrian Marcus, Louis Feng, and Jonathan I. Maletic. 3d representations for soft-ware visualization. In SoftVis ’03: Proceedings of the 2003 ACM symposium onSoftware visualization, pages 27–ff, New York, NY, USA, 2003. ACM.
[24] Paul Milgram and Fumio Kishino. A taxonomy of mixed reality visual displays.IEICE Transactions on Information Systems, E77-D(12), December 1994.
[25] Ingrid Mulder, Henk de Poot, Carla Verwij, Ruud Janssen, and Marcel Bijlsma. Aninformation overload study: using design methods for understanding. In OZCHI’06: Proceedings of the 18th Australia conference on Computer-Human Interaction,pages 245–252, New York, NY, USA, 2006. ACM.
[26] Susanna Nilsson and Bjorn Johansson. Acceptance of augmented reality instruc-tions in a real work setting. In CHI ’08: CHI ’08 extended abstracts on Humanfactors in computing systems, pages 2025–2032, New York, NY, USA, 2008. ACM.
[27] CENSORED BY ABB CORPORATE RESEARCH.
REFERENCES 47
[28] Bjorn Schwerdtfeger, Daniel Pustka, Andreas Hofhauser, and Gudrun Klinker. Us-ing laser projectors for augmented reality. In VRST ’08: Proceedings of the 2008ACM symposium on Virtual reality software and technology, pages 134–137, NewYork, NY, USA, 2008. ACM.
[29] Ben Shneiderman. The eyes have it: A task by data type taxonomy for informationvisualizations. In VL ’96: Proceedings of the 1996 IEEE Symposium on VisualLanguages, page 336, Washington, DC, USA, 1996. IEEE Computer Society.
[30] Marjaana Traskbaack and Michael Haller. Mixed reality training application for anoil refinery: user requirements. In VRCAI ’04: Proceedings of the 2004 ACM SIG-GRAPH international conference on Virtual Reality continuum and its applicationsin industry, pages 324–327, New York, NY, USA, 2004. ACM.
[31] Jiejie Zhu and Zhigeng Pan. Occlusion registration in video-based augmented re-ality. In VRCAI ’08: Proceedings of The 7th ACM SIGGRAPH InternationalConference on Virtual-Reality Continuum and Its Applications in Industry, pages1–6, New York, NY, USA, 2008. ACM.

48 REFERENCES
Appendix A
3D technology overview
This chapter presents all techniques, but excludes six ones chosen for deeper evaluation.
A.1 Modeling tools
In this section all overviewed modeling tools are listed.
A.1.1 Cinema 4D
Cinema 4D is a high end 3D graphics modeling tool. It is produced by MAXON Com-puter GmbH of Friedrichsdorf, Germany. It has been developed since 1993 and hasbeen used for producing a number of movies such as Surf’s Up, Beowulf and The goldencompass.
Summary
This software is used for modeling 3D graphics, and not for building 3D applications.Therefore it has not been evaluated in this project.
A.1.2 Google SketchUp
Google Sketchup is a basic 3D modeling tool for creating conceptual design. There aredifferent levels of licenses; Single-user 381 euro, Free version, less functionality and theapro version available for 8 hours. It is developed by Google.
Summary
This software is intended for - As the name implies - quick sketches or concept illustra-tions, and not for designing advanced 3D graphics with complex lighting and texturing.
A.1.3 Rhinoceros
Rhinoceros is an advanced 3D modeling tool, that is specialized in NURBS for profes-sional industrial design. The editor runs on Windows, and one commercial single-userlicense costs 1695 euro. Support and documentation is available at the website. It is
49
50 Chapter A. 3D technology overview
developed by McNeel, USA. The company claims that the software is market leading inIndustrial Design.
Summary
The software is intended for professional industrial design and is not software that arevery suitable for the purposes of this study.
A.1.4 Modo
Modo is an advanced 3D modeling tool with focus on usability. The editor runs onWindows & Mac OS X. The license alternatives are: new Modo 302 costs $895, and anupgrade to 402 costs $395. It has all documentation and a huge forum at the website.
The company is Luxology, 2001, USA. The software has been used by Pixar Anima-tion studios for creating animated movies. Claims to be easier to use than comparablesoftware (3ds Max, Maya).
Summary
This software is intended for design of 3D models, and not for creating 3D applications,thus it is not evaluated in this study.
A.1.5 Milkshape
Milkshape is a simple 3D modeling software that runs on Windows, the license is share-ware and it supports very basic 3D functionality. The main purpose of this applicationis to edit preexisting graphics for games.
Summary
This is a very basic 3D modeling tool and has no functionalities for creating applications.
A.1.6 AC3D
AC3D was initially developed on Amiga and one of the first graphical modeling tools.AC3D has existed since 1994 and was purchased by the current owner, Invis Limited,in 2002. The application is running on all mayor platforms; Windows, Linux and MacOS X.
AC3D comes with a great amount of import and export functionalities, which makesit well used for Second Life world modelers. The cost for a single license is $79.95.
Summary
The developer community seems to have disappeared and the gallery does not convince.There is a great lack of ”high demand” 3D graphics renderings.
We have chosen to not use this application for modeling purposes in manner of theseconclusions and the overall feeling.
A.1. Modeling tools 51
A.1.7 Blender
Blender is the most used open-source graphical modeling tool today. The application isbuilt by the non-profit organization The Blender Foundation since 1993 and is supportedby a huge user community.
Blender supplies their users with all type of 3D modeling tools, such as texturing,rigging, water simulations, animations, particles and more. Extra functionalities areretrievable as plug-ins and extras.
Blender is compatible with platforms such as Windows, Linux, Mac OS X, FreeBSD,Irix and Solaris.
Summary
Blender is a well common modeling application and consists of a tremendous amountof functionalities. Blender supports even real-time deployment capabilities with theirBlender Game Engine tool. The documentation is good, but not logically retrievableand categorized.
When it finally comes to the use of this powerful 3D modeling, things are highlyunreliable. Almost every file format is importable, but with multiple limitations. Thirdparty importers and exporters are listed on the webpage, but many of them suffer ofchildren’s disease which makes Blender unreliable to use.
Blender’s user interface is difficult to start using, and does not implement the oper-ating systems look-and-feel. During our overview evaluation phase, many bugs whereshowing up within a small period of time. Therefore, Blenders was not chosen to be themain modeling tool for this thesis.
A.1.8 Autodesk Maya
Maya is a high-end 3D modeling tool from Autodesk Inc. It has existed since 1998 andis mainly used by professionals creating animations and architectural scenes.
Maya runs on Windows XP, Mac OS X, Linux and Fedora. The application providesthe designers with three API’s for scripting capabilities. One single license of AutodeskMaya costs from US $6490.
Summary
Since Autodesk Maya is expensive and mainly used by movie professionals, we decidednot to use this tool further in our evaluation phase.
A.1.9 Autodesk SoftImage
SoftImage is another high-end 3D modeling tool from Autodesk. The first version ofthe application was released in 2000 and was later aquired by Autodesk in 2008. Itsupports scripting without code and also provides a set of game engine exporters, suchas Microsoft XNA, Valve Source, Epic Unreal Engine and more. SoftImage runs onlyon Windows computers and is purchasable from US $3700.
Summary
SoftImage is a top of the line software from Autodesk. Though, we have decided not touse this tool further in our evaluation phase.
52 Chapter A. 3D technology overview
A.1.10 Autodesk 3ds Max
3ds Max is a powerful and well-recognized 3D Modeling tool. It is used for working with3D models, textures, lighting etc. The license cost is around 4000 USD depending ontype (network or standalone). Support is provided through developer forums, telephone”Incident support” ($65 per problem) and an article search function on the website. Itis produced by the company Autodesk, USA. It is a well-known technology for creatinggraphics that is used for creating big titles in both animated movies and commercialgames.
Summary
3ds Max is one of the most familiar names there is when it comes to 3D modelingapplications. A trial license was used in this project to create, edit graphics and convertgraphics for the game engines that was evaluated. It is a powerful tool that has a bigcommunity of professional users, and has support for most modern 3D graphics formats
A.1.11 Newtek LightWave
Lightwave is developed by the American company Newtek since 1994. It is a powerfuland well-recognized tool that was used to create effects in big projects such as Terminator- The Sarah connor chronicles, Batman - The dark knight and Iron man. Lightwave runson Windows and Mac OS X computers and costs $995 for version 9.
Summary
Since Lightwave is intended to be used by professional artists for high level graphics,this software has not been used in this project.
A.2 Real-time 3D engines
In this section all overviewed real-time 3G engines are listed.
A.2.1 RealmForge
RealmForge is not under development anymore; Visual3D.NET is its successor.
A.2.2 Visual3D.NET
Visual3D.NET is a relatively new game engine from Realmware Corporation. It is basedon Microsoft XNA and was released in 2008. The 3D engine supports a high range offeatures and possibilities, such as next generation graphics and a physics system.
The technology is integrated with Microsoft Visual Studio for developing purposes,while it also provides an all-in-one scenario and GUI builder. Languages supported areC#, C++, Visual Basic, Java, Lua and IronPython.
The game engine is deployable on Windows computers and soon Xbox360. A singleenterprise edition costs from $19500. Evaluation versions are available.
A.2. Real-time 3D engines 53
Summary
Visual3D.NET supports many features and is easy to use. The community on the otherhand is small and the project has just begun. We have chosen to not evaluate theproduct further, since Visual3D.NET is still in beta.
A.2.3 Blade 3D
Blade 3D is an all-in-one game engine technology for Windows and Xbox devices. Thedocumentation is well written with multiple tutorials. Easy-to-use toolkits are alsoprovided to make the development work more productive. The built in developmentenvironment runs in Windows. Application can be deployed on both Windows andXbox 360. One single license costs from $999,50 for each year.
Summary
Digini announced on the 30th of July 2009 that stopped working with the technology.Subscriptions will be canceled within 6 months.
A.2.4 Truevision 3D
Truevision 3D is a 3D engine created by Truevision 3D, LLC. The technology is devel-oped and deployed on Windows computers. Truevision 3D supports 3D up to DirectX9.0c.
The documentation is wiki based and poorly categorized. Support can also be re-trieved from a web forum with 6000 other developers. The supported programminglanguages are C#, C++, Visual Basic and Delphi.
Summary
Because of the lack of high performance 3D functionalities and poor documentation wehave drawn the conclusion to not evaluate this product further.
A.2.5 Microsoft Silverlight
Microsoft announced Silverlight as a new competitor to Adobe’s Flash technology in2006. It is an Internet multimedia technology and runs on Windows, Mac OS X andLinux computers.
Silverlight is mainly developed in Visual Studio 2008 and Expression Blend as a.NET technology and is free to use under Microsoft Public License.
The final version of Silverlight 3 was announced on the 9th of July 2009. It presentsa lot of new 3D capabilities. A limited number of 3D effects in Silverlight 3 are nowhardware accelerated.
Summary
Compared to high performance 3D engines, Silverlight is still far away to fulfill the highdemand vision of 3D visualization. The technology, on the other hand, runs in almostevery computer as a web technology. Therefore, we have chosen to not evaluate thisproduct further.
54 Chapter A. 3D technology overview
A.2.6 WebGL
WebGL is an upcoming new 3D technology for web usages. It will work as a hardware-accelerated open source 3D standard. This will be done without any plug-ins. InsteadKhronos Group works on a JavaScript API binding to OpenGL ES 2.0 which can bediscovered through the web browsers. The specification will be royalty-free for all de-velopers. Google, Mozilla and Opera will officially support this upcoming industrystandard.
Summary
This technology will be a standard for 3D graphics in internet browsers, but is still underdevelopment. Therefore it has not been evaluated in this project.
A.2.7 Valve Source
The source engine is a high performance 3D game engine, it can run on Windows plat-forms and Xbox 360 consoles. It can be developed in Microsoft Visual Studio. Thisengine is used for top of the line games and license information can only be gained un-der an NDA. The developers are Valve Corporation, founded in 1996, one of the leadersin the computer gaming industry.
Summary
This is a very powerful engine that is used to develop top-of-the-line games. Licenseinformation is only available under non-disclosure agreements. Therefore it has not beenevaluated in this project.
A.2.8 Google O3D
Google O3D is a browser plug-in for Rich Internet Applications (like Adobe Flash).It runs on Windows XP/Vista, Mac OS X 10.5 and Linux 32-bit x86 distributions.It is developed in JavaScript and is Open Source. Support is provided through systemdescriptions and manuals and a forum is available at Google Code. It provides hardwareaccelerated 3D graphics.
Summary
O3D is still in its experimental beta phase and the code is fully exposed because of theuse of JavaScript. Therefore it has not been evaluated in this project.
A.2.9 DX Studio
DX Studio is a 3D engine and developing tool that runs on Windows XP / Vista.The license cost is 588 EUR for one Pro Edition license. It provides support throughdocumentation and walk-throughs, a small community based forum and the user baseis about 30 000 [Wikipedia]. It is produced by Worldweaver Ltd and they released thefirst version in 2005. ActiveX technology is used for integrating the 3D engine as acomponent in other applications.
A.2. Real-time 3D engines 55
Summary
The software was released in 2005 and still the user base now is only about 30,000 whichmeans that it is not a popular technology. Therefore it has not been evaluated in thisproject.
A.2.10 Esperient Creator
Esperient Creator is a 3D engine and developing tool that runs on Windows 2000/XP/Vista.The license cost is US $2400 for the enterprise version. Training etc are offered as con-sulting services. The forum community is small and not very active.
Many instructional videos are available through the official homepage. The companyis Esperient Corporation and it was founded in 2007 and they launched Esperient Creatorin late 2008.
Summary
This technology is currently not very established and therefore it has not been evaluatedin this project.
A.2.11 Quest 3D
Quest 3D is a 3D graphics engine and developing tool that runs on Windows 2000/XP/Vista.Thelicense cost is 10k EUR for a single VR Edition license
It has a small forum community. The company Act-3D started in 1997 and releasedthe first version of Quest3D in 2000. It can deploy executables and it is also possible todeploy on the web as an ActiveX controller.
Summary
This technology was not part of the technology evaluation part of this project, as therewas not enough time to test this software since there were more attractive technologiesavailable.
A.2.12 Microsoft XNA
Microsoft XNA is a developing environment for 3d games for Windows platforms andXbox 360. The editor runs on Windows & Mac OS X. Applications produced can onlybe distributed in the XNA Creator’s Club. Support for using the software can be foundat Creator’s Club Online, forums at the website and also at MSDN online. Coding isdone in any .NET programming language, and Visual Studio can be used for developingin. It is developed by Microsoft.
Summary
As the applications produced in XNA only can be deployed in XNA Creator’s Club itis not a viable choice for this project.
56 Chapter A. 3D technology overview
A.2.13 Trinigy Vision Engine
This engine is a professional 3D game engine. Licenses can only be acquired by compa-nies that intend to use the software for commercial game development. It is producedby Trinigy Inc, 1999, Germany. The engine is used by big commercial game developerssuch as Ubisoft, Firefly & Atari.
Summary
This engine is intended for professional game development.
A.2.14 Torque Game Engine
The Torque game engine is a commercial 3D engine, that can deploy to Windows,Linux, Nintendo Wii, Xbox 360, iPhone, Mac OS X. There are two types of licenses;Independent developer $295 and Commercial $1495. Support is provided through doc-umentation, resources and a big forum at the website. Coding is done in Torquescript( C++). The engine is produced by GarageGames.com, 2000. It supports high quality3D and is used for several commercial games.
Summary
This is a powerful commercial engine intended for experienced developers.
A.2.15 G3D Engine
G3D engine is a low level 3D engine that runs on Windows, Linux, FreeBSD and MacOS X. Visual Studio 2008 can be used for developing in. The license is Open source,BSD. Support is provided through a small forum at the website, an online manual, anda forum at sourceforge.net, for registered users. Coding is done in C++. It is producedby an open-source team. It supports high quality 3D, but does not have a built in scenegraph.
Summary
Since the engine does not provide a built in scene graph, it requires the developers tocreate their own graph. This result in more effort to produce an application comparedto engines with built-in scene graphs.
A.2.16 Panda 3D
Panda 3D is a game engine that handles graphics, audio, I/O & collision detection. Itis open source and runs on all platforms. It can be developed in Python & C++. Thelicense is open source (the BSD license). Support is provided through a well-used forumand an online manual. It is developed by an open source team; The Panda DevelopmentTeam, since 2002, based in Pittsburgh. It has been used for making Disney’s Pirates ofthe Caribbean Game.
Summary
This engine has many positive attributes; it is well-recognized in the open source gamedevelopment community, and has been used for creating commercial games.
A.2. Real-time 3D engines 57
A.2.17 Unigine
Unigine is a 3D Game engine. It runs in PC and Linux environments, and coding is donein C++. There are two license options; a business license from $24800 and an evaluationkit without C++ API and source code. Support is available through technical supportvia e-mail, phone and instant messaging and documentation. The package includes amodeling tool. It is produced by the company Unigine Corp, initiated in 2002, based inRussia. The first beta got released in 2004 and is under rapid development.
Summary
This is a professional game development tool that is suitable for large scale 3D gamedevelopment.
A.2.18 NeoAxis Game Engine
NeoAxis game engine is a 3D game development software that runs in Windows environ-ments. It is developed in .NET and has three types of licenses varying in price from $99- $9999 Support is provided through documentation and a small forum on the website.The company is Neo Axis Group, LTD, since 2006.
Summary
This technology is a small SDK best suited for independent game developers. At firstglance these tools looks useful, but overall not a very impressive technology A smallteam with a small forum and still in beta phase makes this technology difficult to investtime and money in. On the other hand, they have a nice approach for the future.Mono supports are soon built in which makes the deployment to Mac OS X available.Also, NeoAxis supports Window in Microsofts .NET environment which makes it easyto integrate in WPF applications.
A.2.19 Unreal Engine
The Unreal engine is a professional 3D graphics engine for PC, Xbox 360 & Playstation3. The engine has been used to produce games such as Mirror’s Edge, Gears of War,Unreal Tournament 1-3 and Harry Potter: The Philosopher’s Stone. The engine iscurrently available in versions 1-4. A license for one platform (PC, Xbox or Playstation2) for version 2 is $350k. An additional platform is priced $50k
Summary
This engine is one of the biggest and most well-recognized commercial engines there is.The engine is very powerful, and the price is very high.
A.2.20 Adobe Air
Adobe Air is a Rich Internet Application with deploy capabilities, it runs on Windows,Linux and Mac OS X. It can be developed in Adobe Flex and its own editor; AIR SDKwhich supports HTML, XML, ActionScript, Flash, Audio, Video and more. The licensefor Adobe AIR SDK is free. The development environment Adobe Flex costs from US$249 for one license. There are restrictions when distributing Adobe AIR Runtime. It
58 Chapter A. 3D technology overview
is developed by the Adobe Corporation, and has existed since 2007. A stable versionwas released in 2008. Adobe Air supports basic 3D. Adobe AIR allows rich internetapplications (HTML+Flash) to be deployed onto the desktop.
Summary
Adobe Air is primarily a technology for browser usage, such as websites. The 3D supportis limited as it is not its primary purpose.
A.2.21 OpenSceneGraph
OpenSceneGraph is a high performance 3D engine toolkit. The toolkit is developedas an open-source project and is free to distribute as a proprietary application underOpenSceneGraph Public License. OpenSceneGraph has existed since 1998, when itstarted as a hoppy project. Today there are 365 contributors in the project.
Applications developed in OpenSceneGraph can be run under Windows, Mac OS X,Linux and with limited support in IRIX, Solaris and FreeBSD.
Summary
We have chosen to not go further with this technology. OpenSceneGraph does not standout in the area of 3D technologies. During a short evaluation period this technologyturned out to be complicated to install and develop in.
A.2.22 Irrlicht
Irrlicht is a 3D engine that runs on Microsoft Windows, Linux, Mac OS X, WindowsCE.
It is licensed under the Zlib license (similar to GNU GPL). Support is providedthrough a online API for C & .NET, a big developer forum and lots of tutorials at thewebsite.
Coding is done in C++ and .NET and there are also language bindings for Java,Ruby, Lua, Python etc. Irrlicht is open Source and the project was first started in 2002.
Summary
Seems easy to use, and supports a number of languages (with addons) but it is hard tofind impressing examples of applications developed in Irrlicht.
A.2.23 Genesis 3D
Genesis 3D is a graphics engine that runs on Microsoft Windows 95/98/XP/2000. Itcan be developed in environments such as Visual Studio. The license terms are US$10,000 for each title, otherwise free to use for non-commercials. It is supported by abig community and is developed by an open source group called Eclipse Entertainment.
Genesis3D was founded by Eclipse Entertainment in 1998.
Summary
This technology is yet another open source 3D game engine; it does not really provideany features that make it stand out.
A.2. Real-time 3D engines 59
A.2.24 Crystal Space
Crystal Space is a 3D game engine that runs on Microsoft Windows, Linux, UNIX andMac OS X and is licensed under the lesser GNU GPL. Support is provided through aforum, manual and tutorials at the website and the language for developing is C++. Itis developed by the open source group The Crystal Space Group and has existed since1998.
Summary
Just like Genesis 3D, this is another game engine that is very similar to most other opensource game engines.
A.2.25 Java FX
Java FX is an internet multimedia technology that deploys a RIA format (Rich InternetApplication, like Adobe Flash and Microsoft Silverlight). It can be run and developedon any platforms that support the Java Runtime Environment and Java ME.
The license is free and support can be found on developer forums, code support canbe found on the Java Online API. Java FX is produced by SUN Technologies. 3D iscurrently only supported using external libraries.
Summary
This is a browser technology developed by SUN in order to provide an option for Javadevelopers to create nice looking graphics in their GUI applications. But the technologyhas currently no hardware support for 3D.