Embed Size (px)
Citation preview
Human Molecular Genetics
doi:10.1093/hmg/ddn188 First published online 1 Jul 2008; Hum. Mol. Genet.
Huff, Rebecca L. Pollex and Robert A. Hegele Jian Wang, Matthew R. Ban, Guang Yong Zou, Henian Cao, Tim Lin, Brooke A. Kennedy, Sonia Anand, Salim Yusuf, Murray W.Polygenic determinants of severe hypertriglyceridemia
http://hmg.oxfordjournals.orgThe full text of this article, along with updated information and services is available online at
Reprints http://www.oxfordjournals.org/corporate_services/reprints.html
Reprints of this article can be ordered at
Email and RSS alerting Sign up for email alerts, and subscribe to this journal’s RSS feeds at http://hmg.oxfordjournals.org
image downloadsPowerPoint® Images from this journal can be downloaded with one click as a PowerPoint slide.
Journal informationat http://hmg.oxfordjournals.org Additional information about Human Molecular Genetics, including how to subscribe can be found
Published on behalf ofhttp://www.oxfordjournals.org Oxford University Press
at University of Western Ontario on 31 July 2008 http://hmg.oxfordjournals.orgDownloaded from

1
© The Author 2008. Published by Oxford University Press. All rights reserved.
For permissions, please e-mail: [email protected]
Polygenic determinants of severe hypertriglyceridemia
Jian Wang1, Matthew R. Ban
1, Guang Yong Zou
2, Henian Cao
1, Tim Lin
1,
Brooke A. Kennedy1, Sonia Anand
3, Salim Yusuf
3, Murray W. Huff
1, Rebecca L. Pollex
1
and Robert A. Hegele1, *
1) Vascular Biology Research Group and 2) Clinical Trials Group,
Robarts Research Institute and Schulich School of Medicine and Dentistry,
University of Western Ontario, London, Ontario, Canada N6A 5K8; and
3) Population Health Research Institute, McMaster University,
Hamilton Health Sciences, Hamilton, Ontario, Canada L8L 2X2
Correspondence:
* Robert A. Hegele, MD FRCPC FACP
Blackburn Cardiovascular Genetics Laboratory, Robarts Research Institute
#406-100 Perth Drive, Box 5015, London, Ontario, Canada N6A 5K8
tel: 519-663-3461; fax: 519-663-3037; email: [email protected]
HMG Advance Access published July 1, 2008
2
ABSTRACT
Recent genome-wide association (GWA) studies have identified new genetic
determinants of complex quantitative traits, including plasma triglyceride (TG). We
hypothesized that common variants associated with mild TG variation identified in GWA
studies would also be associated with severe hypertriglyceridemia (HTG). We studied
132 patients of European ancestry with severe HTG (fasting plasma TG >10 mmol/L),
who had no mutations found by re-sequencing of candidate genes, and 351 matched
normolipidemic controls. We determined genotypes for: GALNT2 rs4846914,
TBL2/MLXIPL rs17145738, TRIB1 rs17321515, ANGPTL3 rs12130333, GCKR
rs780094, APOA5 rs3135506 (S19W), APOA5 dbSNP rs662799 (-1131T>C), APOE
(isoforms) and LPL rs328 (S447X). We found that: 1) genotypes, including those of
APOA5 S19W, APOA5 -1131C>T, APOE, GCKR, TRIB1and TBL2/MLXIPL, were
significantly associated with severe HTG; 2) odds ratios for these genetic variables were
significant in both univariate and multivariate regression analyses, irrespective of the
presence or absence of diabetes or obesity; and 3) a significant fraction – about one-
quarter - of the explained variation in disease status was associated with these genotypes.
Therefore, common SNPs that are associated with mild TG variation in GWA studies of
normolipidemic subjects are also associated with severe HTG. Our findings are
consistent with the emerging model of a complex genetic trait. At the extremes of a
quantitative trait, such as severe HTG, are found the cumulative contributions of both
multiple rare alleles with large genetic effects and common alleles with small effects.
3
INTRODUCTION
Plasma lipoproteins are archetypal complex traits whose inter-individual
variation is determined by both common and rare genetic variants (1). Recent genome-
wide association studies (GWASs) have identified new genetic determinants of several
complex quantitative traits, including plasma lipoproteins (2-7). These studies evaluated
large samples of normolipidemic (i.e. nondyslipidemic) individuals and showed that
multiple genetic determinants – single nucleotide polymorphisms (SNPs) - had replicable
modest associations with plasma concentrations of total, low-density lipoprotein (LDL)
and high-density lipoprotein (HDL) cholesterol and triglyceride (TG) (2, 3, 6, 7). For
instance, numerous common genomic variants, including several within well-established
candidate genes contributed cumulatively to ~12% of plasma LDL cholesterol variation
in essentially normolipidemic samples (2), which was consistent with earlier findings in
genetic isolates (8). In addition, associations were observed with many genes that had no
previously known biochemical connection with lipoproteins (2, 3, 6, 7). The potential
diagnostic or prognostic utility of lipoprotein-associated markers identified in GWASs as
predictive of individual risk of cardiovascular disease or dyslipoproteinemia is unsettled,
in part because the individual markers hold only a modest influence on lipoprotein traits
(1, 4, 5). Furthermore, the association of these newly discovered common markers with
severe dyslipidemia is unknown.
The genetic determinants of severe hypertriglyceridemia (HTG; MIM 144650),
also called Fredrickson or World Health Organization hyperlipoproteinemia (HLP) type
5, are incompletely defined. Plasma TG >10 mmol/L is found in 1:600 North Americans
(9). Candidate gene resequencing showed that ~10% of patients with plasma TG >10
4
mmol/L together with fasting chylomicronemia had heterozygous loss-of-function
missense mutations, primarily in the LPL gene encoding lipoprotein lipase, compared
with only 0.2% of controls (carrier odds ratio [OR] 52, 95% confidence interval [CI] 8.6
to 319) (9). Furthermore, the common APOA5 S19W missense variant was associated
with severe HTG (carrier OR 5.5 95% CI 3.3 to 9.1) (9). We hypothesized that common
variants recently associated with relatively normal plasma TG identified in GWASs (3, 7)
would also be associated with severe HTG. We evaluated polygenic determinants of
severe HTG using multivariate linear and logistic regression analysis. We found
significant contributions to severe HTG of common variants in several genes that
included APOA5, APOE, TRIB1, TBL2/MLXIPL, GCKR and GALNT2, underscoring this
trait’s complex polygenic nature and indicating that genetic determinants of modest TG
variation also underlie a related, but rarer and more extreme disease phenotype.
RESULTS
Clinical and biochemical features of study subjects
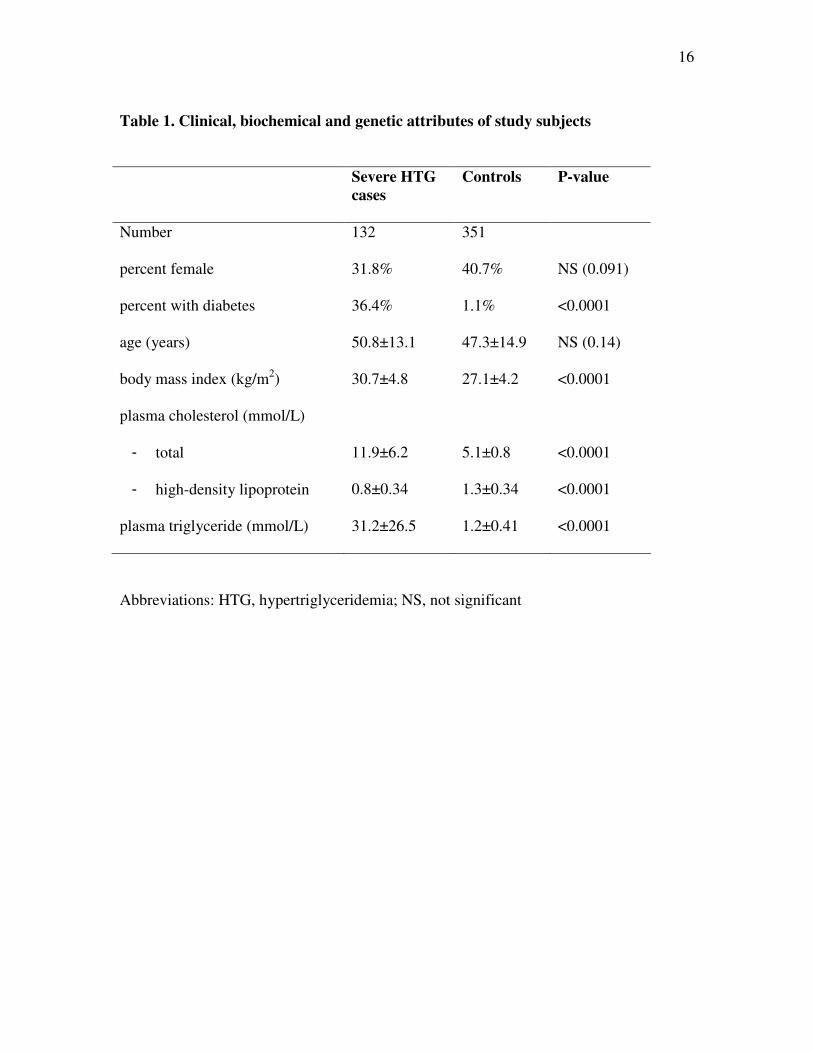
Baseline attributes of the study sample are shown in Table 1. After excluding 16
patients with heterozygous loss-of-function mutation in LPL, APOC2 or APOA5 (9), 132
patients or cases with severe HTG remained for analysis. These were each matched with
up to 4 normolipidemic controls based on age within 5 years and sex. By definition,
severe HTG patients had markedly higher plasma TG and total cholesterol and
significantly lower HDL cholesterol (Table 1). Plasma TG concentration in severe HTG
patients ranged from 10.1 to 180 mmol/L. In addition, 37/132 severe HTG patients
5
(28.0%) had been hospitalized on ≥1 occasion with pancreatitis and 90/132 (68.2%) had
at least one first degree relative treated for dyslipidemia.
Differences in distribution of DNA variants between severe hypertriglyceridemia
cases and controls
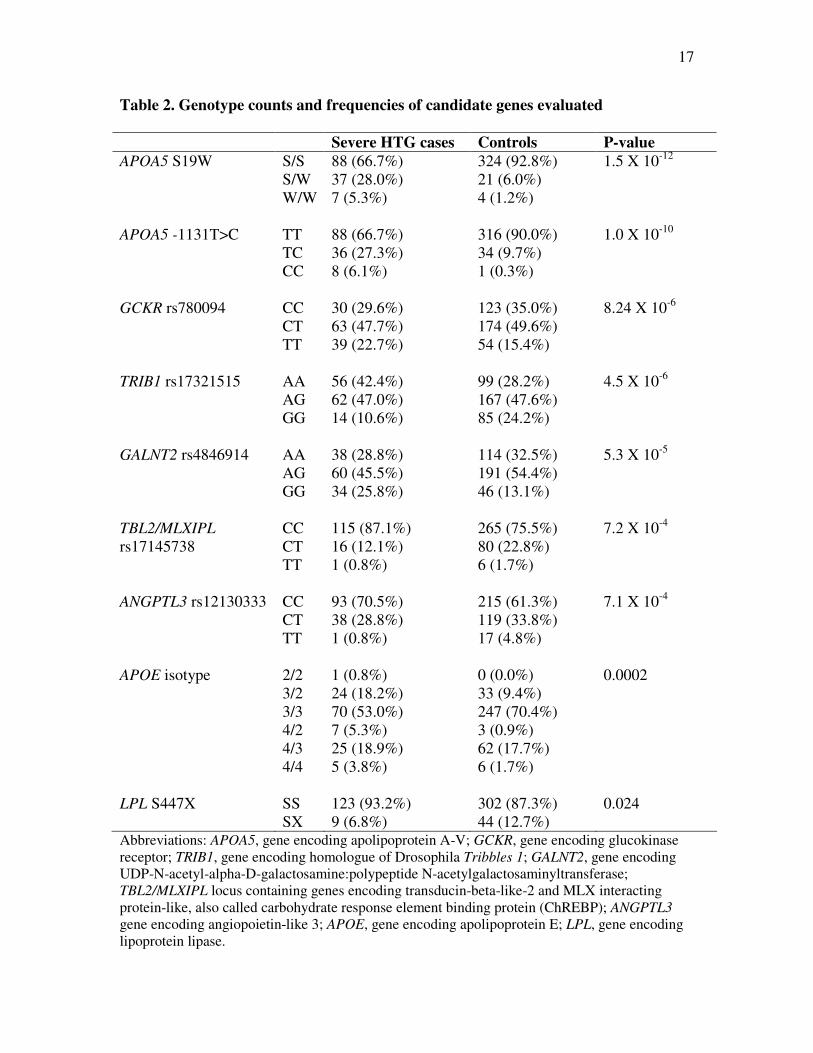
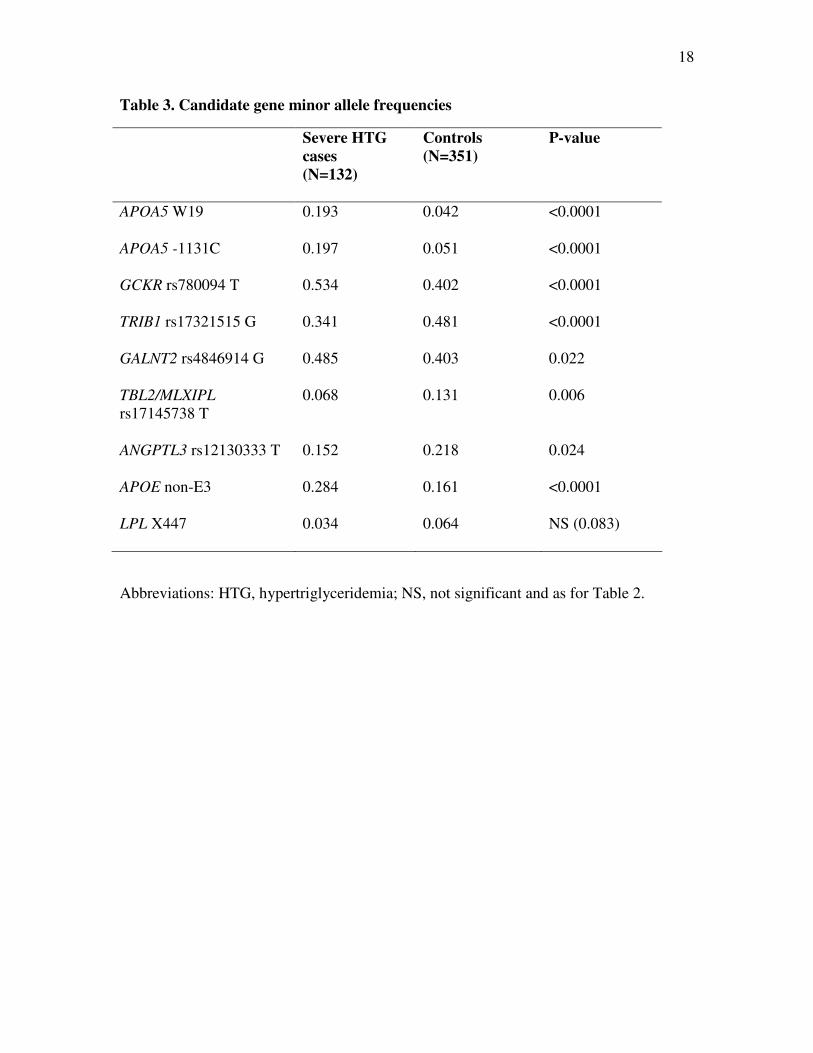
Genotype counts and frequencies in severe HTG patients and controls are shown
in Table 2. Minor allele frequencies (MAFs) for each genotype in severe HTG cases and
controls are shown in Table 3. Frequencies of each genotype did not deviate from Hardy-
Weinberg equilibrium. The significance of the differences in genotype frequencies
between severe HTG cases and controls are shown in Table 2: in univariate chi-square
analysis, genotype frequencies of each evaluated marker had a significantly different
distribution in HTG cases compared with controls (range of P-values 0.024 to 1.5 X 10-
12). The significance of the differences in MAFs between severe HTG cases and controls
are shown in Table 3: the MAF of each marker studied was significantly different
between groups.
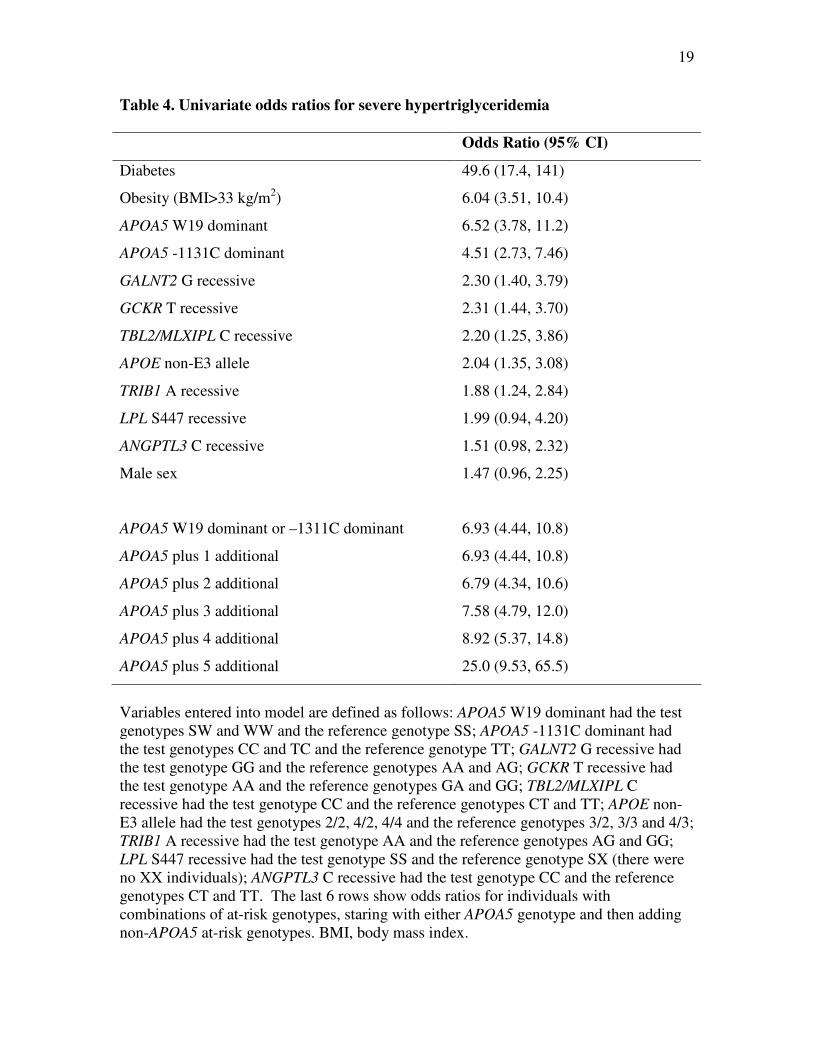
Genetic risk of severe hypertriglyceridemia: univariate odds ratios
Univariate ORs for severe HTG were determined for two clinical variables –
namely diabetes and marked obesity (defined as BMI >33 kg/m2) and for the HTG-risk
genotype for each genomic variant. Both dominant and recessive models for each
genotype were evaluated and the model that provided the strongest and most significant
OR was chosen to serve as the nominal genotype variable for subsequent multivariate
analyses. There was no significant linkage disequilibrium between the two APOA5
6
variants (P=0.23), so these were treated as independent variables for the purpose of
subsequent analyses. For APOE, presence or absence of the common E3/3 genotype was
evaluated.
Univariate ORs and 95% CIs are shown in Table 4 for the most significantly
associated genetic model for each genotype: only the ANGPTL3 and LPL genotypes were
not significant for either dominant or recessive model. However, both APOA5 variants,
APOE non-E3/3 genotype, GCKR TT recessive genotype; TRIB1 AA recessive genotype
and TBL2/MLXIPL CC recessive genotype each had significant ORs for severe HTG.
Univariate ORs for severe HTG were also determined for combinations of genetic
variables. Since both APOA5 variants were very strongly associated with HTG, the
presence of either served as the primary genetic predictor: the OR was 6.93 (95% CI 4.44
to 10.8). Adding any one or two of the other genetic variables did not substantially
change this OR. However, adding 3, 4 or 5 additional genetic markers to the presence of
either APOA5 marker sequentially increased the OR from 7.58 to 8.92 to 25.0, so that
when an individual had 7 genetic risk markers (i.e. both APOA5 risk markers plus any
other five), the resulting OR for severe HTG was very high indeed.
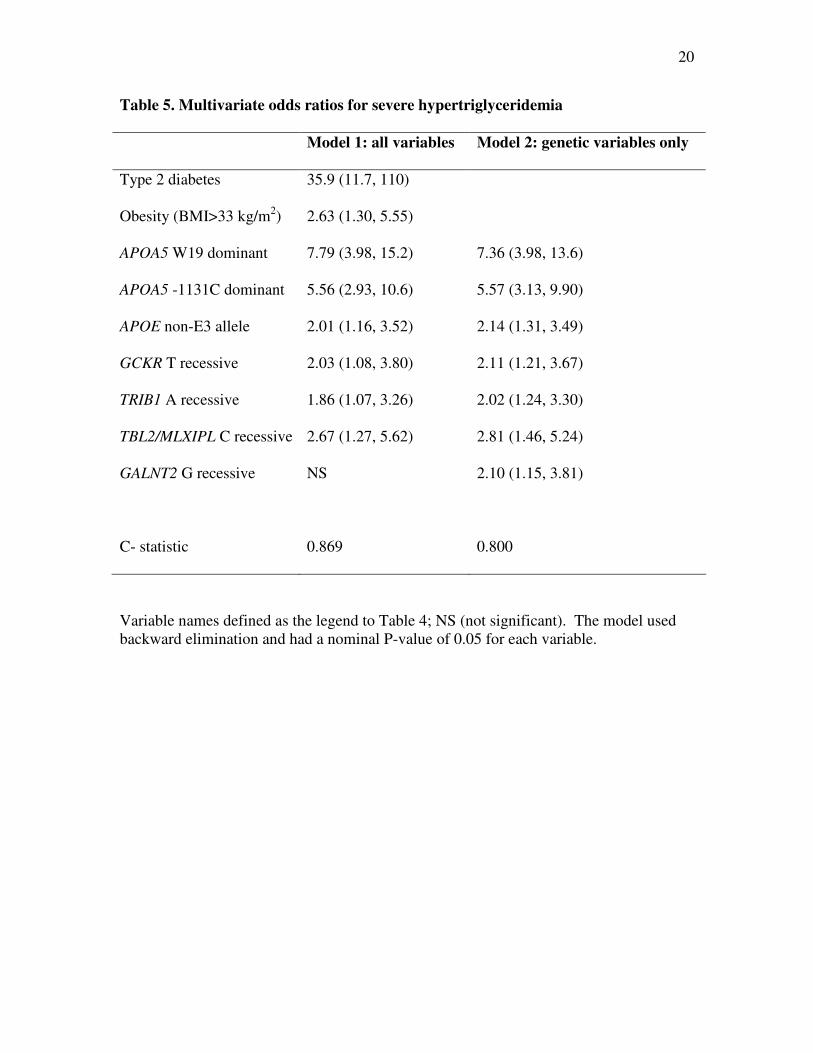
Polygenic determinants of severe hypertriglyceridemia: multivariate regression
analysis
The multivariate ORs for severe HTG were calculated using the Wald statistic in
multivariate logistic regression analysis with stepwise addition of variables and P<0.05
for each step (Table 5). The first model, which included two clinical variables in addition
to nine genetic variables, found that diabetes, obesity, two APOA5 markers, APOE non-
7
E3 genotype and GCKR, TRIB1 and TBL2/MLXIPL genotypes were significantly
associated with severe HTG. The C-statistic, which corresponds to the area under the
receiver-operator curve for a diagnostic test, was 0.869 for this particular combination of
clinical and genetic markers (Table 5). Hosmer and Lomeshow goodness of fit test
showed that the models explained the observed data (χ82 = 10.2; P=0.25 and χ8
2 = 7.47;
P=0.38). The second model assessed only genetic variables: the same genotypes from the
first model remained significantly associated in the second model with one additional
significantly associated genotype – namely GALNT2, assuming a recessive effect for the
G allele. The C-statistic was 0.800 for this combination of genetic markers (Table 5).
The proportion of contribution of specific variables to severe HTG was calculated
using partial r2–values in multivariate linear regression analysis with stepwise addition of
variables and P<0.05 for each step (Table 5). The first model, which included two
clinical variables in addition to nine genetic variables, found that diabetes, APOA5
markers, obesity, TBL2/MLXIPL genotype, APOE genotype, TRIB1 genotype and GCKR
genotype were significantly associated with severe HTG. The model explained ~43% of
total variation in case versus control status, and of the explained variation, the total
contribution of the genetic variables was ~40% (range ~1 to 25%). The second model
assessed only genetic variables: the same genotypes from the first model remained
significantly associated in the second model with one additional significantly associated
genotype – namely GALNT2. The model accounted for ~25% of total variation in case
versus control status. Of explained variation, genetic markers accounted for ~1% each.
8
DISCUSSION
The principal novel findings in this study of newly identified genetic markers in
patients with severe HTG were: 1) genotypes, including those of APOA5 S19W, APOA5
-1131C>T, APOE, GCKR rs780094, TRIB1 rs17321515, GALNT2 rs4846914 and
TBL2/MLXIPL rs17145738, were significantly associated with severe HTG; 2) ORs for
these genetic variables were significant in both univariate and multivariate regression
analyses, irrespective of the presence or absence of diabetes or obesity; and 3) a
significant fraction – about one-quarter - of the attributable variation in disease status was
associated with these genotypes. The findings further indicate that several genotypes that
were found by GWA studies to be associated with moderate variation in plasma TG in
samples without severe dyslipidemia are also associated with severe HTG. This confirms
the complex, polygenic nature of severe HTG and also replicates the importance of loci
identified in GWA as being more generally important in TG metabolism, especially in the
pathogenesis of severe HTG with chylomicronemia and increased pancreatitis risk.
The current findings extend our previous results, which showed that a relatively
small proportion (~10%) of severe HTG subjects were carriers of rare, heterozygous loss-
of-function mutations in candidate lipoprotein metabolism genes (9). In the current
study, in which subjects with rare loss-of-function mutations were excluded, we found
that common SNP alleles, including those in both known genes, such as APOA5, LPL and
APOE, and in genes recently implicated as positional candidates, such as TRIB1, GCKR,
TBL2/MLXIPL, GALNT2 and ANGPTL3, are found in a substantial proportion – almost
two-thirds – of individuals with severe HTG. Thus, the genetic component of this
complex metabolic trait is comprised of both rare and common variants.
9
We selected TBL2/MLXIPL rs17145738; TRIB1 rs17321515; GALNT2
rs4846914; ANGPTL3 rs12130333 and GCKR rs780094 because they were found by
GWASs to be associated with modest variation in TG in large normolipidemic population
samples. In each case, the allele that was associated with severe HTG in our study was
also associated in the GWASs with higher plasma TG concentration: GALNT2 rs4846914
G, TBL2/MLXIPL rs17145738 C, TRIB1 rs17321515 A, ANGPTL3 rs12130333 C, and
GCKR rs780094 T. Our study indicates that these common – and so far mechanistically
undefined - markers and loci are strongly and cumulatively associated with severely
disturbed TG metabolism. This further suggests that rare loss-of-function variants in
these genes, or in proximal genes for which the SNPs are markers, might be determinants
of severe HTG. Resequencing of genes marked by these SNPs appears thus to be
indicated. But while the findings clearly link these genotypes with severe HTG, other
factors must be important both in severe HTG patients with and without the genotypes
evaluated here, since ~30% of severe HTG patients had neither a rare dysfunctional
variant nor an at-risk SNP genotype.
Thus, our findings are consistent with the emerging model but among individuals
at the extremes of a complex genetic trait, such as severe HTG (HLP type 5), are found
the cumulative contributions of both multiple rare alleles with large genetic effects and
multiple common alleles with small effects. We do not suggest that the variants studied
here are directly causative because serve HTG (HLP type 5) is a complex trait with no
single simple genetic cause and additional factors, both genetic and non-genetic, are
likely to be important determinants. However, the present study substantially increases
the proportion of patients with severe HTG – now about two-thirds of patients - who have
10
a significantly associated underlying genetic predisposition. The findings further confirm
that the genetic contribution to severe HTG is complex and suggest that other genes or
non-genetic factors may still have an important role to play. Also, the results show that
significant associations can be identified by studying a relatively small number of
subjects with extreme values of a quantitative lipoprotein trait.
MATERIALS AND METHODS
Study subjects
We studied 148 patients of European geographic ancestry with severe HTG,
defined as having fasting (>12 hour) plasma TG >10 mmol/L documented on 2
occasions, from a single tertiary referral lipid clinic (9). Patients underwent complete
medical history and examination; basic clinical, biochemical, and demographic variables
were collected. Normolipidemic adult controls were taken from the European subgroup
of the Study of Health Assessment and Risk in Ethnic groups (SHARE), a survey of
cardiovascular risk factors in Canadian subpopulations (10) together with healthy
population-based controls from the same region of Canada. No control had ischemic
heart disease and there was no use of medications among these healthy control subjects.
All patients provided informed consent for DNA analysis.
DNA analysis
DNA was extracted as described (9). For SNP genotyping, we selected markers
that were replicably associated with plasma TG in at least two studies (3, 7, 11) and that
showed relatively strong association in each study (3, 7, 11). The selected genes and
11
dbSNP identification numbers were: GALNT2 rs4846914, TBL2/MLXIPL rs17145738,
TRIB1 rs17321515, ANGPTL3 rs12130333, GCKR rs780094, APOA5 rs3135506 (S19W)
and LPL rs328 (S447X) were genotyped using validated genotyping assays (TaqMan®
SNP Genotyping Assays, Applied Biosystems, Foster City, CA). APOA5 -1131T>C
(dbSNP rs662799) was genotyped using a custom designed genotyping assay (TaqMan®
SNP Custom Genotyping Assays, Applied Biosystems, Foster City, CA). The custom
probe uses primers as follows: 5’- CCC TGC GAG TGG AGT TCA -3’ and 5’- CTC
TGA GCC CCA GGA ACT G. SNP genotyping was performed using an allelic
discrimination assay using the 7900HT Fast Real-Time PCR System (Applied
Biosystems, Foster City, CA) and genotypes were read using automated software (SDS
2.3, Applied Biosystems, Foster City, CA). Reactions were run in 5 µL volumes using an
amplification protocol of 95oC for 10 minutes, followed by 42 cycles of 95
oC for 15
seconds, then 60oC for 1.5 minutes. An established method was used to genotype APOE
isoforms (12). For SNP analysis, we excluded patients with a known sequence-proven
loss-of-function mutation in LPL, APOC2 or APOA5, encoding lipoprotein lipase, apo C-
II and apo A-V, respectively (9). Blinded between-day replicated genotypes of a random
3% of samples showed >99.9% concordance across all markers.
Statistical analysis
The two-sample t-test was used to compare the difference between case and
control groups for quantitative traits, while Pearson’s chi-square test was used to compare
discrete traits with exact P-values obtained whenever cell sizes <5. Deviations of
genotype frequency from the Hardy-Weinberg assumption were assessed using a chi-
12
square test. Maximal likelihood linkage disequilibrium was estimated using PHASE v2.0
(13). To assess the relationship of SNPs with severe HTG, dominant and recessive
models of minor allele genotypes were tested for each gene. A simple logistic regression
model was used to assess univariate association between each SNP and severe HTG. A
multiple logistic regression model with backward elimination procedure was adopted to
assess the joint effects of genes and clinical variables such as presence of diabetes and
marked obesity, i.e. body mass index (BMI) >33 kg/m2. For a genotype with frequency
0.20, the study sample afforded statistical power (alpha error level =0.05) to detect 1.4-,
1.6-, 1.8- and 2.0-fold increases in frequency of 59.1%, 85.7%, 96.9% and 99.9%,
respectively. The adequacy of the final models was assessed using the Hosmer-
Lemeshow goodness-of-fit test. Relative importance of genetic and clinical variables was
quantified using the R-square computed with logistic regression raw residuals (14).
Statistical significance was taken at nominal P-value <0.05 for all comparisons. All
analyses were performed using SAS version 9.1 (SAS Institute, Cary, NC), with the
exception the exact tests which were performed using StatXact8 (Cytel Inc, Cambridge,
MA).

13
ACKNOWLEDGMENTS
Rebecca Provost and John Robinson provided outstanding technical assistance.
FUNDING
Jacob J. Wolfe Distinguished Medical Research Chair; the Edith Schulich Vinet
Canada Research Chair (Tier I) in Human Genetics; the Jean Davignon Award for
Cardiovascular Research (Pfizer, Canada); Career Investigator award from the Heart and
Stroke Foundation of Ontario; Canadian Institutes for Health Research (MOP-13430,
MOP-39533, MOP-39833); Heart and Stroke Foundation of Ontario (PRG-5967, NA-
6059, T-6018); Ontario Research Fund; Genome Canada through the Ontario Genomics
Institute.
CONFLICT OF INTEREST STATMENT
All of the authors declare no conflict of interests.

14
REFERENCES
1. Pollex, R.L. and Hegele, R.A. (2007) Genetic determinants of plasma
lipoproteins. Nat. Clin. Pract. Cardiovasc. Med., 4, 600-609.
2. Kathiresan, S., Melander, O., Anevski, D., Guiducci, C., Burtt, N.P., Roos, C.,
Hirschhorn, J.N., Berglund, G., Hedblad, B., Groop, L. et al. (2008)
Polymorphisms associated with cholesterol and risk of cardiovascular events. N.
Engl. J. Med., 358, 1240-1249.
3. Kathiresan, S., Melander, O., Guiducci, C., Surti, A., Burtt, N.P., Rieder, M.J.,
Cooper, G.M., Roos, C., Voight, B.F., Havulinna, A.S. et al. (2008) Six new loci
associated with blood low-density lipoprotein cholesterol, high-density
lipoprotein cholesterol or triglycerides in humans. Nat. Genet., 40, 189-197.
4. Kathiresan, S., Musunuru, K. and Orho-Melander, M. (2008) Defining the
spectrum of alleles that contribute to blood lipid concentrations in humans. Curr.
Opin. Lipidol., 19, 122-127.
5. Krauss, R.M. (2008) What can the genome tell us about LDL cholesterol? Lancet,
371, 450-452.
6. Sandhu, M.S., Waterworth, D.M., Debenham, S.L., Wheeler, E., Papadakis, K.,
Zhao, J.H., Song, K., Yuan, X., Johnson, T., Ashford, S. et al. (2008) LDL-
cholesterol concentrations: a genome-wide association study. Lancet, 371, 483-
491.
7. Willer, C.J., Sanna, S., Jackson, A.U., Scuteri, A., Bonnycastle, L.L., Clarke, R.,
Heath, S.C., Timpson, N.J., Najjar, S.S., Stringham, H.M. et al. (2008) Newly
identified loci that influence lipid concentrations and risk of coronary artery
disease. Nat. Genet., 40, 161-169.
8. Hegele, R.A., Brunt, J.H. and Connelly, P.W. (1995) Multiple genetic
determinants of variation of plasma lipoproteins in Alberta Hutterites.
Arterioscler. Thromb. Vasc. Biol., 15, 861-871.
9. Wang, J., Cao, H., Ban, M.R., Kennedy, B.A., Zhu, S., Anand, S., Yusuf, S.,
Pollex, R.L. and Hegele, R.A. (2007) Resequencing genomic DNA of patients
with severe hypertriglyceridemia (MIM 144650). Arterioscler. Thromb. Vasc.
Biol., 27, 2450-2455.
10. Anand, S.S., Yusuf, S., Vuksan, V., Devanesen, S., Teo, K.K., Montague, P.A.,
Kelemen, L., Yi, C., Lonn, E., Gerstein, H. et al. (2000) Differences in risk
factors, atherosclerosis, and cardiovascular disease between ethnic groups in
Canada: the Study of Health Assessment and Risk in Ethnic groups (SHARE).
Lancet, 356, 279-284.
11. Saxena, R., Voight, B.F., Lyssenko, V., Burtt, N.P., de Bakker, P.I., Chen, H.,
Roix, J.J., Kathiresan, S., Hirschhorn, J.N., Daly, M.J. et al. (2007) Genome-wide
association analysis identifies loci for type 2 diabetes and triglyceride levels.
Science, 316, 1331-1336.
12. Hixson, J.E. and Vernier, D.T. (1990) Restriction isotyping of human
apolipoprotein E by gene amplification and cleavage with HhaI. J. Lipid Res., 31,
545-548.
15
13. Stephens, M. and Donnelly, P. (2003) A comparison of bayesian methods for
haplotype reconstruction from population genotype data. Am. J. Hum. Genet., 73,
1162-1169.
14. Heinze, G. and Schemper, M. (2003) Comparing the importance of prognostic
factors in Cox and logistic regression using SAS. Comput. Methods Programs
Biomed., 71, 155-163.
16
Table 1. Clinical, biochemical and genetic attributes of study subjects
Severe HTG
cases
Controls P-value
Number 132 351
percent female 31.8% 40.7% NS (0.091)
percent with diabetes 36.4% 1.1% <0.0001
age (years) 50.8±13.1 47.3±14.9 NS (0.14)
body mass index (kg/m2) 30.7±4.8 27.1±4.2 <0.0001
plasma cholesterol (mmol/L)
- total
- high-density lipoprotein
11.9±6.2
0.8±0.34
5.1±0.8
1.3±0.34
<0.0001
<0.0001
plasma triglyceride (mmol/L) 31.2±26.5 1.2±0.41 <0.0001
Abbreviations: HTG, hypertriglyceridemia; NS, not significant
17
Table 2. Genotype counts and frequencies of candidate genes evaluated
Severe HTG cases Controls P-value
APOA5 S19W S/S
S/W
W/W
88 (66.7%)
37 (28.0%)
7 (5.3%)
324 (92.8%)
21 (6.0%)
4 (1.2%)
1.5 X 10⁻¹²
APOA5 -1131T>C TT
TC
CC
88 (66.7%)
36 (27.3%)
8 (6.1%)
316 (90.0%)
34 (9.7%)
1 (0.3%)
1.0 X 10⁻¹⁰
GCKR rs780094 CC
CT
TT
30 (29.6%)
63 (47.7%)
39 (22.7%)
123 (35.0%)
174 (49.6%)
54 (15.4%)
8.24 X 10⁻⁶
TRIB1 rs17321515 AA
AG
GG
56 (42.4%)
62 (47.0%)
14 (10.6%)
99 (28.2%)
167 (47.6%)
85 (24.2%)
4.5 X 10⁻⁶
GALNT2 rs4846914 AA
AG
GG
38 (28.8%)
60 (45.5%)
34 (25.8%)
114 (32.5%)
191 (54.4%)
46 (13.1%)
5.3 X 10⁻⁵
TBL2/MLXIPL
rs17145738
CC
CT
TT
115 (87.1%)
16 (12.1%)
1 (0.8%)
265 (75.5%)
80 (22.8%)
6 (1.7%)
7.2 X 10⁻⁴
ANGPTL3 rs12130333 CC
CT
TT
93 (70.5%)
38 (28.8%)
1 (0.8%)
215 (61.3%)
119 (33.8%)
17 (4.8%)
7.1 X 10⁻⁴
APOE isotype 2/2
3/2
3/3
4/2
4/3
4/4
1 (0.8%)
24 (18.2%)
70 (53.0%)
7 (5.3%)
25 (18.9%)
5 (3.8%)
0 (0.0%)
33 (9.4%)
247 (70.4%)
3 (0.9%)
62 (17.7%)
6 (1.7%)
0.0002
LPL S447X SS
SX
123 (93.2%)
9 (6.8%)
302 (87.3%)
44 (12.7%)
0.024
Abbreviations: APOA5, gene encoding apolipoprotein A-V; GCKR, gene encoding glucokinase
receptor; TRIB1, gene encoding homologue of Drosophila Tribbles 1; GALNT2, gene encoding
UDP-N-acetyl-alpha-D-galactosamine:polypeptide N-acetylgalactosaminyltransferase;
TBL2/MLXIPL locus containing genes encoding transducin-beta-like-2 and MLX interacting
protein-like, also called carbohydrate response element binding protein (ChREBP); ANGPTL3
gene encoding angiopoietin-like 3; APOE, gene encoding apolipoprotein E; LPL, gene encoding
lipoprotein lipase.
18
Table 3. Candidate gene minor allele frequencies
Severe HTG
cases
(N=132)
Controls
(N=351)
P-value
APOA5 W19 0.193 0.042 <0.0001
APOA5 -1131C 0.197 0.051 <0.0001
GCKR rs780094 T 0.534 0.402 <0.0001
TRIB1 rs17321515 G 0.341 0.481 <0.0001
GALNT2 rs4846914 G 0.485 0.403 0.022
TBL2/MLXIPL
rs17145738 T
0.068 0.131 0.006
ANGPTL3 rs12130333 T 0.152 0.218 0.024
APOE non-E3 0.284 0.161 <0.0001
LPL X447 0.034 0.064 NS (0.083)
Abbreviations: HTG, hypertriglyceridemia; NS, not significant and as for Table 2.
19
Table 4. Univariate odds ratios for severe hypertriglyceridemia
Odds Ratio (95% CI)
Diabetes 49.6 (17.4, 141)
Obesity (BMI>33 kg/m2) 6.04 (3.51, 10.4)
APOA5 W19 dominant 6.52 (3.78, 11.2)
APOA5 -1131C dominant 4.51 (2.73, 7.46)
GALNT2 G recessive 2.30 (1.40, 3.79)
GCKR T recessive 2.31 (1.44, 3.70)
TBL2/MLXIPL C recessive 2.20 (1.25, 3.86)
APOE non-E3 allele 2.04 (1.35, 3.08)
TRIB1 A recessive 1.88 (1.24, 2.84)
LPL S447 recessive 1.99 (0.94, 4.20)
ANGPTL3 C recessive 1.51 (0.98, 2.32)
Male sex 1.47 (0.96, 2.25)
APOA5 W19 dominant or –1311C dominant 6.93 (4.44, 10.8)
APOA5 plus 1 additional 6.93 (4.44, 10.8)
APOA5 plus 2 additional 6.79 (4.34, 10.6)
APOA5 plus 3 additional 7.58 (4.79, 12.0)
APOA5 plus 4 additional 8.92 (5.37, 14.8)
APOA5 plus 5 additional 25.0 (9.53, 65.5)
Variables entered into model are defined as follows: APOA5 W19 dominant had the test
genotypes SW and WW and the reference genotype SS; APOA5 -1131C dominant had
the test genotypes CC and TC and the reference genotype TT; GALNT2 G recessive had
the test genotype GG and the reference genotypes AA and AG; GCKR T recessive had
the test genotype AA and the reference genotypes GA and GG; TBL2/MLXIPL C
recessive had the test genotype CC and the reference genotypes CT and TT; APOE non-
E3 allele had the test genotypes 2/2, 4/2, 4/4 and the reference genotypes 3/2, 3/3 and 4/3;
TRIB1 A recessive had the test genotype AA and the reference genotypes AG and GG;
LPL S447 recessive had the test genotype SS and the reference genotype SX (there were
no XX individuals); ANGPTL3 C recessive had the test genotype CC and the reference
genotypes CT and TT. The last 6 rows show odds ratios for individuals with
combinations of at-risk genotypes, staring with either APOA5 genotype and then adding
non-APOA5 at-risk genotypes. BMI, body mass index.
20
Table 5. Multivariate odds ratios for severe hypertriglyceridemia
Model 1: all variables Model 2: genetic variables only
Type 2 diabetes 35.9 (11.7, 110)
Obesity (BMI>33 kg/m2) 2.63 (1.30, 5.55)
APOA5 W19 dominant 7.79 (3.98, 15.2) 7.36 (3.98, 13.6)
APOA5 -1131C dominant 5.56 (2.93, 10.6) 5.57 (3.13, 9.90)
APOE non-E3 allele 2.01 (1.16, 3.52) 2.14 (1.31, 3.49)
GCKR T recessive 2.03 (1.08, 3.80) 2.11 (1.21, 3.67)
TRIB1 A recessive 1.86 (1.07, 3.26) 2.02 (1.24, 3.30)
TBL2/MLXIPL C recessive 2.67 (1.27, 5.62) 2.81 (1.46, 5.24)
GALNT2 G recessive NS 2.10 (1.15, 3.81)
C- statistic 0.869 0.800
Variable names defined as the legend to Table 4; NS (not significant). The model used
backward elimination and had a nominal P-value of 0.05 for each variable.
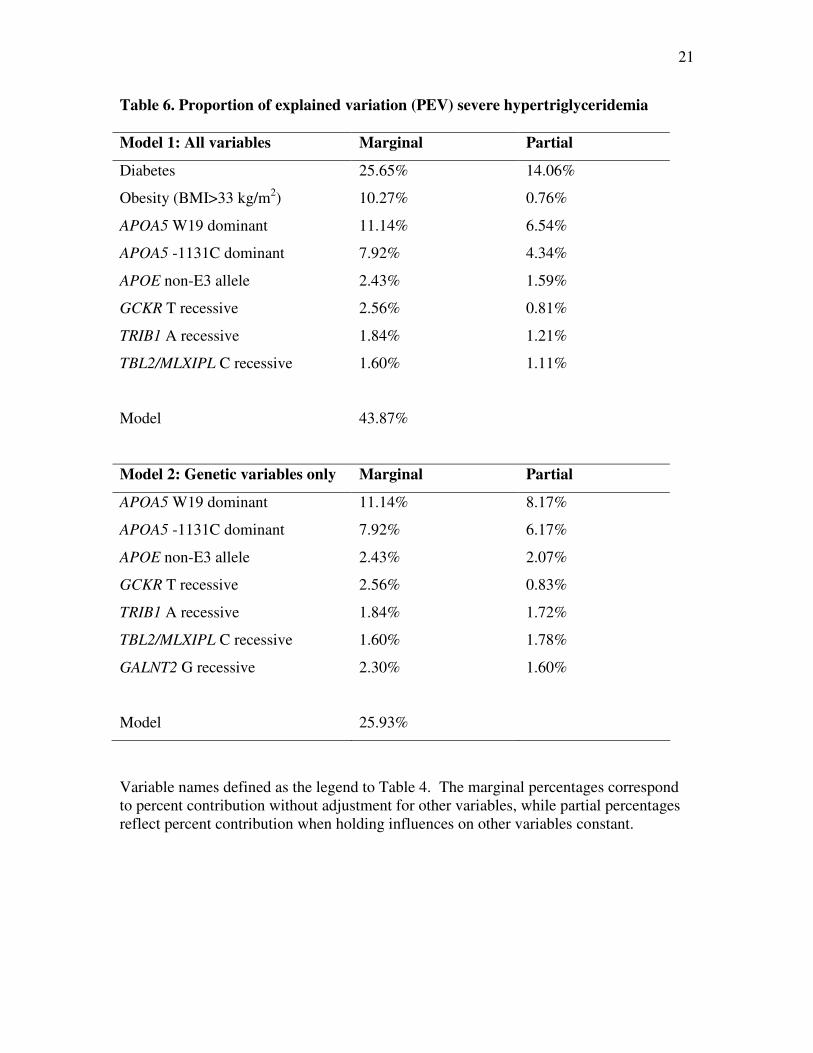
21
Table 6. Proportion of explained variation (PEV) severe hypertriglyceridemia
Model 1: All variables Marginal Partial
Diabetes 25.65% 14.06%
Obesity (BMI>33 kg/m2) 10.27% 0.76%
APOA5 W19 dominant 11.14% 6.54%
APOA5 -1131C dominant 7.92% 4.34%
APOE non-E3 allele 2.43% 1.59%
GCKR T recessive 2.56% 0.81%
TRIB1 A recessive 1.84% 1.21%
TBL2/MLXIPL C recessive 1.60% 1.11%
Model 43.87%
Model 2: Genetic variables only Marginal Partial
APOA5 W19 dominant 11.14% 8.17%
APOA5 -1131C dominant 7.92% 6.17%
APOE non-E3 allele 2.43% 2.07%
GCKR T recessive 2.56% 0.83%
TRIB1 A recessive 1.84% 1.72%
TBL2/MLXIPL C recessive 1.60% 1.78%
GALNT2 G recessive 2.30% 1.60%
Model 25.93%
Variable names defined as the legend to Table 4. The marginal percentages correspond
to percent contribution without adjustment for other variables, while partial percentages
reflect percent contribution when holding influences on other variables constant.