Embed Size (px)
Citation preview

Human PopulationHuman Population

Dr. Isaac Asimov (in this 1966 interview he predicted that Dr. Isaac Asimov (in this 1966 interview he predicted that world population would reach 6 billion near the year 2000. world population would reach 6 billion near the year 2000.
We passed the 6 billion mark in October 1999.) We passed the 6 billion mark in October 1999.)
""Which is the greater danger - nuclear Which is the greater danger - nuclear warfare or the population explosion? warfare or the population explosion? The latter absolutely! To bring about The latter absolutely! To bring about nuclear war, someone has to DO nuclear war, someone has to DO something; someone has to press a something; someone has to press a button. To bring about destruction by button. To bring about destruction by overcrowding, mass starvation, anarchy, overcrowding, mass starvation, anarchy, the destruction of our most cherished the destruction of our most cherished values-there is no need to do anything. values-there is no need to do anything. We need only do nothing except what We need only do nothing except what comes naturally - and breed. And how comes naturally - and breed. And how easy it is to do nothing." easy it is to do nothing."

LINEAR vs. LINEAR vs. EXPONENTIALEXPONENTIAL

http://www.ined.fr/en/everything_about_population/animations/world_population/

1
23

Countries and Areas Ranked by Population: 2009 Countries and Areas Ranked by Population: 2009 Rank Country or Area PopulationRank Country or Area Population
1 1 China China 1,338,612,9681,338,612,968 2 2 India India 1,156,897,7661,156,897,7663 3 United States United States 307,212,123307,212,1234 4 Indonesia Indonesia 240,271,522240,271,5225 5 Brazil Brazil 198,739,269198,739,2696 6 Pakistan Pakistan 174,578,558174,578,5587 Bangladesh 7 Bangladesh 156,050,883156,050,8838 8 NigeriaNigeria 149,229,090149,229,0909 9 RussiaRussia 140,041,247140,041,2471010 JapanJapan 127,078,679127,078,679237 Pitcairn Islands237 Pitcairn Islands 4848

DemographyDemography
The study of the size, The study of the size, composition, & distribution of composition, & distribution of human populations and human populations and consequences of changes in consequences of changes in these characteristics. these characteristics.

2009 Population Growth 2009 Population Growth RatesRates
United States = 0.98%United States = 0.98% China growth rate = 0.66%China growth rate = 0.66% India growth rate = 1.41%India growth rate = 1.41% Kenya growth rate = 2.69%Kenya growth rate = 2.69%
How to use this numberHow to use this number: Multiply : Multiply the country’s current population by the country’s current population by this number to see next year’s this number to see next year’s population totalpopulation total

Rule of 70Rule of 70
Determines Determines how many how many years it years it will take a will take a population population to double to double in size.in size.
70 70 == % growth rate% growth rate
EX: % growth rate for EX: % growth rate for world is = 1.13%world is = 1.13%
70 70 = 61 years = 61 years
1.411.41

ZPGZPG Zero Population GrowthZero Population Growth
Birth = DeathBirth = Death Immigrants = EmigrantsImmigrants = Emigrants Population growth rate = 0%Population growth rate = 0%
The Earth’s Goal for all countriesThe Earth’s Goal for all countries
Japan is actually declining in Japan is actually declining in population population Annual growth rate = -0.13Annual growth rate = -0.13

Earth’s Human Annual Rate Earth’s Human Annual Rate of Population Changeof Population Change
1963 = 2.2%1963 = 2.2% 2009 = 1.13%2009 = 1.13%
Rate of the world’s population is Rate of the world’s population is slowing, slowing, BUTBUT population went from population went from 3.2 billion to 6.7 billion during 3.2 billion to 6.7 billion during this time!this time!
Developing Countries = 1.46%Developing Countries = 1.46% Developed Countries = 0.25%Developed Countries = 0.25% Fastest growing countries: Fastest growing countries:
INDIA, KENYA, PAKISTAN, NIGERIA, INDIA, KENYA, PAKISTAN, NIGERIA, BANGLADESH, & INDONESIA.BANGLADESH, & INDONESIA.
http://www.ined.fr/en/everything_about_population/animations/world_population/

Developing vs. Developed Countries

GDPGDP
GDP = Gross Domestic ProductGDP = Gross Domestic Product Goods & services provided within a Goods & services provided within a countrycountry
Per Capita GDP = GDP divided by Per Capita GDP = GDP divided by total populationtotal population Assumes each person gets equal Assumes each person gets equal shareshare

Developing CountriesDeveloping Countries
Per capita GDP <$4,000Per capita GDP <$4,000 Low to moderate industrializationLow to moderate industrialization Rural, agricultural, illiterate, Rural, agricultural, illiterate, poorpoor
80% of world’s population80% of world’s population 50% of population is under age 1550% of population is under age 15 15% of wealth15% of wealth 10-20% of resource usage10-20% of resource usage

List of Least Developed List of Least Developed CountriesCountries
UN 2008UN 2008
1. Afghanistan 1. Afghanistan
2. Angola2. Angola
3. Bangladesh3. Bangladesh
11. Chad11. Chad
17. Ethiopia17. Ethiopia
Per capita GDPPer capita GDP $700 (‘03)$700 (‘03) $1900 (‘04)$1900 (‘04) $1900 (‘03)$1900 (‘03) $1200 (‘03)$1200 (‘03) $700 (‘03)$700 (‘03)

Reasons for Reasons for Large Families Large Families in Developing in Developing
CountriesCountries
Old age securityOld age security Infant and Infant and childhood childhood mortality ratesmortality rates
Children are an Children are an economic asseteconomic asset Grow food, Grow food, gather fuel, gather fuel, tend livestock, tend livestock, beg, carry waterbeg, carry water

Developed CountryDeveloped Country
Per capita GDP >$4,000Per capita GDP >$4,000 Highly industrializedHighly industrialized Urban, industrial, educated, & Urban, industrial, educated, & wealthywealthy
20% of world’s population20% of world’s population 85% of wealth85% of wealth 80 - 90% of resource usage80 - 90% of resource usage

Per capita GDP (2008)Per capita GDP (2008)
#1 - Liechtenstein#1 - Liechtenstein #3 - Norway#3 - Norway$87,070$87,070 #14 – United States $47,763#14 – United States $47,763 #25 – Canada - $41,730#25 – Canada - $41,730 #74 – Mexico - $9,980#74 – Mexico - $9,980 #127 – China - $2,940#127 – China - $2,940 #163 – India - $1,070#163 – India - $1,070


Population Increase in Developed Population Increase in Developed and Developing Countriesand Developing Countries
Where should we implement mechanisms to slow population growth?

Fertility Rates

What’s this showing?What’s this showing?
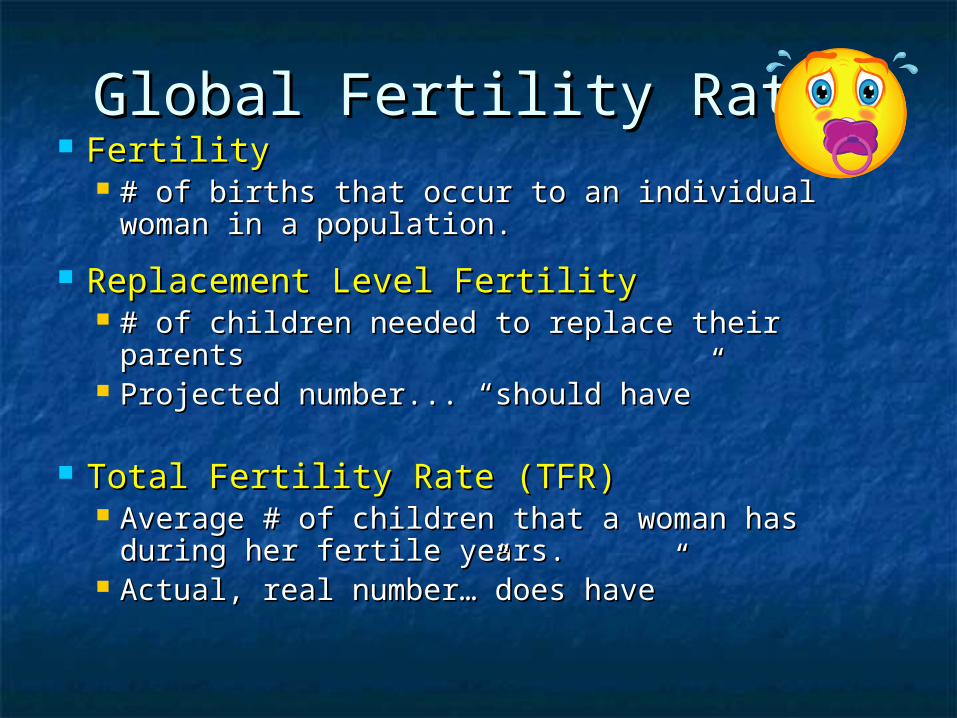
Global Fertility RatesGlobal Fertility Rates FertilityFertility
# of births that occur to an individual # of births that occur to an individual woman in a population.woman in a population.
Replacement Level FertilityReplacement Level Fertility # of children needed to replace their # of children needed to replace their parentsparents
Projected number... “should have”Projected number... “should have”
Total Fertility Rate (TFR)Total Fertility Rate (TFR) Average # of children that a woman has Average # of children that a woman has during her fertile years.during her fertile years.
Actual, real number…”does have”Actual, real number…”does have”

Global Fertility RatesGlobal Fertility Rates Replacement Level Fertility Rates Replacement Level Fertility Rates (1997)(1997) Developed countries = 2.1 childrenDeveloped countries = 2.1 children Developing countries = 2.5 childrenDeveloping countries = 2.5 children
(Since some baby girls die before they reproduce, (Since some baby girls die before they reproduce, the number is slightly greater than two.)the number is slightly greater than two.)
Also, not every woman has a childAlso, not every woman has a child
Total Fertility Rates (TFR) (1997)Total Fertility Rates (TFR) (1997) World Average = 3.0 childrenWorld Average = 3.0 children Developed = 1.6 childrenDeveloped = 1.6 children
2.5 children in 1950.2.5 children in 1950. Developing = 3.4 childrenDeveloping = 3.4 children
6.5 children in 1950. 6.5 children in 1950.

TFRTFR Africa has the highest in worldAfrica has the highest in world U.S. has had higher than most U.S. has had higher than most developed countries:developed countries: Large # of baby boomers = momsLarge # of baby boomers = moms Increased number of unmarried Increased number of unmarried mothersmothers
Increased fertility rates in some Increased fertility rates in some racial/ethnic groupsracial/ethnic groups
Legal/illegal immigrantsLegal/illegal immigrants (11% of population are foreign born. (11% of population are foreign born. (NOVA 2007)(NOVA 2007)

Factors Affecting Birth & Factors Affecting Birth & Fertility RatesFertility Rates
Increasing FactorsIncreasing Factors
Children in labor Children in labor forceforce
Rural areasRural areas Lack of birth controlLack of birth control Religious/cultural Religious/cultural values against birth values against birth controlcontrol
Lack of abortion Lack of abortion accessaccess
Younger than 25 at Younger than 25 at marriagemarriage
Few jobs for womenFew jobs for women Lack of educational Lack of educational opportunitiesopportunities
Decreasing FactorsDecreasing Factors
Low infant mortality Low infant mortality raterate
Educational & job Educational & job opportunities for opportunities for womenwomen
AffluenceAffluence Cost of raising Cost of raising childrenchildren
UrbanizationUrbanization Older than 25 at Older than 25 at marriagemarriage
Availability of Availability of pension systemspension systems

Fertility Rate and Fertility Rate and IncomeIncome

Contraceptive Use and Contraceptive Use and Fertility RatesFertility Rates

Measures of Overall Measures of Overall HealthHealth
Life expectancyLife expectancy Average # of years a newborn can expect to Average # of years a newborn can expect to livelive
Developed countries = 71 years (1997); 77 (2007)Developed countries = 71 years (1997); 77 (2007) Developing countries = 62 years (1997); 64.5 (2007)Developing countries = 62 years (1997); 64.5 (2007)
Infant Mortality RateInfant Mortality Rate # of babies out of every 1,000 who die # of babies out of every 1,000 who die before their first birthday.before their first birthday.
Reflects a country’s level of nutrition & health Reflects a country’s level of nutrition & health carecare
Single best measure of a society’s quality of life.Single best measure of a society’s quality of life.

Factors Affecting Death Factors Affecting Death RatesRates
Population increase over the past Population increase over the past 100 years most influenced by the 100 years most influenced by the decrease in death rates!decrease in death rates!
Better food supplies & distributionBetter food supplies & distribution Better nutritionBetter nutrition Better water suppliesBetter water supplies Advances in medicine & sanitationAdvances in medicine & sanitation
MIGRATIONMIGRATION
Is not always voluntaryIs not always voluntary Involuntary displacement by:Involuntary displacement by:
Armed conflictArmed conflict Environmental degradationEnvironmental degradation Natural disasterNatural disaster

Know the differences. Know the differences. MatchMatch
Population Population growth growth raterate
IMRIMR ZPGZPG Rule of 70Rule of 70 TFRTFR ReplacemenReplacement t fertilityfertility
1.1. How many kids the moms in a How many kids the moms in a pop are havingpop are having
2.2. How many infants die per 1000 How many infants die per 1000 bornborn
3.3. Uses current growth rate to Uses current growth rate to estimate when pop will doubleestimate when pop will double
4.4. Multiply the total # of people Multiply the total # of people in the population by this in the population by this number to project future popnumber to project future pop
5.5. Population is stable. B = DPopulation is stable. B = D
6.6. How many kids the moms in a How many kids the moms in a pop have to have to keep the pop have to have to keep the numbers the samenumbers the same

Know the differences.Know the differences.4. Population 4. Population growth rategrowth rate
2. IMR2. IMR
5. ZPG5. ZPG
3. Rule of 703. Rule of 70
1. TFR1. TFR
6. 6. Replacement Replacement fertilityfertility
How many infants die per 1000 How many infants die per 1000 bornborn
Population is stable. B = DPopulation is stable. B = D Uses current growth rate to Uses current growth rate to
estimate when pop will doubleestimate when pop will double How many kids the moms in a How many kids the moms in a
pop are havingpop are having How many kids the moms in a How many kids the moms in a
pop have to have to keep the pop have to have to keep the numbers the samenumbers the same
Refers to actual number of Refers to actual number of births (or deaths) that occur births (or deaths) that occur per 1000 peopleper 1000 people

Population Age Population Age StructureStructure

Age Structure DiagramsAge Structure Diagrams The % of males & females in the total The % of males & females in the total population divided by age groups:population divided by age groups:
0 - 14 yrs = 0 - 14 yrs = Pre-ProductivePre-Productive ages ages 15 - 44 yrs = 15 - 44 yrs = ReproductiveReproductive ages ages 45 - older yrs = 45 - older yrs = Post-ReproductivePost-Reproductive ages ages
***The ***The MAJORMAJOR determining factor of a determining factor of a country’s future population growth is: country’s future population growth is: the number of the number of pre-productive peoplepre-productive people! ! (Under 15 yrs).(Under 15 yrs).

Where are the baby Where are the baby boomers?boomers?
http://www.census.gov/ipc/www/idb/summaries.html

Is this population Is this population growing or shrinking?growing or shrinking?

Is this population Is this population growing or shrinking?growing or shrinking?
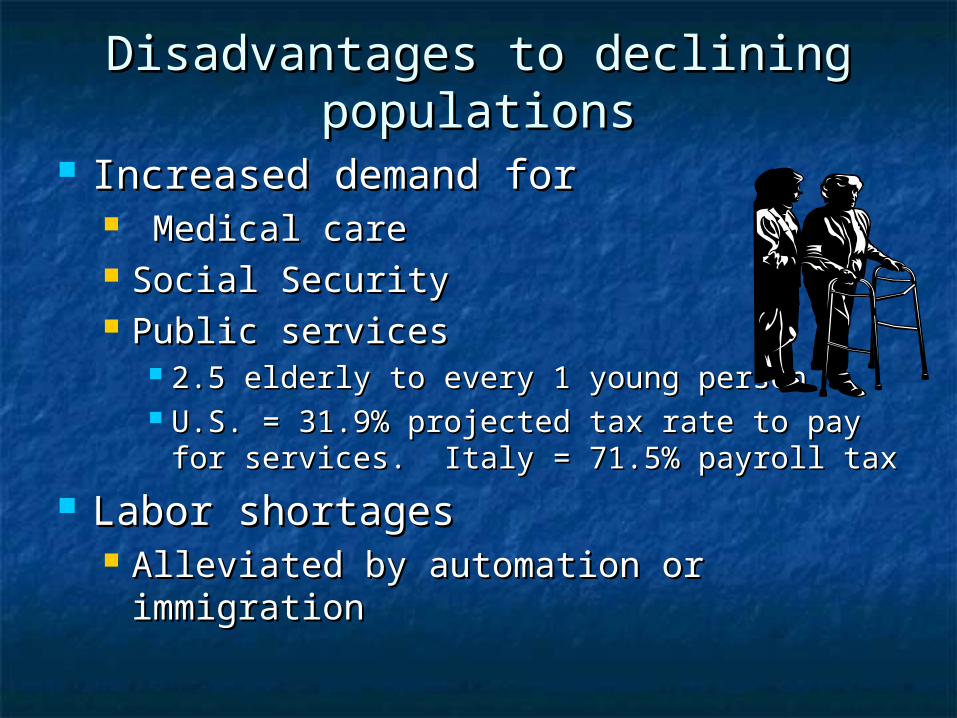
Disadvantages to declining Disadvantages to declining populationspopulations
Increased demand forIncreased demand for Medical careMedical care Social SecuritySocial Security Public servicesPublic services
2.5 elderly to every 1 young person2.5 elderly to every 1 young person U.S. = 31.9% projected tax rate to pay U.S. = 31.9% projected tax rate to pay for services. Italy = 71.5% payroll taxfor services. Italy = 71.5% payroll tax
Labor shortagesLabor shortages Alleviated by automation or Alleviated by automation or immigrationimmigration

Projecting Projecting Future Future
Populations: Populations: Developed Developed CountriesCountries

Population Population Projections: Projections: Developing Developing NationsNations
Remember, Remember, what percent what percent of the total of the total population is population is developing?developing?

Population PowerPopulation Power In 2000, In 2000, 31% of people on the planet 31% of people on the planet were under 15 yrs old.were under 15 yrs old. ( (1.9 billion1.9 billion people)people) 34% of population in developing countries34% of population in developing countries 19% of population in developed countries 19% of population in developed countries
Even if each woman only has 1 or 2 Even if each woman only has 1 or 2 children, the overall population size children, the overall population size will soar!will soar!
How to slow or stop this exponential How to slow or stop this exponential growth?growth? Effective methods to slow birth ratesEffective methods to slow birth rates Drastic rise in death ratesDrastic rise in death rates
Would a bird flu pandemic be bad for the Earth????Would a bird flu pandemic be bad for the Earth????

The Demographic The Demographic TransitionTransition

Demographic Demographic TransitioningTransitioning
PRE-INDUSTRIAL STAGEPRE-INDUSTRIAL STAGE Harsh living conditions lead to high Harsh living conditions lead to high birth rate (high IMR) & high death ratebirth rate (high IMR) & high death rate
TRANSITIONAL STAGETRANSITIONAL STAGE Industrialization begins, food Industrialization begins, food production goes up, healthcare improvesproduction goes up, healthcare improves
death decreases but birth rates stay death decreases but birth rates stay highhigh
Rapid growthRapid growth

Demographic Demographic TransitioningTransitioning
INDUSTRIAL STAGEINDUSTRIAL STAGE Industrialization is widespread. Industrialization is widespread. Jobs increase, education & its cost Jobs increase, education & its cost increase, IMR goes down, birth control increase, IMR goes down, birth control use is up. use is up.
Birth rate approaches death rateBirth rate approaches death rate POST-INDUSTRIAL STAGEPOST-INDUSTRIAL STAGE
ZPG achieved, population size decreases ZPG achieved, population size decreases as birth rate continues to fallas birth rate continues to fall
Sustainable economic dev’tSustainable economic dev’t 37 countries (mostly W. Europe) have 37 countries (mostly W. Europe) have enteredentered

Population Control

China’s Population China’s Population ControlControl
Socialist dictatorshipSocialist dictatorship 1960’s realized only option to population 1960’s realized only option to population control was mass starvation!control was mass starvation!
Instituted social coercion planInstituted social coercion plan Free birth control, abortions, & Free birth control, abortions, & sterilizationssterilizations
Encouraged to marry at later age & only 1 kidEncouraged to marry at later age & only 1 kid
Between 1972 – 2000Between 1972 – 2000 Crude birth rate drop 50%Crude birth rate drop 50% TFR dropped from 5.7 to 1.8TFR dropped from 5.7 to 1.8

China’s One Child China’s One Child PolicyPolicy
Couples who pledged only one child:Couples who pledged only one child:
Extra foodExtra food Larger pensionsLarger pensions Better housingBetter housing Free medical careFree medical care Salary bonusesSalary bonuses Free school tuitionFree school tuition Preferential treatment in employment Preferential treatment in employment marketsmarkets

China’s One Child China’s One Child PolicyPolicy
EffectivenessEffectiveness 81% of married women in China are using 81% of married women in China are using modern contraceptionmodern contraception
Increased employment opportunities for Increased employment opportunities for women.women.
ProblemsProblems Girls are aborted, killed, and neglectedGirls are aborted, killed, and neglected 2007 – do not have equal number of sexes2007 – do not have equal number of sexes