Embed Size (px)
Citation preview
1
HUMAN RESOURCES COMMAND
Briefing to
to
General Odierno CSA
10 July 2014 v5 10 JUL14
Overall Classification of this brief is:
UNCLASSIFIED//FOUO

2
Agenda
• Officer Separation Board (OSB) Follow Up
• Command Selection List (CSL) Audit Update
• CSL Briefing Due Outs (7 Apr 14)
• Branch Monitoring Update
• Cyber Branch Update
• Korea Rotation Business Rules and Manning Timeline
• Building NCOs for 2035
• Other Key Initiatives
3
Officer Separation Board Follow Up
4
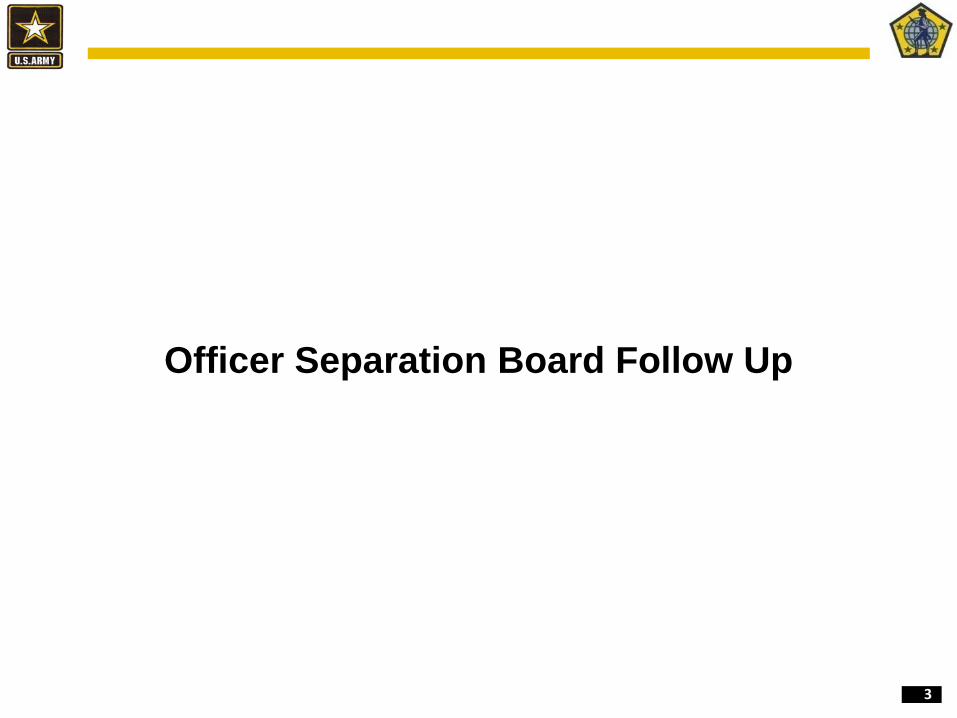
MAJ Selectees with 2 or More ACOM OERs
NAME BR YEAR
GROUP CURRENT TITLE Last OER 2nd Last OER 3rd Last OER 4th Last OER Overall
HENDERSON, LAWRENCE AQ 2003 CONTRACTING
OFFICER CONTRACTING
OFFICER CH RCO (FWD AFG)
MIL TM LD/CONT OFF
(#1/8)
BN S1 (best )
Strong as CPT in AG; weak in AQs
PRESLEY, RICHARD T AR 2003 KNOWN LOSSES BN TNG OFF BN TNG OFF
(top 25%) WTR/INSTR
SGL (one of the best)
COM file; no KD reports
THOMAS, BILL SCOTT 48 2002 INCOMING PERSONNEL
FAO TNG/CHINA OPS OFFICER
(top 25%) CDR
(top 5%) CDR
(top 5%) Strong KD OERs, others weak
evals
MCCARTHY, DIANNE EN 2003 SOLDIER IN TRANSITION
PROJECT ENG CDR CDR
(top 3)
BN CIVIL ENGINEER (top 25%)
2 of 4 ACOMs with strong comments/No KD
Weakly written OERs and/or Outdated DA Photos
ACOM COM 5th ACOM officer was overweight
5
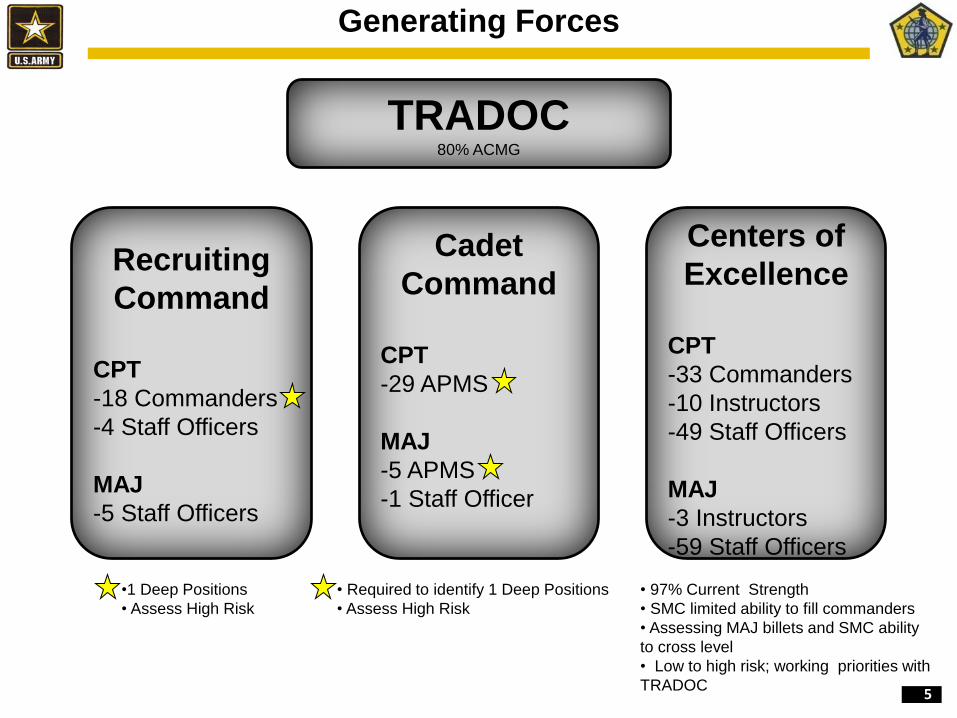
Centers of
Excellence
CPT
-33 Commanders
-10 Instructors
-49 Staff Officers
MAJ
-3 Instructors
-59 Staff Officers
Recruiting
Command
CPT
-18 Commanders
-4 Staff Officers
MAJ
-5 Staff Officers
Cadet
Command
CPT
-29 APMS
MAJ
-5 APMS
-1 Staff Officer
TRADOC 80% ACMG
• 97% Current Strength
• SMC limited ability to fill commanders
• Assessing MAJ billets and SMC ability
to cross level
• Low to high risk; working priorities with
TRADOC
•1 Deep Positions
• Assess High Risk
• Required to identify 1 Deep Positions
• Assess High Risk
Generating Forces

6
DIV EAST
CPT
-14 OC/T
-11 Staff Officers
MAJ
-2 OC/T
-2 Staff Officers
DIV WEST
CPT
-16 OC/T
-12 Staff Officers
MAJ
-3 OC/T
-5 Staff Officers
First Army 70% ACMG
Generating Forces
• 83.4% Current Strength
• 76.6% with OSB
• Will work to 1A to redirect inbounds
• Assess OC/T as medium risk
• 87% Current Strength
• 78.9% with OSB
• Will work to 1A to redirect inbounds
• Assess OC/T as medium risk

7
CMTC
CPT
-1 OC/T
-4 Staff Officers
MAJ
-1 OC/T
-2 Staff Officers
JRTC
CPT
-9 OC/T
NTC
CPT
-1 OC/T
MAJ
-4 OC/T
CTC 80% ACMG
100% for OC/T
• 99% Current Strength
• Gains programmed 1Q/FY15
• May be near term gap
•Assess Low Risk
Generating Forces
• 102% Current Strength
• Gains programmed 1Q/FY14
• May be near term gap
•Assess Low Risk
• 101% Current Strength
• Gains programmed 1Q/FY15
• May be near term gap
•Assess Low Risk

8
AFPAK Hands
OSB-ESERB
• CPT OSB: 11.7% overall vs. 16.7% AFPAK
• LTC CSL Selection:
– FY13 LTC CSL: 18% ACC vs. 3% AFPAK
– FY14 LTC CSL: 27% ACC vs. 6% AFPAK
• 42-45 months in program impacts officer timeline
• High deployment OPTEMPO; few volunteers
• Assignment Officer feedback is that Officers in the
field have a negative view of AFPAK Hands
• Reassess value of program considering breadth of
Afghan experience within current officer corps
• Establish an AFPAK proponent
• Establish marketing strategy to eliminate negative
stigma of program
• MAJ OSB: 6.5% overall vs. 12.4% AFPAK
• COL Promotion
– FY13: 42% ACC vs. 11% AFPAK
– FY14: 40% ACC vs. 3% AFPAK
• Utilization as staff officer vice AFPAK Hands
• Joint environment without JDAL credit
• Out-of-theater assignments not related to AOC
• Reengineer program to 2-3 year max with
broadening assignments as CPT & MAJ within
current timeline
• Consider advanced degree and JCS/ARSTAFF
assignment following theater tour
• Consider VTIP opportunity into FAO program
PROMOTION/SELECTION
ISSUES
DISCUSSION
A/O 091800 Jul 14
9
Command Selection List (CSL) Audit Update

10
FY 15 ACC CSL Audit
CSL Audit Purpose: validate billets on CSL in light of evolving
missions and responsibilities; Improve subcategory alignment;
Shape CSL to meet CSA’s intent
FOCUS AREAS
• Validate LTC/COL command and key billets meet CSL definitions, meet scope of
responsibility requirements, and are consistent between echelons
• Assess how the total number of LTC/COL CSL positions has changed over time,
and why
• Analyze the year-to-year imbalance in CSL opportunities, and examine COAs to
improve balance
• Statistically validate the importance of LTC CSL positions based on FY09-FY13
SSC, COL Promotion, and COL CSL Board outcomes
• Evaluate the feasibility and potential impact of reducing 36 month commands to 24
months to include potentially removing the 2+1 option for IMCOM
CSL Purpose: Ensure our best qualified officers fill our
most important billets
End State: Shape officers to become postured as future
strategic leaders of the Army

11
Focus Area Findings (1 of 2)
Focus Area 1: Validate LTC/COL command and key billets meet CSL definitions,
meet scope of responsibility requirements, and are consistent between echelons
80% of evaluated billets meet all CSL definitions and criteria for their respective category
• Principle empirical friction point is “scope of responsibility,” based on authorization documents
• Primarily in the Strategic Support Command Category
• Small-sized units with large fiscal, materiel, facilities, and personnel responsibilities (e.g.
Depots/Arsenals/Port Battalions)
Basic Branch key billets are largely consistent at Division and Corps Level
Distribution of Functional Area key billets is in accordance with Proponent priorities
Focus Area 2: Assess how the total number of LTC/COL CSL positions has
changed over time, and why
A combination of force structure impacts (+/-) and key billet and functional areas add have
resulted in an overall 9% increase in CSL billets from FY03-FY14
Functional Areas as CSL Link to “LTC/COL CSL Position Changes”

12
Focus Area Findings (2 of 2)
Focus Area 3: Analyze the year-to-year imbalance in CSL opportunities, and
examine COAs to improve balance
Constant factors: unit activations/inactivation's; patch chart; reliefs and individual extensions or
curtailments
• Overall balance =47% in FY15; 53% in FY16
• Operational Force = 47% in FY15; 53% in FY16 → 49% in FY17; 51% in FY18
• Generating Force = 50% in 15; 50% in 16
• Wholesale BCT/ Battalion changes in the same FY generates significant imbalance within
Divisions
Focus Area 4: Validate the importance of LTC CSL positions based on FY09-FY13
SSC, COL Promotion, and COL CSL board outcomes
CSL: ~13% LTCs selected for CSL; of those, ~72% select to COL, 73% to SSC, 36% to COL CSL
• Direct correlation exists between LTC CSL and promotion to COL, SSC, COL CSL
Non-CSL: ~10% selected for COL; <1% for COL CSL
Focus Area 5: Evaluate the feasibility and potential impact of reducing 36 month
commands to 24 months to include potentially removing the 2+1 option for IMCOM • Complete: Depot & Arsenal commands 36 to 24 months (effective FY15); IMCOM 2+1
(terminated for FY15)
• Pending: EN USACE (O6) districts 3 year command tours
Link to “FY 15/ / 16 Operations Command Balance” w / 2 follow on
slides (Graphs)
Link to “Importance of LTC CSL Positions”

13
Additional Focus Area Findings
Nest board guidance with the Army Leader Development Strategy to recognize performance in CSL position in both operating and generating force
Reassess coding of select command to correct imbalance in command opportunities
• Redesignate all hard-coded Installation Commands to Branch Immaterial
• Redesignate 18 Combat Arms Immaterial Installation Commands to Branch
Immaterial
• Redesignate 15 Infantry Training Commands to Combat Arms Immaterial (02A)
– Initial Entry Training Battalions and Brigades outside Fort Benning
• Further assess Special Forces (SF) Opportunities – preponderance serving in
non-SF commands

14
Command Selection List (CSL) Briefing Due Outs

15
82d Airborne and 1st Cavalry Division Analysis
One select from 1CD in FY15 BCT; 3 BZ selects in FY14
Zero selects from 82nd in FY15; 5 BZ selects in FY14 - officer pool for FY15
reduced
Less BCT opportunities in FY15 is a factor
Examined all COL promotion data from like divisions, no pooling identified:
• SR sampling from 2010-2012, home station only
• Senior rater population generally consistent; variables such as TRA, SMC roles may
have imposed variances
CSA Observation: Lack of 82nd ABN and 1CD battalion
commanders selected for FY15 BCT commands
BN Command Location FY14 BCT Selects FY15 BCT Selects
1CD 3 (BZ) 1
82nd ABN 5 (BZ) 0
BCTs Slated 20 13 Less opportunities
Selectees from
2 ABCT (OML #8)
Division LTC CSL Location Promotion
Non-SEL
Promotion
Select
Total
Compete Select Rate
SR Population
(in 2012)
82 ABN DIV 6 5 11 45.5% 74
1st CAV DIV 13 6 19 31.6% 63
Total 19 11 30 36.6% 69 (avg)
Divisions w/Corps Total 30 13 43 30.2% 59 (avg)
Divisions w/o Corps Total 70 47 117 40.2% 78 (avg)
Grand Total 100 60 160 37.5%
Link to
82nd / 1 CD
Analysis

16
CSA: “Should LTC PMS be CSL? Consider options, we are not getting the
quality that we need”
G1 Additional Guidance: “Relook the process to identify a hybrid approach
so that certain PMS billets are a CSL selection. Identify premier schools for
CSL selection (approximately 25); possible 24-month deferment of CSL if
selected for PMS. Relook the timing which may be resolved with an earlier
announcement.
PMSs selected through Centralized Selection Board; officers opt-in
HRC does not recommend PMS as CSL: • Current leader development model disadvantages PMS officers (2 yr)
• Adding to CSL potentially weakens the overall talent pool of operational force
• Forces a career path choice
• Sets a course for generating force at COL level
• Potential promotion risk
Need the opportunity to do both – PMS and CSL
Professors of Military Science (PMS) as CSL
17
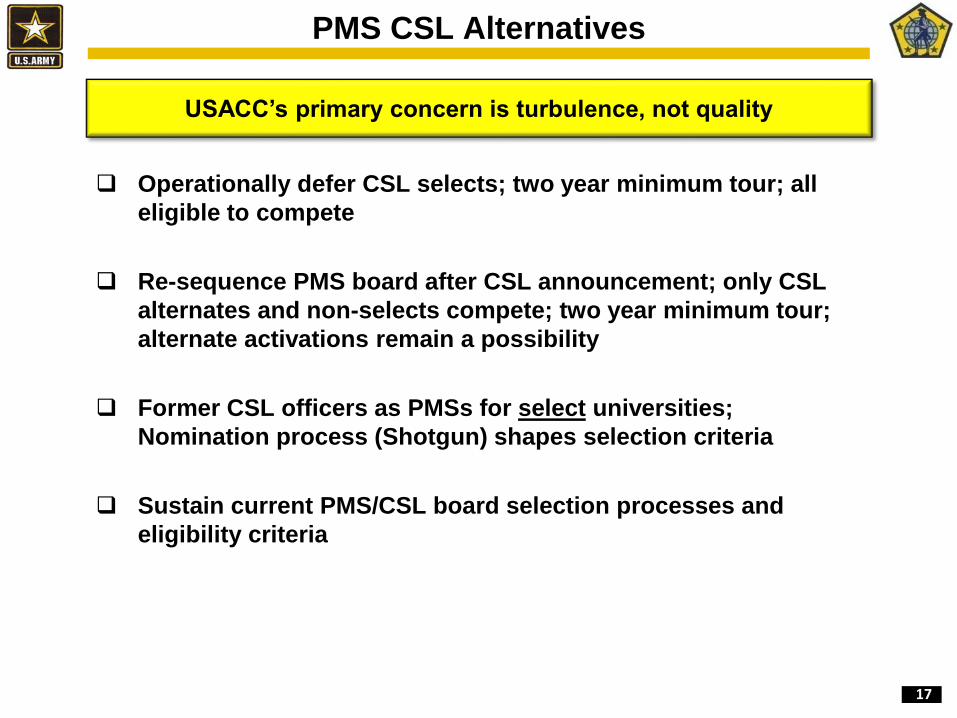
PMS CSL Alternatives
Operationally defer CSL selects; two year minimum tour; all
eligible to compete
Re-sequence PMS board after CSL announcement; only CSL
alternates and non-selects compete; two year minimum tour;
alternate activations remain a possibility
Former CSL officers as PMSs for select universities;
Nomination process (Shotgun) shapes selection criteria
Sustain current PMS/CSL board selection processes and
eligibility criteria
USACC’s primary concern is turbulence, not quality

18
FY15 Declinations – Early Read
Principal Declinations Personal PMS Disapproved
Deferment Total
FY14 Total 13 4 1 18
FY 15 (as of 25 Jun 14) 4 8 0 12
Although trending higher at this point than FY14, the FY15
declinations are within historical norms
FY14 declinations represents the entire FY; FY15 data is as of 25 Jun 14
Declinations trending higher in FY15, yet within statistical norm for last 5
FYs - too early to see clear patterns
PMS declination rate already double of entire FY14 – something to watch

19
Discussion
Countering the effect of the 90s drawdown (avoid
principal select backlog)
• Staying in close synch with the Army G3 (did not happen in the 90’s)
• To some extent, under-selecting principals (did not happen in the
90’s)
CSA AMEDD/AAC slate approval; working authorities
20
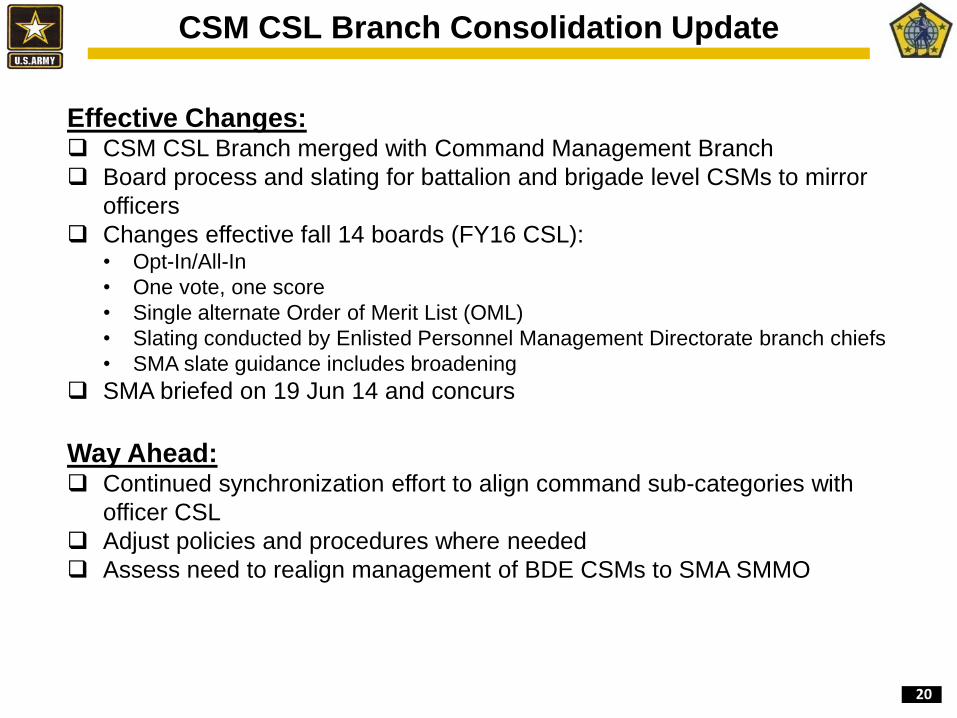
CSM CSL Branch Consolidation Update
Effective Changes: CSM CSL Branch merged with Command Management Branch
Board process and slating for battalion and brigade level CSMs to mirror
officers
Changes effective fall 14 boards (FY16 CSL): • Opt-In/All-In
• One vote, one score
• Single alternate Order of Merit List (OML)
• Slating conducted by Enlisted Personnel Management Directorate branch chiefs
• SMA slate guidance includes broadening
SMA briefed on 19 Jun 14 and concurs
Way Ahead: Continued synchronization effort to align command sub-categories with
officer CSL
Adjust policies and procedures where needed
Assess need to realign management of BDE CSMs to SMA SMMO

21
Branch Monitoring Update
22
Branch Monitoring Introduction
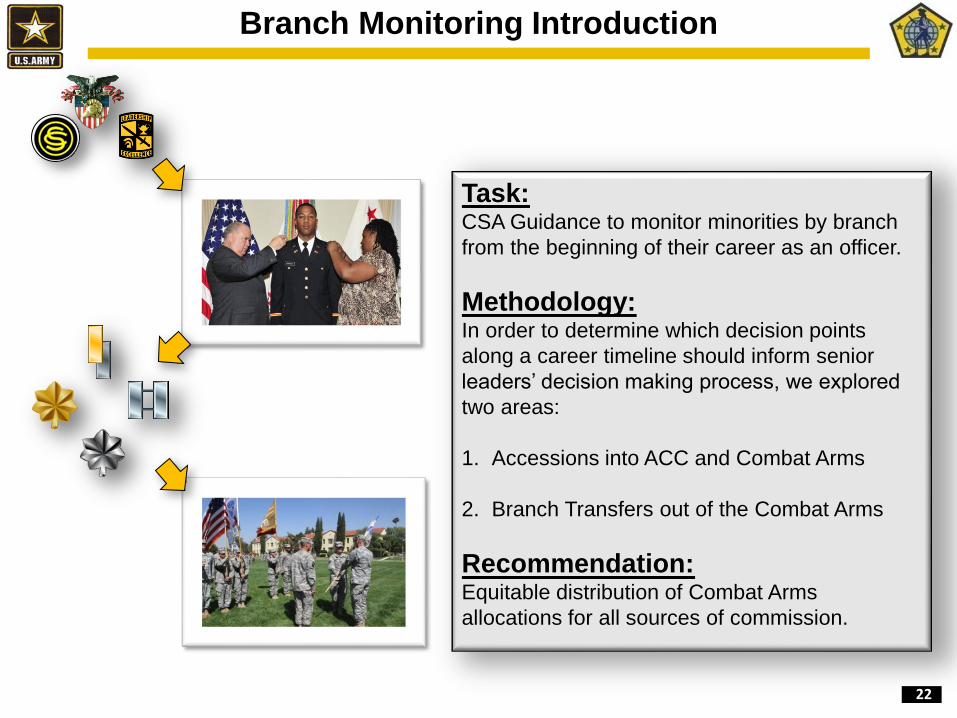
Task: CSA Guidance to monitor minorities by branch
from the beginning of their career as an officer.
Methodology: In order to determine which decision points
along a career timeline should inform senior
leaders’ decision making process, we explored
two areas:
1. Accessions into ACC and Combat Arms
2. Branch Transfers out of the Combat Arms
Recommendation: Equitable distribution of Combat Arms
allocations for all sources of commission.
23
Branch Monitoring Introduction
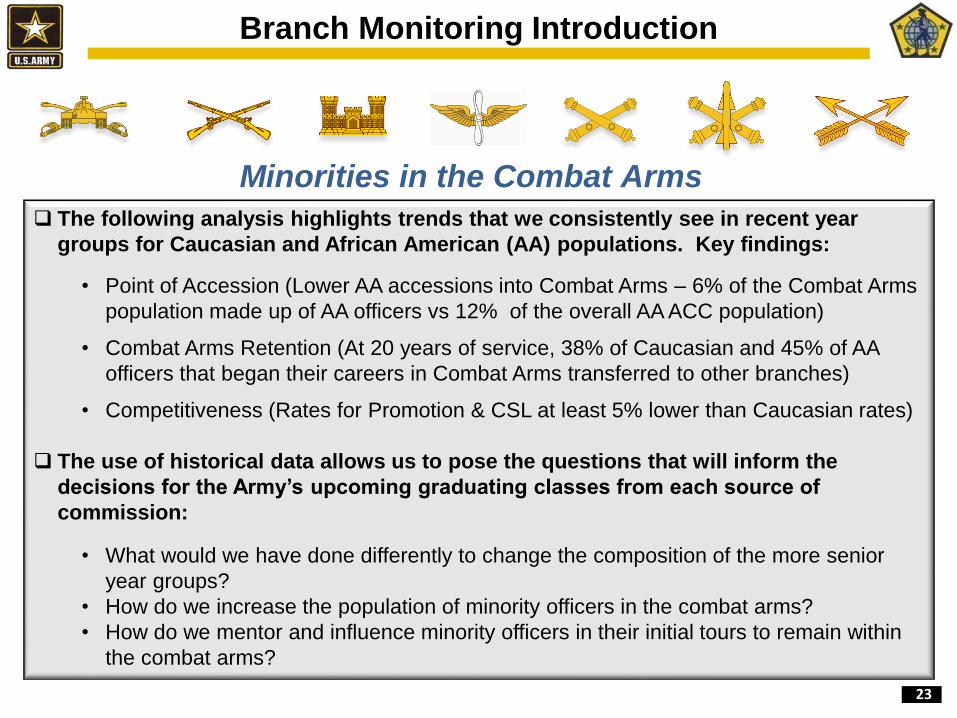
The following analysis highlights trends that we consistently see in recent year
groups for Caucasian and African American (AA) populations. Key findings:
• Point of Accession (Lower AA accessions into Combat Arms – 6% of the Combat Arms
population made up of AA officers vs 12% of the overall AA ACC population)
• Combat Arms Retention (At 20 years of service, 38% of Caucasian and 45% of AA
officers that began their careers in Combat Arms transferred to other branches)
• Competitiveness (Rates for Promotion & CSL at least 5% lower than Caucasian rates)
The use of historical data allows us to pose the questions that will inform the
decisions for the Army’s upcoming graduating classes from each source of
commission:
• What would we have done differently to change the composition of the more senior
year groups?
• How do we increase the population of minority officers in the combat arms?
• How do we mentor and influence minority officers in their initial tours to remain within
the combat arms?
Minorities in the Combat Arms

24
Combat Arms Diversity Monitoring
0%
20%
40%
60%
80%
100%
120%
1 2 3 4 5 6 7 8 9 10 11 12 13 14 15 16 17 18 19 20 21 22 23 24 25 26 27 28 29 30
YG97 Continuation Rates by REDCAT for ACC and Combat Arms
ACC Caucasian ACC AA Combat Arms Caucasian Combat Arms AA0%
20%
40%
60%
80%
100%
120%
1 2 3 4 5 6 7 8 9 10 11 12 13 14 15 16 17 18 19 20 21 22 23 24 25 26 27 28 29 30
YG97 Continuation Rates by REDCAT for ACC and Combat Arms
ACC Caucasian ACC AA Combat Arms Caucasian Combat Arms AA
In order to increase the representation of Combat Arms Senior
Leaders, there are two focus areas outlined below
ACC African American Population – 12%
Combat Arms African American Population – 6%
1. Point of Accession
2. VTIP Window
1. Point of Accession 2. VTIP Window
• Recent year groups have an average of 14% AA
officers at accessions
• Sources of Commission Demographics
• Role Models & Mentoring can influence branching
behavior
• Role Models & Mentorship Efforts
• Limited VTIP Approval
Accessions increase of 4 AA Officers = 1 additional at 20 years
Accessions increase of 40 AA Officers = 1 additional at 30 years
YG 97 depicts common
trends, but more recent
year groups exhibit an
increase in AA VTIP rates
out of Combat Arms

25
Accessions Diversity Monitoring
CaucasianAfrican
American
OCS 396 90
ROTC 2068 221
USMA 737 54
0%
10%
20%
30%
40%
50%
60%
70%
80%
90%
100%
REDCAT Distribution by Source of Commission • An equitable distribution of Combat Arms branch
allocations to each SOC will increase the number
of AA officers accessed into those branches
• ROTC remains the SOC with the largest volume
of minority officers and the DA Branching Model
establishes demographic goals for all branches
• OCS Active Duty allocations decreased in 2014
and for the foreseeable future
• USMA Population historically remains constant
in size and composition
25%
61%
15%
12%
65%
23%
Year Group 2013 is the most recent complete
dataset and mirrors recent year groups trends.
YG 2013
26
Cyber Branch Update

27
Cyber
Stakeholders
DA Staff,
TRADOC,
ARCYBER,
CYBERCOM,
Other Cyber
Units
SUPPORTS (Assist, Coordinate,
Inform, Monitor,
Influence, Support)
Branch Chief
LTC (O2A)
Functional Focus: The duties of a Enlisted Professional Development
NCO (PDNCO) and a Warrant Officer / Officer Assignment Officer (AO).
HRC Cyber Branch
Organizational Focus: Assignments
into and out of Cyber Units.
Officer AO
MAJ (FA29)
WO AO
CW4 (290)
Cyber Coord
Officer
CPT (25)
Account
Managers Parent
Branches
Serve as entry point into Human Resources Command for Cyber Stakeholders.
Provides focused Career Management across all cohorts in the Cyber Mission Force
(any BR/Specialty), all Electronic Warfare (FA 29 series), and Cryptologic Network
Warfare Specialist (35Q). Remains aligned with Army decisions on Cyber Branch
development. Provide bridge to protect early Cyber Soldiers.
Cyber Branch Priorities • Manning of Cyber Mission Force
• Establishment of control measures/business practices
• ASI / SI E4 (Cyber Mission Force Service) management
• Facilitating identification of Soldiers with Cyber talent
ENL PDNCO
MSG (29E)
Make use of already existing tasking and
support relationships.
Cyber Coord
PDNCO
SFC (35)
Cyber Branch Manages 323 Officers
211 Warrant Officers
1,229 Enlisted Soldiers
1,763 Total Soldiers
28
HRC Cyber Branch Developing Topics
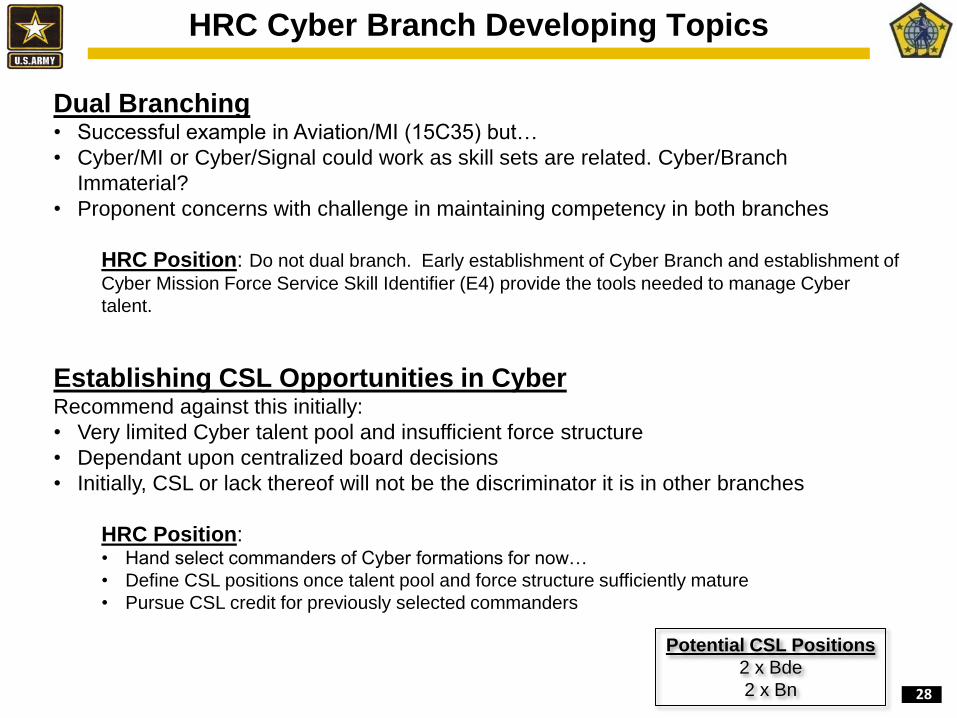
Dual Branching • Successful example in Aviation/MI (15C35) but…
• Cyber/MI or Cyber/Signal could work as skill sets are related. Cyber/Branch
Immaterial?
• Proponent concerns with challenge in maintaining competency in both branches
HRC Position: Do not dual branch. Early establishment of Cyber Branch and establishment of
Cyber Mission Force Service Skill Identifier (E4) provide the tools needed to manage Cyber
talent.
Establishing CSL Opportunities in Cyber Recommend against this initially:
• Very limited Cyber talent pool and insufficient force structure
• Dependant upon centralized board decisions
• Initially, CSL or lack thereof will not be the discriminator it is in other branches
HRC Position: • Hand select commanders of Cyber formations for now…
• Define CSL positions once talent pool and force structure sufficiently mature
• Pursue CSL credit for previously selected commanders
Potential CSL Positions
2 x Bde
2 x Bn

29
Korea Rotation Business Rules and
Manning Timeline

30
Rotational Unit Manning Levels
• Manned at NLT P1 from D-180 (Dec 14) through R+90 (Jun 16) to allow for non-deployable
and unprogrammed losses
• Initial HRC resourcing NLT D-180 and installation cross leveling enables the Senior
Commander (SC) to achieve and maintain P1; build beginning Sep 14
• SC responsible for non-deployable Soldier disposition and maintaining P1 throughout
deployment
Rotational Unit Stabilization
• Stabilization begins at D-180 and ends at R+90 (Dec 14 to Jun 16)
• Soldiers must meet Service Remaining Requirement (SRR) to remain assigned to the
rotational unit through the stabilization period
• Soldiers who do not meet the SRR will be reassigned / cross-leveled prior to stabilization
period
• Soldiers on assignment to essential requirements will be replaced and depart the unit prior
to stabilization
• Special category assignments (sexual assault victims, threat to life, compassionate , etc.)
will continue on a case-by-case basis
Korea Rotation Personnel Rules (1 of 2)
UNCLASSIFIED / FOUO

31
Rotational Unit Command Tours
• No CSL leadership changes during the stabilization period
• Brigade CSM may compete for nominative positions but will not be available until end
of rotation
• Unit has authority to change KD positions / company leadership during the stabilization
period
Rotational Unit Retention
• D-365 (Jul 14): Soldiers who do not meet SRR (~2000) identified and allowed to
reenlist / extend
• D-330 (Aug 14): Soldiers with ETS prior to end of stabilization period reassigned /
cross leveled
• Retirement requests during stabilization period may be approved with retirement date
NET R+90
Inactivating Units on the Korea Peninsula (1st Rotation Only)
• Standard rules for Inactivating Units apply with caveats:
– 341 Soldiers in 1/2 ID may be extended up to 180 days with approval from HQDA DCS, G-1
– Soldiers not required for readiness in other Korea units will be curtailed up to 90 days
– 1/2 ID will remain at P1 until May 2015
Korea Rotation Personnel Rules (2 of 2)
UNCLASSIFIED / FOUO
32
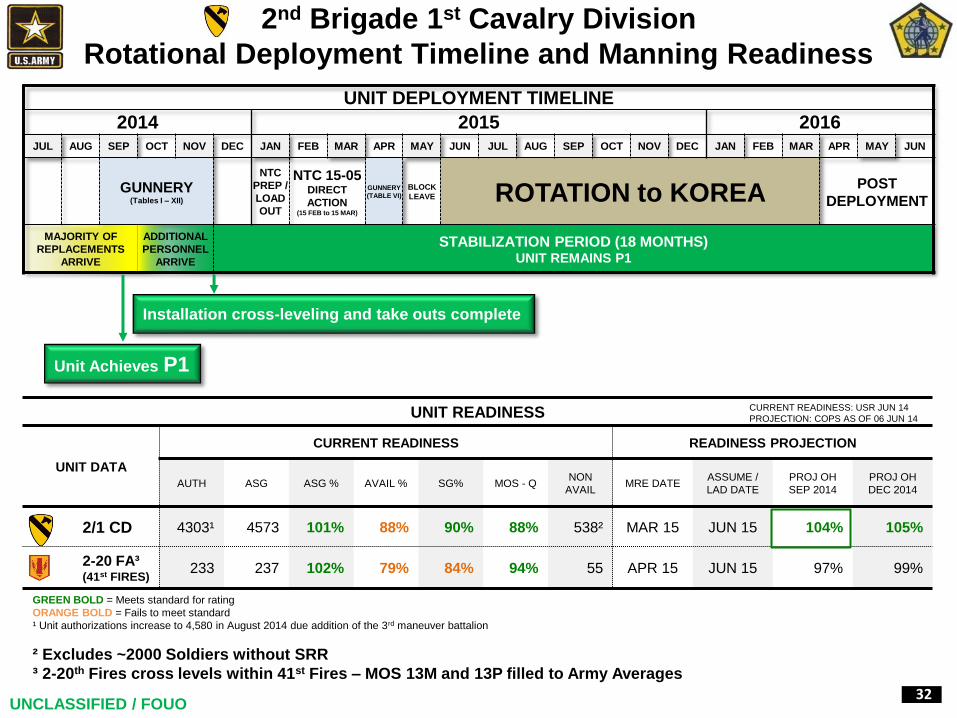
UNIT READINESS
UNIT DATA
CURRENT READINESS READINESS PROJECTION
AUTH ASG ASG % AVAIL % SG% MOS - Q NON
AVAIL MRE DATE
ASSUME /
LAD DATE
PROJ OH
SEP 2014
PROJ OH
DEC 2014
2/1 CD 4303¹ 4573 101% 88% 90% 88% 538² MAR 15 JUN 15 104% 105%
2-20 FA³ (41st FIRES)
233 237 102% 79% 84% 94% 55 APR 15 JUN 15 97% 99%
GREEN BOLD = Meets standard for rating
ORANGE BOLD = Fails to meet standard
¹ Unit authorizations increase to 4,580 in August 2014 due addition of the 3rd maneuver battalion
² Excludes ~2000 Soldiers without SRR
³ 2-20th Fires cross levels within 41st Fires – MOS 13M and 13P filled to Army Averages
2nd Brigade 1st Cavalry Division
Rotational Deployment Timeline and Manning Readiness
UNIT DEPLOYMENT TIMELINE
2014 2015 2016 JUL AUG SEP OCT NOV DEC JAN FEB MAR APR MAY JUN JUL AUG SEP OCT NOV DEC JAN FEB MAR APR MAY JUN
GUNNERY (Tables I – XII)
NTC
PREP /
LOAD
OUT
NTC 15-05 DIRECT
ACTION (15 FEB to 15 MAR)
GUNNERY
(TABLE VI)
BLOCK
LEAVE ROTATION to KOREA POST
DEPLOYMENT
MAJORITY OF
REPLACEMENTS
ARRIVE
ADDITIONAL
PERSONNEL
ARRIVE
STABILIZATION PERIOD (18 MONTHS) UNIT REMAINS P1
CURRENT READINESS: USR JUN 14
PROJECTION: COPS AS OF 06 JUN 14
UNCLASSIFIED / FOUO
Unit Achieves P1
Installation cross-leveling and take outs complete
33
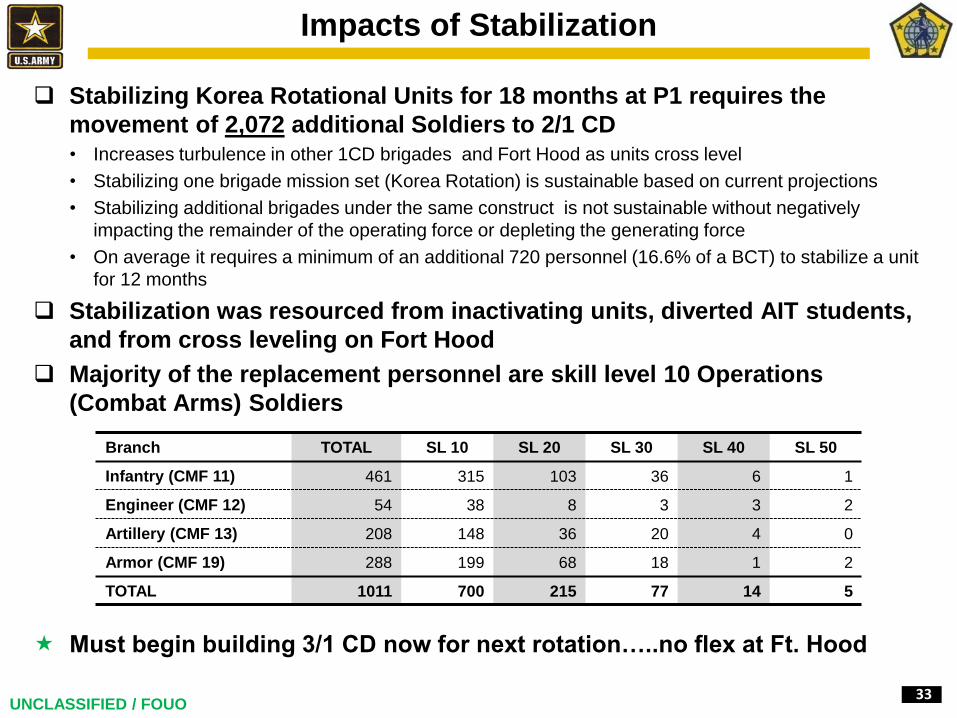
Impacts of Stabilization
Stabilizing Korea Rotational Units for 18 months at P1 requires the
movement of 2,072 additional Soldiers to 2/1 CD • Increases turbulence in other 1CD brigades and Fort Hood as units cross level
• Stabilizing one brigade mission set (Korea Rotation) is sustainable based on current projections
• Stabilizing additional brigades under the same construct is not sustainable without negatively
impacting the remainder of the operating force or depleting the generating force
• On average it requires a minimum of an additional 720 personnel (16.6% of a BCT) to stabilize a unit
for 12 months
Stabilization was resourced from inactivating units, diverted AIT students,
and from cross leveling on Fort Hood
Majority of the replacement personnel are skill level 10 Operations
(Combat Arms) Soldiers
Must begin building 3/1 CD now for next rotation…..no flex at Ft. Hood
UNCLASSIFIED / FOUO
Branch TOTAL SL 10 SL 20 SL 30 SL 40 SL 50
Infantry (CMF 11) 461 315 103 36 6 1
Engineer (CMF 12) 54 38 8 3 3 2
Artillery (CMF 13) 208 148 36 20 4 0
Armor (CMF 19) 288 199 68 18 1 2
TOTAL 1011 700 215 77 14 5

34
Building NCOs for 2035

35
Building NCOs for 2035
SL 30 SL 40 SL 20 SL 10 2014 2035
IBCT IBCT IBCT ALC SLC IBCT
11 B
Career Path
To develop the Soldier of 2014 into an agile and adaptive 1SG/CSM of 2035, leader development
must allow NCOs to build experience in multiple environments versus single tracking in one
formation with little to no broadening (CMF11, 12, 13 and 19)
Promotion boards must recognize and reward this experience and diversity
How to build and develop the broadened NCO for 2035 (UQ13)?
Military / Civilian Education
Career paths 2-4 develop agile and adaptive NCOs to meet future requirements
Recruiter/Drill SGT/AIT PLT SGT/Institutional/O/C
1
2
3
ABCT IBCT ALC Airborne SLC ABCT
SBCT SBCT ALC IBCT SLC Airborne
Airborne ABCT ALC ABCT SLC IBCT 4
Where we are at Where we need to go • Unit manning readiness
Versus
• Individual professional development
• Location stability • New environment more often
• Same unit type at each grade • Different types of units at each grade
• More operational time • More developmental time
• Regionally aligned • Wide variety of regional experience

36
Optimize Army Readiness
Adaptive and Agile Leaders for a Complex Environment
New OER OSD Awards
Review
DSC/SS Review
Panel
New NCO-ER
Career
Intermission
Program
Talent
Management
2025
New AER
Advanced Civil
Schooling
Review
HR Optimization
IRR Readiness
Audit Readiness
OCS
Criteria/Review
Cyber Force
Development/
Management
CSM CSL
Change
Integrated Pay
and Personnel
Transition
Other Key Initiatives
Adapt, adjust; be flexible and responsive!
Total Army – Total Victory!
37
Discussion / Guidance
38
Backups
Officer Separation Board

39
FA48 MAJs OSB Data
83%
92%95%
69%
74%
106%
72%76%
85%
80%
0%
10%
20%
30%
40%
50%
60%
70%
80%
90%
100%
FAO HRC (O3-O5) Current
FAO
O3
-O5
Ave
rag
e
48
C E
uro
pe
48
D S
ou
th A
sia
48
E E
ura
sia
48
F C
hin
a
48
G M
idd
le E
ast
48
H N
ort
hea
st A
sia
48
I So
uth
east
Asi
a
48
J A
fric
a
48
B L
ati
n A
mer
ica
Notes: • 4.1% OSB Selection Rate
• 12/14 had GOMAR/Art 15/NLJ/BCOM
- 2 w/ COMs files; one Officer in Greens for DA Photo
• The hardest hit YG is YG01 – 8.2% selection rate
• 2/14 REDCAT Officers
• 1/14 CAD Officer
Overall FA48 Operational Strength is at 83.2%
• The hardest hit AOC is 48G (Middle East) – 9.1%
selection rate (18.2% for YG01)
• Minor Gaps (no operational impact/Officers in pipeline
to backfill)
• Biggest GAP Concern: Army Attaché in Yemen;
backfill slated for Jan 15. Gap will depend on when
OSB Officer wants to depart
• 48Gs will be difficult to replace due to long training
timeline and lack of non-FAO Arabic speakers in Army;
FAO may have long term difficulty filling 48G billets
14 FAOs Selected for OSB
(5) Training Pipeline
(8) Operations
(1) Discharged (MEB)
-2 -5 -1 -1 -2 -3
40
ESERB / AFCS Requirements
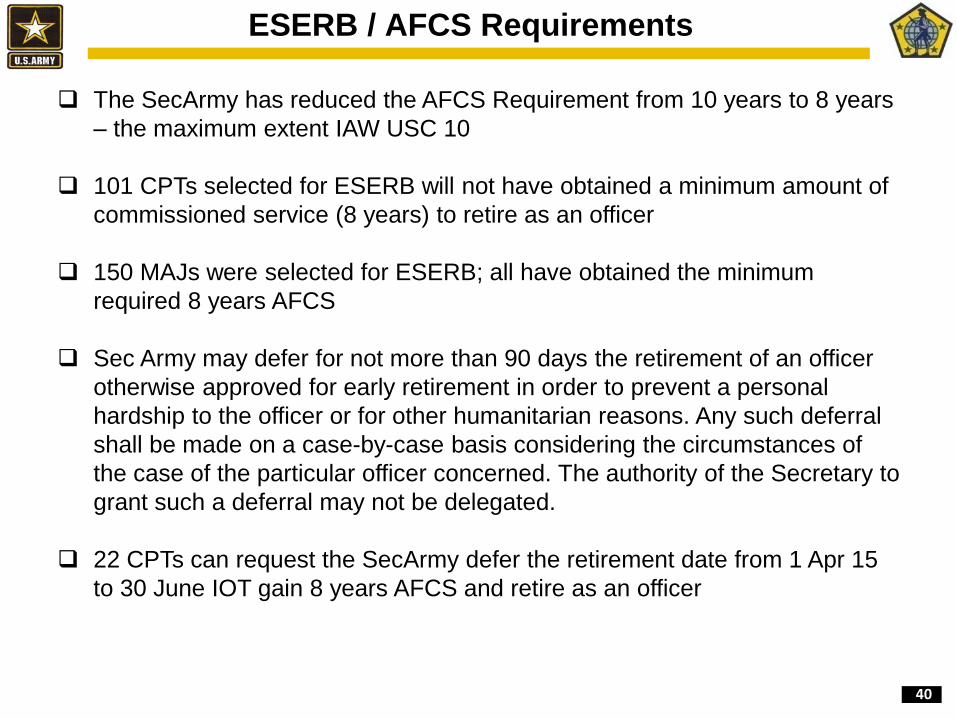
The SecArmy has reduced the AFCS Requirement from 10 years to 8 years
– the maximum extent IAW USC 10
101 CPTs selected for ESERB will not have obtained a minimum amount of
commissioned service (8 years) to retire as an officer
150 MAJs were selected for ESERB; all have obtained the minimum
required 8 years AFCS
Sec Army may defer for not more than 90 days the retirement of an officer
otherwise approved for early retirement in order to prevent a personal
hardship to the officer or for other humanitarian reasons. Any such deferral
shall be made on a case-by-case basis considering the circumstances of
the case of the particular officer concerned. The authority of the Secretary to
grant such a deferral may not be delegated.
22 CPTs can request the SecArmy defer the retirement date from 1 Apr 15
to 30 June IOT gain 8 years AFCS and retire as an officer

41
How is retirement pay calculated
Commissioned officers with less than 8 years commissioned service who
retire as enlisted members with more than 20 years but less than 30 years
can’t use any of their officer basic pay in the computation of the average of
their highest 36 months of basic pay.
How calculated: DFAS will use the highest enlisted grade held and that
basic pay corresponding to the soldier’s years of service for the 36 months
before retirement.
For example, a CPT with 7 years of commissioned service retires as an E-7
on 1 April 15 with 20 years of active duty. The highest 36 months of basic
pay would be based on one month as an E-7 with over 20 years (1-30 May
15), 24 months as an E-7 with over 18 years (1 Apr 13 through 1 May 15),
and 11 months as an E-7 with over 16 years (1 Apr 12 through 31 Mar 13).
Under the provisions of Title 10, United States Code section 3964 (10 USC
§3964), if you are an enlisted (E-1 through E-9) or warrant officer (W-1
through W-5) retiree with less than thirty years of active service who
previously held a higher grade, you can apply for advancement to that
higher grade on the retired list after obtaining 30 years of combined active
and retired time. Retirement Pay will be adjusted but no back pay issued.

42
Overview
• 17% (95) retirement-eligible
• 15% (80) sanctuary-eligible (18-20 years)
• 31% (171) TERA-eligible (15-18 years)
• 37% (204) < 15 years of service (sep pay)
• 63 separation: 13 have separated and 50 on
separations orders
Separations
Way Ahead
• 550 selected (1 Officer in DASR Population)
• Project notifications to begin first week of Aug 14
• 1 May 15 separation date
• 6.5% select rate (OSB 5.6% & ESERB 10.5%
combined)
• Officers who VTIP to Functional Areas had lower
selection rate. (5.2% verses 6.5%)
• EW, Sys Automation, Space OPS, and PO branch
selection higher than average (relatively small
population sizes)
Selections
Readiness
• MAJ Grade spread out across the Army, although
aggregate strength is not projected as an issue
individual shortfalls may need to be addressed
• There are 131 OSB/ESERB selects currently
serving in KD positions
• SCs may cross level to fill critical billets
• HRC backfills critical billets when necessary and
feasible

43
417
87
ACOM >1
ACOM X1
Pure COM
550
7957
0
500
1000
1500
2000
2500
3000
3500
4000
4500
5000
5500
6000
6500
7000
7500
8000
8500
All Consisered
FY14 MAJ OSB and ESERB
Select Performance Breakout
6.5%
Total Considered and Select
DEROG
NLJ
OER
• Board considered the officer’s total body of work
• Board weighted derog heavily
• One Controlled population Officer select and 158 Considered omitted in this analysis
41%
(226*)
34%
(190)
20%
(108)
OSB/ESERB Select File Assessment
BCOM
OER
5%
(26)
124 – MAJ
58 – CPT
8 - LT
*One DASR
80% of selects had derog or
negative evaluations

44
213
63
131
143
7.2%
10.8%
4.7%
6.6%
0.0%
2.0%
4.0%
6.0%
8.0%
10.0%
12.0%
0
50
100
150
200
250
No KD Experience
KD Experience LT 14 Mon
SERVING IN MAJ KD
MAJ KD COMPLETE
FY14 MAJ OSB and ESERB
KD Experience Breakout
Number Selected and Selection Rate by Experience
39% of selects had no KD experience; 24% were currently serving in KD; 26% had
completed KD; Failure to complete a full KD was a strong factor.
6.5%
Nu
mb
er
MA
Js S
ele
ct
Ra
te S
ele
ct
OS
B/E
SE
RB
Category
Selection
Rate 0
50
100
150
200
250
No KD Experience KD Experience LT 14 Mon
Serving in MAJ KD MAJ KD Complete
7.2%
26
YG99
33
YG00
44
YG01
57
YG02
53
YG03

45
229 107 3 21 190
11.1%
8.1%
5.9%
2.5%
4.5%
0.0%
2.0%
4.0%
6.0%
8.0%
10.0%
12.0%
0
50
100
150
200
250
CCC Graduate 50% ILE MEL 4 Enrolled MEL 4 Attending MEL 4
FY14 MAJ OSB and ESERB
Military Education Level
6.5%
Nu
mb
er
MA
Js S
ele
ct
Ra
te S
ele
ct
OS
B/E
SE
RB
Category
Selection
Rate
70 YG03
79 YG02
47 YG01
25 YG00
8 YG99
34% of selects were CGSC complete (MEL4) – represents 5% of the officers considered who were
CGSC compete; 42% of selects were CCC Graduates without CGSC (MEL4) enrollment –
represents 11% of the officers considered who were CCC graduates without CGSC; 21 officers
attending resident CGSC (MEL4) were selected; 2officers attending SAMS were selected.

46
95
91
74
63
41
32
2321 21 21
19 18
13
75 5
1
10.4% 10.4%
3.2%
4.0%
5.1%
11.0%
8.7%8.3%
15.3%
7.7%
8.6%
2.5%
0.7%
0.0%
2.0%
4.0%
6.0%
8.0%
10.0%
12.0%
14.0%
16.0%
18.0%
0
10
20
30
40
50
60
70
80
90
100
FY14 MAJ OSB and ESERB Readiness Impacts Where Selects Assigned
Nu
mb
er
MA
Js
Se
lec
t
Ra
te S
ele
ct
OS
B/E
SE
RB
Overall
6.5%
Largest number of selects are assigned to Division/BCT/CAB – but represents 6.5% of the MAJs
considered that were assigned to these formations; TRADOC selection rate (10%, 63 officers);
“OTHERS” include ARSOUTH 8 of 54: 14.8%, ARNORTH 5 of 48: 10.4%, MEPS 3 of 26: 11.5%;
Highest select rate is 1A, 15.3% (14); HRC assessing critical risks and developing mitigation
strategy; Commands can expect gaps
Unit Selection
Rate
14

47
20.0%
13.4%
11.8%11.2%11.1%11.1%
9.7%
8.6%8.2% 8.2% 7.9% 7.7%
7.1% 7.0% 6.9% 6.6% 6.5% 6.4% 6.1% 5.9%
5.0% 4.9% 4.8% 4.5% 4.3% 4.3%3.6% 3.4% 3.1%
1.6%
0.0%
2.0%
4.0%
6.0%
8.0%
10.0%
12.0%
14.0%
16.0%
18.0%
20.0%
22.0%
FY14 MAJ OSB and ESERB Selection Rates by Control Branch
Overall
6.5%
• Significant variance of select rate on ends of the spectrum
• Functional Area (FA) officers select rate comparable to Basic Branch in Aggregate;
losses in FA will take time to mitigate due to training time.
ELECTR
ON
IC W
AR
FAR
E
SYS AU
TOM
ATIO
N O
FFICER
S
SPAC
E OPER
ATIO
NS O
FFICER
CH
EMIC
AL C
OR
PS
INFO
OPER
ATIO
NS O
FFICER
PSYCH
OLO
GIC
AL O
PERA
TION
S
PUB
LIC A
FFAIR
S
LOG
ISTICS
INFO
SYSTEM EN
GIN
EERIN
G
FIELD A
RTILLER
Y
MILITA
RY PO
LICE C
OR
PS
CIVIL A
FFAIR
S
AR
MO
R
SIGN
AL C
OR
PS
NU
CLEA
R W
EAPO
NS
STRA
TEGIC
AN
D FO
RC
E DEV
AIR
DEFEN
SE AR
TILLERY
AD
JUTA
NT G
ENER
ALS C
OR
PS
OPS R
ESEAR
CH
/SYS AN
ALYSIS
CO
RPS O
F ENG
INEER
S
INFA
NTR
Y
SIMU
LATIO
NS O
PERA
TION
S
FINA
NC
E CO
RPS
MILITA
RY IN
TELLIGEN
CE
STRA
TEGIC
INTEL O
FFICER
FOR
EIGN
AR
EA O
FFICER
AVIA
TION
AC
QU
ISITION
MA
NA
GEM
ENT
SPECIA
L FOR
CES
STRA
TEGIC
PLAN
S AN
D PO
LICY
Branch / FA
# Selects # Considered
% Selected
29 53 40 CM 30 PO 46 LG 24 FA MP CA AR SC 52 50 AD AG 49 EN IN 57 FI MI 34 48 AV AC SF 59
6 25 9 15 16 9 11 104 8 35 22 11 23 31 7 6 12 23 12 25 27 5 7 33 5 14 19 17 11 2
30 187 76 134 144 81 113 1209 97 428 278 141 325 444 102 91 185 361 196 425 540 102 146 728 115 327 521 501 353 128
20.0% 13.4% 11.8% 11.2% 11.1% 11.1% 9.7% 8.6% 8.2% 8.2% 7.9% 7.8% 7.1% 7.0% 6.9% 6.6% 6.5% 6.4% 6.1% 5.9% 5.0% 4.9% 4.8% 4.5% 4.3% 4.3% 3.6% 3.4% 3.1% 1.6%
48
9.8%
8.3% 8.0%
5.9% 5.7%
3.2%
0%
2%
4%
6%
8%
10%
12%
AFRICAN AMERICAN
AMERICAN INDIAN
HISPANIC ASIAN CAUCASIAN OTHER
6.6%
5.7%
0%
1%
2%
3%
4%
5%
6%
7%
MALE FEMALE
10.3%
9.7%
7.3%
5.4%
2.6%
0.0%
2.0%
4.0%
6.0%
8.0%
10.0%
12.0%
OTHER ROTC Non_SCH
OCS ROTC SCH USMA
6
56
188
207
92
9.7%10.1%
6.9%
5.9% 6.0%
0.0%
2.0%
4.0%
6.0%
8.0%
10.0%
12.0%
0
50
100
150
200
250
Not Deployed and Never
Deployed
< 1 YEAR < 2 YEARS < 3 YEARS > 3 YEARS
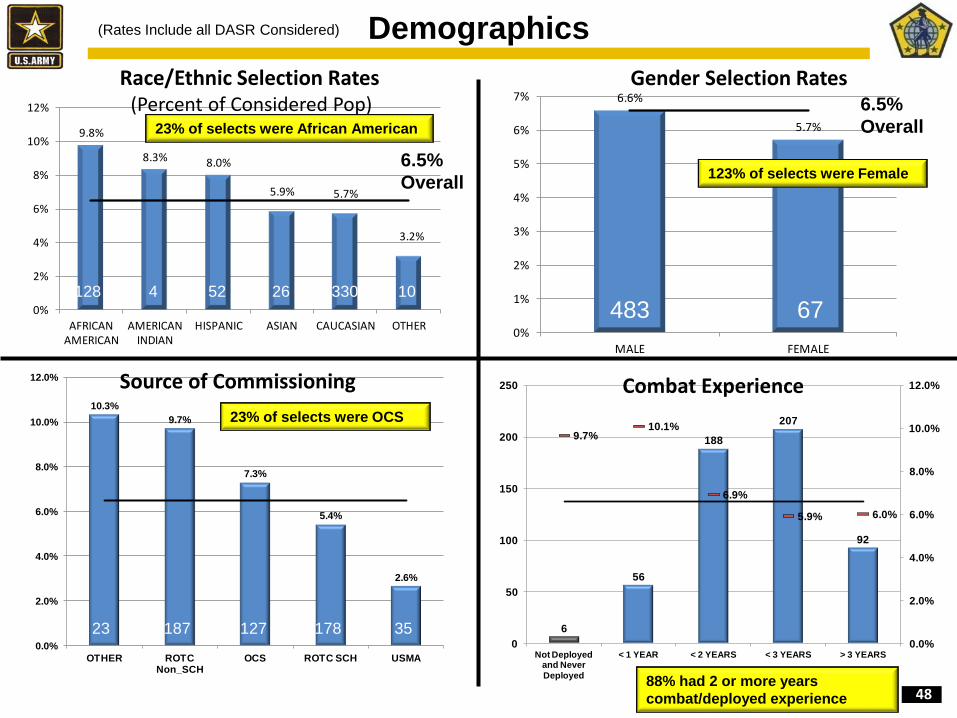
Demographics
Gender Selection Rates Race/Ethnic Selection Rates (Percent of Considered Pop)
Combat Experience Source of Commissioning
6.5%
Overall
6.5%
Overall
483 67
(Rates Include all DASR Considered)
128 4 52 26 330 10
23 187 127 178 35
23% of selects were African American
23% of selects were OCS
88% had 2 or more years
combat/deployed experience
123% of selects were Female

49
9.1%
7.1%
7.7%
5.1%
4.3%
4.9%
0.0%
1.0%
2.0%
3.0%
4.0%
5.0%
6.0%
7.0%
8.0%
9.0%
10.0%
AFRICAN AMERICAN
HISPANIC AMERICAN INDIAN
ASIAN OTHER CAUCASIAN
11.6% 11.9%
0.0%
11.9%
9.8% 10.0%
0.0%
2.0%
4.0%
6.0%
8.0%
10.0%
12.0%
AFRICAN AMERICAN
HISPANIC AMERICAN INDIAN
ASIAN OTHER CAUCASIAN
9.7%
8.0%
6.4%
5.8% 5.7% 5.6%
0.0%
1.0%
2.0%
3.0%
4.0%
5.0%
6.0%
7.0%
8.0%
9.0%
10.0%
AFRICAN AMERICAN
HISPANIC AMERICAN INDIAN
ASIAN OTHER CAUCASIAN
Race/Ethnic Selection Rates
Overall
6.5%
OSB/ESERB Combined
OSB Only ESERB Only
OSB
5.6%
ESERB
10.5%
• Greatest variance exists between African
American and Caucasian Overall
• ESERB overall select rate was higher than OSB;
AA made up 24% of ESERB considered population
• 20% of AA selects had no DEROG or poor Evals
compared to 22% of all selects without DEROG/
poor EVALs
AA = 14% of considered pop AA = 24% of considered pop
(Rates do not include DASR Considered)

50
Detailed Source of Commission Select Rates
16.0%
9.8% 9.7%
7.3%
5.4%
2.6%
0.0%0.0%
2.0%
4.0%
6.0%
8.0%
10.0%
12.0%
14.0%
16.0%
18.0%
InterService TRF Vol Call to AD ROTC Non_SCH OCS_Regular ROTC SCH USMA ACADEMY OtherInter-
Service
TRF
Vol Call
to AD
ROTC
Non_SC
H
OCS_Re
gular
ROTC
SCH USMA
Academy
Other
Grand
Total
Number Considered 25 194 1929 1740 3290 1322 7 8507
Number Selected 4 19 187 127 178 35 0 550
Rate 16.0% 9.8% 9.7% 7.3% 5.4% 2.6% 0.0% 6.5%

51
FY14 MAJ Selects Awarded Purple Heart
• All Male
• 14 Caucasian, 3 African American
FY14 MAJ OSB_ESERB Selects with
Purple Heart
Number
SelectFSD 1
MATERIAL ACQUISITION MANAGEMENT 1
OPS 12
ARMOR 2
CIVIL AFFAIRS 1
CORPS OF ENGINEERS 1
FIELD ARTILLERY 1
INFANTRY 5
MILITARY POLICE CORPS 1
SPECIAL FORCES 1
OSD 4
FOREIGN AREA OFFICER 1
SPACE OPERATIONS OFFICER 2
SYSTEMS AUTOMATION OFFICERS 1
Total Select 17
FY14 MAJ OSB_ESERB
Selects with Purple Heart
Number
SelectArticle 15 1
GOMOR 6
LTR REP - carrying concealed POW on USAF base 1
Referred report APFT Failure 1
No DEROG 8
Total Select 17
FY14 MAJ OSB_ESERB
Selects with Purple Heart
Number
SelectBCOM One or More 2
Straight COM 6
Single ACOM 3
Muli ACOM 6
Total Select 17
FY14 MAJ OSB_ESERB
Selects with Purple Heart
Number
SelectLess then 1 year CBT Experience 2
1 Tour 2
Less then 2 years CBT Experience 4
2 Tours 1
3 Tours 3
Less then 3 years CBT Experience 8
2 Tours 4
3 Tours 2
4 Tours 2
Less then 4 year CBT Experience 3
3 Tours 1
4 Tours 2
Total Select 17
FY14 MAJ OSB_ESERB
Selects with Purple Heart
Number
SelectMEL 4 6
MEL 4 Enrolled 1
50% ILE 2
CCC Graduate 8
Total Select 17
FY14 MAJ OSB_ESERB Selects with
Purple Heart
Number
SelectAMC 1
DIV/BCT/CAB 4
EUROPE_OTH 1
Joint 1
OTHERS 2
THS 4
TRADOC 3
USAREC 1
Total Select 17
FY14 MAJ OSB_ESERB
Selects with Purple Heart
Number
SelectNo KD Experience 7
SERVING IN MAJ KD 7
MAJ KD COMPLETE 3
Total Select 17
FY14 MAJ OSB_ESERB
Selects with Purple Heart
Number
SelectOCS 5
OTHER 1
ROTC Non_SCH 4
ROTC SCH 5
USMA 2
Total Select 17
52
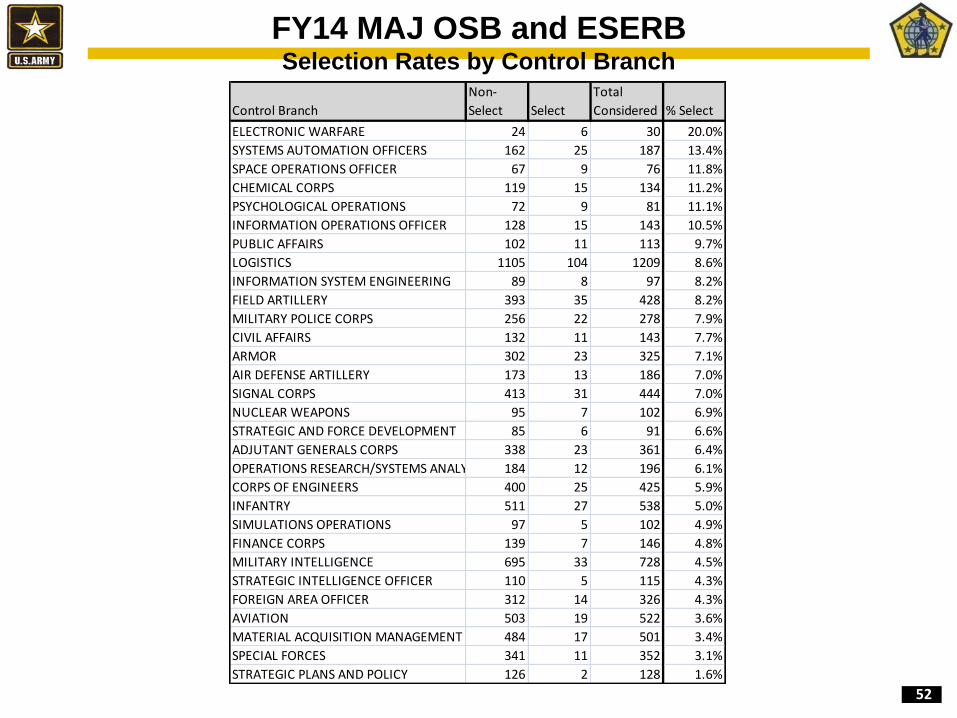
FY14 MAJ OSB and ESERB Selection Rates by Control Branch
Control Branch
Non-
Select Select
Total
Considered % Select
ELECTRONIC WARFARE 24 6 30 20.0%
SYSTEMS AUTOMATION OFFICERS 162 25 187 13.4%
SPACE OPERATIONS OFFICER 67 9 76 11.8%
CHEMICAL CORPS 119 15 134 11.2%
PSYCHOLOGICAL OPERATIONS 72 9 81 11.1%
INFORMATION OPERATIONS OFFICER 128 15 143 10.5%
PUBLIC AFFAIRS 102 11 113 9.7%
LOGISTICS 1105 104 1209 8.6%
INFORMATION SYSTEM ENGINEERING 89 8 97 8.2%
FIELD ARTILLERY 393 35 428 8.2%
MILITARY POLICE CORPS 256 22 278 7.9%
CIVIL AFFAIRS 132 11 143 7.7%
ARMOR 302 23 325 7.1%
AIR DEFENSE ARTILLERY 173 13 186 7.0%
SIGNAL CORPS 413 31 444 7.0%
NUCLEAR WEAPONS 95 7 102 6.9%
STRATEGIC AND FORCE DEVELOPMENT 85 6 91 6.6%
ADJUTANT GENERALS CORPS 338 23 361 6.4%
OPERATIONS RESEARCH/SYSTEMS ANALYSIS 184 12 196 6.1%
CORPS OF ENGINEERS 400 25 425 5.9%
INFANTRY 511 27 538 5.0%
SIMULATIONS OPERATIONS 97 5 102 4.9%
FINANCE CORPS 139 7 146 4.8%
MILITARY INTELLIGENCE 695 33 728 4.5%
STRATEGIC INTELLIGENCE OFFICER 110 5 115 4.3%
FOREIGN AREA OFFICER 312 14 326 4.3%
AVIATION 503 19 522 3.6%
MATERIAL ACQUISITION MANAGEMENT 484 17 501 3.4%
SPECIAL FORCES 341 11 352 3.1%
STRATEGIC PLANS AND POLICY 126 2 128 1.6%

53
Aggregate Projected Impacts (ACC Officers)
Control Grades AUTH Projected
%
Projected
Estimated
OSB/
ESERB
Impact
%
Projected
after impact
COL 2,343 3,086 131.7% 0 131.7%
LTC 6,389 7,119 111.4% 0 111.4%
MAJ 10,063 11,909 118.3% 382 114.5%
Sr CPT 6,686 5,359 80.2% 305 75.6%
Jr CPT 10,732 10,140 94.5% 456 90.2%
LT 9,218 13,897 150.8% 0 150.8%
Grand Total 45,431 51,510 113.4% 1,143 110.9%
Senior (Post-KD) CPTs available to fill requirements is actually lower
due to Officers being coded as senior CPT within 6-8 months of KD
completion; true available strength estimated 68% without impact and
63% with impact.
• Projected overall impact to MAJ is minimal, MAJ grade available strength projected
over 110% at end of March 2015
• Projections based on estimate Officers available to fill authorizations (Total is less
than the total OSB/ESERB selects because not all would be projected to requirements)

54
MAJ OSB/ESERB Selection Rate Based on Manner of
Performance Evaluation
138
339
59
13
59.5%
8.3%
2.2%0.9% 0.0%
10.0%
20.0%
30.0%
40.0%
50.0%
60.0%
70.0%
0
50
100
150
200
250
300
350
400
BELOW COM COM COM PLUS ACOM
Nu
mb
er
MA
Js
Se
lec
t
Ra
te S
ele
ct
OS
B/E
SE
RB
• Highest rate of selects was MOP “B”: Below COM assessed Officers (138 of 232: 59.5%)
• Most Selects were assessed as MOP “C”; COM Files (339 of 4070: 8.3%)
• There were 72 selects that had above average file assessments (59 of 2648: 2.2% COM
Plus and 13 of 1467: 0.9% Above COM)
One select
had no MOP
assessment

55
Average Time KD For Those MAJ KD Complete Non-Select vs Select OSB/ESERB
• Those Officers KD Complete and Select OSB/ESERB had 1.5 months less KD Time
• Overall Average KD time 23.6 months (22.2 for Non-Selects and 23.7 for Selects)
12
14
16
18
20
22
24
26
28
30
32
Overall Average
Non-Select
Average Months
Non-Select
Average Months
Select
Overall Average
Non-Select

56
Select Officers Separated and On Separation Orders
AS OF 19 JUN 2014
13
23
32
41
52
63
50
40
31
22
11
0
0
10
20
30
40
50
60
70
Current JULY 14 AUG 14 SEP 14 DEC 14 APR 15
On SEP Orders
Separated

57
FY14 MAJ OSB/ESERB Branch by YG
Division\Branch
#
Consider # Select Rate
#
Consider # Select Rate
#
Consider # Select Rate
#
Consider # Select Rate
#
Consider # Select Rate
#
Consider # Select Rate
FSD 401 28 7.0% 487 33 6.8% 455 31 6.8% 497 34 6.8% 377 25 6.6% 2217 151 6.8%
ADJUTANT GENERALS CORPS 61 3 4.9% 91 7 7.7% 71 6 8.5% 79 6 7.6% 59 1 1.7% 361 23 6.4%
FINANCE CORPS 26 2 7.7% 33 1 3.0% 34 2 5.9% 31 1 3.2% 22 1 4.5% 146 7 4.8%
LOGISTICS 217 20 9.2% 263 21 8.0% 254 20 7.9% 277 25 9.0% 198 18 9.1% 1209 104 8.6%
MATERIAL ACQUISITION MANAGEMENT 97 3 3.1% 100 4 4.0% 96 3 3.1% 110 2 1.8% 98 5 5.1% 501 17 3.4%
OPS 657 43 6.5% 748 48 6.4% 723 45 6.2% 807 51 6.3% 620 38 6.1% 3555 225 6.3%
AIR DEFENSE ARTILLERY 34 3 8.8% 38 1 2.6% 45 3 6.7% 42 3 7.1% 26 2 7.7% 185 12 6.5%
ARMOR 63 5 7.9% 68 4 5.9% 53 2 3.8% 80 6 7.5% 61 6 9.8% 325 23 7.1%
AVIATION 84 9 10.7% 105 0 0.0% 109 2 1.8% 124 4 3.2% 99 4 4.0% 521 19 3.6%
CHEMICAL CORPS 27 2 7.4% 27 3 11.1% 31 6 19.4% 25 2 8.0% 24 2 8.3% 134 15 11.2%
CIVIL AFFAIRS 24 3 12.5% 19 2 10.5% 28 2 7.1% 34 3 8.8% 36 1 2.8% 141 11 7.8%
CORPS OF ENGINEERS 83 7 8.4% 88 9 10.2% 88 3 3.4% 103 5 4.9% 63 1 1.6% 425 25 5.9%
FIELD ARTILLERY 79 4 5.1% 95 5 5.3% 83 11 13.3% 89 6 6.7% 82 9 11.0% 428 35 8.2%
INFANTRY 109 3 2.8% 116 4 3.4% 119 5 4.2% 122 8 6.6% 72 7 9.7% 538 27 5.0%
INFORMATION OPERATIONS OFFICER 21 2 9.5% 28 2 7.1% 30 3 10.0% 41 7 17.1% 24 2 8.3% 144 16 11.1%
MILITARY INTELLIGENCE 1 0 0.0% 1 0 0.0% 2 0 0.0%
MILITARY POLICE CORPS 54 4 7.4% 77 10 13.0% 46 1 2.2% 64 4 6.3% 37 3 8.1% 278 22 7.9%
PSYCHOLOGICAL OPERATIONS 13 0 0.0% 20 3 15.0% 16 4 25.0% 17 2 11.8% 15 0 0.0% 81 9 11.1%
SPECIAL FORCES 65 1 1.5% 66 5 7.6% 75 3 4.0% 66 1 1.5% 81 1 1.2% 353 11 3.1%
OSD 541 35 6.5% 528 35 6.6% 545 35 6.4% 661 41 6.2% 461 28 6.1% 2736 174 6.4%
CIVIL AFFAIRS 1 0 0.0% 1 0 0.0% 2 0 0.0%
ELECTRONIC WARFARE 6 0 0.0% 4 1 25.0% 4 0 0.0% 10 2 20.0% 6 3 50.0% 30 6 20.0%
FOREIGN AREA OFFICER 65 3 4.6% 72 1 1.4% 62 4 6.5% 77 4 5.2% 51 2 3.9% 327 14 4.3%
INFORMATION SYSTEM ENGINEERING 15 1 6.7% 15 2 13.3% 16 1 6.3% 32 3 9.4% 19 1 5.3% 97 8 8.2%
MILITARY INTELLIGENCE 137 5 3.6% 149 6 4.0% 151 6 4.0% 168 6 3.6% 121 10 8.3% 726 33 4.5%
NUCLEAR WEAPONS 24 3 12.5% 18 0 0.0% 25 2 8.0% 20 1 5.0% 15 1 6.7% 102 7 6.9%
OPERATIONS RESEARCH/SYSTEMS ANALYSIS 38 4 10.5% 38 1 2.6% 38 2 5.3% 47 4 8.5% 35 1 2.9% 196 12 6.1%
PUBLIC AFFAIRS 17 2 11.8% 13 2 15.4% 27 3 11.1% 39 4 10.3% 17 0 0.0% 113 11 9.7%
SIGNAL CORPS 103 10 9.7% 99 10 10.1% 96 5 5.2% 77 1 1.3% 69 5 7.2% 444 31 7.0%
SIMULATIONS OPERATIONS 18 0 0.0% 21 3 14.3% 19 1 5.3% 26 1 3.8% 18 0 0.0% 102 5 4.9%
SPACE OPERATIONS OFFICER 18 1 5.6% 12 5 41.7% 14 2 14.3% 19 0 0.0% 13 1 7.7% 76 9 11.8%
STRATEGIC AND FORCE DEVELOPMENT 17 1 5.9% 19 0 0.0% 15 2 13.3% 22 2 9.1% 18 1 5.6% 91 6 6.6%
STRATEGIC INTELLIGENCE OFFICER 21 2 9.5% 23 2 8.7% 18 0 0.0% 30 1 3.3% 23 0 0.0% 115 5 4.3%
STRATEGIC PLANS AND POLICY 30 0 0.0% 25 0 0.0% 21 0 0.0% 30 1 3.3% 22 1 4.5% 128 2 1.6%
SYSTEMS AUTOMATION OFFICERS 32 3 9.4% 19 2 10.5% 38 7 18.4% 64 11 17.2% 34 2 5.9% 187 25 13.4%
Grand Total 1599 106 6.6% 1763 116 6.6% 1723 111 6.4% 1965 126 6.4% 1458 91 6.2% 8508 550 6.5%
99 00 01 02 03 Total

58
FY14 MAJ OSB/ESERB Branch by Race/Ethnic
RACE/ETHNIC
Branch
# Con-
sider
#
Select Rate
# Con-
sider
#
Select Rate
# Con-
sider
#
Select Rate
# Con-
sider
#
Select Rate
# Con-
sider
#
Select Rate
# Con-
sider
#
Select Rate
# Con-
sider
#
Select Rate
ADJUTANT GENERALS CORPS 169 12 7.1% 107 7 6.5% 46 2 4.3% 28 1 3.6% 3 0 0.0% 8 1 12.5% 361 23 6.4%
AIR DEFENSE ARTILLERY 124 7 5.6% 28 2 7.1% 17 2 11.8% 13 0 0.0% 3 1 33.3% 185 12 6.5%
ARMOR 274 18 6.6% 20 3 15.0% 16 0 0.0% 7 0 0.0% 1 0 0.0% 7 2 28.6% 325 23 7.1%
AVIATION 455 16 3.5% 17 3 17.6% 23 0 0.0% 21 0 0.0% 1 0 0.0% 4 0 0.0% 521 19 3.6%
CHEMICAL CORPS 82 7 8.5% 26 3 11.5% 15 4 26.7% 7 1 14.3% 1 0 0.0% 3 0 0.0% 134 15 11.2%
CIVIL AFFAIRS 106 8 7.5% 11 3 27.3% 14 0 0.0% 8 0 0.0% 1 0 0.0% 3 0 0.0% 143 11 7.7%
CORPS OF ENGINEERS 317 18 5.7% 47 3 6.4% 30 3 10.0% 20 1 5.0% 5 0 0.0% 6 0 0.0% 425 25 5.9%
ELECTRONIC WARFARE 19 3 15.8% 6 2 33.3% 2 0 0.0% 1 1 100.0% 1 0 0.0% 1 0 0.0% 30 6 20.0%
FIELD ARTILLERY 327 25 7.6% 53 5 9.4% 25 3 12.0% 13 1 7.7% 2 0 0.0% 8 1 12.5% 428 35 8.2%
FINANCE CORPS 68 3 4.4% 49 3 6.1% 20 1 5.0% 6 0 0.0% 3 0 0.0% 146 7 4.8%
FOREIGN AREA OFFICER 230 12 5.2% 7 1 14.3% 48 0 0.0% 24 1 4.2% 2 0 0.0% 16 0 0.0% 327 14 4.3%
INFANTRY 456 23 5.0% 28 1 3.6% 23 1 4.3% 19 2 10.5% 3 0 0.0% 9 0 0.0% 538 27 5.0%
INFORMATION OPERATIONS OFFICER 98 9 9.2% 20 2 10.0% 12 1 8.3% 10 3 30.0% 1 1 100.0% 3 0 0.0% 144 16 11.1%
INFORMATION SYSTEM ENGINEERING 58 4 6.9% 17 3 17.6% 12 1 8.3% 9 0 0.0% 1 0 0.0% 97 8 8.2%
LOGISTICS 683 53 7.8% 331 33 10.0% 108 12 11.1% 62 3 4.8% 6 1 16.7% 19 2 10.5% 1209 104 8.6%
MATERIAL ACQUISITION MANAGEMENT 276 3 1.1% 131 12 9.2% 49 2 4.1% 33 0 0.0% 4 0 0.0% 8 0 0.0% 501 17 3.4%
MILITARY INTELLIGENCE 512 19 3.7% 96 9 9.4% 56 3 5.4% 44 1 2.3% 2 0 0.0% 18 1 5.6% 728 33 4.5%
MILITARY POLICE CORPS 202 14 6.9% 38 2 5.3% 18 5 27.8% 13 1 7.7% 2 0 0.0% 5 0 0.0% 278 22 7.9%
NUCLEAR WEAPONS 81 5 6.2% 7 1 14.3% 4 0 0.0% 6 0 0.0% 3 1 33.3% 1 0 0.0% 102 7 6.9%
OPERATIONS RESEARCH/SYSTEMS ANALYSIS 151 7 4.6% 17 3 17.6% 10 0 0.0% 11 2 18.2% 4 0 0.0% 3 0 0.0% 196 12 6.1%
PSYCHOLOGICAL OPERATIONS 61 6 9.8% 4 1 25.0% 9 2 22.2% 6 0 0.0% 1 0 0.0% 81 9 11.1%
PUBLIC AFFAIRS 66 6 9.1% 31 3 9.7% 5 2 40.0% 6 0 0.0% 5 0 0.0% 113 11 9.7%
SIGNAL CORPS 271 16 5.9% 103 12 11.7% 27 1 3.7% 34 2 5.9% 2 0 0.0% 7 0 0.0% 444 31 7.0%
SIMULATIONS OPERATIONS 68 2 2.9% 17 1 5.9% 11 1 9.1% 4 1 25.0% 2 0 0.0% 102 5 4.9%
SPACE OPERATIONS OFFICER 65 9 13.8% 5 0 0.0% 2 0 0.0% 3 0 0.0% 1 0 0.0% 76 9 11.8%
SPECIAL FORCES 319 9 2.8% 7 0 0.0% 10 1 10.0% 13 1 7.7% 1 0 0.0% 3 0 0.0% 353 11 3.1%
STRATEGIC AND FORCE DEVELOPMENT 62 4 6.5% 17 0 0.0% 7 1 14.3% 3 1 33.3% 2 0 0.0% 91 6 6.6%
STRATEGIC INTELLIGENCE OFFICER 105 4 3.8% 4 0 0.0% 2 0 0.0% 2 0 0.0% 2 1 50.0% 115 5 4.3%
STRATEGIC PLANS AND POLICY 104 2 1.9% 9 0 0.0% 6 0 0.0% 6 0 0.0% 3 0 0.0% 128 2 1.6%
SYSTEMS AUTOMATION OFFICERS 82 8 9.8% 62 10 16.1% 20 4 20.0% 18 3 16.7% 5 0 0.0% 187 25 13.4%
Grand Total 5891 332 5.6% 1315 128 9.7% 647 52 8.0% 450 26 5.8% 47 3 6.4% 158 9 5.7% 8508 550 6.5%
African AmerCaucasian Other TotalAmer IndianAsian_Pac IsHispanic
59
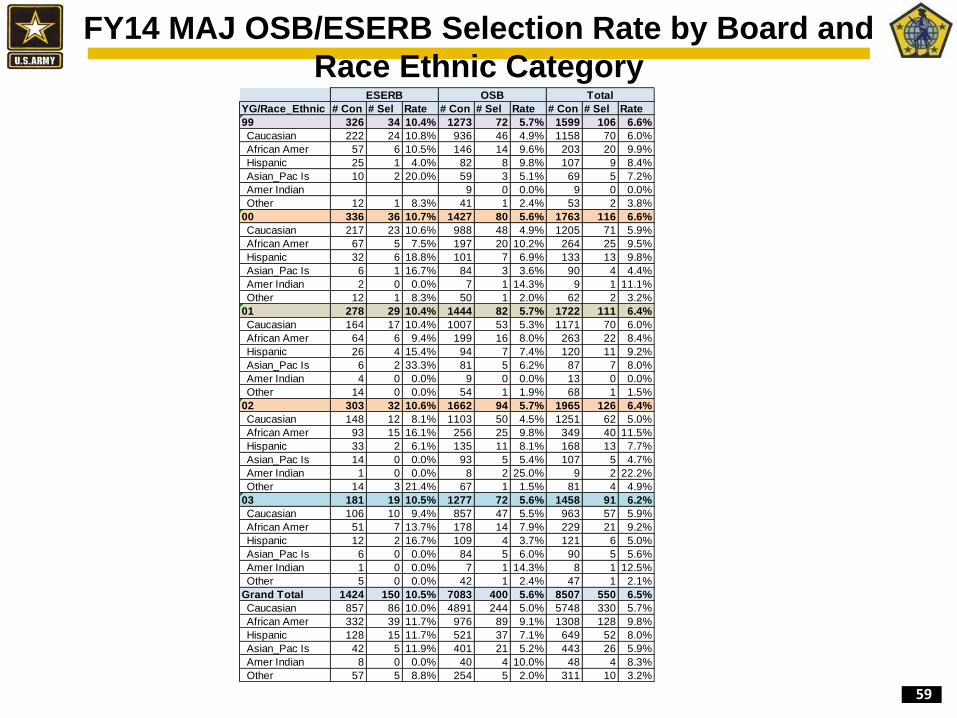
FY14 MAJ OSB/ESERB Selection Rate by Board and
Race Ethnic Category YG/Race_Ethnic # Con # Sel Rate # Con # Sel Rate # Con # Sel Rate
99 326 34 10.4% 1273 72 5.7% 1599 106 6.6%
Caucasian 222 24 10.8% 936 46 4.9% 1158 70 6.0%
African Amer 57 6 10.5% 146 14 9.6% 203 20 9.9%
Hispanic 25 1 4.0% 82 8 9.8% 107 9 8.4%
Asian_Pac Is 10 2 20.0% 59 3 5.1% 69 5 7.2%
Amer Indian 9 0 0.0% 9 0 0.0%
Other 12 1 8.3% 41 1 2.4% 53 2 3.8%
00 336 36 10.7% 1427 80 5.6% 1763 116 6.6%
Caucasian 217 23 10.6% 988 48 4.9% 1205 71 5.9%
African Amer 67 5 7.5% 197 20 10.2% 264 25 9.5%
Hispanic 32 6 18.8% 101 7 6.9% 133 13 9.8%
Asian_Pac Is 6 1 16.7% 84 3 3.6% 90 4 4.4%
Amer Indian 2 0 0.0% 7 1 14.3% 9 1 11.1%
Other 12 1 8.3% 50 1 2.0% 62 2 3.2%
01 278 29 10.4% 1444 82 5.7% 1722 111 6.4%
Caucasian 164 17 10.4% 1007 53 5.3% 1171 70 6.0%
African Amer 64 6 9.4% 199 16 8.0% 263 22 8.4%
Hispanic 26 4 15.4% 94 7 7.4% 120 11 9.2%
Asian_Pac Is 6 2 33.3% 81 5 6.2% 87 7 8.0%
Amer Indian 4 0 0.0% 9 0 0.0% 13 0 0.0%
Other 14 0 0.0% 54 1 1.9% 68 1 1.5%
02 303 32 10.6% 1662 94 5.7% 1965 126 6.4%
Caucasian 148 12 8.1% 1103 50 4.5% 1251 62 5.0%
African Amer 93 15 16.1% 256 25 9.8% 349 40 11.5%
Hispanic 33 2 6.1% 135 11 8.1% 168 13 7.7%
Asian_Pac Is 14 0 0.0% 93 5 5.4% 107 5 4.7%
Amer Indian 1 0 0.0% 8 2 25.0% 9 2 22.2%
Other 14 3 21.4% 67 1 1.5% 81 4 4.9%
03 181 19 10.5% 1277 72 5.6% 1458 91 6.2%
Caucasian 106 10 9.4% 857 47 5.5% 963 57 5.9%
African Amer 51 7 13.7% 178 14 7.9% 229 21 9.2%
Hispanic 12 2 16.7% 109 4 3.7% 121 6 5.0%
Asian_Pac Is 6 0 0.0% 84 5 6.0% 90 5 5.6%
Amer Indian 1 0 0.0% 7 1 14.3% 8 1 12.5%
Other 5 0 0.0% 42 1 2.4% 47 1 2.1%
Grand Total 1424 150 10.5% 7083 400 5.6% 8507 550 6.5%
Caucasian 857 86 10.0% 4891 244 5.0% 5748 330 5.7%
African Amer 332 39 11.7% 976 89 9.1% 1308 128 9.8%
Hispanic 128 15 11.7% 521 37 7.1% 649 52 8.0%
Asian_Pac Is 42 5 11.9% 401 21 5.2% 443 26 5.9%
Amer Indian 8 0 0.0% 40 4 10.0% 48 4 8.3%
Other 57 5 8.8% 254 5 2.0% 311 10 3.2%
ESERB OSB Total
60
CPT OSB and ESERB Analysis
OPMD, HRC
9 July 2014
As of: 091800Jul14
61
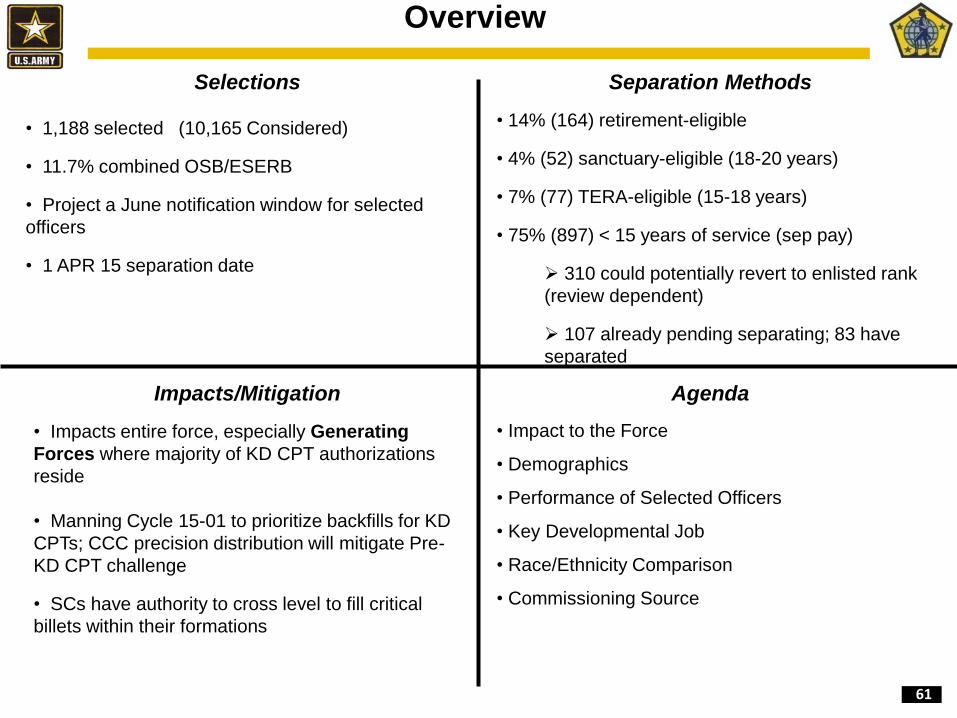
Overview
• 14% (164) retirement-eligible
• 4% (52) sanctuary-eligible (18-20 years)
• 7% (77) TERA-eligible (15-18 years)
• 75% (897) < 15 years of service (sep pay)
310 could potentially revert to enlisted rank
(review dependent)
107 already pending separating; 83 have
separated
Impacts/Mitigation
Selections
• 1,188 selected (10,165 Considered)
• 11.7% combined OSB/ESERB
• Project a June notification window for selected
officers
• 1 APR 15 separation date
Separation Methods
Agenda
• Impacts entire force, especially Generating
Forces where majority of KD CPT authorizations
reside
• Manning Cycle 15-01 to prioritize backfills for KD
CPTs; CCC precision distribution will mitigate Pre-
KD CPT challenge
• SCs have authority to cross level to fill critical
billets within their formations
• Impact to the Force
• Demographics
• Performance of Selected Officers
• Key Developmental Job
• Race/Ethnicity Comparison
• Commissioning Source
62
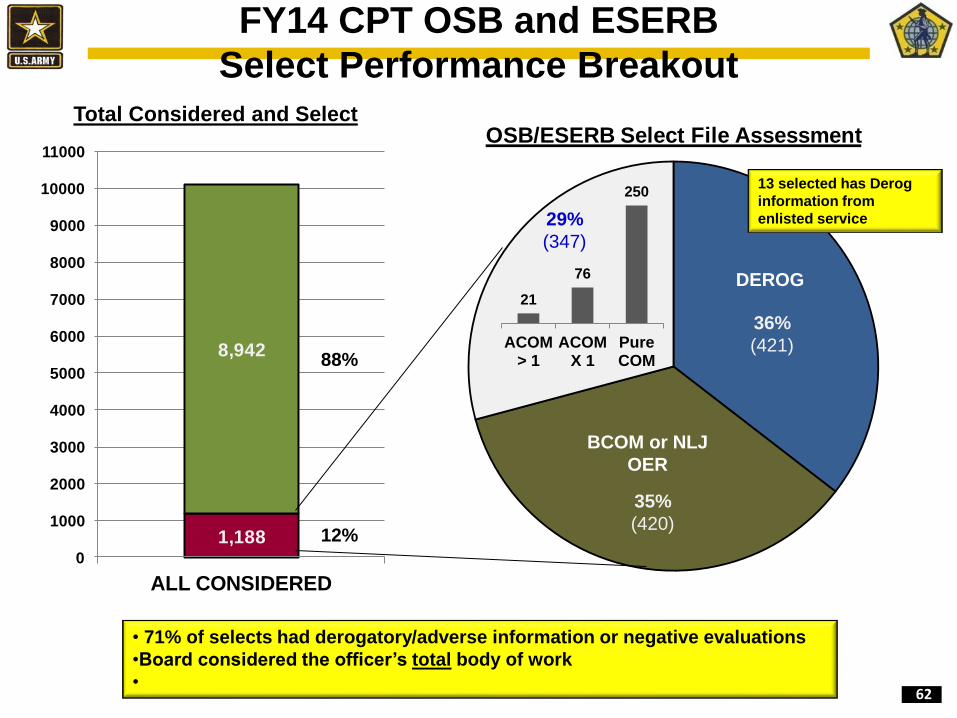
OSB/ESERB Select File Assessment
1,188
8,942
0
1000
2000
3000
4000
5000
6000
7000
8000
9000
10000
11000
ALL CONSIDERED
FY14 CPT OSB and ESERB
Select Performance Breakout
12%
Total Considered and Select
88%
DEROG
BCOM or NLJ
OER
• 71% of selects had derogatory/adverse information or negative evaluations
•Board considered the officer’s total body of work
•
36%
(421)
35%
(420)
21
76
250
ACOM> 1
ACOMX 1
PureCOM
29%
(347)
13 selected has Derog
information from
enlisted service

63
392
201
153
9683
56
3632 30 29 28 24 21
7
10%
25%
4%
17%
10%
23%
7%
0%
5%
10%
15%
20%
25%
30%
0
50
100
150
200
250
300
350
400
450
FY14 CPT OSB and ESERB Readiness Impacts Where Selects Assigned
Nu
mb
er
CP
Ts
Se
lec
t
Ra
te S
ele
ct
OS
B/E
SE
RB
• Largest number are assigned to Divisional Units or FORSCOM separates
• Highest select rate is 1A, 26% (53 CPTs)
Overall
12%
Select Rate
In Category

64
45
264
619
222
38
15.9%
13.8%
10.7%
11.8%13.4%
0.0%
2.0%
4.0%
6.0%
8.0%
10.0%
12.0%
14.0%
16.0%
18.0%
0
100
200
300
400
500
600
700
Not Deployed and Never Deployed
<1 Year < 2 Years < 3 Years > 3 Years
11.9%
10.8%
0.0%
2.0%
4.0%
6.0%
8.0%
10.0%
12.0%
14.0%
MALE FEMALE
20.0%
16.2%
14.6% 14.3%13.2%
9.4%
0.0%
5.0%
10.0%
15.0%
20.0%
25.0%
AFRICAN AMERICAN
HISPANIC OTHER AMER INDIAN
ASIAN CAUCASIAN
Demographics
Gender Selection Rates Race/Ethnic Selection Rates (Percent of Considered Pop)
Combat Experience Source of Commissioning
19.2%
16.8%
12.0%
8.6%
6.2%
0.0%
5.0%
10.0%
15.0%
20.0%
25.0%
OCS OTHER ROTC Non_SCH
ROTC SCH USMA
•Race and SOC trends historically consistent
•Lack of deployment is a slight indicator
65
26%
23%
20%
18% 17%
16% 16% 16% 15%14%
14% 13% 13%12% 12%
10% 10%
8%7% 7% 7% 7%
6% 5% 5%
3%
1%
0% 0% 0%0%
5%
10%
15%
20%
25%
30%
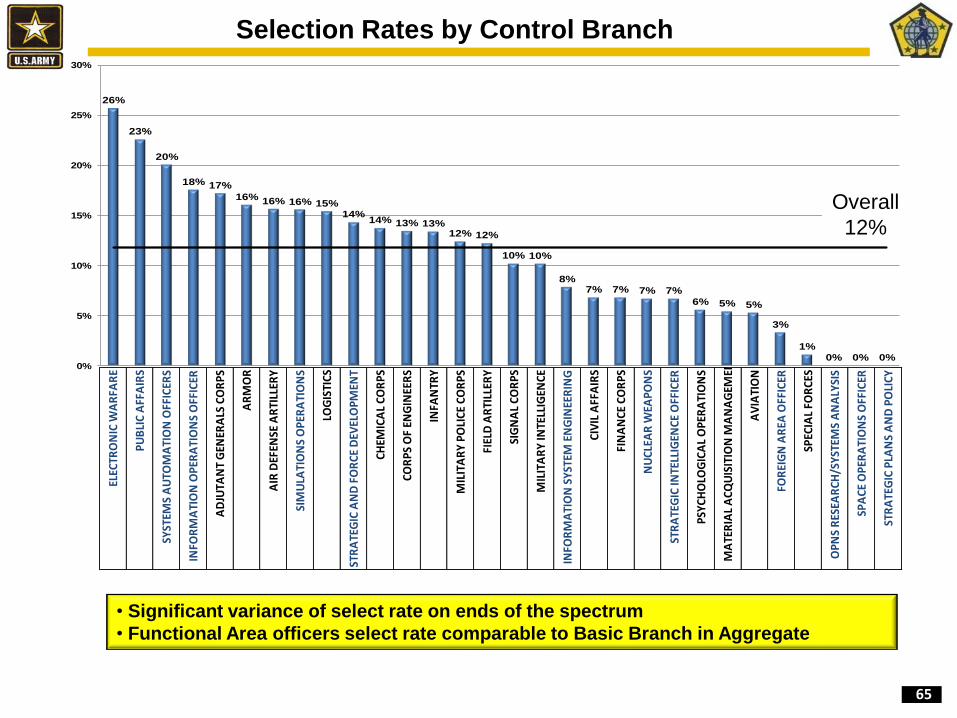
Selection Rates by Control Branch
Overall
12%
• Significant variance of select rate on ends of the spectrum
• Functional Area officers select rate comparable to Basic Branch in Aggregate
ELEC
TRO
NIC
WA
RFA
RE
PU
BLI
C A
FFA
IRS
SYST
EMS
AU
TOM
ATI
ON
OFF
ICER
S
INFO
RM
ATI
ON
OP
ERA
TIO
NS
OFF
ICER
AD
JUTA
NT
GEN
ERA
LS C
OR
PS
AR
MO
R
AIR
DEF
ENSE
AR
TILL
ERY
SIM
ULA
TIO
NS
OP
ERA
TIO
NS
LOG
ISTI
CS
STR
ATE
GIC
AN
D F
OR
CE
DEV
ELO
PM
ENT
CH
EMIC
AL
CO
RP
S
CO
RP
S O
F EN
GIN
EER
S
INFA
NTR
Y
MIL
ITA
RY
PO
LIC
E C
OR
PS
FIEL
D A
RTI
LLER
Y
SIG
NA
L C
OR
PS
MIL
ITA
RY
INTE
LLIG
ENC
E
INFO
RM
ATI
ON
SY
STEM
EN
GIN
EER
ING
CIV
IL A
FFA
IRS
FIN
AN
CE
CO
RP
S
NU
CLE
AR
WEA
PO
NS
STR
ATE
GIC
INTE
LLIG
ENC
E O
FFIC
ER
PSY
CH
OLO
GIC
AL
OP
ERA
TIO
NS
MA
TER
IAL
AC
QU
ISIT
ION
MA
NA
GEM
ENT
AV
IATI
ON
FOR
EIG
N A
REA
OFF
ICER
SPEC
IAL
FOR
CES
OP
NS
RES
EAR
CH
/SY
STEM
S A
NA
LYSI
S
SPA
CE
OP
ERA
TIO
NS
OFF
ICER
STR
ATE
GIC
PLA
NS
AN
D P
OLI
CY
66
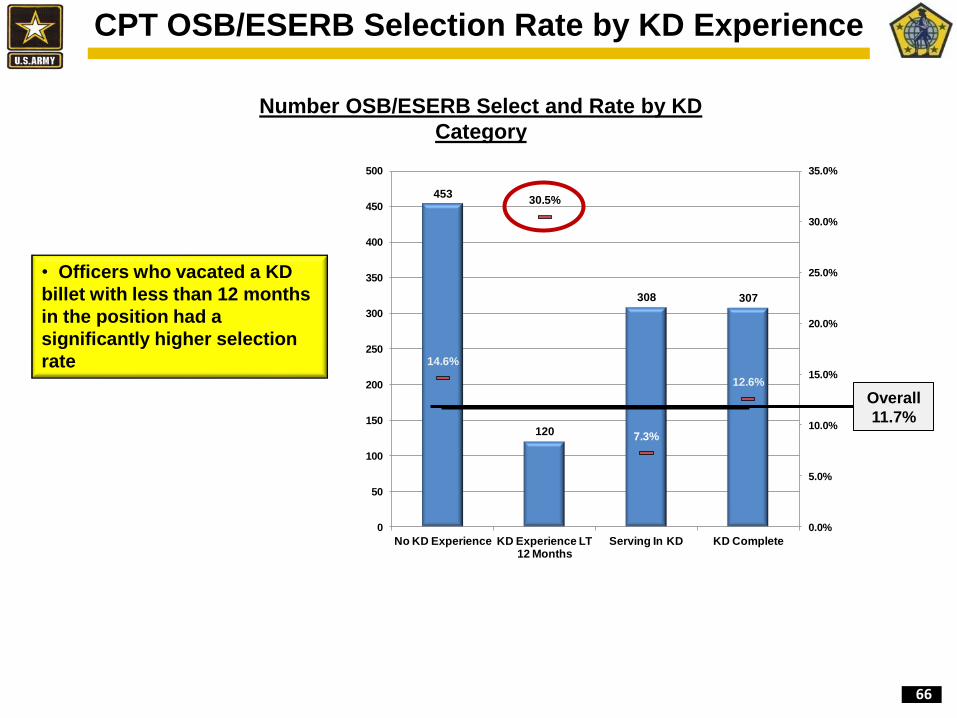
453
120
308 307
14.6%
30.5%
7.3%
12.6%
0.0%
5.0%
10.0%
15.0%
20.0%
25.0%
30.0%
35.0%
0
50
100
150
200
250
300
350
400
450
500
No KD Experience KD Experience LT 12 Months
Serving In KD KD Complete
CPT OSB/ESERB Selection Rate by KD Experience
Number OSB/ESERB Select and Rate by KD
Category
• Officers who vacated a KD
billet with less than 12 months
in the position had a
significantly higher selection
rate
Overall
11.7%

67
31.8% 32.7%
27.3%
80.0%
35.0%
26.2%
0.0%
10.0%
20.0%
30.0%
40.0%
50.0%
60.0%
70.0%
80.0%
90.0%
AFRICAN AMERICAN
HISPANIC OTHER AMER INDIAN
ASIAN CAUCASIAN
16.7%
15.0%
12.0%
8.6%
12.4%
8.8%
0.0%
2.0%
4.0%
6.0%
8.0%
10.0%
12.0%
14.0%
16.0%
18.0%
AFRICAN AMERICAN
HISPANIC OTHER AMER INDIAN
ASIAN CAUCASIAN
20.0%
16.2%
14.6% 14.3%13.2%
9.4%
0.0%
5.0%
10.0%
15.0%
20.0%
25.0%
AFRICAN AMERICAN
HISPANIC OTHER AMER INDIAN
ASIAN CAUCASIAN
Race/Ethnic Selection Rates
Overall
12%
OSB/ESERB Combined
OSB Only ESERB Only
OSB
10.5%
ESERB
30.0%
• ESERB overall select rate was higher than OSB;
AA made up 45% of ESERB considered population
• 8.6% of considered population considered high
risk for DEROG, BCOM Files, NLJ reports: AA =
13.5%, CAU = 5.3%.
• Selected officers with no DEROG or Poor
Evaluations comparison; AA = 28% , all others =
29%
AA = 11% of considered pop AA = 45% of considered pop
68
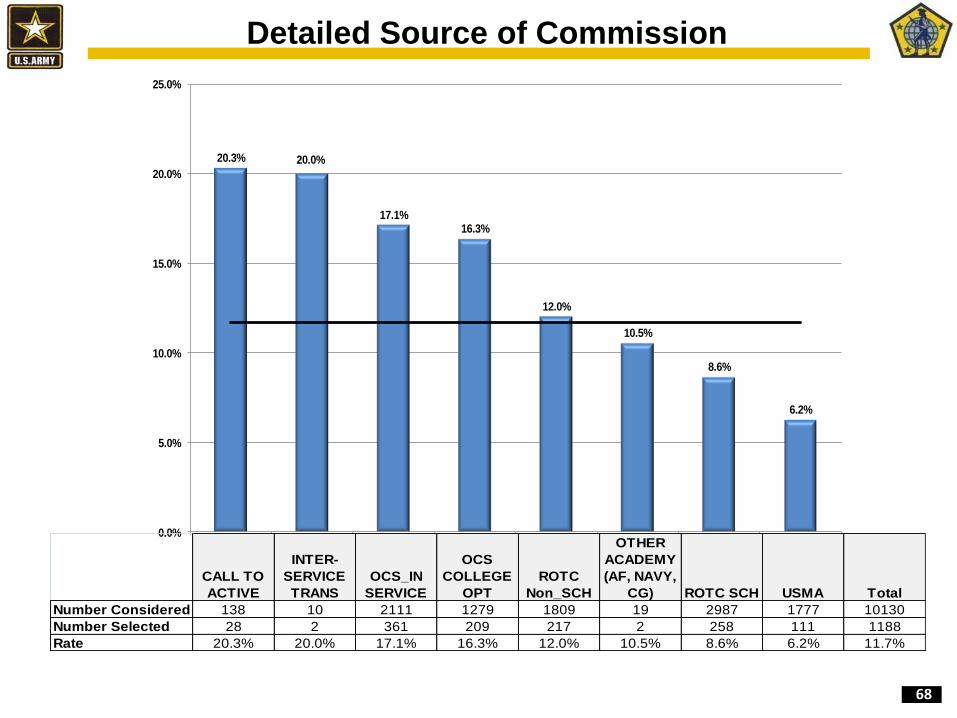
20.3% 20.0%
17.1%16.3%
12.0%
10.5%
8.6%
6.2%
0.0%
5.0%
10.0%
15.0%
20.0%
25.0%
CALL TO ACTIVE
INTER-SERVICE TRANS
OCS_IN SERVICE
OCS_COLLEGE OPT
ROTC Non_SCH OTHER ACADEMIES
(AF, NAVY, CG)
ROTC SCH USMA
CALL TO
ACTIVE
INTER-
SERVICE
TRANS
OCS_IN
SERVICE
OCS
COLLEGE
OPT
ROTC
Non_SCH
OTHER
ACADEMY
(AF, NAVY,
CG) ROTC SCH USMA Total
Number Considered 138 10 2111 1279 1809 19 2987 1777 10130
Number Selected 28 2 361 209 217 2 258 111 1188
Rate 20.3% 20.0% 17.1% 16.3% 12.0% 10.5% 8.6% 6.2% 11.7%
Detailed Source of Commission

69
Backups
CSL Audits and Due Outs

70
Installation Command: Supports tenant units or activities in a designated geographic area by
organizing, directing, coordinating, and controlling installation support and service activities.
Located in TDA organizations, both CONUS and OCONUS; dedicated to supporting and protecting
Army Soldiers, civilians, and their families; accountable for critical mission areas such as
mobilization, public works, real property management, and local civil authorities/host nation
rapport.*
Operations Command: BN and BDE sized units, expeditionary in nature and
deployable worldwide with approved TO&E, joint organization, and special mission units (SMUs).
Provides the fighting power to combatant or joint task force commanders with a primary mission of
deploying to a theater of combat operations.*
Recruiting and Training Command: Typically fixed-site, non-deployable, and in TDA
organizations. Focuses on generating Soldiers into conventional and SMUs of the US Army and
sister services. Supports the training of units from the Army and sister services. No individual
weapons qualifications requirements exist for cadre and non-training Soldiers.*
Strategic Support (SS) Command Category: BN and BDE sized units (mainly approved TDA
units) focused on providing support (e.g., analysis, intelligence, etc.) to a theater. Conducts actions
in a CONUS or OCONUS garrison environment supporting the war fighter or trainer, primarily in a
fixed-site. Though the command is non-deployable, it may have subordinate unit slices that deploy
to a theater of combat operations.*
Key Billet: A duty assignment at the lieutenant colonel or colonel rank requiring specific, highly
developed skills and experience that is deemed so critical to a unit’s mission that an officer is
selected for assignment by Headquarters Department of the Army. Key billet officers exercise
judgment and recommend actions to the commander. They principally manage resources and
oversee processes that operate in a leadership environment. ** (Sources: *Army G-1, ** DA PAM 600-3)
Definitions of Command Categories
Slide 10

71
Assess how the total number of LTC/COL CSL positions has changed
over time, and why
2 Primary driving forces:
Key Billets
Separate battalions inactivated in
2005.
General Staff Key Billets (G1, G2,
G6, G8) introduced to CSL to mitigate
the loss of basic branch commands.
Key Billets for select Functional
Areas beginning 2009
*Does not depict projected force reductions
Force Structure
Increase in number of BCTs and
changes to structure
2 year interval with CSL MITT
Overall 9% increase in CSL Billets
12% increase in LTC CSL
LTC/COL CSL Positions Changes
(KD adds)
Slide 11

72
0
23
35
20
22
10
33
10 11
3 5
3
10 10
7 7
5
31
4 0
22
50
18
21
7
31
10 9
4 5
2
20
15
8 7
6
48
7
AR IN CAB EN FA AD AV SF MP PO CA CM SC MI AG FI AG/FI LG 01A
CO
MM
AN
D T
OT
AL
S
BRANCHES
FY15/16 LTC OPERATIONS COMMAND BALANCE
FY15 FY16
Current Imbalance
47% in FY15; 53% in FY16
Engage ACOMS, ASCCs to effect
balance in CSL opportunities
Fix through curtailments
73
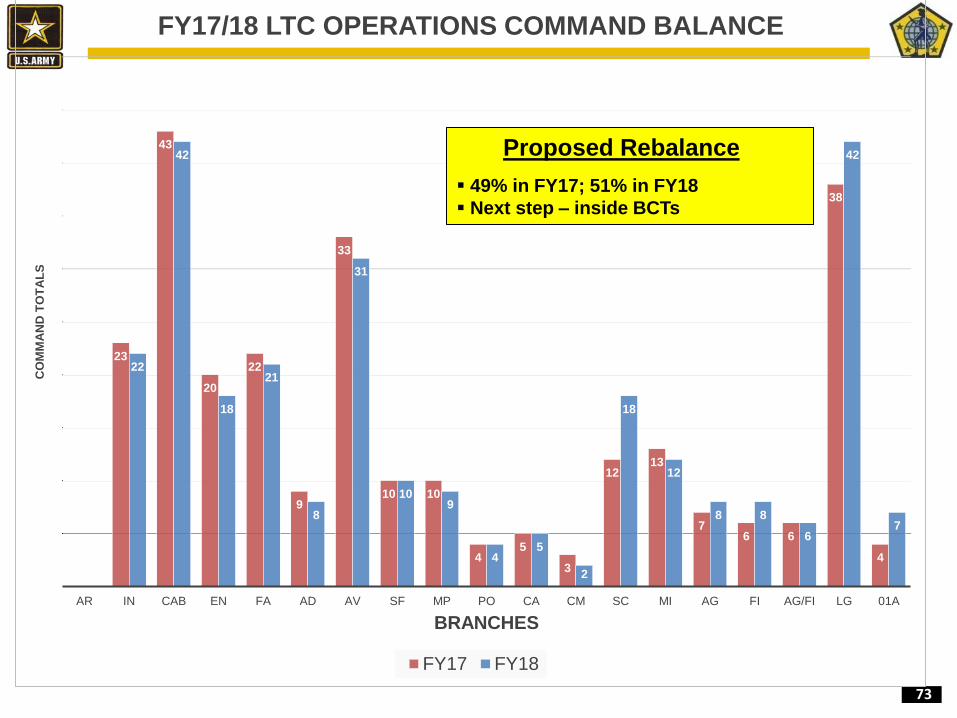
0
23
43
20
22
9
33
10 10
4 5
3
12 13
7 6 6
38
4
0
22
42
18
21
8
31
10 9
4 5
2
18
12
8 8
6
42
7
AR IN CAB EN FA AD AV SF MP PO CA CM SC MI AG FI AG/FI LG 01A
CO
MM
AN
D T
OT
AL
S
BRANCHES
FY17/18 LTC OPERATIONS COMMAND BALANCE
FY17 FY18
Proposed Rebalance
49% in FY17; 51% in FY18
Next step – inside BCTs

74
0 10
0 12 14
10
19 12 10
15
102
20 18
14
2 7
11
2
14 11
6
105
1AD 1CD 1ID 2ID 3ID 4ID 10M 25ID 82AB 101AB TOTAL
FY15/16 BCT Battalion Command Balance
FY15 FY16
Current BCT Balance
Overall balanced in total
Significant imbalance within
formations
ARFORGEN and other factors will
keep the target moving
Slide 12

75
87% LTC CSL Non-Select
10% COL
13% LTC CSL
72% COL
Considered Population
73%
SSC
Importance of LTC CSL Positions
For Command-Centric Basic Branches, the path to COL is through
LTC CSL
36% COL CSL <1% COL CSL
* All Percentages based on
an average of 2002-2009
selection rates Note: Changing the number of looks for command from 6 to 3 will reduce the
size of the total considered population. This will result in an increased
selection percentage beginning with the FY 15 slate.
Slide 12

76
82d ABN / 1CD Analysis – a step further
SR sampling from 2010-2012, home station only
Senior rater population generally consistent; variables such as TRA, SMC
roles may have imposed variances
No pooling identified
Confirm or Deny Commanders are Pooling
Division LTC CSL Location Non-SEL Select Total Compete Select Rate SR Population
Divisions w/Corps (in 2012)
82 ABN DIV 6 5 11 45.5% 74
1st CAV DIV 13 6 19 31.6% 63
7th INF DIV 11 2 13 15.4% 40
Total 30 13 43 30.2% 59 (avg)
Divisions w/o Corps
10 MTN DIV 4 8 12 66.7% 89
4 INF DIV 5 7 12 58.3% 92
25 INF DIV 8 8 16 50.0% 52
1st AR DIV 14 8 22 36.4% 80
101st AA DIV 11 6 17 35.3% 94
2nd INF DIV 6 3 9 33.3% 69
3rd INF DIV 9 3 12 25.0% 87
1st INF DIV 13 4 17 23.5% 60
Total 70 47 117 40.2% 78 (avg)
Grand Total 100 60 160 37.5%
Slide 15

77
Backup
Branch Monitoring

78
Year Group 2002 Long Term Impact of OSB
0
500
1000
1500
2000
2500
3000
3500
4000
4500
5000
1 2 3 4 5 6 7 8 9 10 11 12 13 14 15 16 17 18 19 20 21 22 23 24 25 26 27 28 29 30
YG 2002 Impact of OSB with Forecasted Attrition (Aggregate)
YG02 YG02 w/OSB
0
500
1000
1500
2000
2500
3000
3500
1 2 3 4 5 6 7 8 9 10 11 12 13 14 15 16 17 18 19 20 21 22 23 24 25 26 27 28 29 30
YG 2002 Impact of OSB with Forecasted Attrition (Caucasian)
Caucasian YG02 Caucasian YG02 w/OSB
0
100
200
300
400
500
600
700
1 2 3 4 5 6 7 8 9 10 11 12 13 14 15 16 17 18 19 20 21 22 23 24 25 26 27 28 29 30
YG 2002 Impact of OSB with Forecasted Attrition (African American)
AA YG02 AA YG02 w/OSB
1 2 3 4 5 6 7 8 9 10 11 12 13 14 15 16 17 18 19 20 21 22 23 24 25 26 27 28 29 30
YG02 4435 4363 4123 3522 2828 2518 2347 2242 2150 2048 1887 1807 1722 1664 1613 1558 1508 1460 1414 1234 1009 828 713 619 541 450 356 265 192 96
YG02 w/OSB 4435 4363 4123 3522 2828 2518 2347 2242 2150 2048 1887 1807 1596 1542 1495 1444 1397 1353 1310 1143 935 767 661 574 502 417 330 245 178 89
AA YG02 620 612 577 508 447 425 408 400 387 380 372 349 333 321 312 301 291 282 273 238 195 160 138 120 105 87 69 51 37 19
AA YG02 w/OSB 620 612 577 508 447 425 408 400 387 380 372 349 293 283 274 265 256 248 240 210 171 141 121 105 92 76 61 45 33 16
Caucasian YG02 3164 3116 2939 2497 1960 1719 1590 1509 1443 1370 1275 1251 1192 1152 1117 1079 1044 1011 979 854 699 573 494 429 375 312 247 183 133 67
Caucasian YG02 w/OSB 3164 3116 2939 2497 1960 1719 1590 1509 1443 1370 1275 1251 1130 1092 1059 1023 990 958 928 810 662 543 468 406 355 295 234 174 126 63
OSB
(-126) OSB
(-62)
OSB
(-40)
• YG 2002 had increased attrition rates during the peak
war years, but stabilized prior to the OSB.
• The higher rate of selection for the AA population will
impact the year group more significantly during the next
ten years
• The forecast predicts a reduction of 28 (-12%) and 3 (-
16%) AA officers at 20 & 30 Years of Service
respectively
• Caucasian officers had a reduction of 44 (-5%) and -4
(-1%) at 20 & 30 Years of Service respectively

79
Year Group 2007 Long Term Impact of OSB
1 2 3 4 5 6 7 8 9 10 11 12 13 14 15 16 17 18 19 20 21 22 23 24 25 26 27 28 29 30
Caucasian YG07 3837 3790 3625 3305 2985 2709 2575 2393 2246 2131 2037 1948 1856 1794 1739 1680 1625 1574 1524 1330 1088 892 769 668 584 485 384 285 207 104
Caucasian YG07 w/OSB 3837 3790 3625 3305 2985 2709 2575 2179 2045 1940 1854 1773 1690 1633 1583 1529 1480 1433 1388 1211 990 812 700 608 531 442 349 260 189 94
AA YG07 603 596 583 566 533 508 484 450 422 400 383 366 349 337 327 316 305 296 286 250 204 168 145 125 110 91 72 54 39 19
AA YG07 w/OSB 603 596 583 566 533 508 484 341 320 303 290 277 264 255 248 239 231 224 217 189 155 127 109 95 83 69 55 41 30 15
YG07 5282 5218 5010 4620 4212 3861 3684 3424 3213 3048 2914 2787 2656 2566 2488 2403 2325 2252 2181 1903 1556 1276 1100 955 835 694 549 408 297 148
YG07 w/ OSB 5282 5218 5010 4620 4212 3861 3684 3424 2612 2478 2369 2266 2159 2086 2023 1953 1890 1831 1773 1547 1265 1038 894 776 679 564 446 332 241 121
0
100
200
300
400
500
600
700
1 2 3 4 5 6 7 8 9 10 11 12 13 14 15 16 17 18 19 20 21 22 23 24 25 26 27 28 29 30
YG 2007 Impact of OSB with Forecasted Attrition (African American)
AA YG07 AA YG07 w/OSB
0
500
1000
1500
2000
2500
3000
3500
4000
4500
1 2 3 4 5 6 7 8 9 10 11 12 13 14 15 16 17 18 19 20 21 22 23 24 25 26 27 28 29 30
YG 2007 Impact of OSB with Forecasted Attrition (Caucasian)
Caucasian YG07 Caucasian YG07 w/OSB
0
1000
2000
3000
4000
5000
6000
1 2 3 4 5 6 7 8 9 10 11 12 13 14 15 16 17 18 19 20 21 22 23 24 25 26 27 28 29 30
YG 2007 Impact of OSB with Forecasted Attrition (Aggregate)
YG07 YG07 w/ OSB
OSB
(-601) OSB
(-362)
OSB
(-109)
• The OSB significantly impacted the YG 2007 AA
population. The AA Combat Arms population will
reduce by 20%.
• The OSB will have significant long term impacts to the
YG.
• The forecast predicts a reduction of 61 (-24%) and 4
(-21%) AA officers at 20 & 30 Years of Service
respectively
• Caucasian officers had a reduction of 119 (-1%) and
-10 (-10%) at 20 & 30 Years of Service respectively

80
Reduced Accession Long Term Impact
0
100
200
300
400
500
600
700
1 2 3 4 5 6 7 8 9 10 11 12 13 14 15 16 17 18 19 20 21 22 23 24 25 26 27 28 29 30
African American Accessions Required Increase @ 30 Years
AA Accessions Accessions Increase for increase of 1 @ 30 Years
0
500
1000
1500
2000
2500
3000
3500
4000
4500
1 2 3 4 5 6 7 8 9 10 11 12 13 14 15 16 17 18 19 20 21 22 23 24 25 26 27 28 29 30
Reduced Accessions Impact Over 30 Years
Current Accessions Drawdown Reduced Accessions
1 2 3 4 5 6 7 8 9 10 11 12 13 14 15 16 17 18 19 20 21 22 23 24 25 26 27 28 29 30
Current Accessions 4100 4078 3979 3675 3203 2787 2552 2372 2226 2112 2019 1931 1840 1778 1724 1665 1611 1560 1511 1318 1078 884 762 662 578 481 380 283 205 103
Drawdown Reduced
Accessions3850 3830 3737 3451 3007 2617 2397 2228 2090 1983 1896 1813 1728 1670 1619 1563 1513 1465 1419 1238 1012 830 716 621 543 452 357 266 193 96
AA Accessions 579 576 562 519 452 394 360 335 314 298 285 273 260 251 243 235 228 220 213 186 152 125 108 93 82 68 54 40 29 15
Accessions Increase for
increase of 1 @ 30 Years619 616 601 555 484 421 385 358 336 319 305 292 278 268 260 251 243 236 228 199 163 134 115 100 87 73 57 43 31 16
• With reductions in Accessions due to drawdown, the AA population has potential to decrease faster than
other REDCATs due to historical OML standing.
• USMA traditionally has the lowest raw number of AA officers.
• OCS historically produces a high percentage of AA officers, but accessions decreased to 500 for FY14.
• ROTC is currently the largest potential source of raw numbers for AA officers and DA Branching Model will
ensure representation in Combat Arms branches.
• In order to increase AA population by 1 in a 30 year forecast, accessions must increase by 40.

81
Caucasian African American Asian Hispanic Other/Blank
Operations 157 23 3 6 6
Force Sustainment 45 11 0 2 3
Operations Support 47 8 0 2 2
0%
10%
20%
30%
40%
50%
60%
70%
80%
90%
100%
YG97 OCS Branching Results by REDCAT
Caucasian African American Asian Hispanic Other/Blank
Operations 1190 155 68 76 33
Force Sustainment 494 84 39 31 13
Operations Support 440 73 30 29 13
0%
10%
20%
30%
40%
50%
60%
70%
80%
90%
100%
YG97 ROTC Branching Results by REDCAT
Caucasian African American Asian Hispanic Other/Blank
Operations 576 39 26 29 11
Force Sustainment 64 8 5 3 1
Operations Support 68 12 13 4 3
0%
10%
20%
30%
40%
50%
60%
70%
80%
90%
100%
YG97 USMA Branching Results by REDCATUSMA
Case Study 1: YG97 Accessions by Source
• ROTC has the largest minority population out of the
three Sources of Commission (SOCs).
• ROTC & OCS made up 78% of the overall YG97
cohort with 86% of the AA population, but received
70% of the Combat Arms branch allocations for 1997
• With a lower quantity of AA accessions into the
Combat Arms, all subsequent efforts will fight that
shortfall for 20-30 years.
ROTC
OCS
312
59 42
1. Accessions
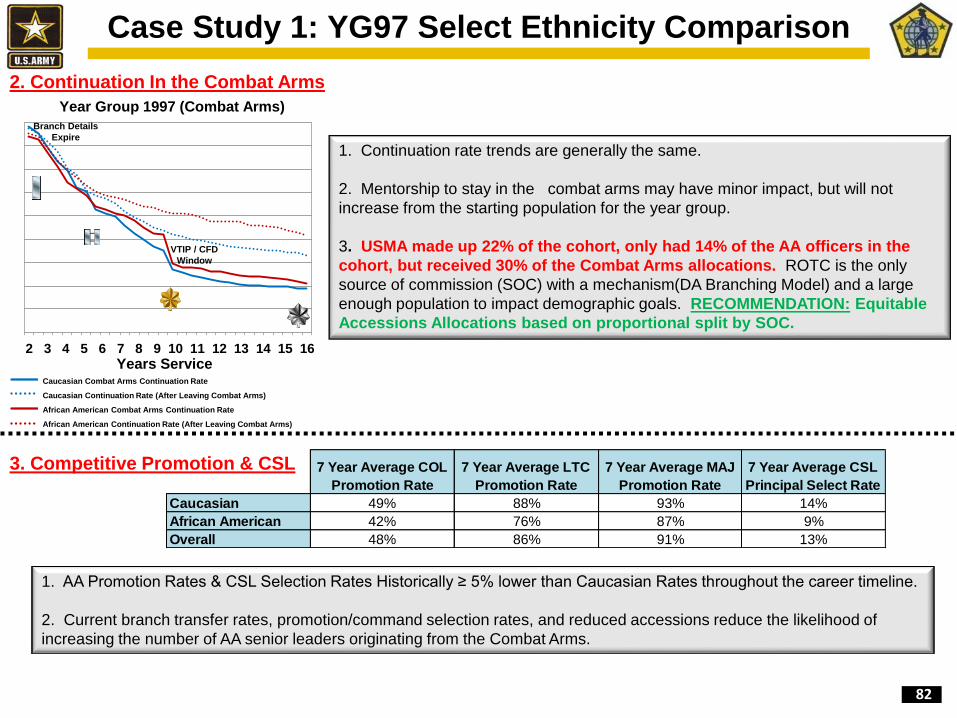
82
Case Study 1: YG97 Select Ethnicity Comparison
0
20
40
60
80
100
120
140
160
180
0
200
400
600
800
1000
1200
1400
1600
1800
1 2 3 4 5 6 7 8 9 10 11 12 13 14 15 16 17 18 19 20 21 22 23 24 25 26 27 28 29 30
CA YG97 Caucasian
YG97 Caucasian
CA YG97 African American
YG97 African American
2 3 4 5 6 7 8 9 10 11 12 13 14 15 16
Years Service
Year Group 1997 (Combat Arms)
7 Year Average COL
Promotion Rate
7 Year Average LTC
Promotion Rate
7 Year Average MAJ
Promotion Rate
7 Year Average CSL
Principal Select Rate
Caucasian 49% 88% 93% 14%
African American 42% 76% 87% 9%
Overall 48% 86% 91% 13%
1. Continuation rate trends are generally the same.
2. Mentorship to stay in the combat arms may have minor impact, but will not
increase from the starting population for the year group.
3. USMA made up 22% of the cohort, only had 14% of the AA officers in the
cohort, but received 30% of the Combat Arms allocations. ROTC is the only
source of commission (SOC) with a mechanism(DA Branching Model) and a large
enough population to impact demographic goals. RECOMMENDATION: Equitable
Accessions Allocations based on proportional split by SOC.
2. Continuation In the Combat Arms
3. Competitive Promotion & CSL
VTIP / CFD
Window
Branch Details
Expire
0
20
40
60
80
100
120
140
160
180
0
200
400
600
800
1000
1200
1400
1600
1800
1 2 3 4 5 6 7 8 9 10 11 12 13 14 15 16 17 18 19 20 21 22 23 24 25 26 27 28 29 30
CA YG97 Caucasian
YG97 Caucasian
CA YG97 African American
YG97 African American
Caucasian Combat Arms Continuation Rate
Caucasian Continuation Rate (After Leaving Combat Arms)
African American Combat Arms Continuation Rate
African American Continuation Rate (After Leaving Combat Arms)
1. AA Promotion Rates & CSL Selection Rates Historically ≥ 5% lower than Caucasian Rates throughout the career timeline.
2. Current branch transfer rates, promotion/command selection rates, and reduced accessions reduce the likelihood of
increasing the number of AA senior leaders originating from the Combat Arms.
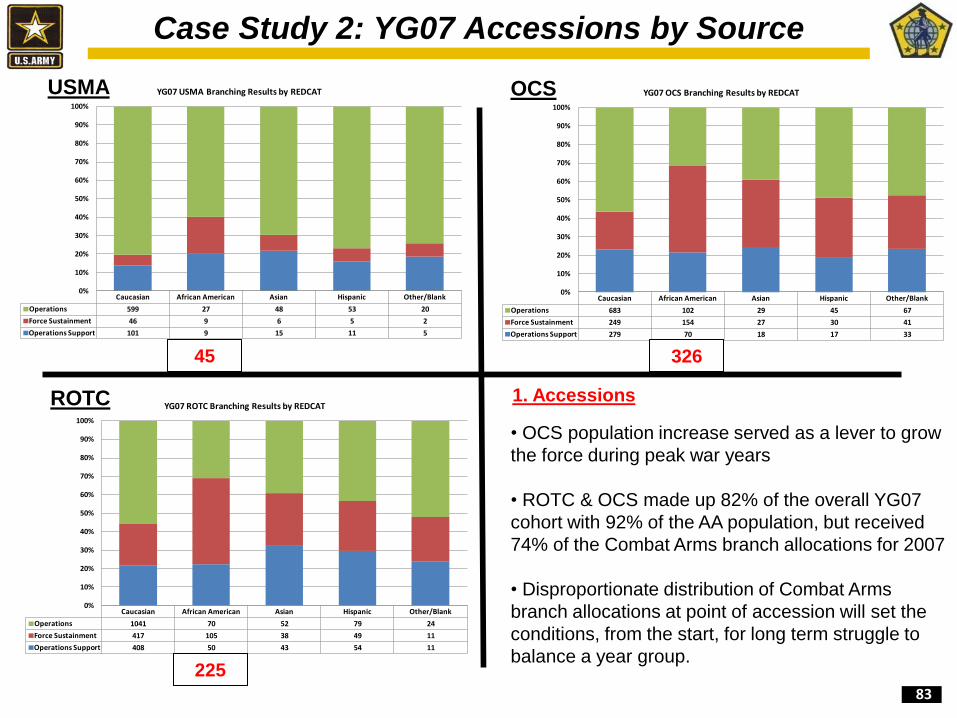
83
Caucasian African American Asian Hispanic Other/Blank
Operations 683 102 29 45 67
Force Sustainment 249 154 27 30 41
Operations Support 279 70 18 17 33
0%
10%
20%
30%
40%
50%
60%
70%
80%
90%
100%
YG07 OCS Branching Results by REDCAT
Caucasian African American Asian Hispanic Other/Blank
Operations 1041 70 52 79 24
Force Sustainment 417 105 38 49 11
Operations Support 408 50 43 54 11
0%
10%
20%
30%
40%
50%
60%
70%
80%
90%
100%
YG07 ROTC Branching Results by REDCAT
Caucasian African American Asian Hispanic Other/Blank
Operations 599 27 48 53 20
Force Sustainment 46 9 6 5 2
Operations Support 101 9 15 11 5
0%
10%
20%
30%
40%
50%
60%
70%
80%
90%
100%
YG07 USMA Branching Results by REDCATUSMA
Case Study 2: YG07 Accessions by Source
• OCS population increase served as a lever to grow
the force during peak war years
• ROTC & OCS made up 82% of the overall YG07
cohort with 92% of the AA population, but received
74% of the Combat Arms branch allocations for 2007
• Disproportionate distribution of Combat Arms
branch allocations at point of accession will set the
conditions, from the start, for long term struggle to
balance a year group.
ROTC
OCS
225
326 45
1. Accessions

84
All Branches
Population
All Branches
Selected
All Branches
Select Rate
Combat Arms
Population
Combat Arms
Selected
Combat Arms
Select Rate
Caucasian 2575 362 14% 1374 179 13%
African American 484 109 23% 90 19 21%
-10
10
30
50
70
90
110
130
150
170
0
250
500
750
1000
1250
1500
1750
2000
2250
1 2 3 4 5 6
Caucasian Combat Arms Continuation Rate
Caucasian Continuation Rate (After Leaving Combat Arms)
African American Combat Arms Continuation Rate
African American Continuation Rate (After Leaving Combat Arms)
Case Study 2: YG07 Select Ethnicity Comparison
1 2 3 4 5 6 7 8 9 10 11 12 13 14 15 Years Service
Year Group 2007 (Combat Arms)
1. The continuation rate trend chart for YG07 is similar to other year groups and
already depicts the early signs of AA officers departing the Combat Arms and moving
to other branches at a higher rate than Caucasian officers.
2. In addition to normal attrition, the OSB will amplify YG07’s attrition trends as the
YG matures.
3. USMA made up 18% of the cohort, only had 7.6% of the AA officers in the
cohort, but received 25% of the Combat Arms allocations. ROTC is the only
source of commission (SOC) with a mechanism(DA Branching Model) that will ensure
achievement of demographic goals. RECOMMENDATION: Equitable Accessions
Allocations based on proportional split by SOC.
2. Continuation In the Combat Arms
3. OSB Impact
VTIP / CFD
Window
Branch Details
Expire
0
20
40
60
80
100
120
140
160
180
0
200
400
600
800
1000
1200
1400
1600
1800
1 2 3 4 5 6 7 8 9 10 11 12 13 14 15 16 17 18 19 20 21 22 23 24 25 26 27 28 29 30
CA YG97 Caucasian
YG97 Caucasian
CA YG97 African American
YG97 African American
Caucasian Combat Arms Continuation Rate
Caucasian Continuation Rate (After Leaving Combat Arms)
African American Combat Arms Continuation Rate
African American Continuation Rate (After Leaving Combat Arms)
1. OSB more deeply impacted the AA population of officers in YG07 in the aggregate (9% higher select rate compared to
Caucasian officers) as well as in the Combat Arms (8% higher select rate compared to Caucasian officers)
2. OSB will impact the AA Combat Arms population with approximately a 20% decrease in population size

85
COL LTC MAJ CPT
Operations 7 48 179 20
Force Sustainment 1 11 46 10
Operations Support 58 83 133 17
0%
10%
20%
30%
40%
50%
60%
70%
80%
90%
100%
USMA Staff & Faculty Distribution of Branches
COL LTC MAJ CPT
Caucasian 63 128 310 45
Other / Blank 1 6 1
Asian 3 15 3
Hispanic 2 10 16 3
African American 4 11 18 8
0%
10%
20%
30%
40%
50%
60%
70%
80%
90%
100%
USMA Staff & Faculty Distribution of REDCAT
FY14 USMA Manning and Branching Results
- USMA’s staff and faculty is very diverse across all grades, but becomes more
predominantly Caucasian at the grade of Colonel.
- The increasing representation of Operations Support branches as rank increases within the
staff and faculty is due to the population of Academy Professors (FA47) and Functional Area
officers.
- USMA’s branching results for FY14 depict a higher than average rate of African American
officers’ receiving Force Sustainment branches.
CaucasianAfrican
AmericanAsian Hispanic Other/Blank
Operations 569 40 52 60 23
Force Sustainment 99 16 15 11 2
Operations Support 95 8 15 9 4
0%
10%
20%
30%
40%
50%
60%
70%
80%
90%
100%
FY14 USMA Branching Results by REDCAT