Embed Size (px)
Citation preview
|
Human Resources –
Payroll BI DashboardBusiness Intelligence User GuideDashboard Content & Examples
Institutional
Research & Analysis
| 2
WelcomeThis user guide demonstrates how users can answer questions
using the Human Resources Payroll Business Intelligence (BI)
dashboard.
The HR Payroll BI dashboard was developed by Institutional
Research and Analysis in close coordination with Human
Resources and stakeholders across the university and contains
reports on payroll including earnings, benefits and taxes. In
addition to this user guide, the Payroll BI dashboard includes a
Definitions tab as well as explanations within each report of the
rules and definitions applied.
We hope you find the content of this guide and the dashboard
relevant, useful, clear and easy-to-use.
| 3
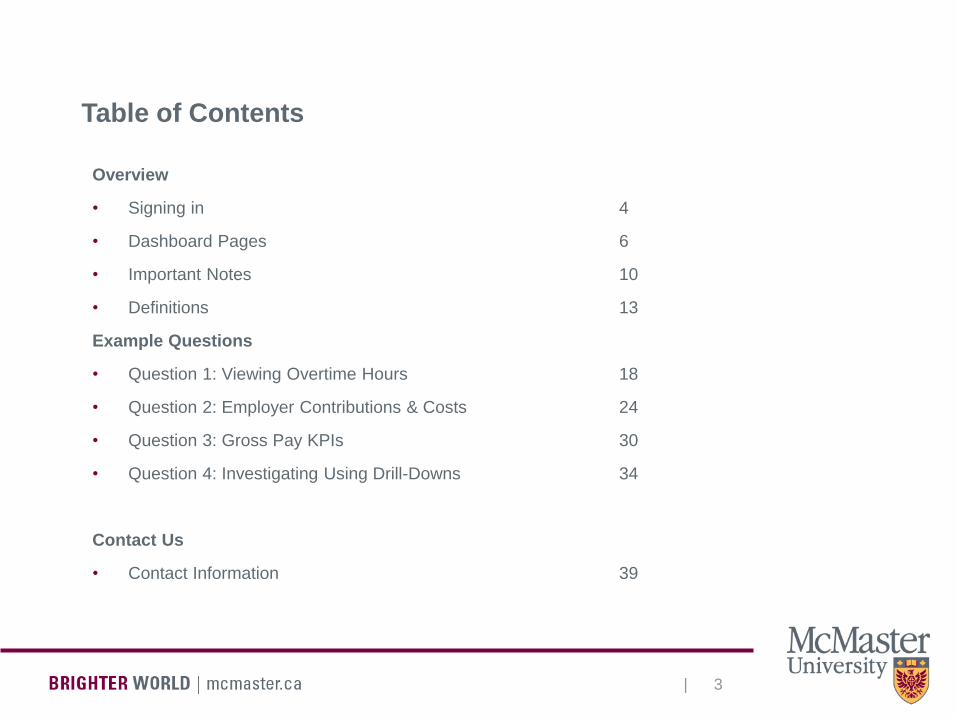
Table of Contents
Overview
• Signing in 4
• Dashboard Pages 6
• Important Notes 10
• Definitions 13
Example Questions
• Question 1: Viewing Overtime Hours 18
• Question 2: Employer Contributions & Costs 24
• Question 3: Gross Pay KPIs 30
• Question 4: Investigating Using Drill-Downs 34
Contact Us
• Contact Information 39
| 4
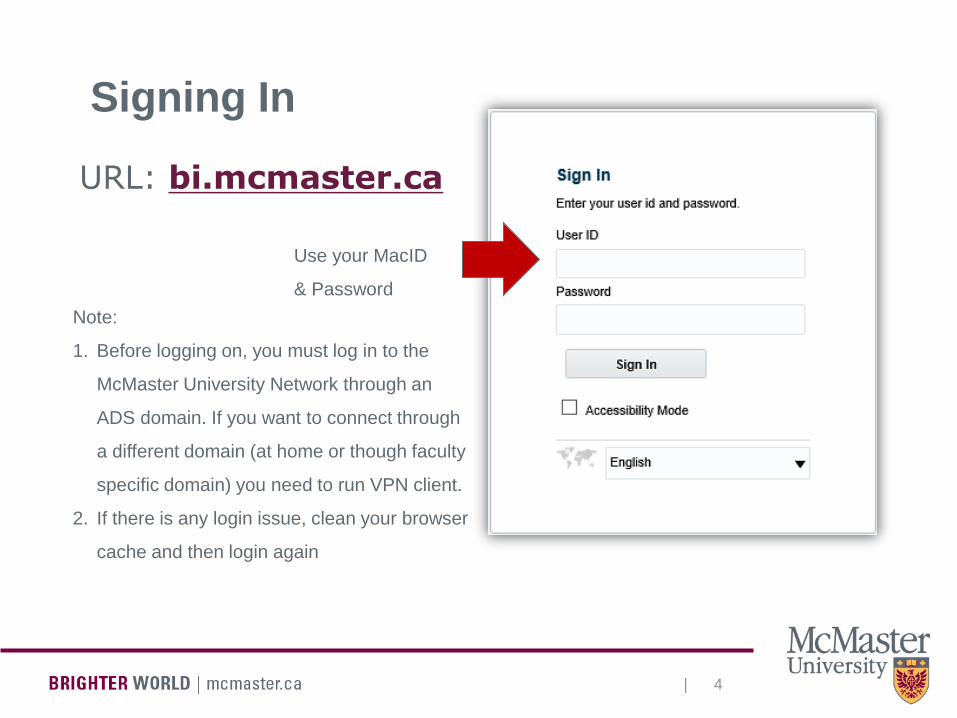
Signing In
URL: bi.mcmaster.ca
Use your MacID
& Password
Note:
1. Before logging on, you must log in to the
McMaster University Network through an
ADS domain. If you want to connect through
a different domain (at home or though faculty
specific domain) you need to run VPN client.
2. If there is any login issue, clean your browser
cache and then login again

| 5
Navigating to a Dashboard1. Left Click on the Dashboards section
| 6
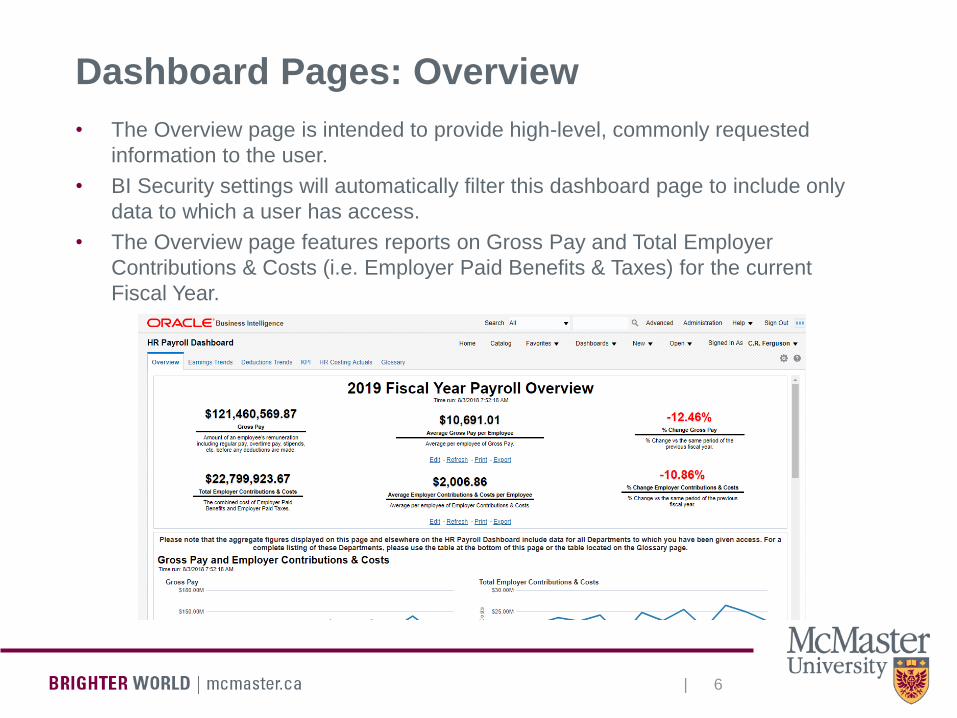
Dashboard Pages: Overview
• The Overview page is intended to provide high-level, commonly requested
information to the user.
• BI Security settings will automatically filter this dashboard page to include only
data to which a user has access.
• The Overview page features reports on Gross Pay and Total Employer
Contributions & Costs (i.e. Employer Paid Benefits & Taxes) for the current
Fiscal Year.
| 7
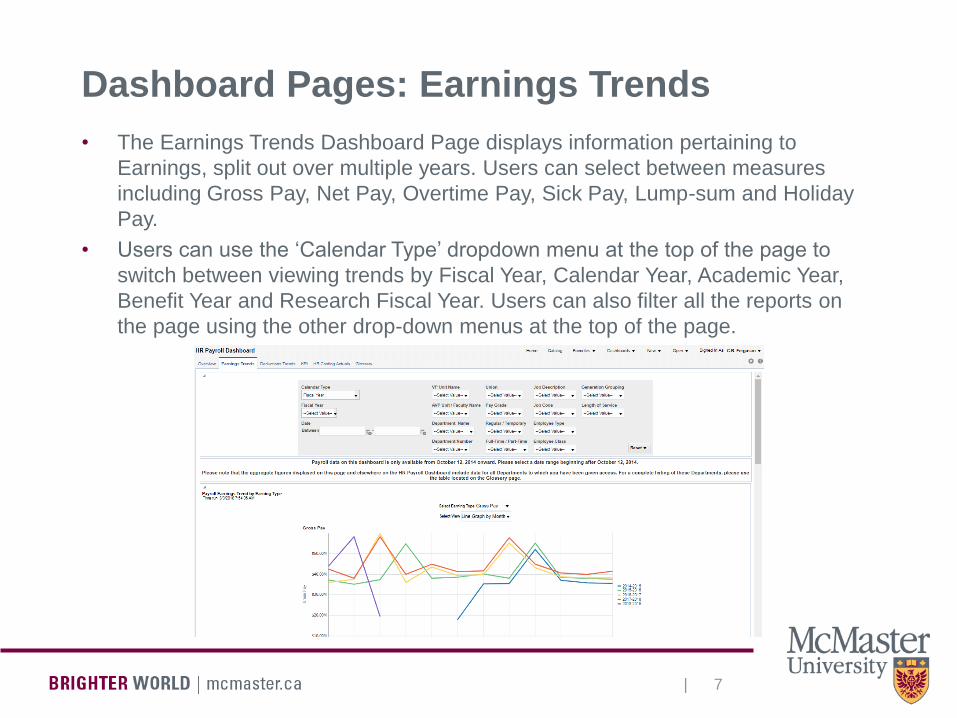
Dashboard Pages: Earnings Trends
• The Earnings Trends Dashboard Page displays information pertaining to
Earnings, split out over multiple years. Users can select between measures
including Gross Pay, Net Pay, Overtime Pay, Sick Pay, Lump-sum and Holiday
Pay.
• Users can use the ‘Calendar Type’ dropdown menu at the top of the page to
switch between viewing trends by Fiscal Year, Calendar Year, Academic Year,
Benefit Year and Research Fiscal Year. Users can also filter all the reports on
the page using the other drop-down menus at the top of the page.
| 8
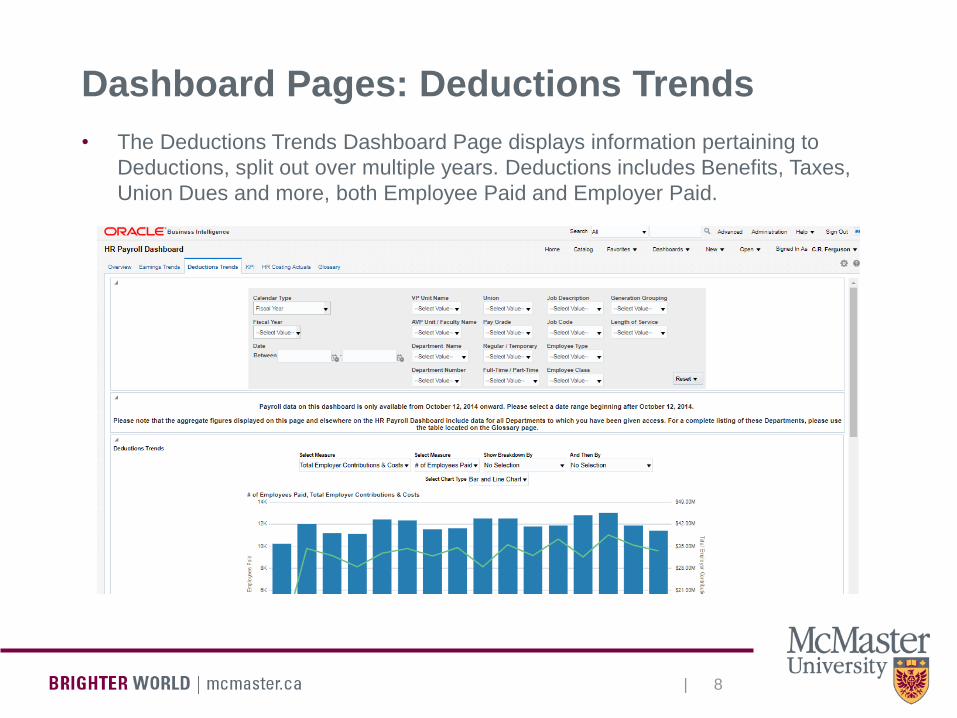
Dashboard Pages: Deductions Trends
• The Deductions Trends Dashboard Page displays information pertaining to
Deductions, split out over multiple years. Deductions includes Benefits, Taxes,
Union Dues and more, both Employee Paid and Employer Paid.
| 9
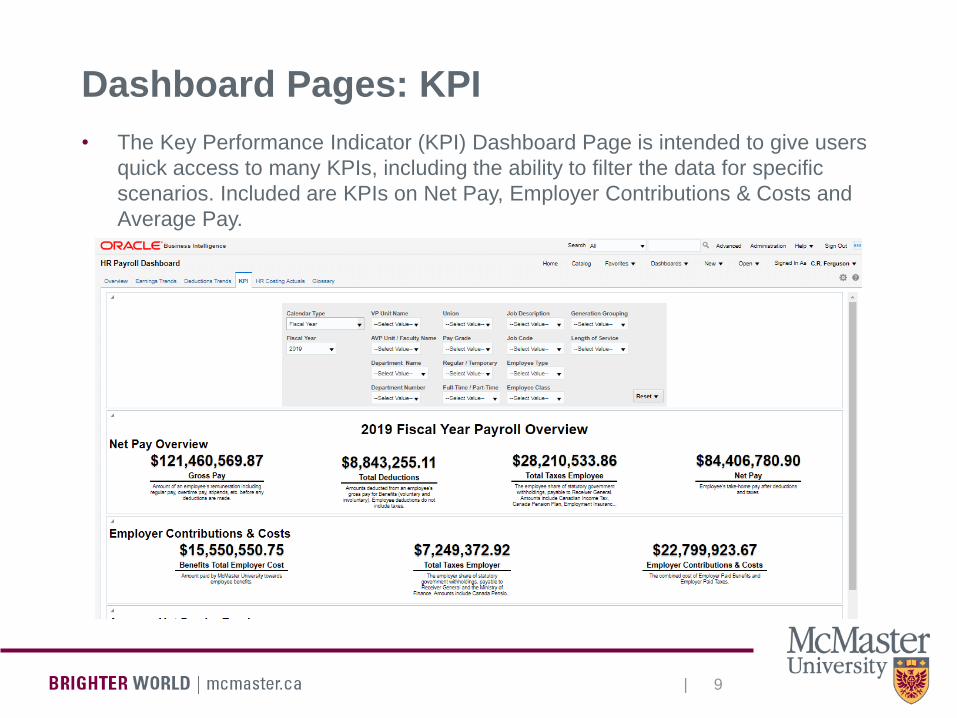
Dashboard Pages: KPI
• The Key Performance Indicator (KPI) Dashboard Page is intended to give users
quick access to many KPIs, including the ability to filter the data for specific
scenarios. Included are KPIs on Net Pay, Employer Contributions & Costs and
Average Pay.
| 10
Important Notes: Security
• Access to the Payroll BI Dashboard is based on (but not
equivalent to) existing security access in Mosaic. For the
initial release of the Payroll BI Dashboard, access has
been granted to managers and users with a need for
aggregate payroll reporting on a case-by-case basis.
• Users of the Payroll BI Dashboard will only see data
pertaining to their own department, or to departments
reporting up to the user’s department according to the
HR Department Hierarchy (the same hierarchy
governing access to data in Mosaic). When viewing
aggregated data, please be aware of which departments
are included in the figures displayed.
| 11
Important Notes: Departments
• Please note that the Departments listed in the Payroll BI
Dashboard correspond to the Department in which an
employee’s position lies. Balances in these reports do
not reflect the GL chart-field strings to which costs are
allocated. The full employee cost is allocated to the
Department in which their position lies.
• Aggregate values displayed contain data for all
departments to which the user has access. Please be
aware of which departments are included in the
aggregate values displayed. All reports can be filtered
by department, and individual charts and tables allow
users to display the breakdown by AVP Unit, Faculty, or
Department.
| 12
Important Notes: Breakdowns
• All content available on the Payroll BI Dashboards is based on Payroll data from Mosaic.
• An individual may receive multiple paycheques in one pay period.
• The available dimensions (e.g. Employee Type, Union, etc.) are tied to the pay disbursement,
not to the individual. For example, if an employee holds one part-time job and one full-time job
at the university, they will be paid separately for each.
• Please be aware of this structure when viewing any counts of the number of employees paid.
When breaking down the number of employees paid by any of the available dimensions, do not
expect the manual addition of the column to equal the total displayed, as they may not
match.
• The BI Reporting Tool is displaying a distinct count of employee numbers paid during the pay
period. If an employee was paid separate paycheques each with different attributes (e.g. one
Full-Time, one Part-Time), they will appear once in each row. The total will de-duplicate this
count and therefore not correspond to the sum of component rows above.
| 13
Earnings Definitions• Gross Pay: Amount of an employee’s remuneration including regular pay,
overtime pay, stipends, etc. before any deductions are made.
• Net Pay: Employee’s take-home pay after deductions and taxes.
• Overtime Pay: Amount of an employee’s remuneration for overtime hours
worked.
• Sick Pay: Amount of an employee’s remuneration for time off work while
sick.
• Lump-sum: Amount of an employee’s remuneration disbursed in one-time
lump-sum payments.
• Holiday Pay: Amount of an employee’s remuneration paid for Statutory
holidays, Civic holidays, and University closure days.
| 14
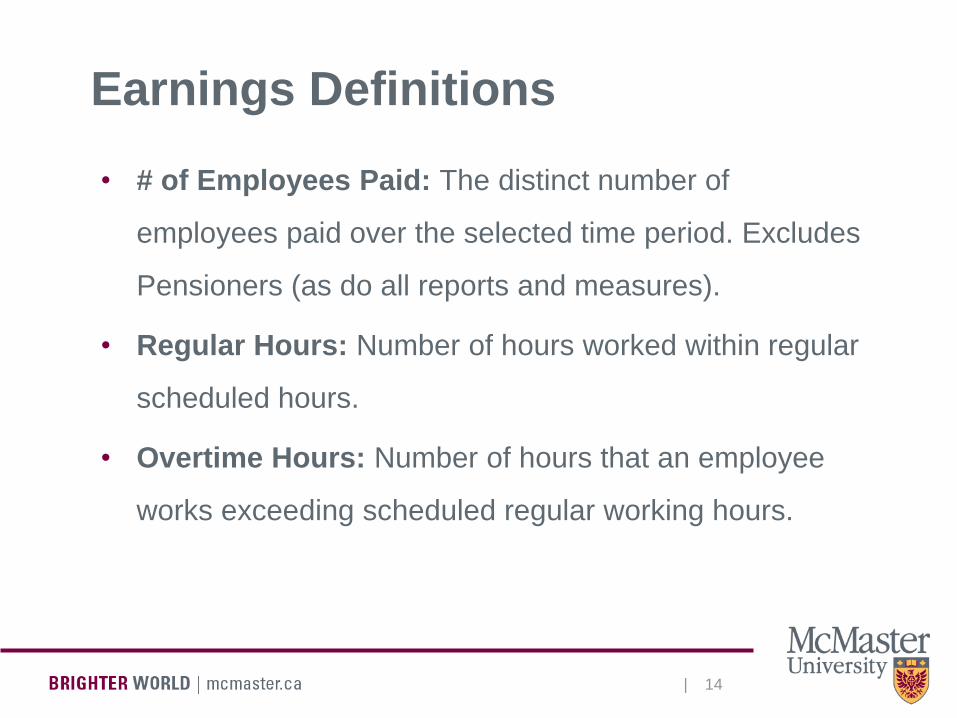
Earnings Definitions
• # of Employees Paid: The distinct number of
employees paid over the selected time period. Excludes
Pensioners (as do all reports and measures).
• Regular Hours: Number of hours worked within regular
scheduled hours.
• Overtime Hours: Number of hours that an employee
works exceeding scheduled regular working hours.
| 15
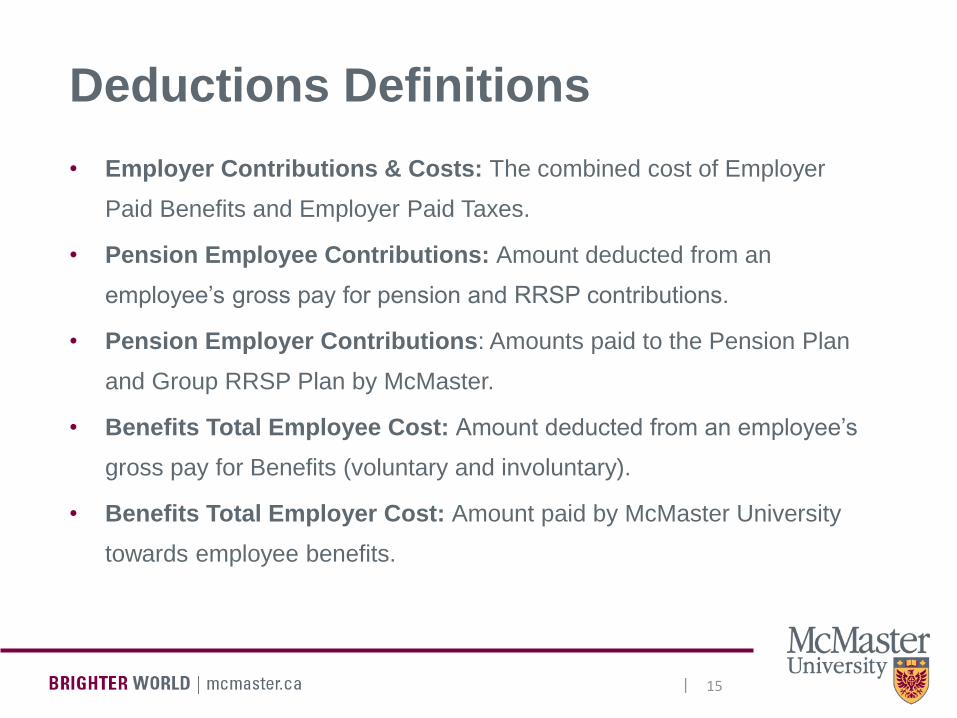
Deductions Definitions
• Employer Contributions & Costs: The combined cost of Employer
Paid Benefits and Employer Paid Taxes.
• Pension Employee Contributions: Amount deducted from an
employee’s gross pay for pension and RRSP contributions.
• Pension Employer Contributions: Amounts paid to the Pension Plan
and Group RRSP Plan by McMaster.
• Benefits Total Employee Cost: Amount deducted from an employee’s
gross pay for Benefits (voluntary and involuntary).
• Benefits Total Employer Cost: Amount paid by McMaster University
towards employee benefits.
| 16
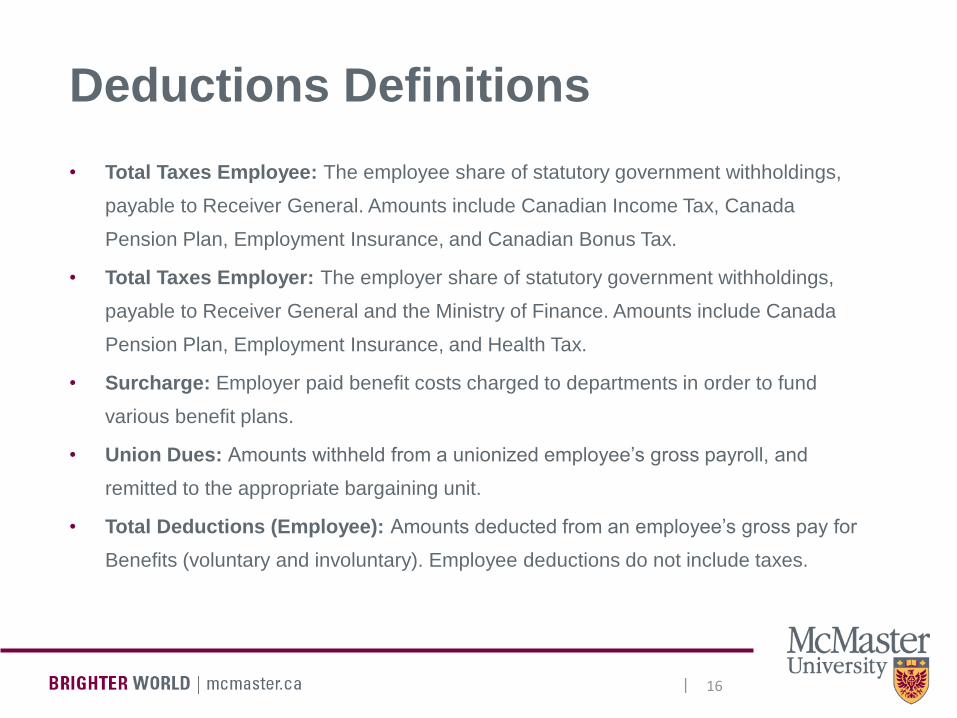
Deductions Definitions
• Total Taxes Employee: The employee share of statutory government withholdings,
payable to Receiver General. Amounts include Canadian Income Tax, Canada
Pension Plan, Employment Insurance, and Canadian Bonus Tax.
• Total Taxes Employer: The employer share of statutory government withholdings,
payable to Receiver General and the Ministry of Finance. Amounts include Canada
Pension Plan, Employment Insurance, and Health Tax.
• Surcharge: Employer paid benefit costs charged to departments in order to fund
various benefit plans.
• Union Dues: Amounts withheld from a unionized employee’s gross payroll, and
remitted to the appropriate bargaining unit.
• Total Deductions (Employee): Amounts deducted from an employee’s gross pay for
Benefits (voluntary and involuntary). Employee deductions do not include taxes.
| 17
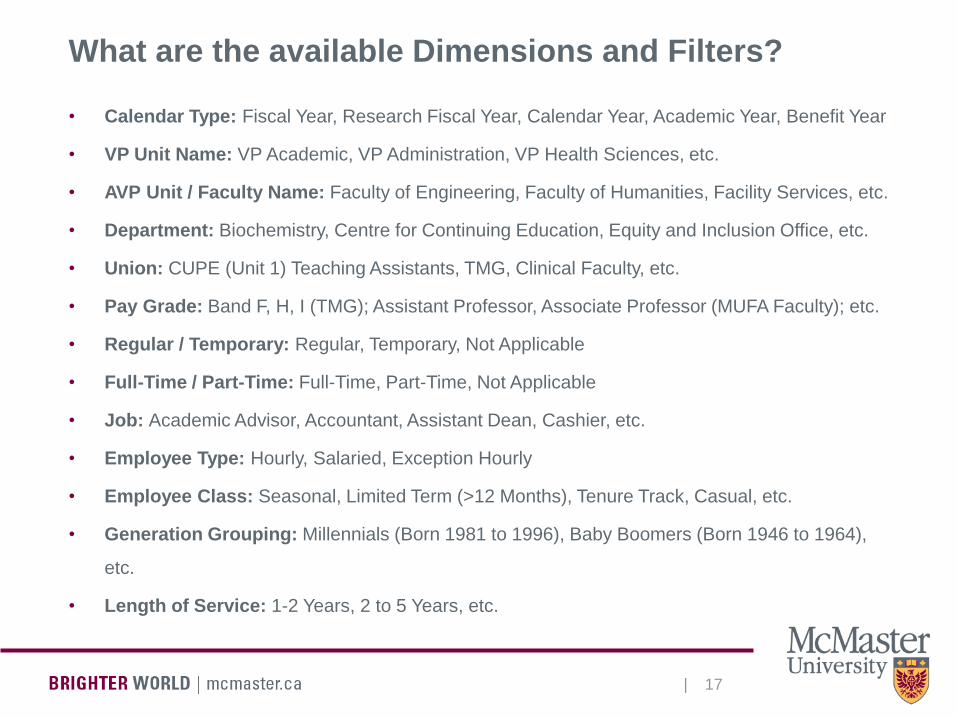
What are the available Dimensions and Filters?
• Calendar Type: Fiscal Year, Research Fiscal Year, Calendar Year, Academic Year, Benefit Year
• VP Unit Name: VP Academic, VP Administration, VP Health Sciences, etc.
• AVP Unit / Faculty Name: Faculty of Engineering, Faculty of Humanities, Facility Services, etc.
• Department: Biochemistry, Centre for Continuing Education, Equity and Inclusion Office, etc.
• Union: CUPE (Unit 1) Teaching Assistants, TMG, Clinical Faculty, etc.
• Pay Grade: Band F, H, I (TMG); Assistant Professor, Associate Professor (MUFA Faculty); etc.
• Regular / Temporary: Regular, Temporary, Not Applicable
• Full-Time / Part-Time: Full-Time, Part-Time, Not Applicable
• Job: Academic Advisor, Accountant, Assistant Dean, Cashier, etc.
• Employee Type: Hourly, Salaried, Exception Hourly
• Employee Class: Seasonal, Limited Term (>12 Months), Tenure Track, Casual, etc.
• Generation Grouping: Millennials (Born 1981 to 1996), Baby Boomers (Born 1946 to 1964),
etc.
• Length of Service: 1-2 Years, 2 to 5 Years, etc.
| 18
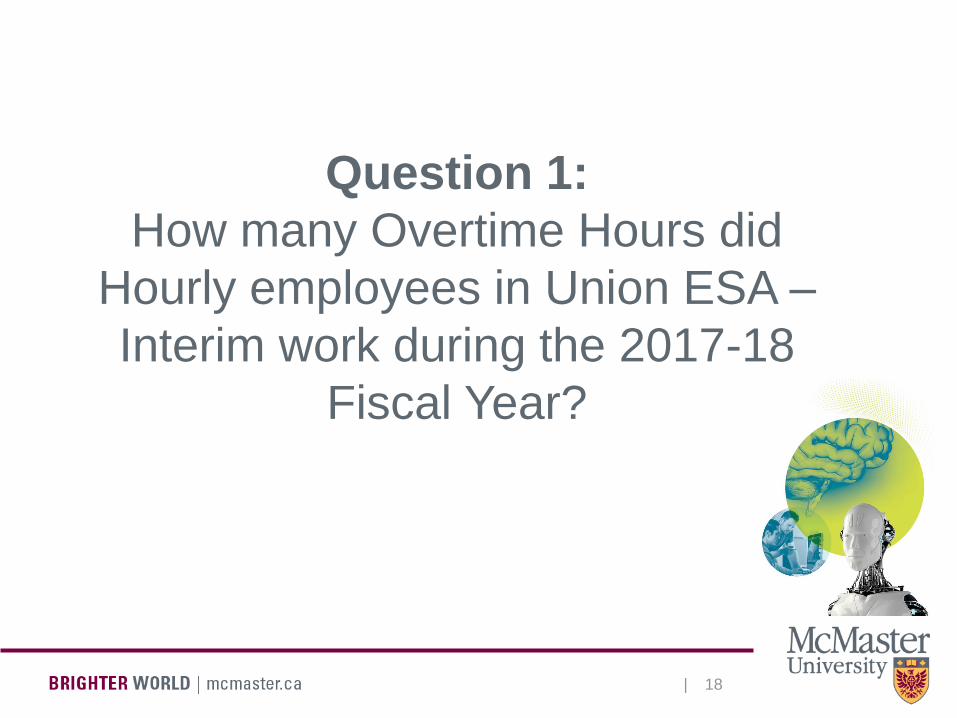
Question 1:
How many Overtime Hours did
Hourly employees in Union ESA –
Interim work during the 2017-18
Fiscal Year?
| 19
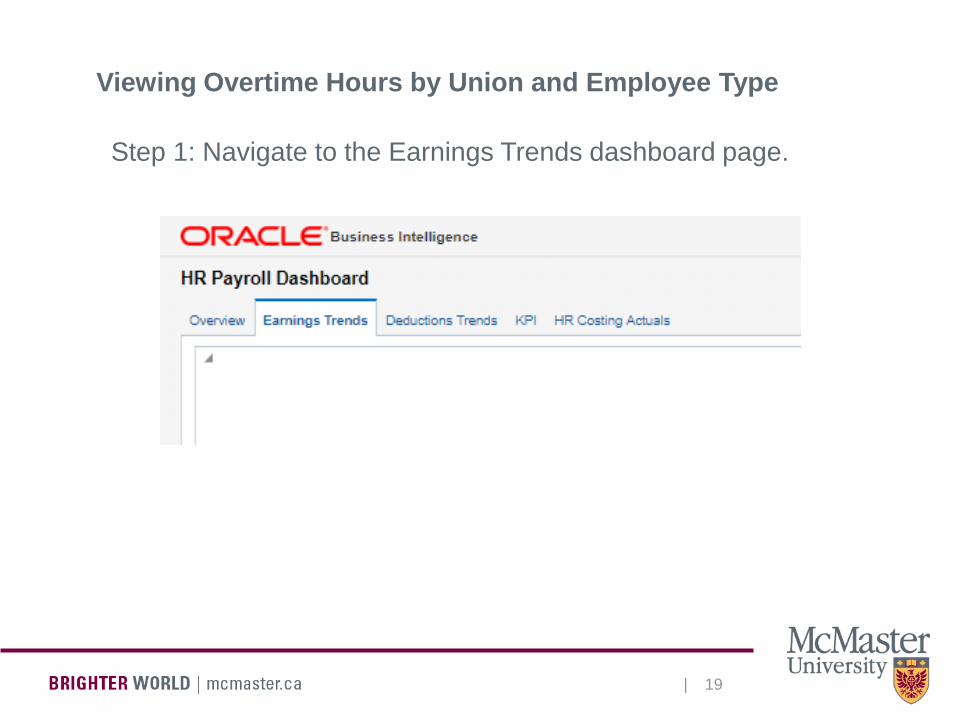
Viewing Overtime Hours by Union and Employee Type
Step 1: Navigate to the Earnings Trends dashboard page.
| 20
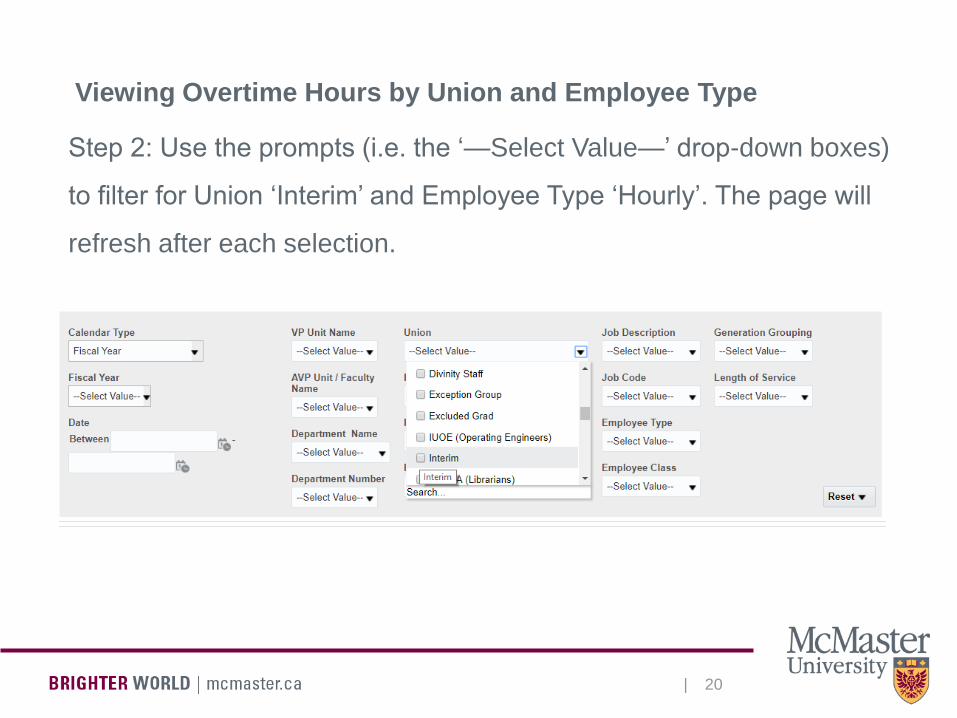
Viewing Overtime Hours by Union and Employee Type
Step 2: Use the prompts (i.e. the ‘—Select Value—’ drop-down boxes)
to filter for Union ‘Interim’ and Employee Type ‘Hourly’. The page will
refresh after each selection.
| 21
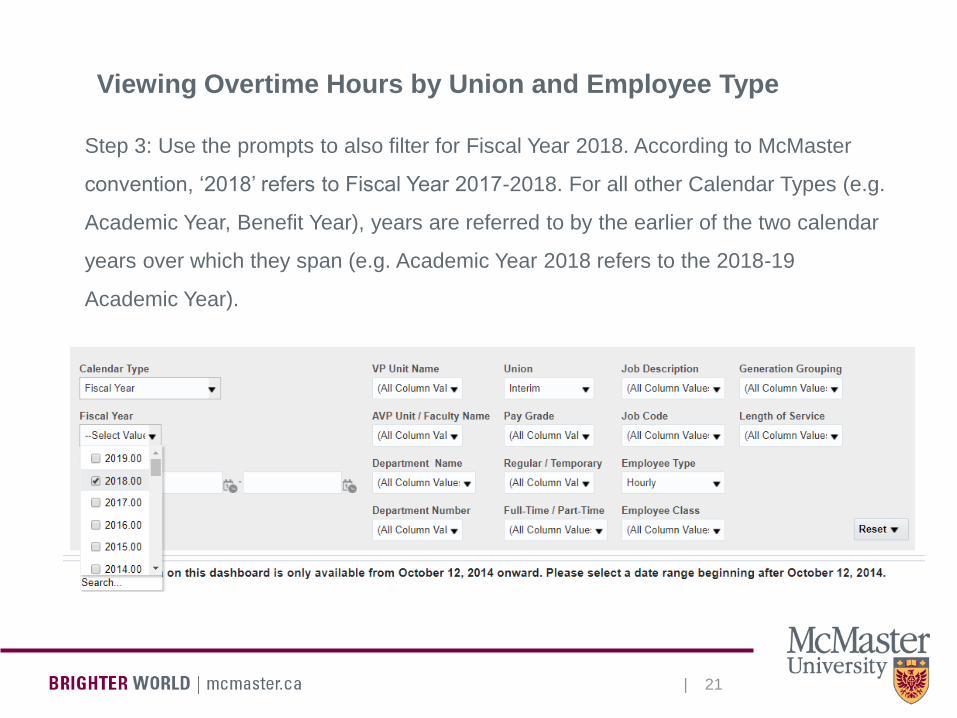
Viewing Overtime Hours by Union and Employee Type
Step 3: Use the prompts to also filter for Fiscal Year 2018. According to McMaster
convention, ‘2018’ refers to Fiscal Year 2017-2018. For all other Calendar Types (e.g.
Academic Year, Benefit Year), years are referred to by the earlier of the two calendar
years over which they span (e.g. Academic Year 2018 refers to the 2018-19
Academic Year).
| 22
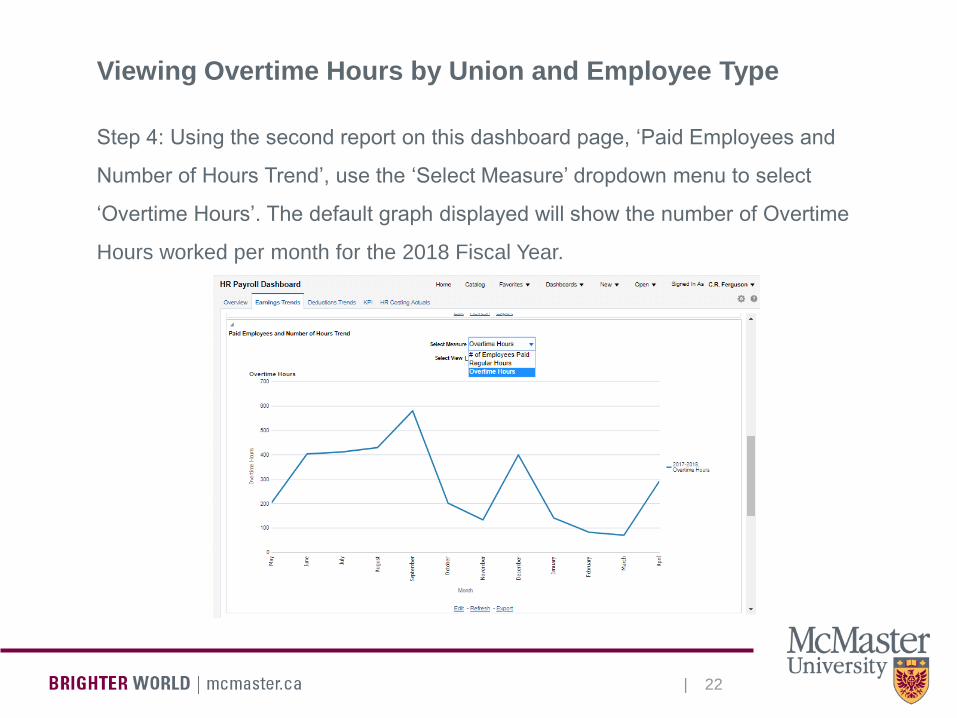
Viewing Overtime Hours by Union and Employee Type
Step 4: Using the second report on this dashboard page, ‘Paid Employees and
Number of Hours Trend’, use the ‘Select Measure’ dropdown menu to select
‘Overtime Hours’. The default graph displayed will show the number of Overtime
Hours worked per month for the 2018 Fiscal Year.
| 23
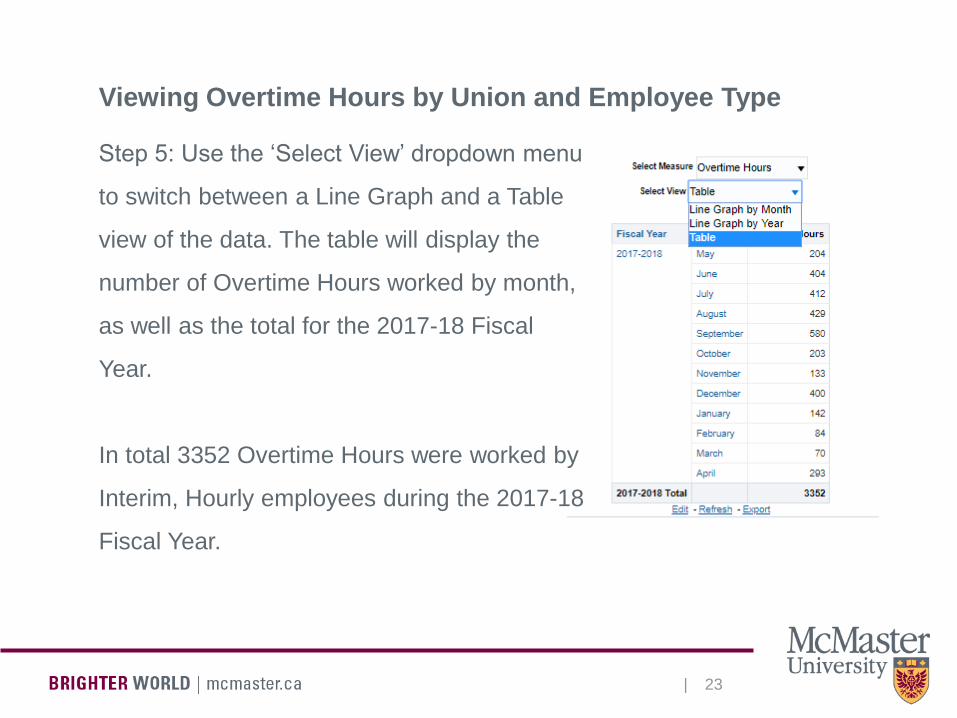
Viewing Overtime Hours by Union and Employee Type
Step 5: Use the ‘Select View’ dropdown menu
to switch between a Line Graph and a Table
view of the data. The table will display the
number of Overtime Hours worked by month,
as well as the total for the 2017-18 Fiscal
Year.
In total 3352 Overtime Hours were worked by
Interim, Hourly employees during the 2017-18
Fiscal Year.
| 24
Question 2:
What was the Total Employer
Contributions & Costs (Benefits & Taxes)
to TMG employees in Salary Band H, I
and J in Benefit Year 2014-2015?
| 25
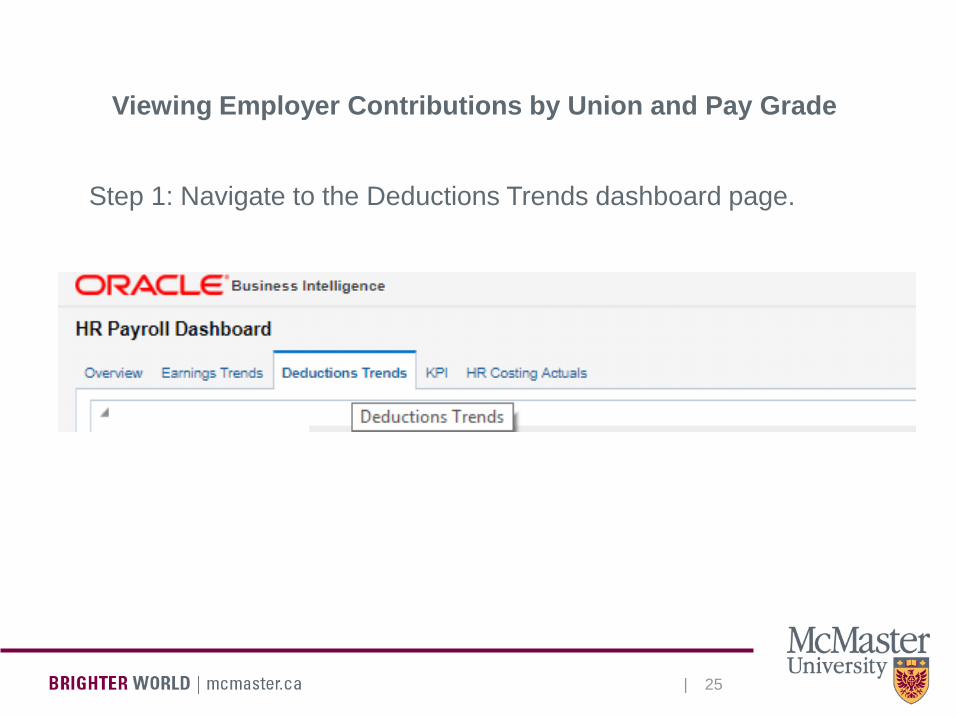
Viewing Employer Contributions by Union and Pay Grade
Step 1: Navigate to the Deductions Trends dashboard page.

| 26
Viewing Employer Contributions by Union and Pay Grade
Step 2: Use the Calendar Type dropdown menu to select ‘Benefit Year’. Then, use the ‘Benefit Year’
dropdown menu below the Calendar Type to select ‘2015’. According to McMaster convention,
‘2015’ corresponds to Benefit Year 2014-2015.
| 27
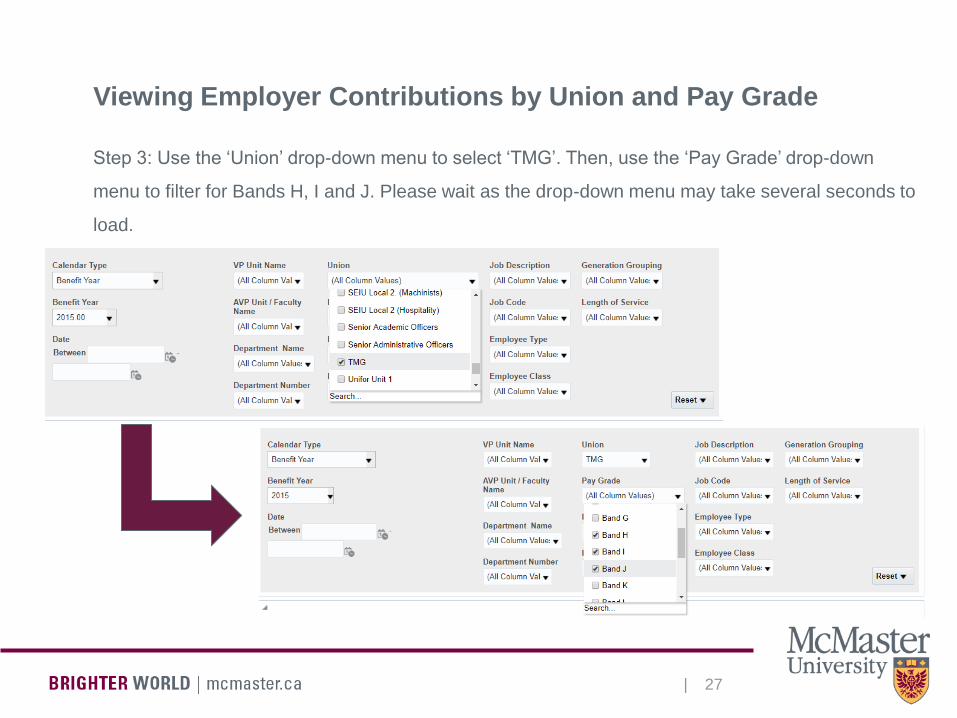
Step 3: Use the ‘Union’ drop-down menu to select ‘TMG’. Then, use the ‘Pay Grade’ drop-down
menu to filter for Bands H, I and J. Please wait as the drop-down menu may take several seconds to
load.
Viewing Employer Contributions by Union and Pay Grade
| 28
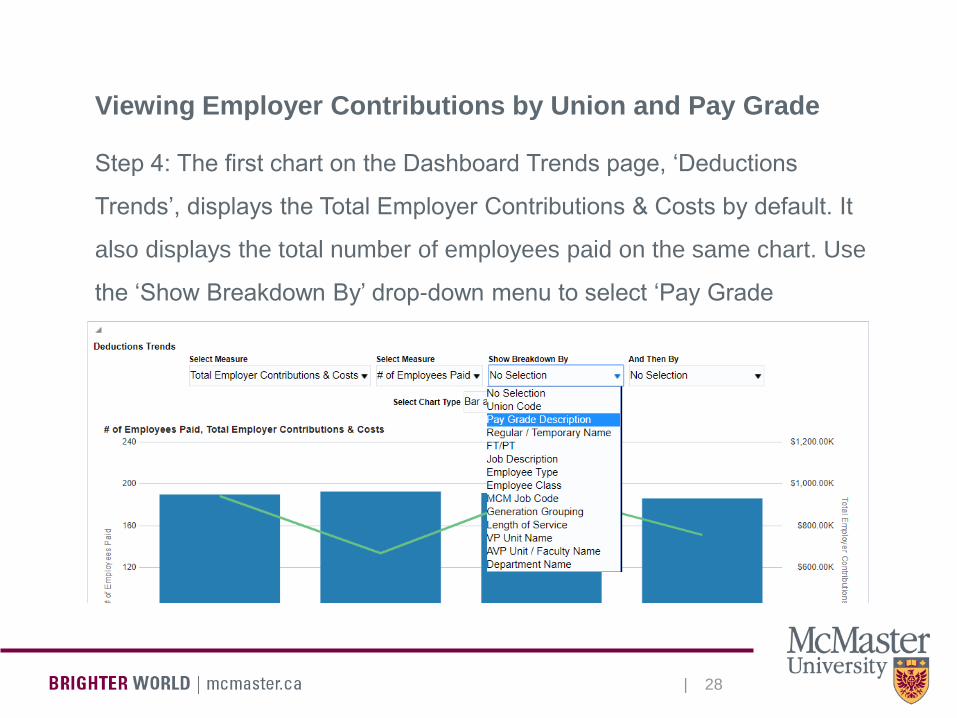
Viewing Employer Contributions by Union and Pay Grade
Step 4: The first chart on the Dashboard Trends page, ‘Deductions
Trends’, displays the Total Employer Contributions & Costs by default. It
also displays the total number of employees paid on the same chart. Use
the ‘Show Breakdown By’ drop-down menu to select ‘Pay Grade
Description’.
| 29
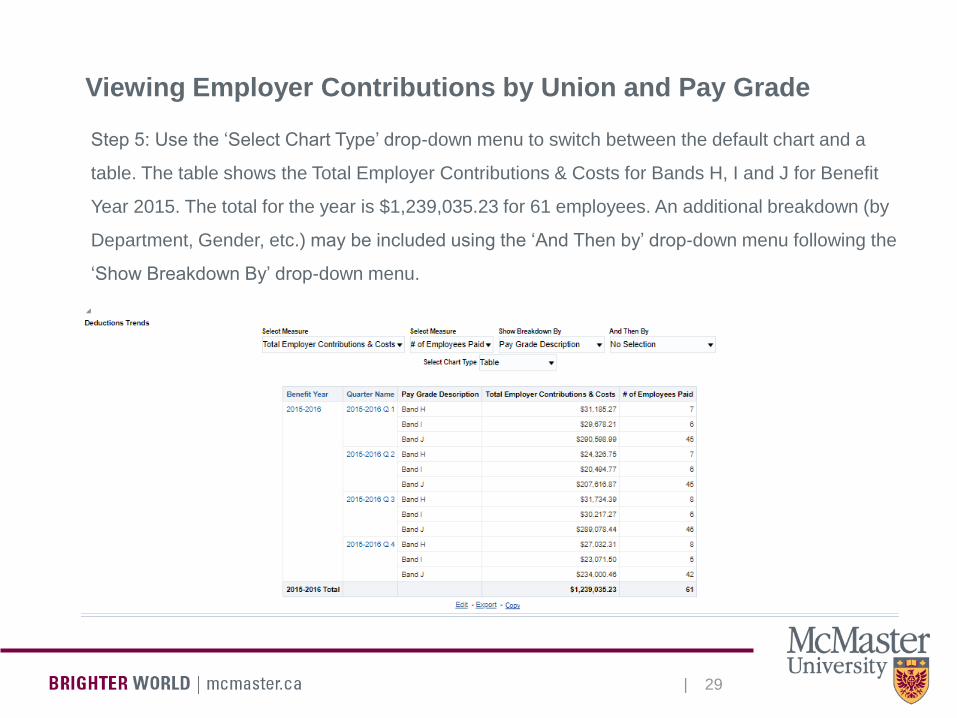
Viewing Employer Contributions by Union and Pay Grade
Step 5: Use the ‘Select Chart Type’ drop-down menu to switch between the default chart and a
table. The table shows the Total Employer Contributions & Costs for Bands H, I and J for Benefit
Year 2015. The total for the year is $1,239,035.23 for 61 employees. An additional breakdown (by
Department, Gender, etc.) may be included using the ‘And Then by’ drop-down menu following the
‘Show Breakdown By’ drop-down menu.
| 30
Question 3:
What is my department’s Fiscal Year-to-Date
Gross Pay? What is the average Gross Pay
per Employee?
| 31
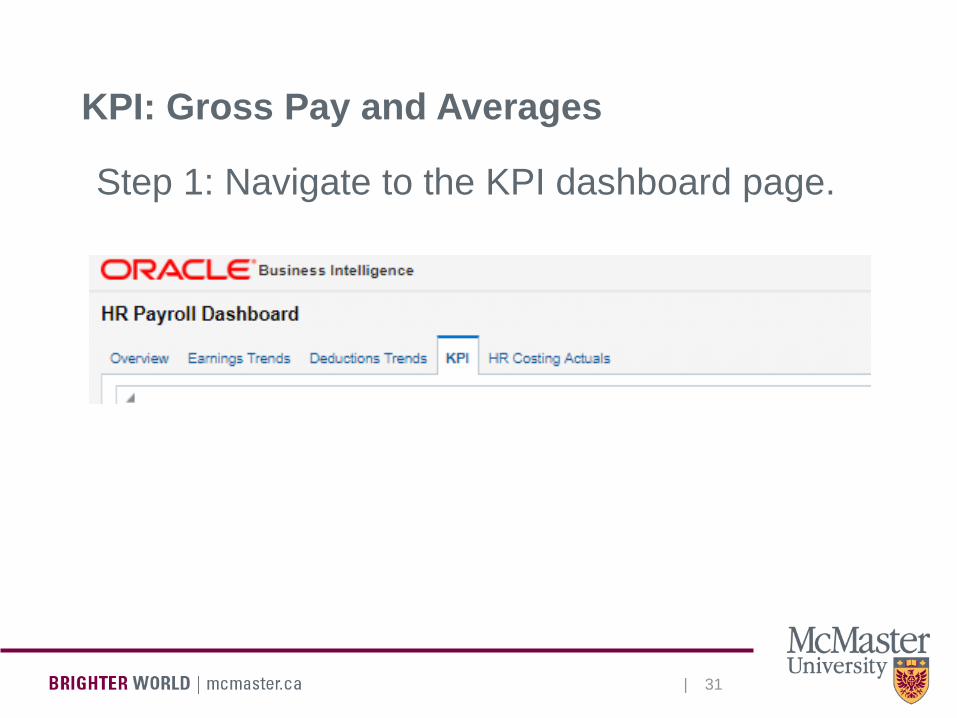
KPI: Gross Pay and Averages
Step 1: Navigate to the KPI dashboard page.
| 32
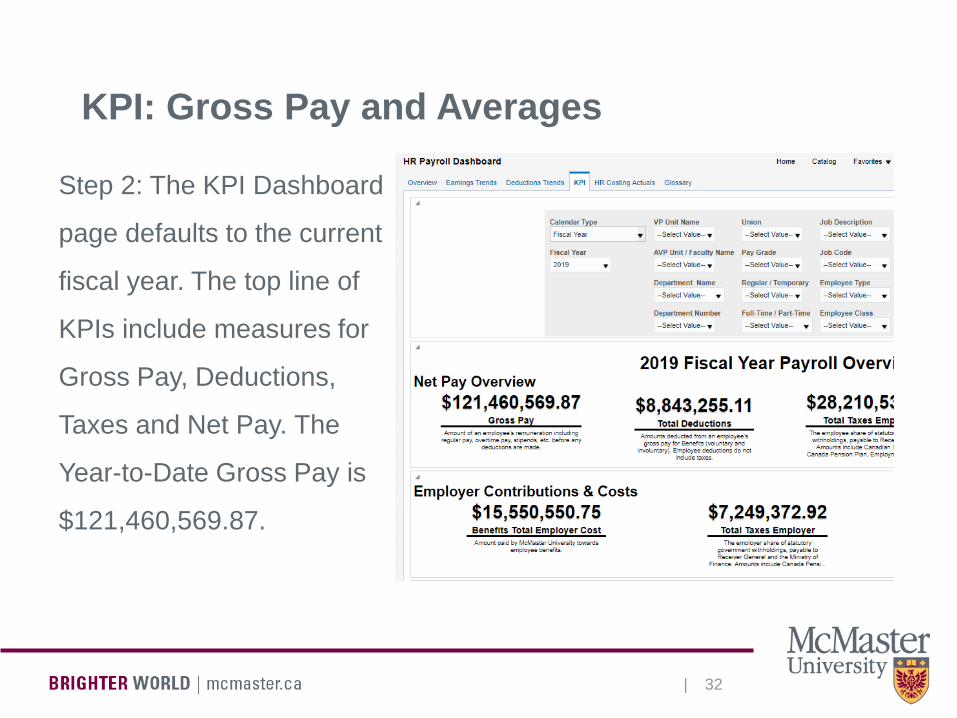
KPI: Gross Pay and Averages
Step 2: The KPI Dashboard
page defaults to the current
fiscal year. The top line of
KPIs include measures for
Gross Pay, Deductions,
Taxes and Net Pay. The
Year-to-Date Gross Pay is
$121,460,569.87.
| 33
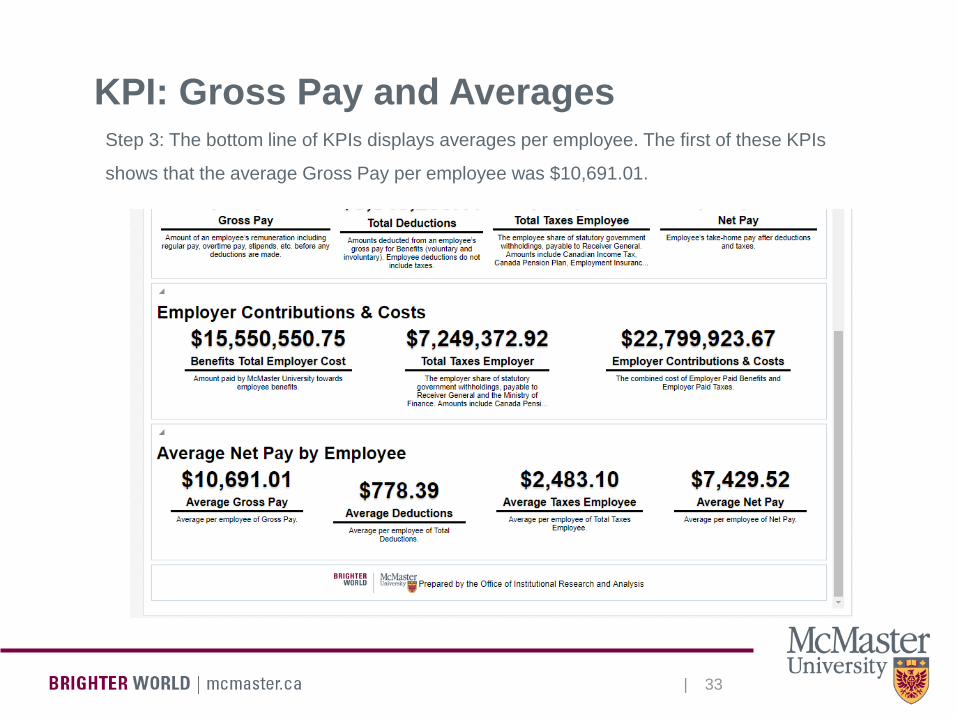
KPI: Gross Pay and AveragesStep 3: The bottom line of KPIs displays averages per employee. The first of these KPIs
shows that the average Gross Pay per employee was $10,691.01.
| 34
Question 4:
There is a spike in Gross Pay in December 2017. What is the cause of this increase?
| 35
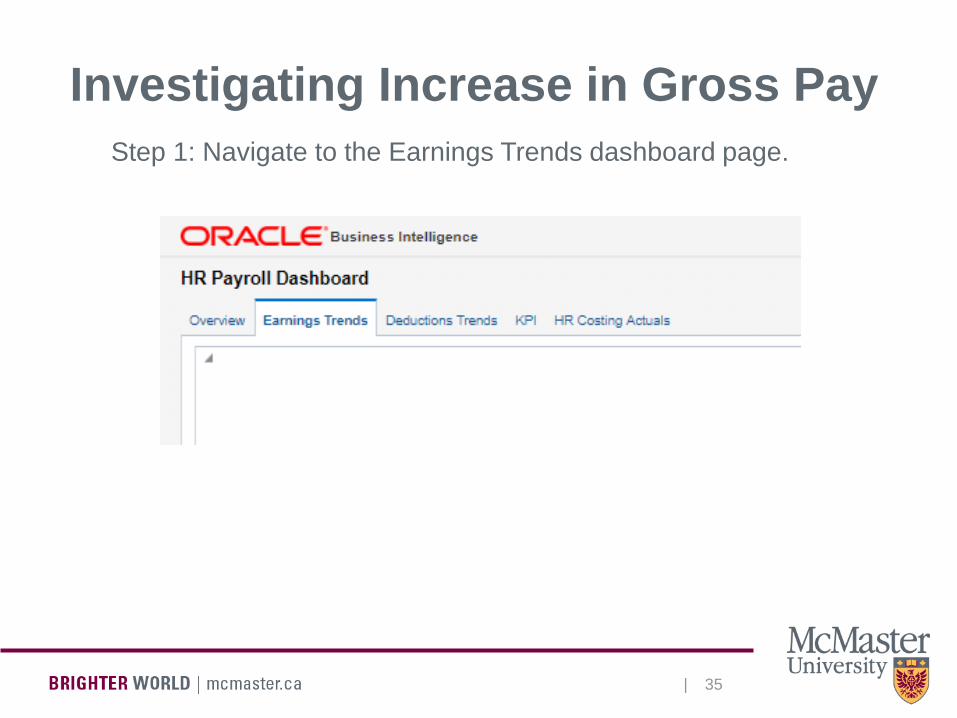
Investigating Increase in Gross Pay
Step 1: Navigate to the Earnings Trends dashboard page.
| 36
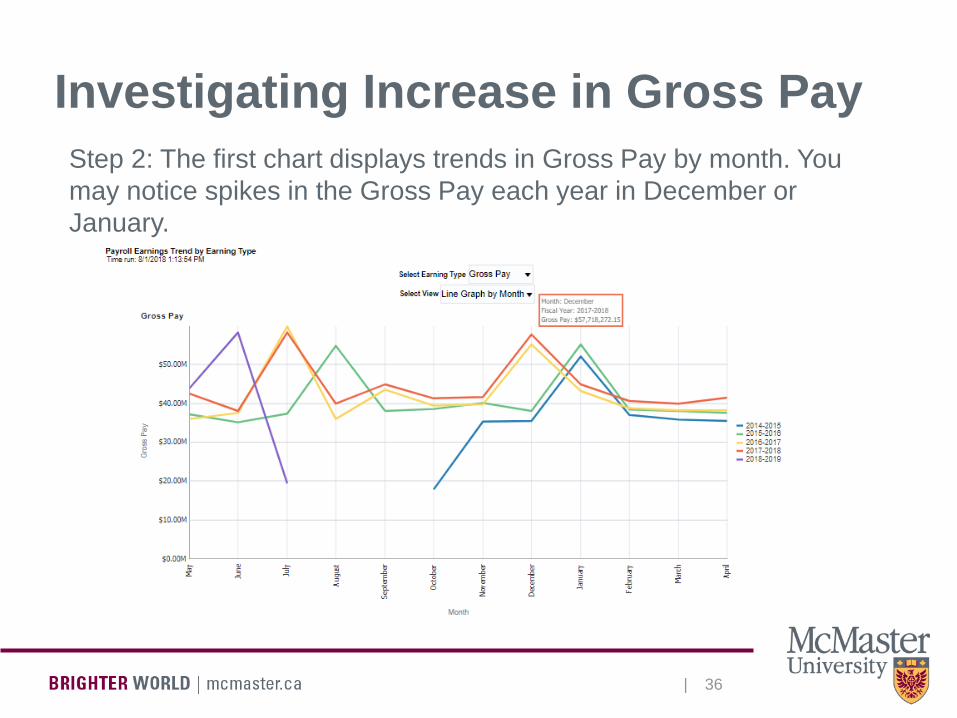
Investigating Increase in Gross Pay
Step 2: The first chart displays trends in Gross Pay by month. You
may notice spikes in the Gross Pay each year in December or
January.

| 37
Investigating Increase in Gross Pay
Step 3: Use the ‘Select View’ drop-down menu to select ‘Table’, then click
the ‘Month’ column header to drill-down to ‘Month Name’, then click
‘Month Name’ to drill-down to ‘Date’ in order to view individual pay period
end dates.
| 38
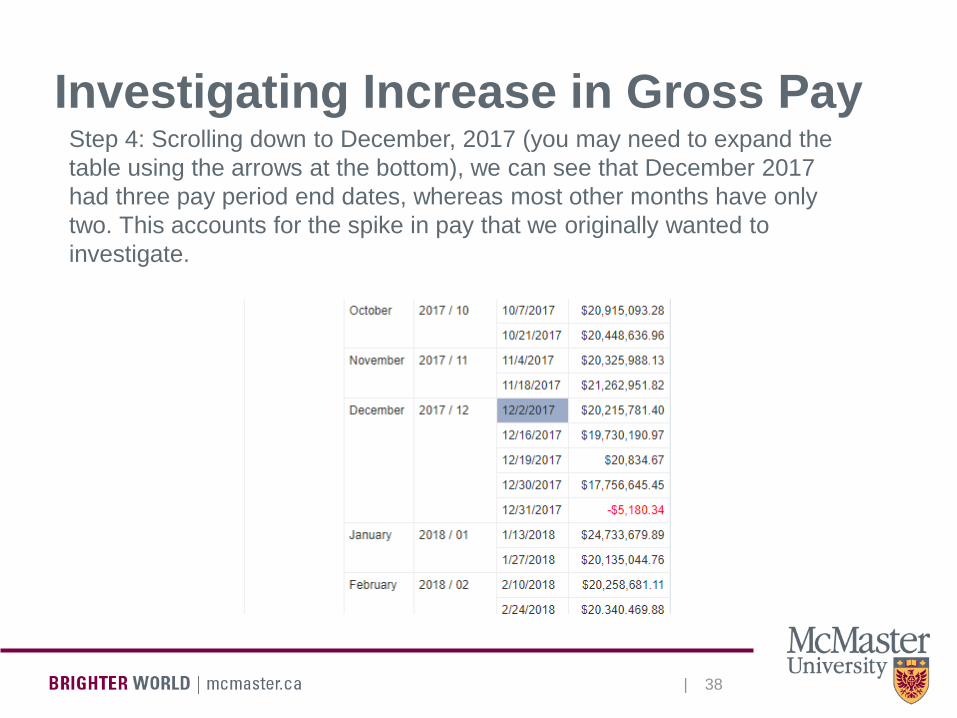
Investigating Increase in Gross PayStep 4: Scrolling down to December, 2017 (you may need to expand the
table using the arrows at the bottom), we can see that December 2017
had three pay period end dates, whereas most other months have only
two. This accounts for the spike in pay that we originally wanted to
investigate.

|
Contact Information
If you have any questions contact:
IRA Helpdesk
Chris Ferguson
Vanessa Kientega