Embed Size (px)
Citation preview
Human Visual System
• In many image processing applications, the objective is to help a human observer perceive the visual information in an image. Therefore, it is important to understand the human visual system.
• The human visual system consists mainly of the eye (image
sensor or camera), optic nerve (transmission path), and brain (image information processing unit or computer).
• It is one of the most sophisticated image processing and
analysis systems. • Its understanding would also help in the design of efficient,
accurate and effective computer/machine vision systems.
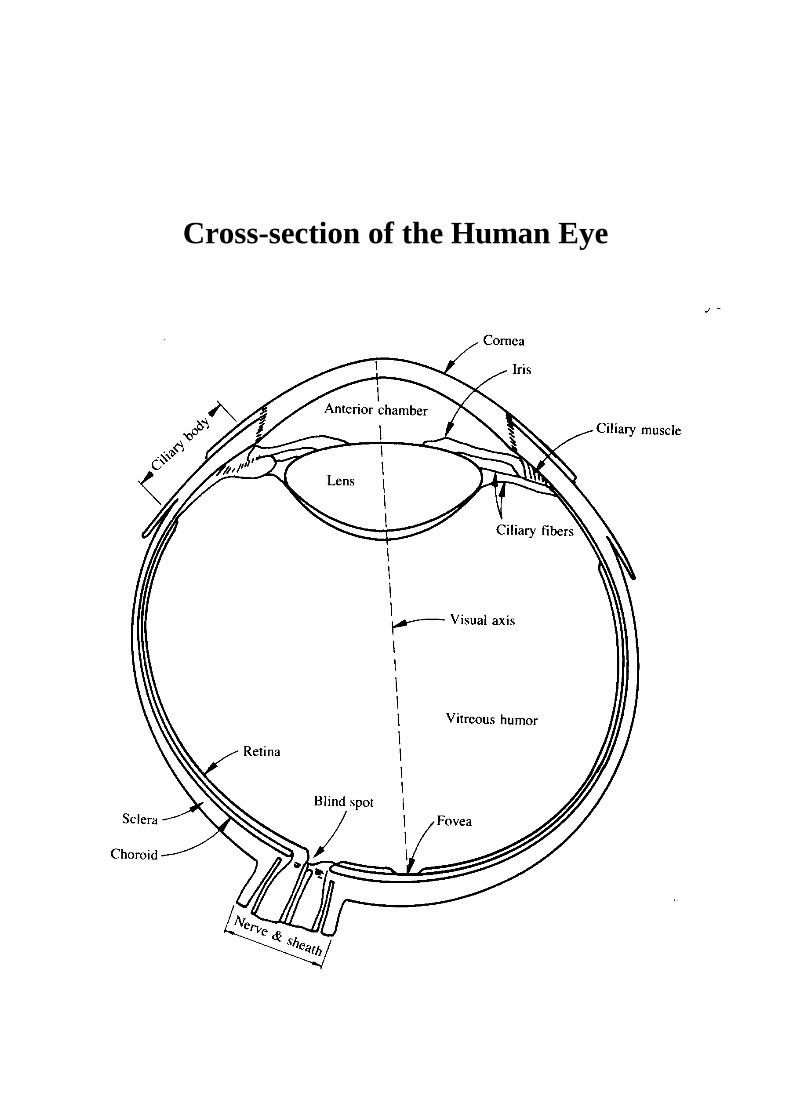
Cross-section of the Human Eye
Cross-section of the Human Eye • Nearly spherical with a diameter of 20 mm (approx.). • Cornea --- Outer tough transparent membrane, covers
anterior surface. • Sclera --- Outer tough opaque membrane, covers rest of the
optic globe. • Choroid --- Contains blood vessels, provides nutrition. • I r is --- Anterior portion of choroid, pigmented, gives color to
the eye. • Pupil --- Central opening of the Iris, controls the amount of
light entering the eye (diameter varies from 2-8 mm). • Lens --- Made of concentric layers of fibrous cells, contains
60-70% water. • Retina --- Innermost layer, “screen” on which image is
formed by the lens when properly focussed, contains photoreceptors (cells sensitive to light).

Retinal Photoreceptors
• Two types of photoreceptors: rods and cones (light sensors). • Cones --- 6-7 million, located in central portion of retina
(fovea), responsible for photopic vision (bright-light vision) and color perception, can resolve fine details.
• Rods --- 75-150 million, distributed over the entire retina,
responsible for scotopic vision (dim-light vision), not color sensitive, gives general overall picture (not details).
• Fovea --- Circular indentation in center of retina, about
1.5mm diameter, dense with cones. • Photoreceptors around fovea responsible for spatial vision
(still images). • Photoreceptors around the periphery responsible for detecting
motion. • Blind spot --- Point on retina where optic nerve emerges,
devoid of photoreceptors.

Distr ibution of Rods and Cones on Retina

Visual Axis
Visual Angle A
Image Distance l
Object height S
InvertedProjection P
Distance from Object d
Simple model for image formation
• Distance between center of lens and retina varies from 14-17mm.
• Farther the object, smaller the refractive power of lens, larger
the focal length. • From the geometry,
�53.8tan
mm55.2100
1517
1 =��
����=
===
−
d
SA
d
SlP
Brightness Adaptation
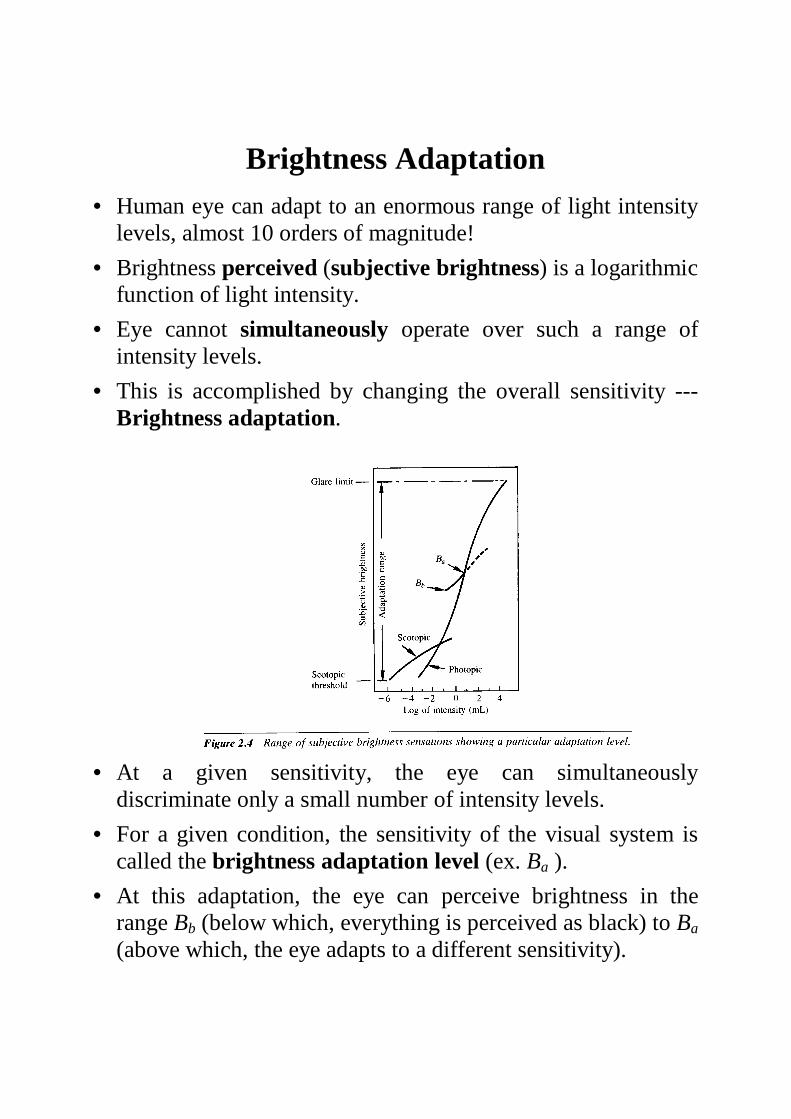
• Human eye can adapt to an enormous range of light intensity levels, almost 10 orders of magnitude!
• Brightness perceived (subjective br ightness) is a logarithmic function of light intensity.
• Eye cannot simultaneously operate over such a range of intensity levels.
• This is accomplished by changing the overall sensitivity --- Brightness adaptation.
• At a given sensitivity, the eye can simultaneously discriminate only a small number of intensity levels.
• For a given condition, the sensitivity of the visual system is called the br ightness adaptation level (ex. Ba ).
• At this adaptation, the eye can perceive brightness in the range Bb (below which, everything is perceived as black) to Ba
(above which, the eye adapts to a different sensitivity).
Brightness Discr imination
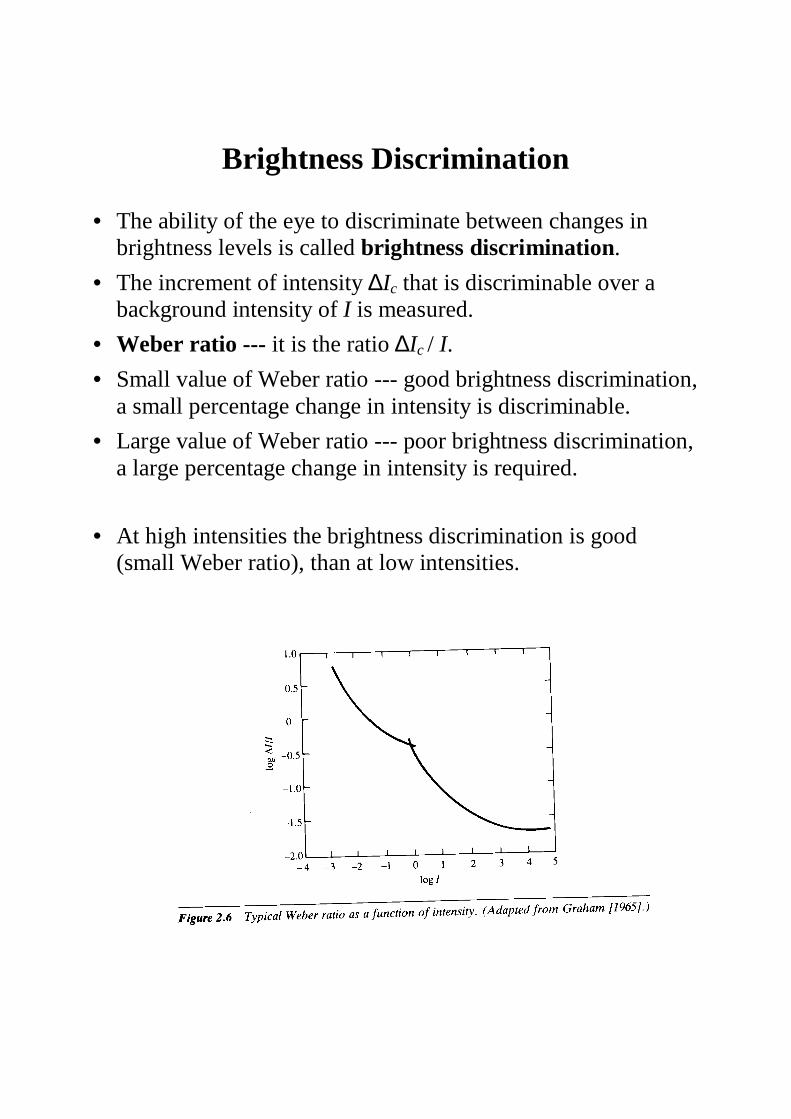
• The ability of the eye to discriminate between changes in brightness levels is called br ightness discr imination.
• The increment of intensity ∆Ic that is discriminable over a background intensity of I is measured.
• Weber ratio --- it is the ratio ∆Ic / I.
• Small value of Weber ratio --- good brightness discrimination, a small percentage change in intensity is discriminable.
• Large value of Weber ratio --- poor brightness discrimination, a large percentage change in intensity is required.
• At high intensities the brightness discrimination is good (small Weber ratio), than at low intensities.

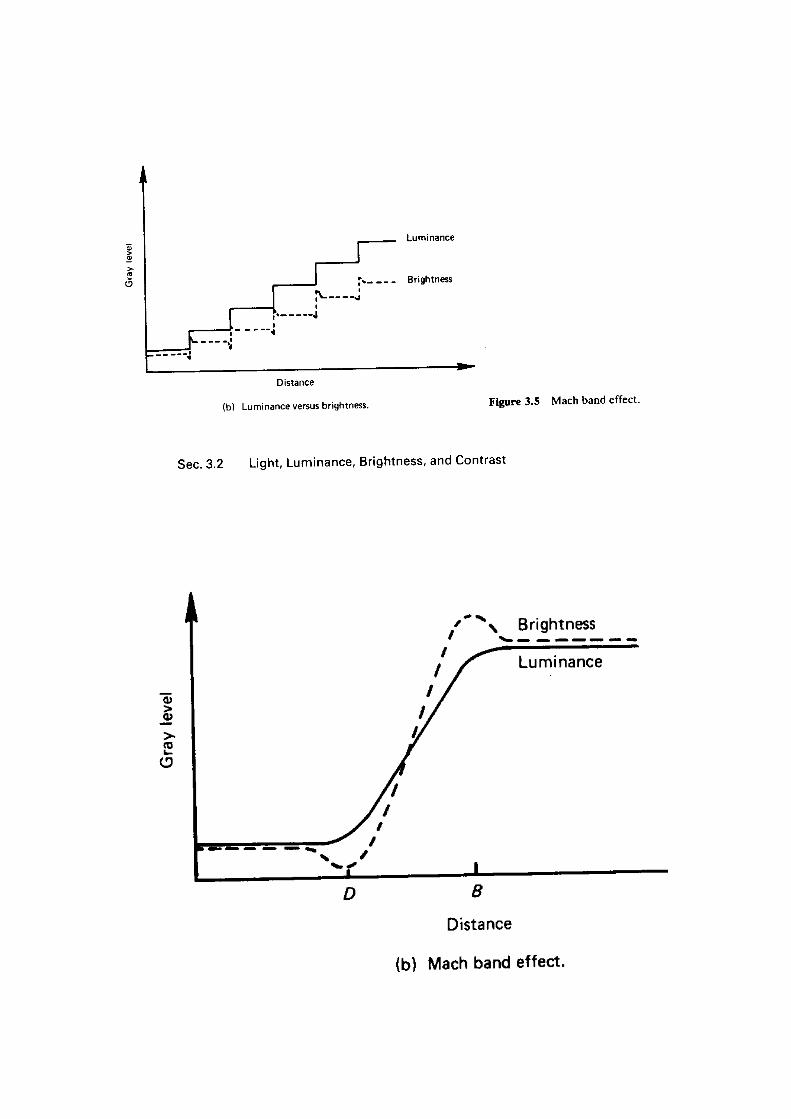
Perceived Br ightness is not a Simple Function of L ight Intensity
Simultaneous Contrast
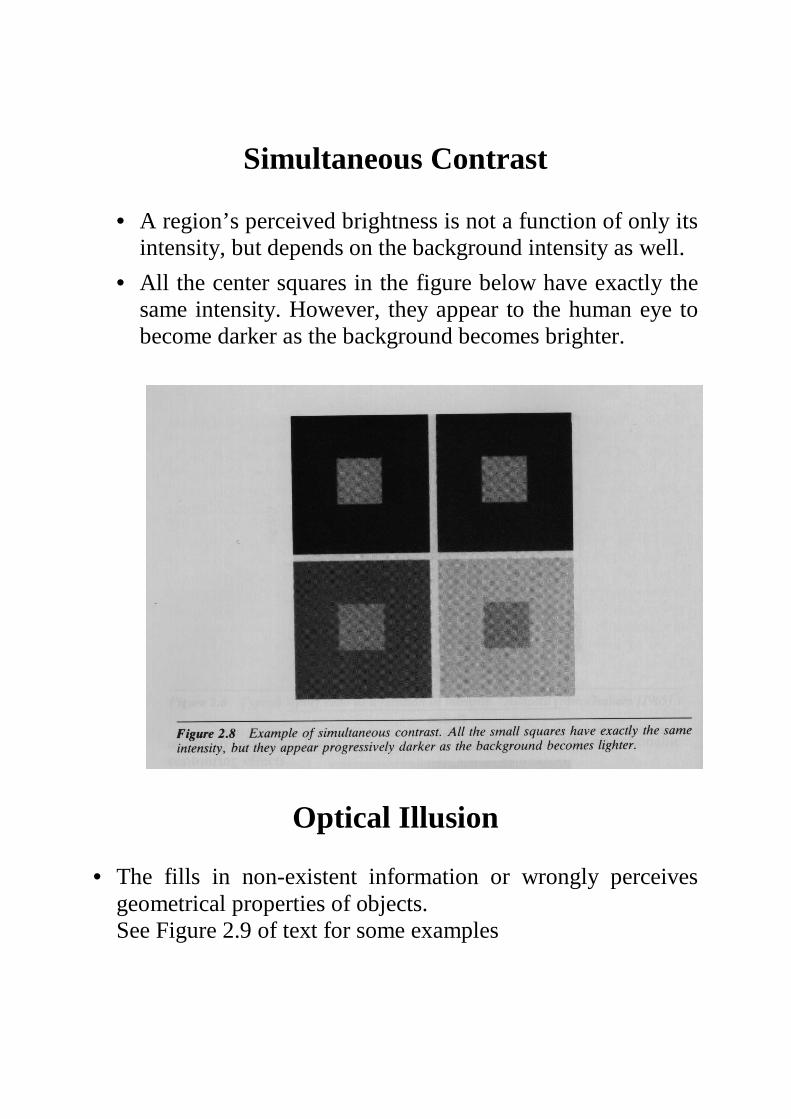
• A region’s perceived brightness is not a function of only its intensity, but depends on the background intensity as well.
• All the center squares in the figure below have exactly the same intensity. However, they appear to the human eye to become darker as the background becomes brighter.
Optical I llusion • The fills in non-existent information or wrongly perceives
geometrical properties of objects. See Figure 2.9 of text for some examples

Light and EM Spectrum
• Electromagnetic (EM) waves or radiation can be visualized as propogating sinusoidal waves with some wavelength λ or equivalently a frequency ν where c=λν , c being the velocity of light.
• Equivalently, they can be considered as a stream of (massless) particles (or photons), each having an energy E proportional to its frequency ν; ν= hE , where h is Planck’s constant.
• EM spectrum ranges from high energy radiations like gamma-rays and X-rays to low energy radiations like radio waves.
• Light is a form of EM radiation that can be sensed or detected by the human eye. It has a wavelength between 0.43 to 0.79 micron.
• Different regions of the visible light spectrum corresponds to different colors.
• Light that is relatively balanced in all visible wavelengths appears white (i.e. is devoid of any color). This is usually referred to as achromatic or monochromatic light.
• The only attribute of such light is its intensity or amount. It is denoted by a grayvalue or gray level. White corresponds to the highest gray level and black to the lowest gray level.
• Three attributes are commonly used to describe a chromatic light source:
o Radiance is the total amount of energy (in unit time) that flows from the source and it is measure in Watt (W).
o Luminance is a measure of the amount of light energy that is received by an observer. It is measured in lumens (lm).
o Brightness is a subjective descriptor of light measure (as perceived by a human).
• The wavelength of EM radiation used depends on the imaging application.
• In general, the wavelength of an EM wave required to “see” an object must be of the same size (or smaller) than that of the object.
• Besides EM waves, other sources of energy such as sound waves (ultra sound imaging) and electron beams (electron microscopy) are also used in imaging.
Image Sensing and Acquisition
• A typical image formation system consists of an “ illumination” source, and a sensor.
• Energy from the illumination source is either reflected or absorbed by the object or scene, which is then detected by the sensor.
• Depending on the type of radiation used, a photo-converter (e.g., a phosphor screen) is typically used to convert the energy into visible light.
• Sensors that provide digital image as output, the incoming energy is transformed into a voltage waveform by a sensor material that is responsive to the particular energy radiation.
• The voltage waveform is then digitized to obtain a discrete output.
• Read Sections 2.3.1-2.3.3 for some more details about sensors.
Mathematical Representation of Images
• An image is a two-dimensional signal (light intensity) and can be represented as a function f (x, y).
• The coordinates (x, y) represent the spatial location and the
value of the function f (x, y) is the light intensity at that point.
• i(x, y) is the incident light intensity and r(x, y) is the
reflectance. • We usually refer to the point (x, y) as a pixel (from picture
element) and the value f (x, y) as the grayvalue (or graylevel) of image f at (x, y).
• Images are of two types: continuous and discrete. • A continuous image is a function of two independent
variables, that take values in a continuum. Example: The intensity of a photographic image recorded on a film is two-dimensional function f (x, y) of two real-valued variables x and y.
• A discrete image is a function of two independent variables, that take values over a discrete set (ex. an integer grid). Example: The intensity of a discretized 256 x 256 photographic image recorded on a CDROM is two-dimensional function f (m, n) of two integer-valued variables m and n taking values m, n = 0, 1, 2, …, 255.
),(),(),( yxryxiyxf =
NMNMfMfMf
Nfff
Nfff
yxf
×
����
�
�
����
�
�
−−−−
−−
≈
)1,1()1,1()0,1(
)1,1()1,1()0,1(
)1,0()1,0()0,0(
),(
�
�����
�
• Similarly, grayvalues can be either real-valued or integer-valued. Smaller grayvalues denote darker shades of gray (smaller brightness levels).
Sampling
• For computer processing, a continuous-image must be spatially discretized. This process is called sampling.
• A continuous image f (x, y) is approximated by equally spaced
samples arranged in a M x N array:
• The right-hand side is normally referred to as a discrete image. • The sampling process may be viewed as partitioning the real xy plane
with a grid whose vertices are elements in the Cartesian product Z x Z, where Z is the set of integers.
• If ∆x and ∆y are separation of grid points in the x and y directions,
respectively, we have
• The sampling process requires specification of ∆x and ∆y, or
equivalently M and N (for a given image dimensions).
.1,,1,0 and ,1,,1,0for ),,(),( −=−=∆∆= NnMmynxmfnmf

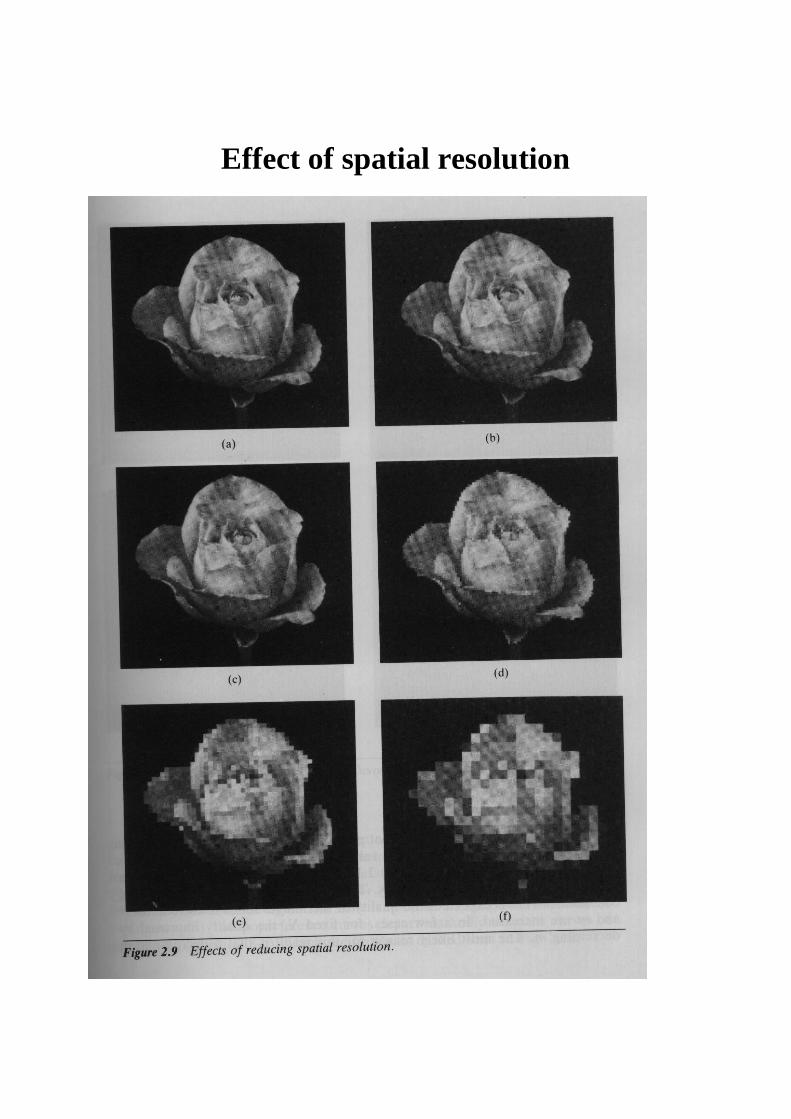
Effect of spatial resolution

Effect of spatial resolution
512 x 512
256 x 256
64 x 64
32 x 32 16 x
16
128 x 128
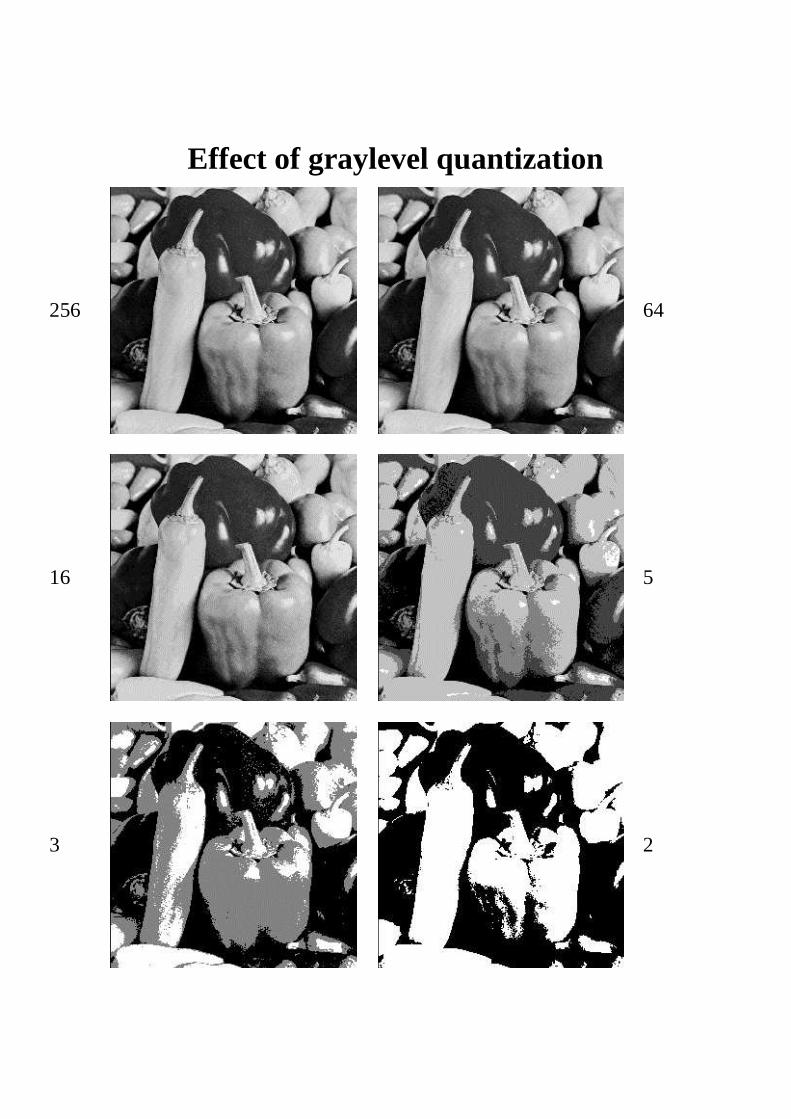
Effect of graylevel quantization
256 64
16 5
2 3