Embed Size (px)
Citation preview
1
Human Y chromosome variation in
thegenomesequencingera
Mark A Jobling1 and Chris Tyler-Smith2
1 Department of Genetics & Genome Biology, University of Leicester, UK2 Wellcome Trust Sanger Institute, Hinxton, Cambridge, UK
Correspondence can be addressed to either author:
Prof Mark A. Jobling, Department of Genetics, University of Leicester,
University Road, Leicester LE1 7RH, UK
Tel.: +44 (0)116 252 3427 Fax: +44 (0)116 252 3378
Email: [email protected]
Dr Chris Tyler-Smith, Wellcome Trust Sanger Institute, Wellcome Genome
Campus, Hinxton, Cambridge CB10 1SA, UK
Tel.: +44 (0)1223 495 376 Fax: +44 (0)1223 496802
Email: [email protected]
2
AbstractThe properties of the human Y chromosome – male-specificity, haploidy, and
escape from crossing-over - make it an unusual component of the genome,
and have led to its genetic variation becoming a key part of studies of human
evolution, population history, genealogy, forensics and male medical genetics.
Next-generation sequencing (NGS) technologies have driven recent progress
in these areas. In particular, NGS has yielded direct estimates of mutation
rates and an unbiased and calibrated molecular phylogeny of unprecedented
detail. Moreover, the availability of direct-to-consumer NGS services is fuelling
a rise of ‘citizen scientists’, whose interest in resequencing their own Y
chromosomes is generating a wealth of new data.
IntroductionMost human nuclear chromosomes are inherited from both parents; only the Y
chromosome is not. The unique role of this chromosome as a genetically
dominant sex-determining factor leads it to be constitutively haploid and
male-specific, which allows it to escape the reshuffling effects of crossing over
for most of its length. In turn, these qualities have profound influences on its
structure, mutation processes, and diversity within and between populations.
Haploidy has its strongest influence upon Y-chromosomal repeated
sequences. The Y chromosome is not constrained by the requirement of
chromosomal pairing for most of its length, which has allowed repeat
sequences to accumulate1 (Box 1). These repeat sequences in turn promote
frequent chromosomal rearrangements via intrachromosomal recombination,
leading to a high degree of structural variation2-4. Male-specificity means that
the patterns of diversity of the Y chromosome in populations reflect the
3
peculiarities of past male behaviours, including dominance of men in some
cultures, and marriage rules that influenced how men and women moved
between social groups5. There are also practical implications arising from this
male-specificity, particularly in forensic DNA analysis6 and in genetic
genealogy7. Finally, many common diseases are sexually dimorphic in their
prevalence, progress and severity8, and the Y chromosome might play some
part in this. It might also directly influence male fertility9 and affect male health
via somatic instability10.
All these insights derive from two decades of steady progress in Y-
chromosomal variant discovery and analysis, exploiting the fact that the allelic
states of variants can be combined into haplotypes because of the absence of
crossing over in the male-specific region of the Y chromosome (MSY;
sometimes known as the non-recombining region of the Y, NRY; Box 1).
However, until recently, such analyses have been affected by bias. Early
studies involved discovering variants in small samples before genotyping
them in larger samples, leading to strong biases because additional variants
present in the larger samples were not accounted for11. Some of these
problems could be alleviated by performing combined analyses of slowly-
mutating single-nucleotide polymorphisms (SNPs) and more rapidly-mutating
short-tandem repeats (STRs). SNPs define stable haplotypes, known as
haplogroups12, which can be used to build a robust phylogeny using the
principle of maximum parsimony. Deploying multiple STRs, which are
variable in all populations and therefore lack ascertainment bias, can then
reveal the level of variation within these haplogroups13, and also provide some
information about their time-depths (that is, the time since the haplogroup-
defining mutation occurred)14; older haplogroups will harbour higher STR
haplotype diversity. Although such combined Y-SNP plus Y-STR studies have
flourished, spawning the sub-discipline of male phylogeography, they have
substantial limitations. For example, in addition to the inevitably incomplete
resolution of the SNP-defined phylogeny, it has been debated whether a

4
‘genealogical’ STR mutation rate measured in families15 or a three-fold slower
‘evolutionary’ rate calibrated by historical events16 should be used;
consequently, there is a three-fold variation in deduced time estimates
depending on the approach adopted. Owing to these and other limitations,
this era of phylogeographic studies is not reviewed here.
The best way to identify variation on the Y chromosome is to sequence it.
However, with rare exceptions17-19, this approach was not used until 2010
when the availability of next-generation sequencing (NGS) platforms began to
make resequencing cost-effective20. In this Review, we discuss the
advantages and limitations of NGS in variant discovery, and the resulting
MSY phylogenies and their time calibration. We then describe recent insights
from MSY data into population and evolutionary genetic questions, including
male-mediated expansions and genealogical investigations, where the robust
NGS-based phylogenetic structures and improved calibration have revealed
major new events and changed our interpretation of others. Also covered are
the medical consequences of MSY variation, and their implications for
population genetics, where NGS is just beginning to be applied, and is starting
to identify the basis of some Y-linked disorders. We conclude with
perspectives for the future, including the potential impact of new sequencing
technologies, possible insights from ancient DNA (aDNA) data, and
challenges in understanding the functional roles of the Y chromosome.
Box 1: Evolution and genetic and physical structure of the Y
chromosome
Presence of a Y chromosome normally leads to a male phenotype via the
expression of the Y-linked gene SRY (sex-determining region, Y), whose
product acts on an enhancer of the autosomal gene SOX9 to cause formation
of Sertoli cells and thus trigger differentiation of the testis119. Although the
human sex chromosomes differ greatly in size, structure and gene content,
5
they originated from a pair of homologous autosomes. The process of their
divergence began around 180 million years ago120 when the proto-Y
chromosome acquired its dominant sex-determining function, and continued
via a series of segmental inversions that successively shut down
recombination with the X chromosome121. In the absence of genetic
exchange, the Y chromosome degenerated and lost material: it is around 60
Mb in size, compared with the ~150-Mb X chromosome. There are two
segments of sequence homology (pseudoautosomal regions), at the tips of
the short and long arms, in which meiotic crossing over between the X and Y
occurs. Between these regions the male-specific region of the Y chromosome
(MSY) escapes from crossing over. Of this region, around half is a variably-
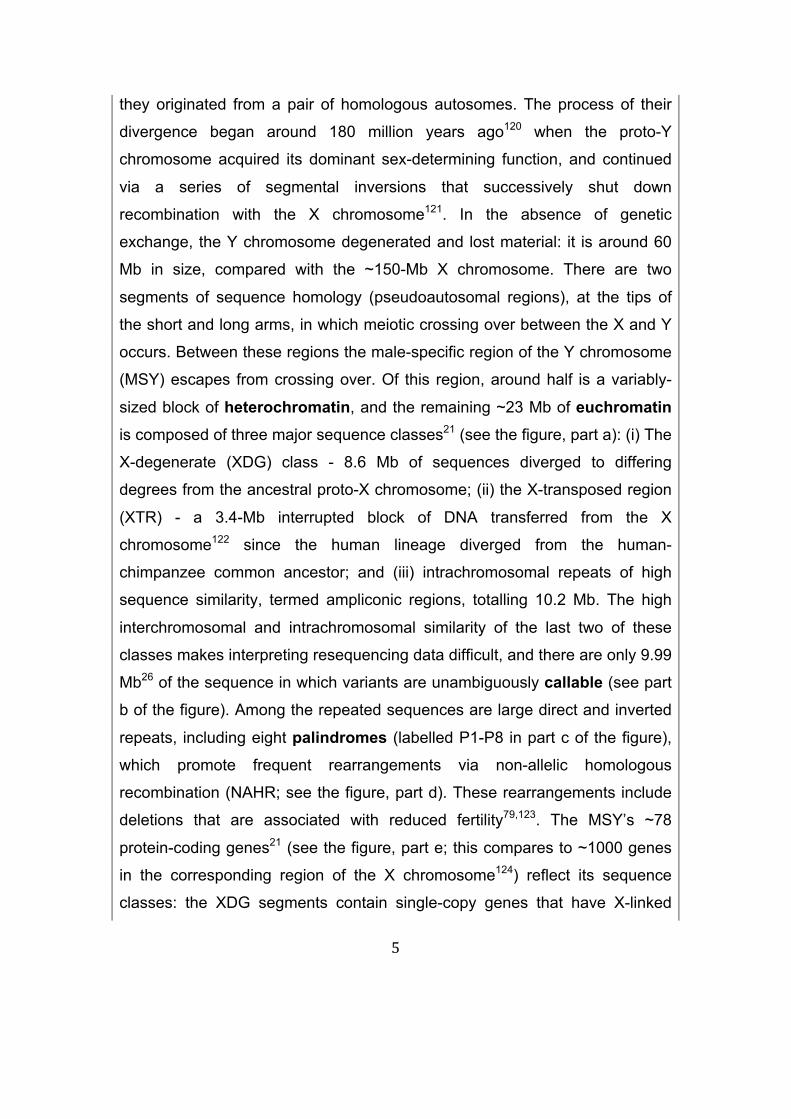
sized block of heterochromatin, and the remaining ~23 Mb of euchromatin
is composed of three major sequence classes21 (see the figure, part a): (i) The
X-degenerate (XDG) class - 8.6 Mb of sequences diverged to differing
degrees from the ancestral proto-X chromosome; (ii) the X-transposed region
(XTR) - a 3.4-Mb interrupted block of DNA transferred from the X
chromosome122 since the human lineage diverged from the human-
chimpanzee common ancestor; and (iii) intrachromosomal repeats of high
sequence similarity, termed ampliconic regions, totalling 10.2 Mb. The high
interchromosomal and intrachromosomal similarity of the last two of these
classes makes interpreting resequencing data difficult, and there are only 9.99
Mb26 of the sequence in which variants are unambiguously callable (see part
b of the figure). Among the repeated sequences are large direct and inverted
repeats, including eight palindromes (labelled P1-P8 in part c of the figure),
which promote frequent rearrangements via non-allelic homologous
recombination (NAHR; see the figure, part d). These rearrangements include
deletions that are associated with reduced fertility79,123. The MSY’s ~78
protein-coding genes21 (see the figure, part e; this compares to ~1000 genes
in the corresponding region of the X chromosome124) reflect its sequence
classes: the XDG segments contain single-copy genes that have X-linked
6
gametologues and are mostly ubiquitously expressed; and the ampliconic
regions contain multi-copy genes that are mostly testis-specific in expression.
Despite its exemption from crossing over, the MSY is far from being
recombinationally inert: gene conversion occurs frequently within the
ampliconic regions125-127, and occasionally between highly similar non-
pseudoautosomal sequences on the X and Y chromosomes128-130. However,
because most hypervariable minisatellites owe their variability to crossover
hotspots131, these dynamic loci are absent from the male-specific region of
the Y chromosome, where crossover cannot occur.
Parts a and e are from REF. [21], Nature Publishing Group.
Technologicaltransformation
Sequence-basedphylogenies
Sequence data, in principle, lead to a robust phylogeny with branch lengths
that are proportional to numbers of mutations (SNPs), and thus to time (Figure
1a). However, in practice, sequencing the Y chromosome is not without its
difficulties. Even with the availability of a high-quality reference sequence21,
the complex repeated structure of the Y-chromosome and the short (<200-bp)
7
reads produced by most current technologies make unambiguous mapping
(i.e. alignment to the reference genome) possible only in the unique regions of
the chromosome; these discontinuous segments dispersed along the MSY
add up to about 10 Mb in total length (Box 1). Some studies have enriched
specifically for 0.5-3.7-Mb subsets of these regions22-24, whereas others have
sequenced the entire genome and subsequently extracted the relevant reads
bioinformatically4,20,25-27. Sequencing depth (the number of sequence reads
covering a particular genomic position) is also important, because the low
depth used in several early studies is likely to result in less efficient discovery
of rare variants that are present in just one or a few individuals; as these
variants lie on terminal branches of the phylogeny, such branches would be
artefactually shortened28. Several other technical factors also influence the
final set of variants and thus the phylogenetic tree, such as the sequencing
platform, the variant calling algorithm, and filtering and validation strategies.
Consequently, results presented in different studies cannot be simply or
reliably combined or compared; instead, a new analysis starting from the
sequence reads is required.
NGS data have also been used for the systematic discovery of Y-STRs. One
study genotyped 4,500 Y-STRs and estimated mutation rates for 702 of
them29. Although the short reads resulted in the longest and most variable Y-
STRs being under-ascertained, this approach illustrates the great potential for
large-scale Y-STR studies. Structural Variants (SVs, including Copy Number
Variants (CNVs) and inversions) are enriched on the Y compared with other
chromosomes2,30, probably as a consequence of its repeated structure (Box
1). Sequence-based analyses are beginning to reveal the full extent of this
form of variation4,31,32, and the greater tolerance for gene loss on the Y
chromosome compared with the autosomes.
Despite these complexities, the SNP-based callsets and phylogenies
produced by independent studies are highly congruent24,26,33. Inconsistencies
can generally be explained by differences in the samples used, segments of
8
the chromosome included, or expected low levels of false-positive and false-
negative calls.
Calibratingphylogenies
In addition to producing a phylogeny with a robust structure, NGS data result
in branches whose lengths are based on the number of mutations on each
branch; if the mutation rate is known and has been constant, this information
can be converted into time to generate a calibrated phylogeny (Figure 1).
Three broad approaches have been used to estimate the Y-SNP mutation
rate, two of which use genealogies34-37 and historical or archaeological
dates26,28 and are equivalent to the approaches used for Y-STRs. The third
approach makes use of aDNA sequences of known ages38, which carry fewer
mutations from the root of the Y phylogeny than do present-day sequences
because they had less time to accumulate such mutations39 (Box 2). The
three approaches give reasonably consistent estimates: however, there is a
15% difference between the most reliable current genealogy-based point
estimate35 of 8.9 × 10⁻¹⁰ and the corresponding aDNA-based point estimate38
of 7.6 × 10⁻¹⁰ mutations per base per year, illustrating the remaining
uncertainty. It currently remains unclear which estimate is more reliable,
though the latter is more compatible with independently-dated events such as
the out-of-Africa expansion and the peopling of the Americas4.
Box2.TheY-SNPmutationrate
Like any part of the genome, the Y chromosome accumulates SNPs through
mutation, but it does this at a higher average rate because it passes between
generations exclusively via sperm rather than eggs, and spermatogenesis is
more mutagenic than oogenesis. This higher rate of mutation is thought to be
because of the larger numbers of cell divisions, and hence DNA replications,
9
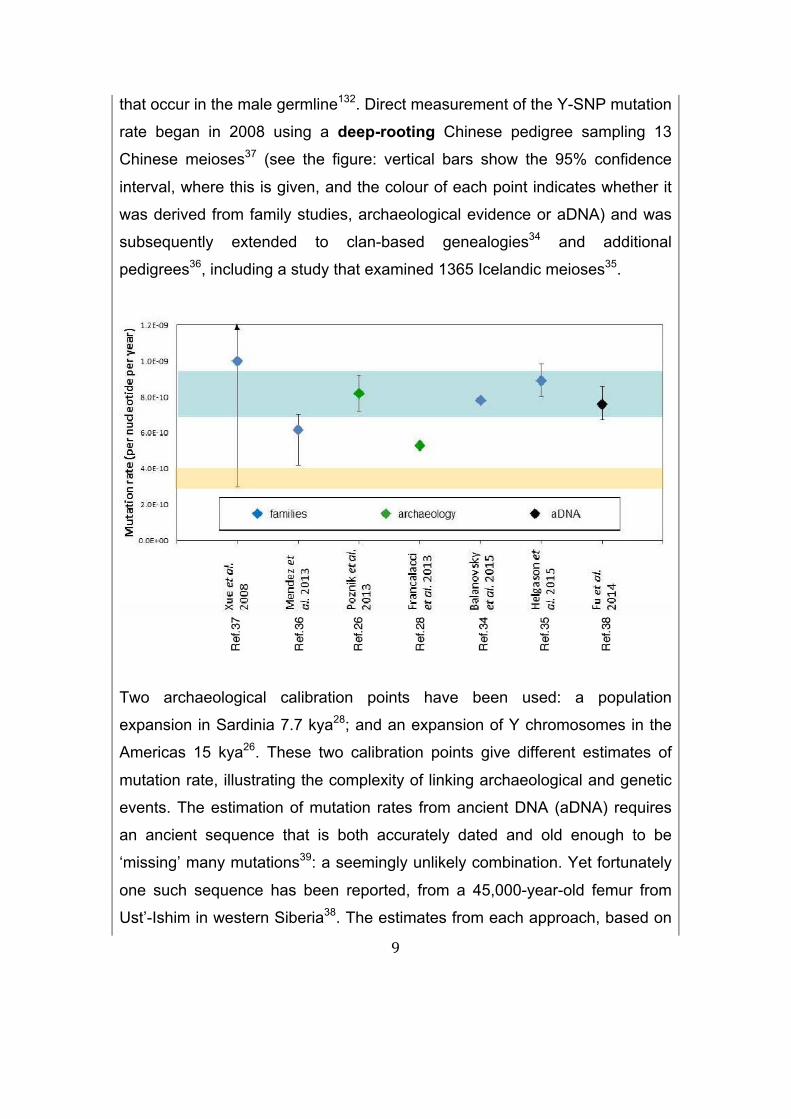
that occur in the male germline132. Direct measurement of the Y-SNP mutation
rate began in 2008 using a deep-rooting Chinese pedigree sampling 13
Chinese meioses37 (see the figure: vertical bars show the 95% confidence
interval, where this is given, and the colour of each point indicates whether it
was derived from family studies, archaeological evidence or aDNA) and was
subsequently extended to clan-based genealogies34 and additional
pedigrees36, including a study that examined 1365 Icelandic meioses35.
Two archaeological calibration points have been used: a population
expansion in Sardinia 7.7 kya28; and an expansion of Y chromosomes in the
Americas 15 kya26. These two calibration points give different estimates of
mutation rate, illustrating the complexity of linking archaeological and genetic
events. The estimation of mutation rates from ancient DNA (aDNA) requires
an ancient sequence that is both accurately dated and old enough to be
‘missing’ many mutations39: a seemingly unlikely combination. Yet fortunately
one such sequence has been reported, from a 45,000-year-old femur from
Ust’-Ishim in western Siberia38. The estimates from each approach, based on
10
the largest datasets and most widely-accepted archaeological calibration, are
reasonably consistent and their confidence intervals all overlap (see the
figure, where this consensus Y rate (blue shading) is contrasted with the
autosomal rate133 (buff shading)). Divisions of the spermatogonia (the stem-
cells of spermatogenesis), continue throughout a man’s life, so increasing
paternal age leads to an increasing SNP mutation rate35. This implies that
cultural differences between populations that influence the average age at
which a man fathers children may alter the effective mutation rate.
The constancy of the mutation rate over time and in different places is difficult
to assess. The number of male-line mutations increases with paternal age35,
therefore variation in male generation time might plausibly lead to mutation
rate variation40, which on the Y chromosome could lead to different root-to-tip
branch lengths for different lineages. Such variation has been reported, with
haplogroup E-M96 (sub-Saharan Africa) and O-P186 (East Asia) branch
lengths being longer24 (possibly reflecting higher average paternal ages), and
haplogroup A1b-M6 (found in parts of Africa) being shorter33 than expected.
The calibrated phylogeny presented here (Figure 1a) lacks the deepest-
rooting known haplogroup36, A0036), because that lineage was not present in
the 1000 Genomes Project samples. However, a subsequent NGS-based
study estimated that A00 diverged 275 (95% CI: 241-305) thousand years ago
(kya)41. The same study examined ∼120 kb of Y-chromosomal DNA from a
Neanderthal from El Sidrón, Spain and demonstrated that the Neanderthal
lineage formed an outgroup to all known modern humans, diverging 588
(95% CI: 447-806) kya (Figure 1b).
Some of the observations that emerge from calibrated phylogenies are to be
expected, such as geographically-specific haplotype distributions (Figure 1c).
However, these phylogenies also provide striking new insights. For instance,
the timing of a major expansion of the lineages outside Africa 50-60 kya (Fig
1a) corresponds to the estimated time of Neanderthal admixture in non-
11
Africans38, which itself is likely to mark the major expansion of modern
humans out of Africa. Thus, this male lineage expansion could simply result
from the general population expansion of modern humans. However, note the
importance of the Y-chromosomal mutation rate used in calibration (Figure 1);
if 8.7 x 10⁻¹⁰ mutations per base per year had been used instead of 7.6 x 10⁻¹⁰
per base per year, a more recent Y-chromosomal expansion would have been
inferred, and a more complex demographic model with male lineage
expansion lagging behind geographical spread would be necessary.
InsightsintopopulationgeneticsPrior to recent progress in population genomics42, the Y chromosome and
maternally-inherited mitochondrial DNA (mtDNA) were the highest-resolution
tools for human population genetic studies, and their patterns of diversity were
widely used to interpret the human past43. However, both have disadvantages
for this purpose, as they each represent just one realisation of the
evolutionary process, and are strongly influenced by genetic drift and sex-
biased behaviours, and potentially by positive selection. Their real utility
comes from their uniparental modes of inheritance, which can provide insights
into past social structure and the potentially different behaviours of men and
women - of considerable interest to historians, archaeologists and
anthropologists, for example.
Some of these sex-influenced behaviours have been investigated by analysis
of Y-chromosomal diversity, albeit with the traditional Y-SNP plus Y-STR
approaches.For example, differences in the reproductive biology of men and
women, including the length of reproductive life and the resources invested in
offspring, contribute to greater variance in the number of offspring of men44.
This variance is expected to result in a lower male effective population size
through genetic drift, which can be strongly enhanced in some populations by
social structures5 that endow small numbers of men with high status.
12
Unusually frequent Y-STR haplotype clusters have been interpreted45 as
signals of past patrilineal dynasties, including that founded by Genghis
Khan46, the Chinese Qing dynasty47, and the Irish early medieval Uí Néill
dynasty in Europe48.
Furthermore, customs surrounding marriage practices can influence the
migration behaviours of the sexes, thus affecting Y-chromosome diversity. For
example, around 70% of human societies are patrilocal49,50 – following
marriage, the couple makes their home near the man’s birthplace, rather than
the woman’s. This practice is expected to increase the geographical
differentiation of Y haplotypes, and to have the opposite effect on mtDNA
haplotypes51. Indeed, studies of patrilocal and matrilocal tribes52 have
confirmed the expected effects of these marriage practices on Y chromosome
and mtDNA diversity.
Finally, when populations of different origins mix, the contributions of men and
women are often unequal53. This sex-biased admixture can result from a sex
bias in the composition of one population, or from the social exclusion from
sexual interaction of one or the other sex from a particular population. Studies
of many populations in the Americas have shown the dramatically male-
biased contribution of Europeans compared to indigenous or African-derived
populations54-56.
Interestingly, analysis of an Aboriginal Australian haplogroup C-M130 lineage
illustrates the contrast between the Y-SNP plus Y-STR and sequencing
approaches to population-genetic questions. The former method suggested
that this lineage had diverged from haplogroup C-M130 chromosomes in the
Indian subcontinent around 5 kya57, implying gene flow into Australia around
this time. By contrast, sequencing demonstrated a divergence time close to
50 kya58 and thus no evidence for Holocene period male gene flow into
Australia, and this older time is more likely to be correct24,27,59.
Sequencing approaches have yet to be widely applied to the types of studies
discussed above, but as costs fall further, the number of sequencing-based
13
analyses is likely to increase. Currently, studies are emerging in which novel
variants discovered by resequencing are applied in large population
samples60, but NGS approaches have already had a direct impact in some
areas, as described in the following sections.
Male-mediatedexpansions
Several Y-chromosome resequencing studies4,23,26,27,61 have concurred in
finding bursts of expansion45 within specific lineages within the last few
thousand years. Examples include the expansion of haplogroup Q1a-M3 in
the Americas at ~15 kya, the time of initial human colonisation; expansion of
two independent haplogroup E1b-M180 lineages in Africa at ~5 kya, which
pre-dates the demographic and geographical expansions of Bantu speakers,
but the lineages were subsequently carried by them; and expansion in
Western Europe of lineages within haplogroup R1b-L11 ~4.8–5.9 kya,
possibly associated with technological advances in the Bronze Age (Fig. 1).
This last expansion had been recognised previously but, based on Y-SNP and
Y-STR analysis, had been interpreted as an older, Neolithic event62. The
Bronze Age Yamnaya culture has been linked by genome-wide aDNA
evidence to a massive migration from the Eurasian Steppe, which may have
replaced much of the previous European population63,64. The haplogroup R1b-
L11 expansion is also evident in a European-focused population sequencing
study61, which finds additional recent European expansions involving
haplogroups I1-M253 and R1a-M17.
Population-based interpretations of demographic history using Bayesian skyline plots (BSPs) provide a way to visualise changing past population
size and, when both Y-chromosome and mtDNA sequences are considered,
allow a comparison of male and female effective population sizes. BSPs
based on the sequences of Y chromosomes and mtDNAs from a global
sample set27 (Figure 2) demonstrate contrasting temporal profiles for Y and
mtDNA, with the contraction and recent expansion in male effective
14
population sizes very evident, but absent from the mitochondrial BSP. In
addition, estimates of the effective population size for mtDNA are consistently
more than twice as high as those for the Y chromosome, emphasizing the
greater variance in reproductive success of males.
Over the past few years, sequence data for ancient Y chromosomes have
been accumulating39 and, although the geographical and temporal distribution
is patchy, these data promise to add much to our understanding of sex-biased
processes in the past. For example, a number of dramatic shifts in Y
haplogroup frequencies have been shown to have occurred in Europe over
the past ~35 thousand years (Figure 2c).
Genealogicalstudiesandpatrilinealsurnames
The historical case regarding President Thomas Jefferson’s (1743-1826)
alleged paternity of at least one of the children of Sally Hemings (1773-1835),
a slave at his Virginia estate, was arguably the catalyst for the use of Y-
chromosomal analysis in family history. Sharing of Y haplotypes65 between
attested male-line descendants of Jefferson’s paternal uncle and those of his
alleged son supported the paternity case. More generally, a relationship
between Y haplotypes and patrilineal surnames has been investigated and
supported using Y-SNP plus Y-STR approaches. Studies of this relationship
in different countries have revealed the effects of past social structures on Y-
chromosome diversity. In England66 and Spain67,68, the probability of sharing a
Y-haplotype between two men who share a surname is inversely proportional
to the frequency of the surname in the population – common surnames,
founded many times, have high Y diversity, while rare ones tend to have low
diversity. However, in Ireland69 common surnames are as likely as rare
surnames to have low Y diversity, which probably reflects medieval dynastic
social structures. The clear relationship between Y-haplotypes and surnames
attests to low non-paternity rates in the studied populations, which specific
15
studies seem to confirm70,71.
The surname-Y haplotype relationship has practical implications. Predicting a
surname from a Y haplotype would be useful in no-suspect criminal cases6,
and this has been shown to be feasible in principle72, though in practice would
require very large databases of surnames with associated Y haplotypes.
Privacy concerns have been raised about the anonymity of enrolment into
medical genomic studies, as surnames of participants appear to be
predictable from publically available whole-genome sequence data in
combination with public non-genetic data73. The Y chromosome is
nevertheless a standard tool for forensic investigators, and the most common
approach is to investigate whether or not there is a match between samples of
interest using Y-STRs (Box 3).
Box3:TheYchromosomeasaforensictool
The Y chromosome’s male specificity makes it potentially useful in forensic
DNA analysis6,134, particularly in cases of male-on-female sexual assault135,
where the victim’s DNA can be in great excess. If human individual
identification via Y-DNA analysis were possible, this would indeed be a
valuable tool. In principle, NGS could offer such discriminating power if a large
proportion of the Y could be reliably sequenced, but in forensic practice the
small amounts of often damaged DNA, the relatively high cost of sequencing,
and in some countries legal or ethical restrictions, prohibit this approach.
Instead, forensic DNA testing generally relies upon length-based analysis of
STRs.
The workhorse of most forensic DNA analysis is a set of ~15 - 21 STRs on the
autosomes [www.cstl.nist.gov/strbase/multiplx.htm]. The high discriminating
power this set provides comes from two factors: (i) the STRs have high
mutation rates (typically around 0.1% per STR per generation
16
[www.cstl.nist.gov/strbase/mutation.htm]), leading to high allelic diversity, and
(ii) they are independently inherited, leading to a very low probability (typically
~10-18 to 10-25) that two random individuals will share a genotype (DNA profile)
by chance. The first factor also applies to the Y chromosome, but the second
does not: all Y-STRs are permanently linked together, and they evolve as a
haplotype by mutation alone6. This greatly reduces the degree of inter-
individual discrimination they offer: indeed, close patrilineal relatives are
expected to share the same Y-STR profile, unless a mutation has occurred
among the set of tested STRs. This situation is exacerbated by the recent
rapid expansions of male lineages in some parts of the world45 (see main
text).
One approach to this problem has been to seek examples of Y-STRs that
have particularly high mutation rates. One study analysed 186
bioinformatically-identified STRs in ~2000 father-son pairs in order to estimate
mutation rates136, and identified a subset of 13 RM (rapidly-mutating) Y-STRs,
each mutating at >1% per generation. This set is capable of distinguishing
between fathers and sons in ~49% of pairs based on mutation137, and thus
allows Y-STR analysis to approach the level of individual identification. The
application of NGS approaches to Y-STRs promises to further enhance
discrimination power, by discovering additional RM Y-STRs29, increasing the
number of simultaneously analysed STRs in routine typing, and also adding
information about their internal sequence variation.
The study of family history is an enormously popular hobby, and DNA analysis
has been enthusiastically embraced by the so-called ‘genetic genealogy’
community7,74. There are many direct-to-consumer DNA testing companies
that offer Y-chromosome analysis and some of these run ‘surname projects’
that bring together men who share surnames to also share their DNA data.
Initially these companies typed only Y-STRs, but driven by competition they
17
have moved via SNP typing to Y-chromosome sequencing. For a few hundred
US dollars the company Family Tree DNA offers ‘Big-Y’ (targeted
resequencing of 11.5 - 12.5 Mb of Y-DNA), and Full Genomes Corporation
offers ‘Y Elite 2’ (14 Mb resequenced), both providing a list of called SNPs to
customers. Some services offer whole-genome sequencing (Full Genomes
Corp), or the interpretation of genome sequences (e.g. YFull), and will extract
Y sequence variants, including >500 Y-STR genotypes. The wealth of
sequence data emerging from this ‘recreational’ genomic activity derives from
a biased set of males who have the money and interest to fund it, but if made
widely available could nonetheless add greatly to Y chromosome sequence
variation data. Genealogists themselves can hope for molecularly-based
family trees with improved time-scales compared to the current STR-based
estimates, and it may also be possible to tie these into historical figures from
aDNA data. There is also scope for growth of ‘citizen science’, in which
people who are not academics trained in population genetics can make
valuable contributions to the scientific literature; past examples have included
using early 1000 Genomes Project data to identify new variants within
haplogroup R1b-L11 (ref. 75) and a study focussed on haplogroup Q3-L275, a
rare West Asian lineage that has been little studied by academics but is of
particular interest to citizen scientists because it exceeds 5% frequency in
Ashkenazi Jews76, a community strongly engaged in such analyses.
MedicalconsequencesofYvariationThe previous sections have mostly assumed, implicitly or explicitly, that the Y
chromosome can be regarded as a neutral locus influenced solely by
demographic events, where it makes no biological difference which Y
haplotype a man carries. However, the Y chromosome has a primary function
in determining male sex via SRY (Box 1), and also carries >70 other genes.
These genes can vary in sequence, copy number or other aspects between
men. In this section, we first review what is known about the phenotypic and
18
medical consequences of Y-chromosomal variation, and then discuss the
implications of these consequences for its use in population studies. Many
such consequences depend on a known gene or region of the chromosome,
or on the copy number (ploidy) of the whole chromosome. In these cases,
sequencing the chromosome adds little to our understanding. But in cases
where the genetic basis of a phenotype is unclear, sequence data can reveal
this basis.
SimplegeneticconditionsinfluencedbytheYchromosome
Given the role of SRY in determining male sex, SRY loss of function via
deletion or point mutation would be expected to lead to a female phenotype,
and SRY gain of function via translocation to another chromosome would
result in a male phenotype. These consequences are indeed seen in rare sex-
reversed XY female and XX male individuals77,78.
Further to its sex-determining role, studies of men with spermatogenic failure
have shown that three regions of the Y chromosome are required for
spermatogenesis and thus male fertility; these regions were defined by
deletions designated AZFa, AZFb and AZFc79 (Box 1). Each region contains
more than one gene, and no specific gene has been unambiguously identified
as responsible for the phenotype. The best-understood region is AZFa, which
contains just two genes, USP9Y and DDX3Y. Deletion of both genes results
in a complete lack of germ cells (Sertoli-cell-only syndrome) in all known
cases80 . By contrast, deletion or disruption of USP9Y alone is associated with
spermatogenic phenotypes ranging from azoospermia (undetectable sperm)
to normozoospermia (normal sperm), presumably owing to differences in
genetic background or environment80. Deletion or disruption of DDX3Y alone
has not yet been reported, but functional studies in induced pluripotent stem cells (iPSCs) carrying an AZFa deletion have shown that introduction of
DDX3Y can restore germ-cell formation, which suggests a key role for DDX3Y
in this process81. Such work provides one model for the dissection of the gene
19
functions within the AZFb and AZFc regions, while future large-scale NGS
surveys may reveal small disruptive mutations that lead to some aspects of
these phenotypes or, alternatively, inactivate a gene without phenotypic
consequences.
Anomalies in sex differentiation and spermatogenesis are, when severe, not
transmissible, and so generally cannot lead to simple heritable disorders. Only
a single such condition has been reliably mapped to the MSY: a form of male-
specific deafness (designated DFNY1 because it was the first Y-linked
deafness locus identified) reported in a single extended Chinese pedigree82.
However, sequencing of the affected Y chromosome demonstrated that its
basis was not a mutation in a Y-chromosomal gene, but instead an insertion
of 160 kb from chromosome 1 carrying a known dominant deafness-
associated locus, DFNA4983, a conclusion that would have been difficult to
reach without NGS data.
ComplexgeneticconditionsinfluencedbytheYchromosome
Over the past decade or so, genome-wide association studies (GWAS) have identified over 30,000 associations between specific SNPs and traits
(32,234 unique SNP–trait associations on 6th March 2017;
http://www.ebi.ac.uk/gwas/), an average of about one per 100 kb. Strikingly,
not a single one of these trait-associated SNPs is located on the Y
chromosome, where 100 would be expected even if just the ~10 Mb of unique
sequence were considered. Although the Y chromosome is often neglected by
such studies, and some Y-SNP associations have been reported by targeted
investigations, for example in coronary artery disease84, it remains unclear
whether the lack of reported genetic associations is truly biological, or is
explained by current methodological limitations such as the different settings
needed for identifying variants in haploid versus diploid regions. Nevertheless,
complex influences of Y-chromosomal loci on spermatogenesis have been
20
detected, affecting the process more subtly than the high-penetrance AZFa-c
deletions. Unusually high or low (<21 or >55) numbers of copies of TSPY
double the risk of spermatogenic failure85,86. A partial deletion within AZFc
(designated “gr/gr”, 1.6 Mb) removes four genes belonging to three gene
families without eliminating any gene family entirely, and is also associated
with a doubling of the risk of spermatogenic failure. It accounts for ~2% of
severe spermatogenic failure, although <2% of men with the deletion are
affected87,88. Nevertheless, the gr/gr deletion is fixed in some haplogroups, for
example, D2-M55, which is present in 36% of Japanese males4 but has only
minor phenotypic effects89, suggesting the possibility of compensating
variants elsewhere on such Y chromosomes. In addition, the gr/gr deletion
was associated with a twofold increased risk of testicular germ cell tumours,
at least in a sample of predominantly European ancestry90. While these
insights have been derived without using NGS, future long-read NGS
approaches should provide a fuller understanding of the structures of the
partial deletions and how they relate to phenotypic variation, and might also
shed light on the postulated compensating variants.
Y-chromosomalaneuploidy
Constitutional variation in the number of copies of the Y chromosome has
long been noted, with the most common aneuploidies being Turner Syndrome
(45,X; 1 in 2,000) and XYY Syndrome (47,XYY; 1 in 1,000). Phenotypic
anomalies can affect both morphology (for instance, height, brain structure)
and behaviour (such as risk of autism spectrum disorder and attention-deficit/
hyperactivity disorder)91, and there is significantly higher mortality from a wide
range of diseases92,93. However, such individuals also have reduced or
increased dosage for the ~20 protein-coding genes in the pseudoautosomal regions, and, while early work suggested that the Turner Syndrome
phenotype cannot be fully explained by the lack of a second copy of PAR194,
21
specific MSY genes remain to be convincingly implicated.
Somatic loss of the Y (LOY) in blood cells has also been noted for decades95,
but its full health implications have only been identified more recently10,
although without using NGS. LOY is the most common known acquired
human mutation in surveyed populations96, and its frequency increases with
age (Figure 3A), and is associated with smoking97. It has also been
associated with decreased survival time from all causes (Figure 3B), including
cancer (Figure 3C)96, and with increased risk of Alzheimer disease (Figure
3D)98; these associations have been replicated in some but not all studies99-
102. The SNP rs2887399 near TCL1A on chromosome 14 is associated with
LOY risk (OR = 1.55, 95% CI = 1.36–1.78; P = 1.37 x 10⁻¹⁰)101 and more
recently 18 additional associated genomic regions have been identified 102,103.
While the mechanistic relationship between LOY and disease, and the
importance of specific Y genes or Y haplotype background remain to be fully
understood, a tumour suppressor role for TMSB4Y has been proposed103, as
has a model whereby LOY might provide an indicator of the increased
aneuploidy of other chromosomes102. If specific Y-chromosomal genes or
haplotypes are relevant, NGS data should in the future contribute to
understanding their importance.
CanYvariationbeconsideredneutral?
The lack of recombination on the MSY means that selection on any variant
anywhere on the chromosome affects the entire MSY, and some of the known
variants change functional elements. For example, the abundant structural
variation on the Y chromosome includes a recurrent 2.5-4.0-Mb deletion
removing AMELY, PRKY and TBL1Y, and sometimes PCDH11Y104,105, with
rarer equivalent duplications106. One form of the deletion (Box 1) reaches 2%
frequency in South Asia104,105, and no phenotypic consequences have been
identified, although further studies focusing on men harbouring the deletion
22
are needed. Another partial deletion within AZFc (g1/g3 or b2/b3, 1.8 Mb)
removes five genes belonging to three gene families, one more than the gr/gr
deletion, yet is widespread and fixed in haplogroups such as N-M231, and is
associated with normal spermatogenesis88,107,108. Thus, variants with
substantial effects on Y gene content can apparently have negligible
phenotypic consequences and allow neutral or near-neutral evolution.
Overall, genetic diversity on the Y chromosome is lower than expected when
simple demographic models are fitted to the diversity of other chromosomes,
an observation that could be explained by strong purifying selection109 or a
more complex demography including severe male-specific bottlenecks4.
Protein-coding sequences on the Y show particularly low levels of diversity,
with less non-synonymous than synonymous variation and an average of one
amino acid difference per chromosome across 16 unique genes on Y
chromosomes from diverse haplogroups110. Purifying selection undoubtedly
removes a small proportion of Y lineages from the population, but there is
currently little evidence for significant variation in its efficiency between
haplogroups (for a counter-example, see ref. 111), nor for biologically-based
positive selection. Thus, while higher-powered studies are needed, there
currently seems to be little evidence for differential non-neutral evolution of Y
haplogroups, and few consequences for analyses that assume neutrality.
PerspectivesOver the past few years, improved sequencing technologies have greatly
enriched our knowledge of Y-chromosomal variation, and these tools are
continuing to develop. As a result, data generation is becoming cheaper and
easier, with benefits for all areas that depend on large sequence databases,
from evolutionary genetics to genealogy and forensics. Here, we discuss
examples of how next-generation sequencing will continue to affect our
understanding of the Y-chromosome.
23
Long-readsequencing
Technologies generating individual reads, or synthetic reads, that can be tens
of kilobases in length are now starting to be used112, and will provide access
to more of the repeated regions of the chromosome. Although these regions
are not expected to substantially improve phylogenetic reconstruction or
dating, they are likely to reveal details of incompletely understood mutational
processes, and to have particular relevance to functionally important genes on
the Y chromosome, which are abundant in the repeated regions. Long reads
help to resolve complex repeated regions and also allow effective de novo
assembly113, which together may reveal sequences carried by some Y
chromosomes but absent from the reference sequence.
TheincreasinginfluenceofaDNA
The logical way to investigate Y-chromosomal history is to genotype or
sequence Y chromosomes from each geographical area and time interval of
interest, and to document the changes over space and time. Before NGS,
PCR-based aDNA studies were too laborious and prone to contamination to
make this approach feasible. However, NGS has transformed the field and,
consequently, aDNA studies are now beginning to reveal the complexity of
history114 and seem sure to continue to do so, with increasing resolution.
aDNA data from outside Europe are particularly needed, both to address
current questions such as the origins of the extreme expansions identified
from present-day Y chromosomes4,27,61, and to reveal the unknown features of
the histories elsewhere. Even within Europe, there are still few full ancient Y
sequences39, and although the origin of the predominant haplogroup R1b-L11
might be related to the Yamnaya migration, the common Western European
R1b-L11 chromosomes are not represented among the Yamnaya genotypes
24
available thus far4,115, revealing a substantial gap in our understanding of the
Bronze Age expansion.
UnderstandingthefunctionofY-chromosomegenes
Although a catalogue of the protein-coding genes on the Y chromosome
exists, many aspects of their function remain unknown. What, if any,
phenotype is associated with loss or duplication of each gene? How does
each gene contribute to the Turner and XYY syndrome phenotypes? What is
the full range of phenotypic consequences of somatic LOY, which genes and
mechanisms are most relevant, and do the consequences vary between
haplogroups? Why do the gr/gr and b2/b3 deletions have such different
functional consequences, and why do gr/gr deletion phenotypes vary between
haplogroups? To what extent do haplogroup differences influence the traits
investigated by genome-wide association studies? In addition to the protein-
coding genes, the Y chromosome yields many non-coding transcripts and
contains additional regulatory elements annotated as functional. How can
their functions best be investigated?
Genome-wide association studies are, in reality, usually autosome-wide
association studies (AWAS), ignoring the X and Y chromosomes116 despite
the abundance of X- and Y-chromosomal SNPs on most genotyping arrays.
Perhaps the single greatest current opportunity in the Y-chromosomal field is
to use the millions of genotype–phenotype datasets already available to
investigate the roles of the sex chromosomes in common diseases and
phenotypes, analyses that will be particularly challenging for the Y
chromosome because of its extreme population stratification.
Conclusions
The technological revolution of the last few years has allowed multi-megabase
25
sequences of Y-chromosomal DNA to be determined from large population
samples, with consequent unbiased ascertainment of variation. The resulting
time-calibrated phylogeny reveals male expansions at the time of the
migration of modern humans out of Africa around 60,000 years ago, and also
in the last few millennia, probably corresponding to technology-driven
population expansions. aDNA investigations are beginning to reveal the
complexity of changes in Y chromosome lineage distributions and frequencies
over time. In genealogical studies, the male-line inheritance of the Y
chromosome makes it an excellent tool for studies of male family history,
creating a burgeoning area of citizen science in which NGS technologies are
being enthusiastically applied. The Y chromosome has not been implicated at
all in genome-wide association studies, and only in a single simple heritable
disorder, but is central to disorders of sex determination and
spermatogenesis. Mosaic somatic loss of the Y chromosome in aging men
has been associated with increased risk of cancer mortality and Alzheimer
Disease. With high-quality genome sequences of millions of men expected to
be available in the next few years117,118
[www.nhlbi.nih.gov/research/resources/nhlbi-precision-medicine-
initiative/topmed/wgs], we look forward to a detailed phylogeny that links all
their Y chromosomes, helps us to understand our shared history, and reveals
the clear-cut or subtle phenotypic consequences of carrying one type of Y
chromosome instead of another.

26
References
1 Bachtrog, D. Y-chromosome evolution: emerging insights into
processes of Y-chromosome degeneration. Nat. Rev. Genet. 14, 113-
124, (2013).
2 Repping, S. et al. High mutation rates have driven extensive structural
polymorphism among human Y chromosomes. Nat. Genet. 38, 463-
467, (2006).
3 Jobling, M. A. Copy number variation on the human Y chromosome.
Cytogenet. Genome Res. 123, 253-262, (2008).
4 Poznik, G. D. et al. Punctuated bursts in human male demography
inferred from 1,244 worldwide Y-chromosome sequences. Nat. Genet.
48, 593-599, (2016).
The largest sequence-based study of Y-chromosomal variation thus far, including SNPs, STRs, indels, MNPs and CNVs; data, DNA and cell lines are publically available.
5 Heyer, E., Chaix, R., Pavard, S. & Austerlitz, F. Sex-specific
demographic behaviours that shape human genomic variation. Mol.
Ecol. 21, 597-612, (2012).
6 Jobling, M. A., Pandya, A. & Tyler-Smith, C. The Y chromosome in
forensic analysis and paternity testing. Int. J. Legal Med. 110, 118-124,
(1997).
7 Calafell, F. & Larmuseau, M. H. The Y chromosome as the most
popular marker in genetic genealogy benefits interdisciplinary research.
Hum. Genet. doi: 10.1007/s00439-016-1740-0, (2016).
8 Ober, C., Loisel, D. A. & Gilad, Y. Sex-specific genetic architecture of
human disease. Nat. Rev. Genet. 9, 911-922, (2008).
9 McElreavey, K., Ravel, C., Chantot-Bastaraud, S. & Siffroi, J. P. Y
chromosome variants and male reproductive function. Int. J. Androl.
29, 298-303, (2006).
27
10 Forsberg, L. A., Gisselsson, D. & Dumanski, J. P. Mosaicism in health
and disease - clones picking up speed. Nat. Rev. Genet. 18, 128-142,
(2016).
11 Jobling, M. A. & Tyler-Smith, C. The human Y chromosome: an
evolutionary marker comes of age. Nat. Rev. Genet. 4, 598-612,
(2003).
12 Y Chromosome Consortium. A nomenclature system for the tree of
human Y-chromosomal binary haplogroups. Genome Res. 12, 339-
348, (2002).
13 de Knijff, P. Messages through bottlenecks: on the combined use of
slow and fast evolving polymorphic markers on the human Y
chromosome. Am. J. Hum. Genet. 67, 1055-1061, (2000).
14 Zerjal, T. et al. Genetic relationships of Asians and northern
Europeans, revealed by Y-chromosomal DNA analysis. Am. J. Hum.
Genet. 60, 1174-1183, (1997).
15 Heyer, E., Puymirat, J., Dieltjes, P., Bakker, E. & de Knijff, P.
Estimating Y chromosome specific microsatellite mutation frequencies
using deep rooting pedigrees. Hum. Mol. Genet. 6, 799-803, (1997).
16 Zhivotovsky, L. A. et al. The effective mutation rate at Y chromosome
short tandem repeats, with application to human population-divergence
time. Am. J. Hum. Genet. 74, 50-61, (2004).
17 Hammer, M. F. A recent common ancestry for human Y chromosomes.
Nature 378, 376-378, (1995).
18 Whitfield, L. S., Hawkins, T. L., Goodfellow, P. N. & Sulston, J. 41
kilobases of analyzed sequence from the pseudoautosomal and sex-
determining regions of the short arm of the human Y chromosome.
Genomics 27, 306-311, (1995).
19 Hinds, D. A. et al. Whole-genome patterns of common DNA variation in
three human populations. Science 307, 1072-1079, (2005).
20 1000 Genomes Project Consortium et al. A map of human genome
28
variation from population-scale sequencing. Nature 467, 1061-1073,
(2010).
21 Skaletsky, H. et al. The male-specific region of the human Y
chromosome: a mosaic of discrete sequence classes. Nature 423, 825-
837, (2003).
22 Yan, S. et al. Y chromosomes of 40% Chinese descend from three
Neolithic super-grandfathers. PLoS One 9, e105691, (2014).
23 Lippold, S. et al. Human paternal and maternal demographic histories:
insights from high-resolution Y chromosome and mtDNA sequences.
Investig. Genet. 5, 13, (2014).
24 Hallast, P. et al. The Y-chromosome tree bursts into leaf: 13,000 high-
confidence SNPs covering the majority of known clades. Mol. Biol.
Evol. 32, 661-673, (2015).
Large-scale sequence-based study of Y-chromosomal variation, comparing Y-SNP and Y-STR-based approaches to estimating the ages of lineages.
25 Wei, W. et al. A calibrated human Y-chromosomal phylogeny based on
resequencing. Genome Res. 23, 388-395, (2013).
The first study of the Y-chromosomal phylogeny based on high-coverage sequencing, revealing the rapid expansion of Y lineages around the time of the expansion of modern humans out of Africa.
26 Poznik, G. D. et al. Sequencing Y chromosomes resolves discrepancy
in time to common ancestor of males versus females. Science 341,
562-565, (2013).
27 Karmin, M. et al. A recent bottleneck of Y chromosome diversity
coincides with a global change in culture. Genome Res. 25, 459-466,
(2015).
Large-scale sequence-based study of Y-chromosomal variation,
29
reporting a strong Y-chromosomal, but not mtDNA, bottleneck in the last 10,000 years.
28 Francalacci, P. et al. Low-pass DNA sequencing of 1200 Sardinians
reconstructs European Y-chromosome phylogeny. Science 341, 565-
569, (2013).
29 Willems, T. et al. Population-scale sequencing data enable precise
estimates of Y-STR mutation rates. Am. J. Hum. Genet. 98, 919-933,
(2016).
30 Redon, R. et al. Global variation in copy number in the human genome.
Nature 444, 444-454, (2006).
31 Espinosa, J. R., Ayub, Q., Chen, Y., Xue, Y. & Tyler-Smith, C.
Structural variation on the human Y chromosome from population-scale
resequencing. Croat. Med. J. 56, 194-207, (2015).
32 Massaia, A. & Xue, Y. Human Y chromosome copy number variation in
the next generation sequencing era and beyond. Hum. Genet.
doi:10.1007/s00439-017-1788-5, (2017).
33 Scozzari, R. et al. An unbiased resource of novel SNP markers
provides a new chronology for the human Y chromosome and reveals
a deep phylogenetic structure in Africa. Genome Res. 24, 535-544,
(2014).
34 Balanovsky, O. et al. Deep phylogenetic analysis of haplogroup G1
provides estimates of SNP and STR mutation rates on the human Y-
chromosome and reveals migrations of Iranic speakers. PLoS One 10,
e0122968, (2015).
35 Helgason, A. et al. The Y-chromosome point mutation rate in humans.
Nat. Genet. 47, 453-457, (2015).
The largest family-based study of the Y-SNP mutation rate so far, benefitting from deep-rooting Icelandic pedigrees.
30
36 Mendez, F. L. et al. An African American paternal lineage adds an
extremely ancient root to the human Y chromosome phylogenetic tree.
Am. J. Hum. Genet. 92, 454-459, (2013).
37 Xue, Y. et al. Human Y chromosome base-substitution mutation rate
measured by direct sequencing in a deep-rooting pedigree. Curr. Biol.
19, 1453-1457, (2009).
38 Fu, Q. et al. Genome sequence of a 45,000-year-old modern human
from western Siberia. Nature 514, 445-449, (2014).
39 Kivisild, T. The study of human Y chromosome variation through
ancient DNA. Hum. Genet. doi: 10.1007/s00439-017-1773-z, (2017).
40 Moorjani, P., Gao, Z. & Przeworski, M. Human germline mutation and
the erratic evolutionary clock. PLoS Biol. 14, e2000744, (2016).
41 Mendez, F. L., Poznik, G. D., Castellano, S. & Bustamante, C. D. The
divergence of Neandertal and modern human Y chromosomes. Am. J.
Hum. Genet. 98, 728-734, (2016).
Estimation of the divergence time between Neanderthal and modern human Y chromosomes at around 590,000 years ago, consistent with the divergence time of the two populations.
42 Veeramah, K. R. & Hammer, M. F. The impact of whole-genome
sequencing on the reconstruction of human population history. Nat.
Rev. Genet. 15, 149-162, (2014).
43 Underhill, P. A. & Kivisild, T. Use of Y chromosome and mitochondrial
DNA population structure in tracing human migrations. Annu. Rev.
Genet. 41, 539-564, (2007).
44 Brown, G. R., Laland, K. N. & Mulder, M. B. Bateman's principles and
human sex roles. Trends Ecol. Evol. 24, 297-304, (2009).
45 Batini, C. & Jobling, M. A. Detecting past male-mediated expansions
using the Y chromosome. Hum. Genet. doi: 10.1007/s00439-017-1781-z, (2017).

31
46 Zerjal, T. et al. The genetic legacy of the Mongols. Am. J. Hum. Genet.
72, 717-721, (2003).
47 Xue, Y. et al. Recent spread of a Y-chromosomal lineage in northern
China and Mongolia. Am. J. Hum. Genet. 77, 1112-1116, (2005).
48 Moore, L. T., McEvoy, B., Cape, E., Simms, K. & Bradley, D. G. A Y-
chromosome signature of hegemony in Gaelic ireland. Am. J. Hum.
Genet. 78, 334-338, (2006).
49 Burton, M. L. et al. Regions based on social structure. Curr. Anthropol.
37, 87-123, (1996).
50 Murdock, G. P. Ethnographic Atlas (University of Pittsburgh Press,
1967).
51 Seielstad, M. T., Minch, E. & Cavalli-Sforza, L. L. Genetic evidence for
a higher female migration rate in humans. Nat. Genet. 20, 278-280,
(1998).
52 Oota, H., Settheetham-Ishida, W., Tiwawech, D., Ishida, T. &
Stoneking, M. Human mtDNA and Y-chromosome variation is
correlated with matrilocal versus patrilocal residence. Nat. Genet. 29,
20-21, (2001).
53 Wilkins, J. F. Unraveling male and female histories from human genetic
data. Curr. Opin. Genet. Dev. 16, 611-617, (2006).
54 Alves-Silva, J. et al. The ancestry of Brazilian mtDNA lineages. Am. J.
Hum. Genet. 67, 444-461, (2000).
55 Rojas, W. et al. Genetic make up and structure of Colombian
populations by means of uniparental and biparental DNA markers. Am.
J. Phys. Anthropol. 143, 13-20, (2010).
56 Corach, D. et al. Inferring continental ancestry of Argentineans from
autosomal, Y-chromosomal and mitochondrial DNA. Ann. Hum. Genet.
74, 65-76, (2010).
57 Redd, A. J. et al. Gene flow from the Indian subcontinent to Australia:
evidence from the Y chromosome. Curr. Biol. 12, 673-677, (2002).
32
58 Bergstrom, A. et al. Deep roots for Aboriginal Australian Y
chromosomes. Curr. Biol. 26, 809-813, (2016).
59 Wei, W., Ayub, Q., Xue, Y. & Tyler-Smith, C. A comparison of Y-
chromosomal lineage dating using either resequencing or Y-SNP plus
Y-STR genotyping. Forensic Sci. Int. Genet. 7, 568-572, (2013).
60 Ilumae, A. M. et al. Human Y chromosome haplogroup N: a non-trivial
time-resolved phylogeography that cuts across language families. Am.
J. Hum. Genet. 99, 163-173, (2016).
61 Batini, C. et al. Large-scale recent expansion of European patrilineages
shown by population resequencing. Nat. Commun. 6, 7152, (2015).
62 Balaresque, P. et al. A predominantly Neolithic origin for European
paternal lineages. PLoS Biol. 8, e1000285, (2010).
63 Allentoft, M. E. et al. Population genomics of Bronze Age Eurasia.
Nature 522, 167-172, (2015).
64 Haak, W. et al. Massive migration from the steppe was a source for
Indo-European languages in Europe. Nature 522, 207-211, (2015).
65 Foster, E. A. et al. Jefferson fathered slave's last child. Nature 396, 27-
28, (1998).
66 King, T. E. & Jobling, M. A. Founders, drift and infidelity: the
relationship between Y chromosome diversity and patrilineal surnames.
Mol. Biol. Evol. 26, 1093-1102, (2009).
67 Martinez-Cadenas, C. et al. The relationship between surname
frequency and Y chromosome variation in Spain. Eur. J. Hum. Genet.
24, 120-128, (2016).
68 Sole-Morata, N., Bertranpetit, J., Comas, D. & Calafell, F. Y-
chromosome diversity in Catalan surname samples: insights into
surname origin and frequency. Eur. J. Hum. Genet. 23, 1549-1557,
(2015).
69 McEvoy, B. & Bradley, D. G. Y-chromosomes and the extent of
patrilineal ancestry in Irish surnames. Hum. Genet. 119, 212-219,

33
(2006).
70 Greeff, J. M. & Erasmus, J. C. Three hundred years of low non-
paternity in a human population. Heredity 115, 396-404, (2015).
71 Larmuseau, M. H. et al. Low historical rates of cuckoldry in a Western
European human population traced by Y-chromosome and
genealogical data. Proc. Biol. Sci. 280, 20132400, (2013).
72 King, T. E., Ballereau, S. J., Schürer, K. & Jobling, M. A. Genetic
signatures of coancestry within surnames. Curr. Biol. 16, 384-388,
(2006).
73 Gymrek, M., McGuire, A. L., Golan, D., Halperin, E. & Erlich, Y.
Identifying personal genomes by surname inference. Science 339, 321-
324, (2013).
74 King, T. E. & Jobling, M. A. What's in a name? Y chromosomes,
surnames and the genetic genealogy revolution. Trends Genet. 25,
351-360, (2009).
75 Rocca, R. A. et al. Discovery of Western European R1b1a2 Y
chromosome variants in 1000 genomes project data: an online
community approach. PLoS One 7, e41634, (2012).
76 Balanovsky, O. et al. Phylogeography of human Y-chromosome
haplogroup Q3-L275 from an academic/citizen science collaboration.
BMC Evol. Biol. 17, 18, (2017).
77 Sinclair, A. H. et al. A gene from the human sex-determining region
encodes a protein with homology to a conserved DNA-binding motif.
Nature 346, 240-244, (1990).
78 Berta, P. et al. Genetic evidence equating SRY and the testis-
determining factor. Nature 348, 448-450, (1990).
79 Vogt, P. H. et al. Human Y chromosome azoospermia factors (AZF)
mapped to different subregions in Yq11. Hum. Mol. Genet. 5, 933-943,
(1996).
80 Tyler-Smith, C. & Krausz, C. The will-o'-the-wisp of genetics--hunting
34
for the azoospermia factor gene. N. Engl. J. Med. 360, 925-927,
(2009).
81 Ramathal, C. et al. DDX3Y gene rescue of a Y chromosome AZFa
deletion restores germ cell formation and transcriptional programs. Sci.
Rep. 5, 15041, (2015).
82 Wang, Q. J. et al. Y-linked inheritance of non-syndromic hearing
impairment in a large Chinese family. J. Med. Genet. 41, E80, (2004).
83 Wang, Q. et al. Genetic basis of Y-linked hearing impairment. Am. J.
Hum. Genet. 92, 301-306, (2013).
Genetic investigation of the only simple heritable disorder thus far mapped to the Y chromosome, showing that its basis was an insertion of DNA from chromosome 1, and illustrating why simple Y-linked genetic disorders are so rare.
84 Charchar, F. J. et al. Inheritance of coronary artery disease in men: an
analysis of the role of the Y chromosome. Lancet 379, 915-922, (2012).
85 Giachini, C. et al. TSPY1 copy number variation influences
spermatogenesis and shows differences among Y lineages. J. Clin.
Endocrinol. Metab. 94, 4016-4022, (2009).
86 Shen, Y. et al. A significant effect of the TSPY1 copy number on
spermatogenesis efficiency and the phenotypic expression of the gr/gr
deletion. Hum. Mol. Genet. 22, 1679-1695, (2013).
87 Giachini, C. et al. Partial AZFc deletions and duplications: clinical
correlates in the Italian population. Hum. Genet. 124, 399-410, (2008).
88 Rozen, S. G. et al. AZFc deletions and spermatogenic failure: a
population-based survey of 20,000 Y chromosomes. Am. J. Hum.
Genet. 91, 890-896, (2012).
The largest study so far of Y-chromosomal deletions in men who were not ascertained on the basis of spermatogenic failure, reporting a deletion of some kind in one in 27 men.
35
89 Sato, Y. et al. Y chromosome gr/gr subdeletion is associated with lower
semen quality in young men from the general Japanese population but
not in fertile Japanese Men. Biol. Reprod. 90, 116, (2014).
90 Nathanson, K. L. et al. The Y deletion gr/gr and susceptibility to
testicular germ cell tumor. Am. J. Hum. Genet. 77, 1034-1043, (2005).
91 Printzlau, F., Wolstencroft, J. & Skuse, D. H. Cognitive, behavioral, and
neural consequences of sex chromosome aneuploidy. J. Neurosci.
Res. 95, 311-319, (2017).
92 Schoemaker, M. J. et al. Mortality in women with turner syndrome in
Great Britain: a national cohort study. J. Clin. Endocrinol. Metab. 93,
4735-4742, (2008).
93 Higgins, C. D., Swerdlow, A. J., Schoemaker, M. J., Wright, A. F. &
Jacobs, P. A. Mortality and cancer incidence in males with Y polysomy
in Britain: a cohort study. Hum. Genet. 121, 691-696, (2007).
94 Fisher, E. M. C. et al. Homologous ribosomal protein genes on the
human X and Y chromosomes: escape from inactivation and possible
implications for Turner syndrome. Cell 63, 1205-1218, (1990).
95 Jacobs, P. A., Brunton, M., Court Brown, W. M., Doll, R. & Goldstein,
H. Change of human chromosome count distribution with age:
evidence for a sex differences. Nature 197, 1080-1081, (1963).
96 Forsberg, L. A. et al. Mosaic loss of chromosome Y in peripheral blood
is associated with shorter survival and higher risk of cancer. Nat.
Genet. 46, 624-628, (2014).
The study that reinvigorated investigation of the medical consequences of somatic loss of the Y chromosome in aging men.
97 Dumanski, J. P. et al. Mutagenesis. Smoking is associated with mosaic
loss of chromosome Y. Science 347, 81-83, (2015).
98 Dumanski, J. P. et al. Mosaic loss of chromosome Y in blood is
36
associated with Alzheimer Disease. Am. J. Hum. Genet. 98, 1208-
1219, (2016).
99 Ganster, C. et al. New data shed light on Y-loss-related pathogenesis
in myelodysplastic syndromes. Genes Chromosomes Cancer 54, 717-
724, (2015).
100 Noveski, P. et al. Loss of Y chromosome in peripheral blood of
colorectal and prostate cancer patients. PLoS One 11, e0146264,
(2016).
101 Zhou, W. et al. Mosaic loss of chromosome Y is associated with
common variation near TCL1A. Nat. Genet. 48, 563-568, (2016).
102 Wright, D. J. et al. Genetic variants associated with mosaic Y
chromosome loss highlight cell cycle genes and overlap with cancer
susceptibility. Nat. Genet. doi: 10.1038/ng.3821, (2017).
103 Wong, H. Y. et al. TMSB4Y is a candidate tumor suppressor on the Y
chromosome and is deleted in male breast cancer. Oncotarget 6,
44927-44940, (2015).
104 Santos, F. R., Pandya, A. & Tyler-Smith, C. Reliability of DNA-based
sex tests. Nat. Genet. 18, 103, (1998).
105 Jobling, M. A. et al. Structural variation on the short arm of the human
Y chromosome: recurrent multigene deletions encompassing
Amelogenin Y. Hum. Mol. Genet. 16, 307-316, (2007).
106 Wei, W. et al. Copy number variation in the human Y chromosome in
the UK population. Hum. Genet. 134, 789-800, (2015).
107 Fernandes, S. et al. A large AZFc deletion removes DAZ3/DAZ4 and
nearby genes from men in Y haplogroup N. Am. J. Hum. Genet. 74,
180-187, (2004).
108 Repping, S. et al. A family of human Y chromosomes has dispersed
throughout northern Eurasia despite a 1.8-Mb deletion in the
azoospermia factor c region. Genomics 83, 1046-1052, (2004).
109 Wilson Sayres, M. A., Lohmueller, K. E. & Nielsen, R. Natural selection
37
reduced diversity on human Y chromosomes. PLoS Genet. 10,
e1004064, (2014).
110 Rozen, S., Marszalek, J. D., Alagappan, R. K., Skaletsky, H. & Page,
D. C. Remarkably little variation in proteins encoded by the Y
chromosome's single-copy genes, implying effective purifying selection.
Am. J. Hum. Genet. 85, 923-928, (2009).
111 Jobling, M. A. et al. A selective difference between human Y-
chromosomal DNA haplotypes. Curr. Biol. 8, 1391-1394, (1998).
112 Goodwin, S., McPherson, J. D. & McCombie, W. R. Coming of age: ten
years of next-generation sequencing technologies. Nat. Rev. Genet.
17, 333-351, (2016).
113 Chaisson, M. J., Wilson, R. K. & Eichler, E. E. Genetic variation and
the de novo assembly of human genomes. Nat. Rev. Genet. 16, 627-
640, (2015).
114 Haber, M., Mezzavilla, M., Xue, Y. & Tyler-Smith, C. Ancient DNA and
the rewriting of human history: be sparing with Occam's razor. Genome
Biol. 17, 1, (2016).
115 Balanovsky, O. et al. Genetic differentiation between upland and
lowland populations shapes the Y‑chromosomal landscape of West
Asia. Hum. Genet. 36, 437-450, (2017).
116 Wise, A. L., Gyi, L. & Manolio, T. A. eXclusion: toward integrating the X
chromosome in genome-wide association analyses. Am. J. Hum.
Genet. 92, 643-647, (2013).
117 Ledford, H. AstraZeneca launches project to sequence 2 million
genomes. Nature 532, 427, (2016).
118 Marx, V. The DNA of a nation. Nature 524, 503-505, (2015).
119 Sekido, R. & Lovell-Badge, R. Sex determination involves synergistic
action of SRY and SF1 on a specific Sox9 enhancer. Nature 453, 930-
934, (2008).
120 Cortez, D. et al. Origins and functional evolution of Y chromosomes
38
across mammals. Nature 508, 488-493, (2014).
121 Lahn, B. T. & Page, D. C. Four evolutionary strata on the human X
chromosome. Science 286, 964-967, (1999).
122 Page, D. C., Harper, M. E., Love, J. & Botstein, D. Occurrence of a
transposition from the X-chromosome long arm to the Y-chromosome
short arm during human evolution. Nature 311, 119-122, (1984).
123 Repping, S. et al. Polymorphism for a 1.6-Mb deletion of the human Y
chromosome persists through balance between recurrent mutation and
haploid selection. Nat. Genet. 35, 247-251, (2003).
124 Ross, M. T. et al. The DNA sequence of the human X chromosome.
Nature 434, 325-337, (2005).
125 Rozen, S. et al. Abundant gene conversion between arms of massive
palindromes in human and ape Y chromosomes. Nature 423, 873-876,
(2003).
126 Hallast, P., Balaresque, P., Bowden, G. R., Ballereau, S. J. & Jobling,
M. A. Recombination dynamics of a human Y-chromosomal
palindrome: rapid GC-biased gene conversion, multi-kilobase
conversion tracts, and rare inversions. PLoS Genet. 9, e1003666,
(2013).
127 Balaresque, P. et al. Gene conversion violates the stepwise mutation
model for microsatellites in Y-chromosomal palindromic repeats. Hum.
Mutat. 35, 609-617, (2014).
128 Trombetta, B., Cruciani, F., Underhill, P. A., Sellitto, D. & Scozzari, R.
Footprints of X-to-Y gene conversion in recent human evolution. Mol.
Biol. Evol. 27, 714-725, (2010).
129 Rosser, Z. H., Balaresque, P. & Jobling, M. A. Gene conversion
between the X chromosome and the male-specific region of the Y
chromosome at a translocation hotspot. Am. J. Hum. Genet. 85, 130-
134, (2009).
130 Trombetta, B., Sellitto, D., Scozzari, R. & Cruciani, F. Inter- and
39
intraspecies phylogenetic analyses reveal extensive X-Y gene
conversion in the evolution of gametologous sequences of human sex
chromosomes. Mol. Biol. Evol. 31, 2108-2123, (2014).
131 Berg, I. L. et al. PRDM9 variation strongly influences recombination
hot-spot activity and meiotic instability in humans. Nat. Genet. 42, 859-
863, (2010).
132 Crow, J. F. The origins, patterns and implications of human
spontaneous mutation. Nat. Rev. Genet. 1, 40-47, (2000).
133 Segurel, L., Wyman, M. J. & Przeworski, M. Determinants of mutation
rate variation in the human germline. Annu. Rev. Genomics Hum.
Genet. 15, 47-70, (2014).
134 Kayser, M. Forensic use of Y-chromosome DNA: a general overview.
Hum. Genet. doi: 10.1007/s00439-017-1776-9, (2017).
135 Prinz, M., Ishii, A., Coleman, A., Baum, H. J. & Shaler, R. C. Validation
and casework application of a Y chromosome specific STR multiplex.
Forensic Sci. Int. 120, 177-188, (2001).
136 Ballantyne, K. N. et al. Mutability of Y-chromosomal microsatellites:
rates, characteristics, molecular bases, and forensic implications. Am.
J. Hum. Genet. 87, 341-353, (2010).
137 Ballantyne, K. N. et al. A new future of forensic Y-chromosome
analysis: rapidly mutating Y-STRs for differentiating male relatives and
paternal lineages. Forensic Sci. Int. Genet. 6, 208-218, (2012).
138 1000 Genomes Project Consortium et al. A global reference for human
genetic variation. Nature 526, 68-74, (2015).
AcknowledgementsCTS was supported by The Wellcome Trust (098051).
The authors declare no competing interests.
40
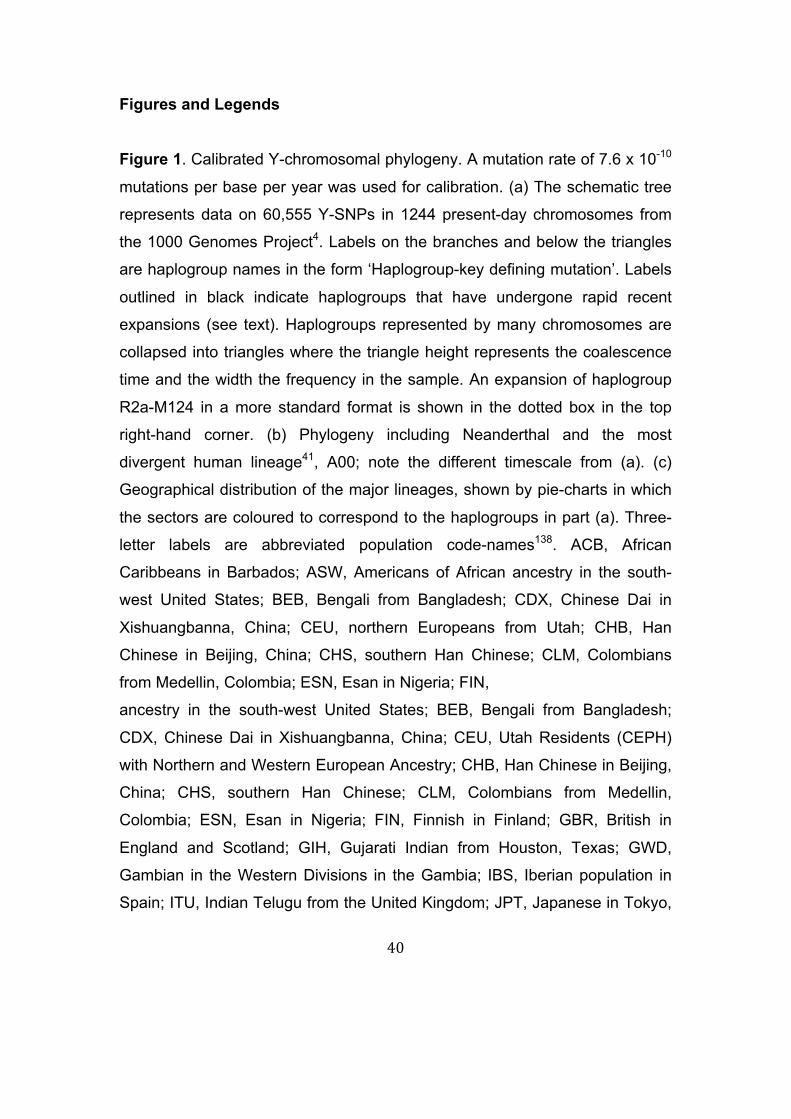
Figures and Legends Figure 1. Calibrated Y-chromosomal phylogeny. A mutation rate of 7.6 x 10⁻¹⁰
mutations per base per year was used for calibration. (a) The schematic tree
represents data on 60,555 Y-SNPs in 1244 present-day chromosomes from
the 1000 Genomes Project4. Labels on the branches and below the triangles
are haplogroup names in the form ‘Haplogroup-key defining mutation’. Labels
outlined in black indicate haplogroups that have undergone rapid recent
expansions (see text). Haplogroups represented by many chromosomes are
collapsed into triangles where the triangle height represents the coalescence
time and the width the frequency in the sample. An expansion of haplogroup
R2a-M124 in a more standard format is shown in the dotted box in the top
right-hand corner. (b) Phylogeny including Neanderthal and the most
divergent human lineage41, A00; note the different timescale from (a). (c)
Geographical distribution of the major lineages, shown by pie-charts in which
the sectors are coloured to correspond to the haplogroups in part (a). Three-
letter labels are abbreviated population code-names138. ACB, African
Caribbeans in Barbados; ASW, Americans of African ancestry in the south-
west United States; BEB, Bengali from Bangladesh; CDX, Chinese Dai in
Xishuangbanna, China; CEU, northern Europeans from Utah; CHB, Han
Chinese in Beijing, China; CHS, southern Han Chinese; CLM, Colombians
from Medellin, Colombia; ESN, Esan in Nigeria; FIN,
ancestry in the south-west United States; BEB, Bengali from Bangladesh;
CDX, Chinese Dai in Xishuangbanna, China; CEU, Utah Residents (CEPH)
with Northern and Western European Ancestry; CHB, Han Chinese in Beijing,
China; CHS, southern Han Chinese; CLM, Colombians from Medellin,
Colombia; ESN, Esan in Nigeria; FIN, Finnish in Finland; GBR, British in
England and Scotland; GIH, Gujarati Indian from Houston, Texas; GWD,
Gambian in the Western Divisions in the Gambia; IBS, Iberian population in
Spain; ITU, Indian Telugu from the United Kingdom; JPT, Japanese in Tokyo,
41
Japan; KHV, Kinh in Ho Chi Minh City, Vietnam; LWK, Luhya in Webuye,
Kenya; MSL, Mende in Sierra Leone; MXL, Mexican ancestry from Los
Angeles, United States; PEL, Peruvians from Lima, Peru; PJL, Punjabi from
Lahore, Pakistan; PUR, Puerto Ricans from Puerto Rico; STU, Sri Lankan
Tamil from the United Kingdom; TSI, Toscani in Italia; YRI, Yoruba in Ibadan,
Nigeria. kya, thousand years ago.
Parts a and c are from REF. [4], Nature Publishing Group.
Part b is adapted with permission from REF. [41], [Elsevier].
42
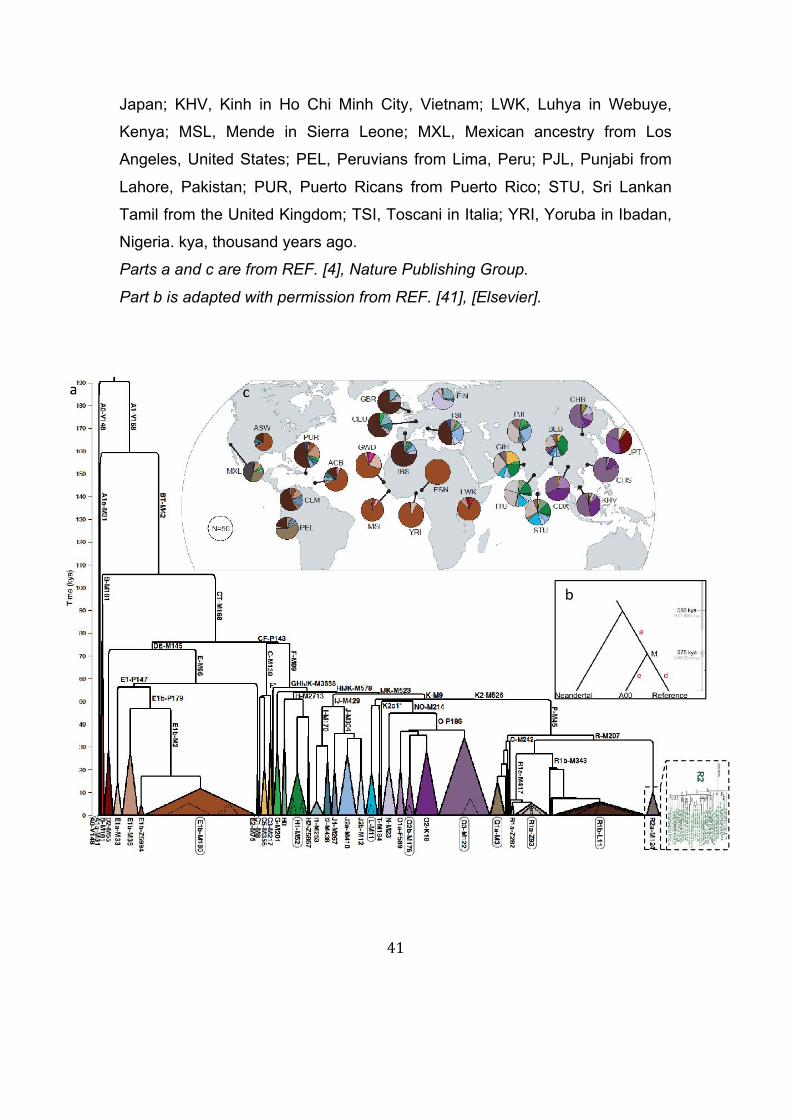
Figure 2: Comparison of demographic histories of females and males revealed by mtDNA and Y-chromosome analysis. a) Bayesian skyline plots (BSPs) of effective population size against time based on sequences of mtDNAs, in 320 individuals, with different world regions indicated by colours. The major expansion is between ~20 and ~14 kya. b) BSPs for Y chromosomes in the same samples, with colouring as in part (a). Important features are an early expansion at ~60 kya and a contraction and rapid expansion within the last 10 ky. Note the difference in scales of the y-axes, and the greater female effective population size reflected in mtDNAs. Parts a and b are adapted with permission from REF. [27], [CSHL Press]. c) Frequencies of four selected Y haplogroups in ancient DNA samples from Europe, showing the recent rise of haplogroup R1b, and previous high frequencies of the currently rare haplogroups I2 and G. Ancient data are from the summary at www.ancestraljourneys.org, and modern data from ref. 138. Parts a and b are adapted from REF. 27.
43
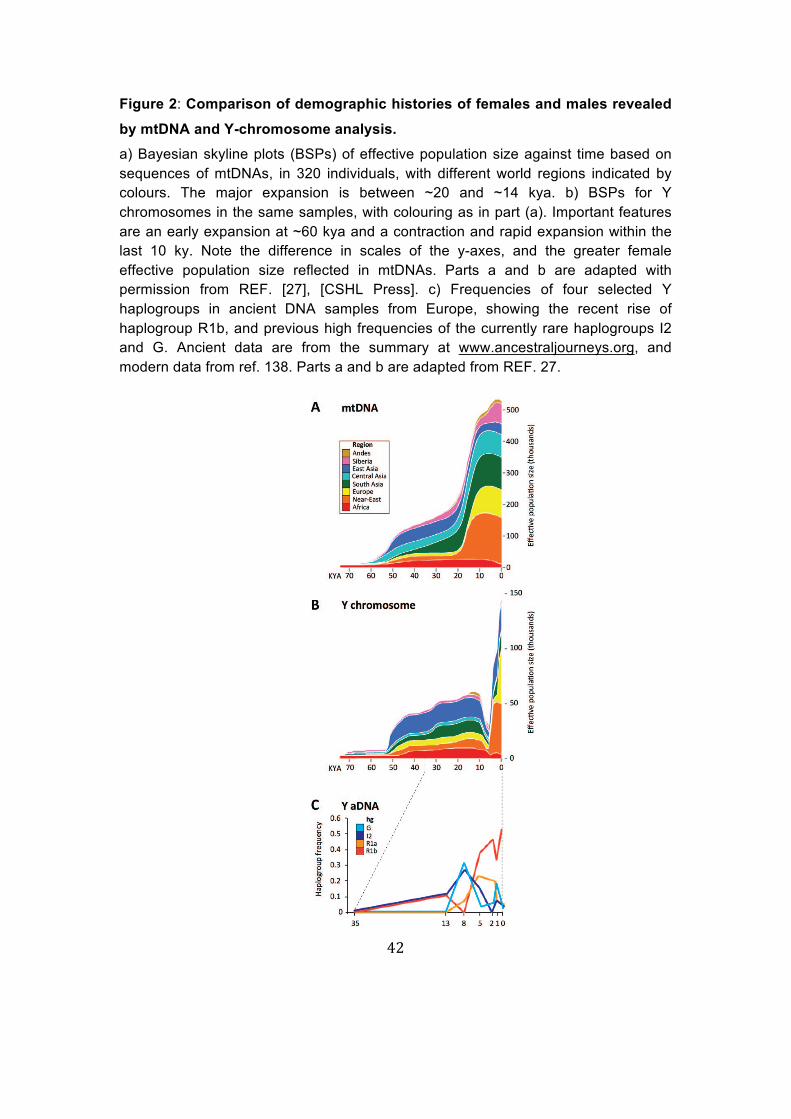
Figure 3. Loss of Y (LOY) in blood samples and its medical consequences.
(a) LOY increases with age. The fraction of men with LOY is shown for
different age groups; error bars show 95% confidence intervals. (b) LOY is
associated with increased mortality from all causes. The numbers above the
horizontal axis are the 50% survival times for this elderly cohort, and are 5.5
years shorter for men with LOY. (c) LOY is associated with cancer mortality.
(d) LOY is associated with increased probability of diagnosis with Alzheimer
Disease (AD).
Part a is from REF. [101], Nature Publishing Group. Parts b and c are from
REF. [96], Nature Publishing Group.Part d is adapted with permission from
REF. [98], [Elsevier].
44
GlossarytermsAdmixture: The mixing of distinct parental populations resulting in a new
hybrid population.
Bayesian skyline plot: A plot of effective population size against time,
summarizing the demographic history of a population.
Callable: Describes DNA sequence in which reliable genotype calls can be
made in next-generation sequencing because of unambiguous mapping of
reads to the reference sequence.
Euchromatin: The part of the genome that is in an extended conformation
and which contains transcriptionally active DNA.
Gametologues: Similar sequences on the X and Y chromosomes, which
share an origin in the ancestral autosomal pair from which the current X and Y
have evolved.
Gene conversion: A nonreciprocal exchange of sequence information
between one DNA molecule and another. Non-allelic gene conversion is
active between repeat sequences on the Y chromosome.
Genetic drift: The random fluctuation of allele frequencies in a population due
to chance variations in the contribution of each individual to the next
generation.
Genome-wide association studies: Studies of many common genome-wide
variants (usually SNPs) in different individuals to determine if any variant is
associated with a trait
Haplogroups: related sets of Y-chromosomes collectively defined by specific
slowly-mutating binary polymorphisms (usually SNPs).
Haploid: Of a chromosome, having one copy per cell.
Heterochromatin: A highly condensed, transcriptionally inert segment of the
genome, often composed of repeated DNA sequences. On the Y, found
mainly near the centromere and in the distal half of the long arm.
Hotspots: short (few kilobases) regions of the genome in which meiotic
crossing over is significantly elevated over the genome average.
45
Induced pluripotent stem cells - a type of stem cell that can be directly
generated from adult cells and differentiated into many cellular types.
Maximum parsimony: A method for selecting the best evolutionary tree from
a set of alternatives on the basis of which contains the fewest mutational
changes.
Minisatellites: DNA sequence containing a variable number (~10 to >1000)
of tandemly-arranged repeat units, each typically 10–100 bp in length.
Mitochondrial DNA (mtDNA): The circular, maternally-inherited genome
carried by the mitochondrion, a cellular organelle.
Neutral: Describing genetic variation that has no effect on selective fitness.
Phylogeny: A tree-like diagram that represents the evolutionary relationships
among a set of sequences.
Phylogeography: Analysis of the geographical distributions of different
clades within a phylogeny, such as haplogroups in the Y phylogeny.
Pseudoautosomal: Describing the behaviour of two regions of the sex
chromosomes that display inheritance from both parents due to crossing over
between the X and Y chromosomes in male meiosis.
Resequencing: Taking a particular known sequence from an existing source,
or an entire genome, and determining it in several different individuals as a
means to discover sequence variation.
Sertoli cells: Cells located in the walls of the seminiferous tubules of the
testis, which act to support the development of sperm.
Short-tandem repeat (STR): A DNA sequence containing a number (usually
≤50) of tandemly repeated short (2–6-bp) sequences, such as (GATA)n. Often
polymorphic, and also known as a microsatellite.
Ascertainment bias: Bias in a dataset caused by the way that DNA
sequence variants are identified, or samples are collected. Outgroup: A lineage or species that is more distantly related to a group of
lineages or species than any of them is to each other. Population stratification: Systematic differences in allele frequencies
46
between subgroups within a population.
Deep-rooting: Describing a human pedigree containing the descendants of
common ancestors who lived several or many generations ago. Author Biographies
Mark A. Jobling Mark Jobling is a Professor in the Department of Genetics at the University of
Leicester, UK. His research is in the area of human genetic diversity and the
forces that pattern it, from mutation dynamics to cultural factors in
populations. He has a long-term interest in the Y chromosome and its many
peculiarities, exploiting this male-specific marker in studies of population
history, sex-biased admixture, mutation processes, forensic analysis and
genetic genealogy. His current research projects exploit the power of next-
generation sequencing in evolutionary and forensic applications in humans
and other animals.
Chris Tyler-Smith Chris Tyler-Smith heads the Human Evolution team at The Wellcome Trust
Sanger Institute, UK. His interests are in understanding worldwide genetic
variation in humans (including on the Y chromosome) and closely-related
species such as gorillas or chimpanzees, and how this information can be
used to understand the human past. How have humans spread around the
world, diverged, mixed, and adapted to their environments throughout
prehistoric and historic times? Investigating these questions involves both
generating and analyzing new genomic data, and in some cases functional
studies such as in people with natural gene knockouts or in genetically
modified mice.
47
Key Points 1. As a consequence of its key role in male sex determination, the Y
chromosome has unique genetic properties that lead to it carrying
highly-informative haplotypes that evolve largely by the simple
accumulation of mutations.
2. Advances in technology have allowed approximately 10 Mb of Y-
chromosomal DNA to be sequenced from large population samples,
with consequent unbiased ascertainment of their genetic variation.
3. Y-chromosomal sequences can be assembled into a robust phylogeny,
which can be calibrated using estimates of the mutation rate from
family studies, known archaeological events, or ancient DNA samples.
4. The calibrated Y-chromosomal phylogeny reveals male expansions
corresponding to the migration of modern humans out of Africa around
60,000 years ago, the colonisation of the Americas around 15,000
years ago, and more recent technology-driven population expansions.
5. The Y chromosome has a specialist role in forensic genetics, allowing
male-specific DNA profiles to be compared at increasingly high
resolution.
6. In genealogical studies, the male-line inheritance of the Y chromosome
makes it a perfect tool for studies of male family history, creating a
burgeoning area of citizen science.
7. The Y chromosome is central to disorders of sex determination and
spermatogenesis. Recently, mosaic somatic loss of the Y chromosome
in aging men has been associated with increased risk of cancer
mortality and Alzheimer Disease.


![14 Chromosome and Human Genetics[REVISED]](https://img.pdfslide.net/doc/110x75/56d6bf5a1a28ab301695e65a/14-chromosome-and-human-geneticsrevised.jpg)