Embed Size (px)
Citation preview

1
Humanitarian Supply Chain Performance Management:
Development and Evaluation of a Comprehensive
Performance Measurement Framework Based on the
Balanced Scorecard
Munich Business School Working Paper
2016-02
Alexandra Sauer Munich Business School [email protected] Prof. Dr. Patricia Kraft Munich Business School [email protected] Prof. Dr. Carsten Rennhak Universität der Bundeswehr [email protected] Munich Business School Working Paper Series, ISSN 2367-3869
2
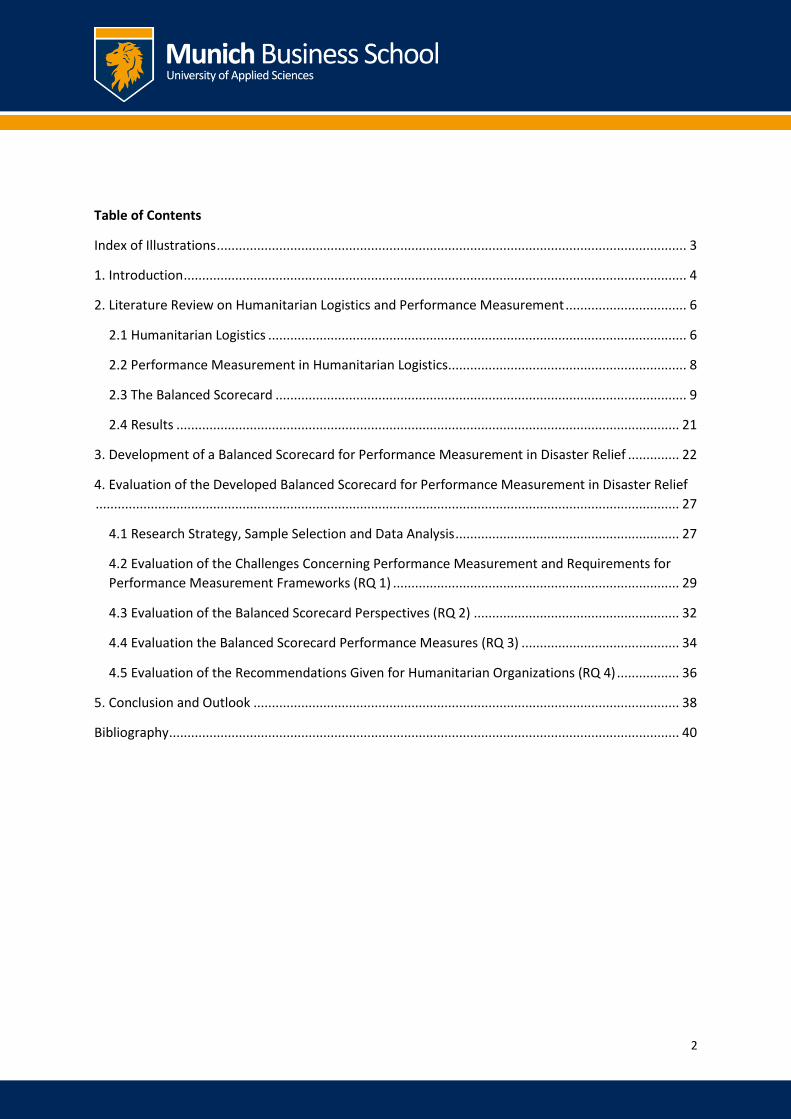
Table of Contents
Index of Illustrations ................................................................................................................................ 3
1. Introduction ......................................................................................................................................... 4
2. Literature Review on Humanitarian Logistics and Performance Measurement ................................. 6
2.1 Humanitarian Logistics .................................................................................................................. 6
2.2 Performance Measurement in Humanitarian Logistics ................................................................. 8
2.3 The Balanced Scorecard ................................................................................................................ 9
2.4 Results ......................................................................................................................................... 21
3. Development of a Balanced Scorecard for Performance Measurement in Disaster Relief .............. 22
4. Evaluation of the Developed Balanced Scorecard for Performance Measurement in Disaster Relief
............................................................................................................................................................... 27
4.1 Research Strategy, Sample Selection and Data Analysis ............................................................. 27
4.2 Evaluation of the Challenges Concerning Performance Measurement and Requirements for
Performance Measurement Frameworks (RQ 1) .............................................................................. 29
4.3 Evaluation of the Balanced Scorecard Perspectives (RQ 2) ........................................................ 32
4.4 Evaluation the Balanced Scorecard Performance Measures (RQ 3) ........................................... 34
4.5 Evaluation of the Recommendations Given for Humanitarian Organizations (RQ 4) ................. 36
5. Conclusion and Outlook .................................................................................................................... 38
Bibliography ........................................................................................................................................... 40

3
Index of Illustrations
Ill. 1: Commercial sector vs. non-profit sector strategy map ................................................................ 11
Ill. 2: Sources related to the use and applicability of the BSC in humanitarian logistics ...................... 12
Ill. 3: BSC approach centered around national policies for natural disaster management in project life
cycle phases ................................................................................................................................... 13
Ill. 4: BSC objectives in the emergency relief phase .............................................................................. 14
Ill. 5: IFRC Development Indicator Tool after the pilot phase ............................................................... 15
Ill. 6: Reference mission map for humanitarian supply chain management ........................................ 17
Ill. 7: BSC strategy map for performance measurement in humanitarian logistics .............................. 19
Ill. 8: Evaluation of the BSC based on the evaluation criteria by Caplice and Sheffi ............................. 20
Ill. 9: Balanced Scorecard for performance measurement in disaster relief ........................................ 24
Ill. 10: Perspectives, sub-categories and objectives of the BSC for performance measurement in
disaster relief ................................................................................................................................. 25
Ill. 11: Overview of interview partners .................................................................................................. 28
Ill. 12: Distribution of the performance measures chosen by the interviewees ................................... 35
Ill. 13: Performance measures chosen by four out of five interviewees .............................................. 36

4
1. Introduction
The number of natural disasters has steadily been increasing since 1960 (EM-DAT 2015). This
increasing frequency is accompanied by an increased severity in terms of individuals injured or killed
as well as the scale of the financial impact of these events (Tatham and Hughes 2011, 66). According
to Munich Re’s NatCatSERVICE database (2015), which is the most comprehensive natural
catastrophe loss database in the world, eight out of the top ten deadliest as well as costliest natural
disasters that were recorded between 1980 and 2014 have happened since 2003. Not only natural
disasters, but also manmade disasters are expected to increase another five-fold over the next fifty
years due to environmental degradation, rapid urbanization as well as the spread of diseases in the
developing world (Thomas and Kopczak 2005, 1). Furthermore, the world faces many structural
problems like hunger, lack of proper sanitation and displacement (Van der Laan, Brito and Vergunst
2009, 23). Therefore, the global demand for humanitarian assistance, especially with regard to
disaster relief, is rising and will continue to rise (Christopher and Tatham 2011, 1; Thomas and
Kopczak 2005, 1).
Van Wassenhove (2006, 475) estimates that around 80 percent of the expenditures of aid agencies
are in the area of supply chain management. Consequently, measuring and optimizing the
performance of their relief chains has become critical for all organizations involved in disaster
management (Beamon and Balcik 2008, 5). Given the contributions of US$24.5 billion that
international humanitarian assistance received in 2014 (GHA 2015, 2), the resultant procurement and
logistical spend of around US$19.5 billion provide an enormous potential for improvement and thus
a substantial benefit to those affected by disasters (Christopher and Tatham 2011, 2).
While performance measurement has long been recognized as an important competitive advantage
(Kaplan and Norton 1992; 1996) and a critical element to improving the efficiency and effectiveness
of commercial supply chains, measuring performance in a structured and standardized way
unfortunately is still not common in the humanitarian context (Van der Laan, Brito and Vergunst
2009, 24). As of 2010, only 20 percent of humanitarian organizations consistently monitored and
reported their performance (Blecken 2010, 677).
Due to the distinctive legal and financial status of non-profit organizations, it is difficult to assess
their performance using common measures (e.g. profitability) of for profit organizations (Forbes
1998, 184). Furthermore, unlike the private sector, which often focuses solely on the financial

5
bottom line, non-profit organizations have two major bottom lines: mission effectiveness and
financial sustainability (Beamon and Balcik 2008, 10).
Against the background of for-profit companies realizing in the late 1980s and early 1990s that
financial measures alone are inadequate for measuring performance as they communicate little
about long-term value creation, Robert Kaplan and David Norton introduced the Balanced Scorecard
model (BSC) in 1992 (Kaplan 2001, 454). This performance measurement system retained an
emphasis on financial measurements but complemented these with measurements from three other
perspectives: customer, internal business processes as well as learning and growth (Kaplan 2001,
354). Today, the BSC has become one of the most commonly used tools in performance management
and has been credited by the Harvard Business Review as one of the most important and influential
management tools of the 20th century (Bourne, Kennerly and Franco-Santos 2005, 373).
Even though the initial focus and application of the BSC was in the commercial sector, Kaplan (2001,
354) states that: “the opportunity for the scorecard to improve the management of non-profits
should be even greater.” Therefore, the objective of this paper is to develop and evaluate a
comprehensive performance measurement framework for humanitarian supply chains based on the
Balanced Scorecard model. This implies the identification of appropriate financial and non-financial
performance measures that will assess the performance of humanitarian supply chains in the context
of disaster relief. This paper is based on the assumption that a modified version of the Balanced
Scorecard can be used to improve the efficiency and effectiveness of supply chain processes in the
disaster relief context. It aims to answer the following research questions (RQ):
RQ1: What are the challenges concerning performance measurement in the disaster relief context
and what requirements should performance measurement frameworks meet?
RQ2: How do the four perspectives of the Balanced Scorecard need to be adapted in order to be
applicable in this context?
RQ3: What are appropriate performance measures to track in this context?
RQ4: What are recommendations for humanitarian organizations concerning the implementation
of the Balanced Scorecard as a performance measurement framework?
Humanitarian organizations typically engage in two broad types of activities: relief activities and
development activities. Whereas relief activities are short-term activities that aim at minimizing the

6
immediate risk after a disaster, development activities refer to longer-term aid focusing on
community self-sufficiency and sustainability (Beamon and Balcik, 2008, 5). This paper will focus on
supply chain performance measurement for relief activities.
2. Literature Review on Humanitarian Logistics and Performance Measurement
2.1 Humanitarian Logistics
There are numerous definitions of humanitarian logistics1 but the one that is adopted most
frequently in literature is the one given by Thomas and Kopczak (2005, 2). They define humanitarian
logistics as follows:
“(…) the process of planning, implementing and controlling the efficient, cost effective flow
and storage of goods and materials, as well as related information, from the point of origin to
the point of consumption for the purpose of alleviating the suffering of vulnerable people. The
function encompasses a range of activities, including preparedness, planning, procurement,
transport, warehousing, tracking and tracing, and customs clearance.”
Logistics is central to disaster relief because it is crucial to the speed and effectiveness of response,
because it accounts for a major part of the cost of aid agencies and because data captured by
logistics departments provide an important source for post event learning (Pettit et al. 2011, 104;
Thomas and Kopczak 2005, 2).
When comparing humanitarian supply chains to supply chains in the commercial field, there are
striking differences in terms of strategic goals, customer characteristics as well as demand
characteristics and order fulfillment:
(1) Strategic goals: While the strategic goal of the commercial supply chain is to produce high quality
goods at low cost in order to maximize profitability, to deliver financial returns to shareholders
and to satisfy customer demands, the strategic goal of humanitarian supply chains is to minimize
the loss of lives and to alleviate the suffering of vulnerable people given financial constraints
1 The terms ‘logistics’ and ‘supply chain management’ are used interchangeably in the humanitarian context
(Ertem, Buyurgan and Rossetti 2010, 203). Therefore, this paper also uses this interchangeability.

7
(Beamon and Balcik 2008, 10; Thomas and Kopczak 2005, 2). Hence, the resulting consequences
from delays in the supply chain are “only” a matter of reduced profitability and thus
dissatisfaction of shareholders and customers in the commercial environment whereas it is often
a matter of life or death in the humanitarian field, especially with regard to disaster relief
(Beamon and Balcik 2008, 10). Furthermore, setting and prioritizing goals in the humanitarian
context is complicated by the high number of stakeholders involved (e.g. donors, beneficiaries,
media) who all have different and possibly conflicting concerns and demands (McLachlin, Larson
and Khan 2009, 1050; Beamon and Balcik 2008, 11). Especially donors can have a high influence
on goal-setting through earmarking their donations for a certain disaster or with respect to
certain regions and usage (Wakolbinger and Toyasaki 2011, 38). As the focus of their donations is
usually on particular operations or projects activities (e.g. specific relief efforts), the
organizational infrastructure of aid agencies (e.g. information systems and techniques for
inventory control and distribution) is often lacking behind (Beamon and Balcik 2008, 11).
(2) Customer characteristics: While there is only one type of customer in the commercial supply chain
(those individuals that buy and receive a product or service), there are two types of customers in
the humanitarian supply chain that greatly differ from each other (Beamon and Balcik 2008, 12).
The primary customers of humanitarian organizations are the beneficiaries (those individuals that
receive aid). However, donors are also increasingly being considered as customers in the
humanitarian context as aid agencies provide them with the service of delivering aid to aid
recipients (De Leeuw 2010, 198; Beamon and Balcik 2008, 12). Especially the beneficiaries differ
considerably from customers in the commercial field as they neither have the luxury of market
choice nor do they have any formal contract specifying their entitlements (Hilhorst 2002, 204;
Beamon and Balcik 2008, 10).
(3) Demand characteristics and order fulfillment: While there is a predictable demand and a
predetermined set of suppliers in commercial supply chains, humanitarian supply chains are often
characterized by irregular demand and variability in supplies and suppliers (Kovács and Spens
2007, 108). Furthermore, whereas customers in the commercial sector may accept long lead
times, the time between the moment a demand occurs and the point supplies are needed in
sudden-onset disaster situations is usually close to zero (Beamon and Balcik 2008, 12).

8
2.2 Performance Measurement in Humanitarian Logistics
Neely, Gregory and Platts (1995, 1229) define performance measurement as the process of
quantifying the efficiency and effectiveness of an action using a set of performance metrics.
According to Parker (2000, 63) the purpose of measuring organizational performance is (1) to identify
success; (2) to identify whether customer requirements are met; (3) to help understand
organizational processes; (4) to identify problems, bottlenecks, waste etc.; (5) to ensure decisions are
based on facts rather than on supposition or emotion and (6) to show whether planned
improvements actually happened.
Performance measurement is particularly important in the humanitarian sector, where limited
resources have to be used in the most efficient and effective way (Abidi and Scholten 2015, 257).
Furthermore, the increased frequency and severity of natural and manmade disasters, the costs
involved in humanitarian supply chain operations as well as the growing competition for scarce
resources and donor funding, make performance measurement vital for all organizations involved in
disaster management (Beamon and Balcik 2008, 5 & 15; Santarelli et al. 2013, 1).
According to Poister (2003, 17), effective performance measurement systems can help public and
non-profit managers to make better decisions, to improve performance and to provide
accountability. Furthermore, performance measures provide feedback on agency performance and
help redirect resources more effectively. Performance measurement therefore allows for greater
control over operations while increasing flexibility at the operating level (Beamon and Balcik 2008,
15).
Yet, performance measurement systems have not been systematically implemented in the
humanitarian supply chain (Beamon and Balcik 2008, 5). According to Blecken (2010, 677) 55 percent
of all humanitarian organizations do not monitor any form of performance indicators for their supply
chain, while 25 percent only use a few performance indicators. Merely 20 percent of all humanitarian
organizations consistently measure the performance of their supply chains.
In a systematic literature review, Abidi, De Leeuw and Klumpp (2014, 597 et sqq.) evaluate the
current state of research on performance management in humanitarian supply chains. They conclude
that even though there are a variety of approaches, there is still a long way to go in research on
performance measurement in humanitarian supply chains. Only few performance measurement

9
frameworks have been empirically tested and likewise, relatively few humanitarian organizations
have contributed to research projects in the field.
Furthermore, result-based management is often very difficult to implement in humanitarian
organizations, as it is often problematic to determine the relationships between inputs and activities
as well short-term outputs, midterm outcomes and long-term outcomes (Abidi, De Leeuw and
Klumpp 2014, 599). Moreover, standard indicators are often unsatisfactory, as cultural nuances that
have an impact on activities are often not adequately accounted for (Abidi, De Leeuw and Klumpp
2014, 599).
Even though various performance measurement frameworks (e.g. SCOR Model or Performance
Prism) and indicators exist for traditional supply chains, the distinct characteristics of the
humanitarian environment cause many of these to be inappropriate or irrelevant (Beamon and
Kotleba 2006, 196; Abidi, De Leeuw and Klumpp 2014, 599). However, performance measurement
frameworks from the commercial sector are a useful starting point for the non-profit sector, and thus
for the humanitarian organizations (Moxham 2009, 755).
2.3 The Balanced Scorecard
Historically, performance measurement systems in the commercial sector have been financial
(Kaplan and Norton 1996, 21). However, these financial models failed to signal changes in the
companies economic value as they were making substantial investments in intangible assets (Kaplan
2001, 357) and thus gave misleading signals for continuous improvement and innovation (Kaplan and
Norton 1992, 71). For this reason, Robert Kaplan and David Norton developed the Balanced
Scorecard model in the late 1980s and early 1990s. This performance measurement framework
provides executives with a comprehensive and transparent overview of the vision and strategy of
their organization from four different perspectives: financial, customer, internal business process,
and learning and growth (Kaplan and Norton 1996, 25). It links a company’s strategic objectives to
performance measures, sets targets and aligns them with strategic initiatives (Kaplan and Norton
1996, 10). The performance measures of the BSC do not only represent a balance between financial
and non-financial measures, but also between external and internal measures, short- and long-term
measures as well as outcome measures and performance drivers of these outcomes (Kaplan and
Norton 1996, 10). The BSC provides managers with information from four different perspectives

10
while at the same time minimizing information overload through a limited number of measures
(Kaplan and Norton 1992, 72).
Even though the performance measures are derived from the individual organization’s strategy
(1996, 44) there are some generic measures that show up in most organizations’ Balanced
Scorecards. Amongst others, these include e.g. return on investment and economic value added
(financial perspective), customer satisfaction, retention, market share and account share (customer
perspective), quality, response time, cost and new product introductions (internal business process
perspective) as well as employee satisfaction and information system availability (learning and
growth perspective).
The Balanced Scorecard was later supplemented with the so-called strategy map, a tool that provides
a visualization of the cause-and-effect relationships that exist among the strategic objectives of a
company (Kaplan and Norton 2004, 6). Kaplan and Norton (2000, 170) suggest that the best way to
build such a strategy map is from the top down. This process starts with a review of the company’s
mission statement and core values in order to determine the “destination”. Then, the strategy must
define the logic of how to arrive at this destination. Starting with the long-run financial objectives,
sequences of actions must be identified within the financial, customer, internal business process and
finally the learning and growth perspective that deliver the desired long-term economic performance
(Kaplan and Norton 1996, 62).
While the initial focus and application of the Balanced Scorecard was in the commercial sector,
Kaplan (2001, 354) states that the opportunity for the BSC to improve the management of non-
profits should be even greater. The reasoning behind his statement is as follows:
“For profit-seeking corporations, the financial perspective provides a clear long-run objective,
but it provides a constraint rather than an objective for nonprofits. Although these
organizations must certainly monitor their spending and comply with financial budgets, their
success cannot be measured by how closely they keep spending to budgeted amounts, or
even if they restrain spending so that actual expenses are kept well below budgeted
amounts.”
Starting in 1996, Kaplan conducted a multiyear action research program to apply the Balanced
Scorecard to several non-profit organizations. Based on the results from this research program,

11
Kaplan (2001, 360 et seq.) suggests three adaptations that are necessary to apply the Balanced
Scorecard in the non-profit sector:
(1) Placing the customer perspective at the top of the Balanced Scorecard: In the original architecture
of the Balanced Scorecard, the financial perspective was placed at the top of the hierarchy since
financial considerations are the primary objective of commercial companies and because financial
measures provide the accountability measure between the organization and its shareholders. As
the primary goal of a nonprofit organization is to effectively and efficiently meet the needs of its
constituencies, the customer perspective should be placed at the top of the Balanced Scorecard in
the non-profit sector.
(2) Placing an overarching mission at the top of the Balanced Scorecard: For nonprofit organizations,
the agency’s mission represents its accountability towards society. It reflects the organization’s
long-term objective. Therefore, it should be featured at the highest level of the Balanced
Scorecard so that the objectives within the BSC can be oriented towards improving the long-term
objective of the organization.
(3) Placing both, the donor perspective as well as the recipient perspective in parallel at the top of
the Balanced Scorecard: While in private sector transactions customers both pay for and receive
the services of an organization, these roles are separate in the non-profit sector. Donors assume
the role of providing the financial resources whereas the constituents assume the role of receiving
the service. Therefore, both parties should be placed in parallel at the top of the Balanced
Scorecard.
The illustration below shows the commercial sector strategy map as well as the strategy map
adapted to the characteristics of the non-profit sector:
Ill. 1: Commercial sector vs. non-profit sector strategy map (based on Kaplan and Norton 2004, 5; Kaplan 2001, 361)

12
Publications on the applicability and the use of the Balanced Scorecard in the context of
humanitarian logistics are scarce. Five publications deal with the applicability and use of the Balanced
Scorecard as a performance measurement tool in the humanitarian relief and development context.
The table below gives an overview on important features of these publications:
Ill. 2: Sources related to the use and applicability of the BSC in humanitarian logistics
Author(s) and year of publication Type of
publication
Development of a
framework
Input from
practice
Framework tested
in practice
Moe et al. (2007) Conceptual paper Yes Yes No
Schulz and Heigh (2009) Case study Yes Yes No
De Leeuw (2010) Multiple case
study Yes Yes No
Schiffling and Piecyk (2014) Literature review Yes No No
Abidi and Scholten (2015) Conceptual paper No Yes Not applicable
Moe et al. (2007) discuss the application of the BSC for natural disaster management projects and
demonstrate this at the example of a real flood disaster management project in Hat Yai Municipality
in Southern Thailand. The BSC perspectives that were chosen for the framework are (1) donor
perspective, (2) target beneficiaries’ perspective, (3) internal business perspective, and (4) innovation
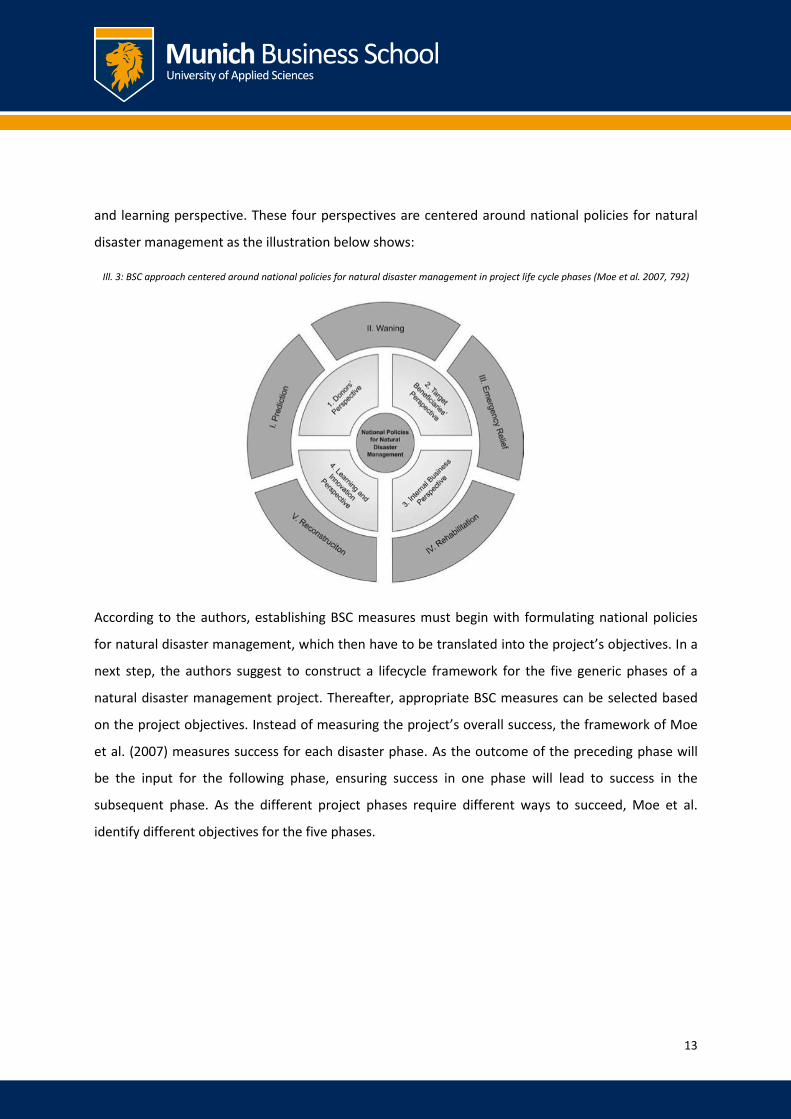
13
and learning perspective. These four perspectives are centered around national policies for natural
disaster management as the illustration below shows:
Ill. 3: BSC approach centered around national policies for natural disaster management in project life cycle phases (Moe et al. 2007, 792)
According to the authors, establishing BSC measures must begin with formulating national policies
for natural disaster management, which then have to be translated into the project’s objectives. In a
next step, the authors suggest to construct a lifecycle framework for the five generic phases of a
natural disaster management project. Thereafter, appropriate BSC measures can be selected based
on the project objectives. Instead of measuring the project’s overall success, the framework of Moe
et al. (2007) measures success for each disaster phase. As the outcome of the preceding phase will
be the input for the following phase, ensuring success in one phase will lead to success in the
subsequent phase. As the different project phases require different ways to succeed, Moe et al.
identify different objectives for the five phases.

14
The following objectives are identified for the emergency relief phase:
Ill. 4: BSC objectives in the emergency relief phase (Moe et al. 2007, 804)
BSC perspective BSC objectives
Donor Good accountability of resource utilization; Resources mobilized and used as planned
Target beneficiary Emergency and relief services met expectations of target beneficiaries
Internal business Timely and responsive relief activities were carried out without delays
Innovation and learning Sharing previous lessons learned and adopting best practices
The authors do not suggest any specific performance measures.
Schulz and Heigh (2009) share the design and testing procedure of the “Development Indicator Tool”
– a tool developed by the International Federation of Red Cross and Red Crescent Societies (IFRC) for
performance management of their regional logistics units. The objectives of its implementation were
to spotlight areas or projects that have an impact on business performance, to help exchange
experience on how to improve procedures across the different regional logistics units as well as to
inform donors about the efficiency and continuous improvement of the regional logistics units.
The following BSC perspectives were chosen for the framework: (1) customer service, (2) financial
control, (3) process adherence, and (4) innovation and learning. Performance indicators were
identified through interviews with staff from the Geneva based Logistics and Resource Mobilization
Department and selected based on the following criteria: (1) the indicator score can be influenced by
the regional logistics unit, (2) the indicator is relevant to the regional logistics unit’s performance
and/or is of special interest from a management perspective, and (3) data that enter into the
indicator calculation exist in IFRC systems and are or can be made accessible to the regional logistics
units. Based on the interviews, a basic tool including 20 preliminary indicators was developed. To
involve the view of future users at an early stage of the tool development, this basic tool was
discussed with the heads of the regional logistics units. After some indicators were exchanged, IFRC
started piloting the tool in December 2006 for a period of four months. The illustration below shows
the set of indicators that were determined after the pilot phase:

15
Ill. 5: IFRC Development Indicator Tool after the pilot phase (Schulz and Heigh 2009, 1045)
Level Development indicator Unit Objective
1 Customer service
1.1 Delivery performance % Identification of lead time issues
1.2 Orders with agreed delivery time in days % Force customers and procurement to plan
needs and agree on delivery date
1.3 Stocks managed by service agreements % Drive use of service agreements
1.4 Monthly reports to customers on time % Drive process stabilization for
customer reports
2 Financial control
2.1a Deviation from unit budget YTD % Stay within budget lines
2.1b Deviation from project budget YTD % Stay within budget lines
2.2a Service turnover versus plan YTD % Generate income for cost recovery
2.2b Service income versus plan YTD % Generate income for cost recovery
2.3 Cost recovery YTD % Drive invoice management and
timely cost recovery
3 Process adherence
3.1a Available stock capacity to supply 5,000 in 48h
(segmented by ownership of stock) % Keep to logistics strategy
3.1b Available stock capacity to supply 15,000 families
(segmented by ownership of stock) % Keep to logistics strategy
3.2 Relief stock turnover rate YTD # of
turns
Drive utilization and fix costs
digression of warehouse
3.3 Procurement transactions using Humanitarian
Logistics Software % Promote usage of HLS software
3.4 Operational vehicles using IT-software Fleet Wave % Promote usage of Fleet Wave
3.5a Average procurement CHF Drive cost efficiency and process improvement
3.5b Average warehouse cost per m2 stored YTD CHF Drive cost efficiency and process improvement
3.5c Average % of transport cost of total order cost YTD
for airfreight % Drive cost efficiency and process improvement
3.5d Average % of transport cost of total order cost YTD
for other transport mode % Drive cost efficiency and process improvement
4 Innovation and learning
4.1 Staff development % Drive staff development through use of
development tool AR-online
4.2 Actual project time versus planned project time G, Y, R Drive good project management
4.3 On time reporting G, Y, R Drive process stabilization for
internal reports
16
Schulz and Heigh (2009, 1044) note that the tool is meant to be an active instrument. Therefore,
continuous review and improvement of the tool and the performance indicators is necessary. No
information was found on whether the tool was actually implemented after the pilot phase.
De Leeuw (2010) develops a reference mission map (= strategy map for the nonprofit sector) for
humanitarian supply chains based on a literature review and four mini-case studies. In a first step, De
Leeuw investigates humanitarian supply chain literature on each of the four perspectives proposed
by Kaplan and Norton. He discusses his findings with the managers of four humanitarian
organizations and develops the following reference mission map:

17
Ill. 6: Reference mission map for humanitarian supply chain management (De Leeuw 2010, 198)
Cu
sto
me
r
Product & service
attributes Customer relationships Image
High quality
High availability
Sufficient quantity
Speedy delivery
Reliable delivery
Relevance
To donors:
Ensure efficient
and effective
processes
Provide
feedback and
information
To intermediaries:
Provide relevant
and timely service
Provide feedback
and information
To beneficiaries:
Provide relevant
and timely
service
Be a reliable and
trustworthy partner
Provide sustainable
relief aid
Lear
nin
g
& G
row
th
In
tern
al
Operations
management
Donor
management Partner management Innovation
Regulatory &
social
Create
operational
excellence in
processes from
needs
assessment to
delivery
Target, acquire
and retain
donors
Provide
feedback to
donors
Local
government:
Build
partnerships
with local
government
Intermediaries:
Target, acquire,
retain partners
and build
partnerships
Identify,
develop
manage new
products &
services
Ensure
compliance
with
regulations
Human capital Information capital Organizational capital
Build and expand supply chain
skills and competencies and
manage job turnover
Develop, utilize and capitalize on
supply chain ICT
Nurture local leadership and
foster team work internally and
with partners
Fin
anci
al
Budgeting Funding management Cost management
Develop, monitor and adjust
budgets
Ensure steady and timely flow of
donations
Ensure efficient use of funds in a
transparent manner
De Leeuw compares his framework to the original Balanced Scorecard and points out the following
differences: In the customer perspective, different relationships with different customers are kept
simultaneously. For all customers, relevancy of products and services stands out, although
beneficiaries are not really demanding voices. The internal perspective deals with donor
management (e.g. selecting, acquiring, retaining and collaborating with donors) as well as partner

18
management (e.g. local government of the host country or intermediaries). Furthermore,
organizations need to take account of their environmental as well as their social impact and manage
innovation. Yet, the latter is and will continue to be a challenge due to a lack of time and money. The
learning and growth perspective resembles its commercial counterpart. However, humanitarian
organizations have difficulties in managing human capital as well as in the development of
information systems. Lastly, as opposed to the commercial sector, the financial perspective of non-
profit organizations focuses mainly on funding management. Many humanitarian organizations are
dependent on obtaining the necessary funds before they are able to provide service.
Schiffling and Piecyk (2014) develop a performance measurement framework that reflects the views
and characteristics of the key stakeholders of humanitarian organizations. To identify these key
stakeholders, the authors conduct a systematic review of academic literature on humanitarian
logistics and adopt the stakeholder salience framework developed by Mitchell et al. (1997), which
classifies stakeholders according to their power, the legitimacy of their claim as well as the urgency
of their claim. The resulting stakeholder typology reveals that donors and beneficiaries are the two
external stakeholders with the highest salience in the humanitarian supply chain. Therefore,
Schiffling and Piecyk develop a customer-centric performance framework that focuses on donors and
beneficiaries throughout all four perspectives of the BSC.
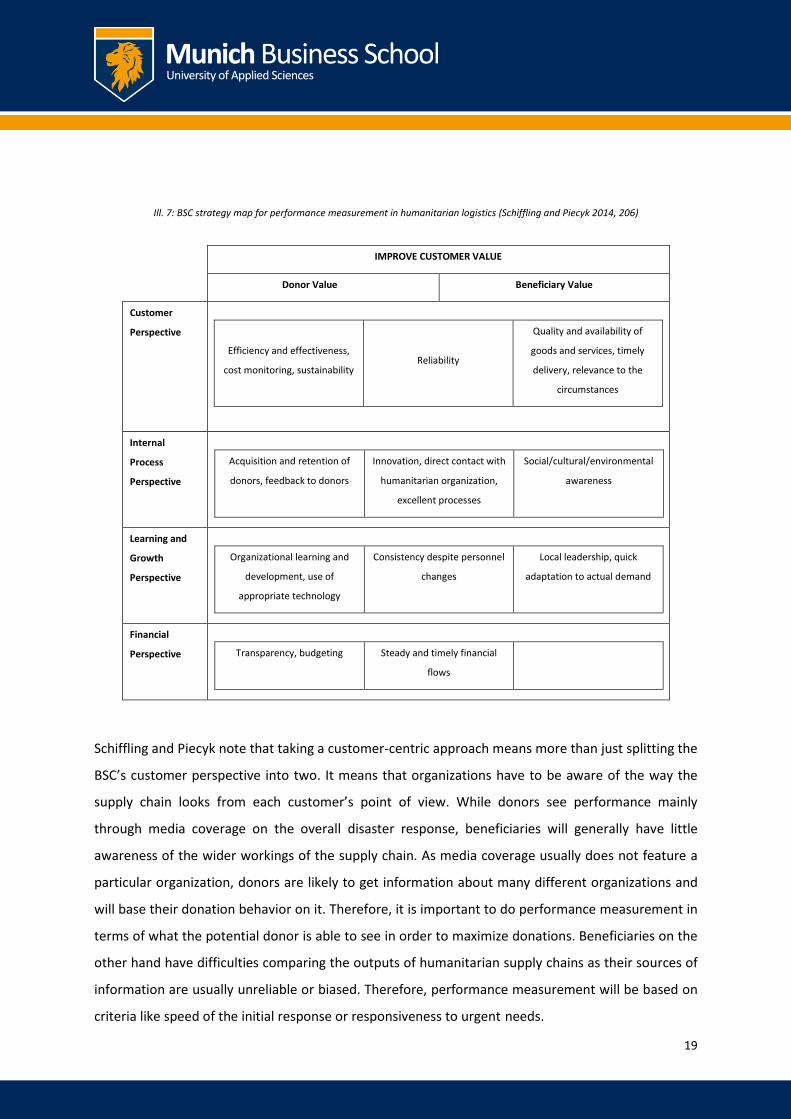
Like Kaplan (2001, 360 et seq.) proposed, the authors place the organization’s mission, which they
identified as “to improve customer value” at the top of the BSC and further split it into “donor value”
and “beneficiary value.” Moreover, the authors divide the BSC perspectives into three columns. The
first column includes aspects that are of value only to the donors, the second column includes
aspects that are relevant for both customer groups and the third column includes aspects that are of
relevance only to the beneficiaries.
The illustration below presents the proposed framework. Schiffling and Piecyk base their examples
on the framework developed by De Leeuw (2010).
19
Ill. 7: BSC strategy map for performance measurement in humanitarian logistics (Schiffling and Piecyk 2014, 206)
IMPROVE CUSTOMER VALUE
Donor Value Beneficiary Value
Customer
Perspective
Efficiency and effectiveness,
cost monitoring, sustainability Reliability
Quality and availability of
goods and services, timely
delivery, relevance to the
circumstances
Internal
Process
Perspective
Acquisition and retention of
donors, feedback to donors
Innovation, direct contact with
humanitarian organization,
excellent processes
Social/cultural/environmental
awareness
Learning and
Growth
Perspective
Organizational learning and
development, use of
appropriate technology
Consistency despite personnel
changes
Local leadership, quick
adaptation to actual demand
Financial
Perspective
Transparency, budgeting Steady and timely financial
flows
Schiffling and Piecyk note that taking a customer-centric approach means more than just splitting the
BSC’s customer perspective into two. It means that organizations have to be aware of the way the
supply chain looks from each customer’s point of view. While donors see performance mainly
through media coverage on the overall disaster response, beneficiaries will generally have little
awareness of the wider workings of the supply chain. As media coverage usually does not feature a
particular organization, donors are likely to get information about many different organizations and
will base their donation behavior on it. Therefore, it is important to do performance measurement in
terms of what the potential donor is able to see in order to maximize donations. Beneficiaries on the
other hand have difficulties comparing the outputs of humanitarian supply chains as their sources of
information are usually unreliable or biased. Therefore, performance measurement will be based on
criteria like speed of the initial response or responsiveness to urgent needs.

20
Abidi and Scholten (2015) evaluate the applicability of the Balanced Scorecard for performance
measurement in the humanitarian supply chains based on the evaluation criteria for appropriate
logistics performance measurements by Caplice and Sheffi (1995). For this purpose, the authors
adapt the six evaluation criteria (comprehensiveness, causal orientation, vertical integration,
horizontal integration, internal comparability and usefulness) to the specificities of humanitarian
supply chains.
The table below summarizes their findings classified into the six evaluation categories:
Ill. 8: Evaluation of the BSC based on the evaluation criteria by Caplice and Sheffi (Abidi and Scholten 2015, 251 et seq.)
Criterion Evaluation
Comprehensiveness
The BSC is not directly comprehensive as only two stakeholders (shareholders
and customers) are considered. Other stakeholders might be included, but
changes might take away from the strength of the BSC in terms of established
standardized measurements.
Causal orientation
The BSC is causally oriented as it reports about current and future success,
provides cause and effect assumptions, ensures transparency among included
stakeholders and enables measurement of the efficiency of a supply chain
network. However it is incomplete due to a lack of comprehensiveness.
Vertical integration
The BSC is vertically integrated as it provides relevant information to decision
makers at a strategic, tactical and operational level internally. Externally this is
more problematic as collaborative supply chain parties need to integrate a BSC
as well.
Horizontal integration
The BSC is horizontally integrated as the learning and growth perspective allows
for continuous improvement. However, it does not involve human resources
and does not facilitate the measurement of operational activities that are
executed in cooperation within the supply chain.
Internal comparability
The BSC is internally comparable as it recognizes trade-offs between the
different dimensions of performance (e.g. in relation to cultural nuances or
language).
Usefulness
The BSC is useful as it supports the user in decision-making and action. However
it does not allow transparency at a process level and causalities have not been
empirically tested.

21
Abidi and Scholten conclude that the BSC shows potential for implementation in the humanitarian
setting, both in the context of emergency and development operations. However, adaptations (e.g.
including all relevant stakeholders) are necessary.
2.4 Results
Five current publications on the applicability and the use of the BSC in humanitarian supply chain
management were presented. Abidi and Scholten (2015) evaluate the BSC for its applicability in
humanitarian logistics and come to the conclusion that the BSC has potential to be applied both, for
relief, as well as for development activities. Moe et al. (2007), Schulz and Heigh (2009), De Leeuw
(2010), and Schilffing and Piecyk (2014) each present different modifications of the BSC for an
application in humanitarian logistics. Whereas De Leeuw (2009) and Schiffling and Piceyk (2014)
develop a BSC for a rather general use in humanitarian logistics, the framework developed by Schulz
and Heigh (2009) focuses on performance measurement in disaster relief. The framework by Moe et
al. (2007) covers all phases of a natural disaster management from prediction to reconstruction.
After a review of these publications, it seems like a modified version of the Balanced can be applied
to improve the efficiency and effectiveness of humanitarian supply chains. However, all of the
frameworks are largely based on theory and none of them has yet been tested in practice.
Furthermore, only the framework developed by Schulz and Heigh (2009) focuses on performance
measurement in disaster relief. Therefore a modification of the BSC specifically for performance
measurement in disaster relief will be developed in the next chapter and serve as a basis for
discussions with experts from the field.
In order to evaluate the applicability of the BSC in this context, a thorough understanding of the
challenges that affect performance measurement as well as the resulting requirements that
performance measurement frameworks have to meet, is required. Therefore, the aim of RQ1 is to
find out what challenges exist concerning supply chain performance measurement in disaster relief
and what requirements a performance measurement framework has to meet in this context.
For the application of the Balanced Scorecard in the non-profit sector, Kaplan (2001) proposed
placing an overarching mission statement at the top of the BSC and to replace the financial
perspective by the customer perspective at the top of the BSC. As non-profit organizations serve two
types of customers, Kaplan furthermore proposed placing both of them in parallel at the top of the

22
BSC. Although the majority of the frameworks presented for the humanitarian field place the
customer perspective at the top of the BSC, all of them take a different approach of integrating the
two customers. Therefore, RQ2 aims to answer how the four perspectives of the Balanced Scorecard
need to be adapted in order to be applicable in this context. The focus of this question lies on how to
best integrate the two kinds of customers that humanitarian organizations have.
Out of the four publications that propose a modified version of the BSC for performance
measurement in humanitarian logistics, only Schulz and Heigh (2009) develop performance measures
that assess the performance of an organization within the four perspectives. However, these are
developed specifically for the operations of the International Federation of Red Cross and Red
Crescent Societies (IFRC) and therefore will not be equally relevant for other organizations in this
sector. Consequently, RQ3 aims to identify appropriate performance indicators that organizations
involved in disaster relief should track.
As literature on the use and applicability of the BSC for performance measurement in humanitarian
logistics is scarce, there are barely any recommendations as to what organizations should consider
when developing and implementing a BSC on their own. Therefore, RQ4 follows up on
recommendations concerning the development and implementation of a BSC in this context.
3. Development of a Balanced Scorecard for Performance Measurement in Disaster Relief
The authors of this paper have chosen to include the following four perspectives in the Balanced
Scorecard: (1) Beneficiary, (2) Financial, (3) Internal Processes, and (4) Learning and Growth.
Furthermore, as Kaplan (2001, 360 et seq.) proposed, an overarching mission statement was placed
at the top of the Balanced Scorecard in order to guide in the selection of appropriate objectives and
performance measures that are oriented towards improving the long-term objective of the
organization. The mission of humanitarian supply chains in the disaster relief context was identified
as follows (Thévenaz and Resodihardjo 2010, 7): To rapidly provide relief to vulnerable people with
the intention to safe and sustain lives.
Even though donors are often identified as customers and key stakeholders in humanitarian supply
chain literature (e.g. Schiffling and Piecyk 2014; Beamon and Balcik 2008), the authors refrained from

23
including donors in the “customer perspective” as well as from assigning a perspective exclusively to
them. There are two key reasons for that:
(1) For many humanitarian organizations, donations from governments are their key source of
income. According to the Global Humanitarian Assistance Report (GHA 2015, 2) more than 75% of
all contributions for humanitarian assistance were provided by governments in 2014. These
governmental contributions are often tied to wider political agendas and thus may not be
influenced by the performance of humanitarian organizations (Schiffling and Piecyk 2014, 205).
(2) Different aspects of the donor’s objectives are already reflected in the four perspectives chosen
for the Balanced Scorecard. This is mainly the case for the financial and beneficiary perspectives
but the donor’s objectives are also reflected in the internal processes perspective as well as
learning and growth.

24
The customer perspective of the original Balanced Scorecard was renamed to beneficiary perspective
to avoid confusion about who is included in this perspective. Moreover, it was placed at the top of
the Balanced Scorecard as meeting the needs of beneficiaries is the primary goal of any humanitarian
organization.
Ill. 9: Balanced Scorecard for performance measurement in disaster relief (based on Kaplan and Norton 1996, 9)
Sub-categories for each of the four perspectives as well as the corresponding objectives were largely
adopted from the framework developed by De Leeuw (2010, 198). However, changes were made
where the authors deemed them to be necessary.

25
Ill. 10: Perspectives, sub-categories and objectives of the BSC for performance measurement in disaster relief
( based on De Leeuw 2010, 198)
Perspective Sub-Categories Objectives
Beneficiary
Product attributes
Deliver quality products
Deliver relevant products
Deliver sufficient quantities
Service attributes
Rapid delivery
Reliable delivery
Deliver sustainable aid
Financial
Funding management Ensure steady and timely flow of donations
Cost management Ensure efficient use of funds in a transparent manner
Budgeting Develop, monitor and adjust budgets
Internal
Processes
Operations management Efficient and effective processes/operational excellence in processes
Donor management
Target, acquire and retain donors
Provide feedback and information to donors
Partner management
Build partnerships with local government
Target, acquire and retain partners
Innovation processes Identify, develop and manage new products and services
Regulatory and social
processes Ensure compliance with regulations
Learning and
Growth
Human capital
Build and expand supply chain skills and competencies
Manage job turnover
Information capital Develop, utilize and capitalize on supply chain information and
communication technology
Organizational
capital
Nurture local leadership
Foster team work internally and with partners
Integrate volunteers
In a subsequent step, the authors investigated humanitarian supply chain literature (Schulz and
Heigh (2009), Santarelli et al. (2013), Beamon and Balcik (2008), Van der Laan, Brito and Vergunst
2009, Davidson (2006), Beamon and Kotleba (2006), Medina-Borja, Pasupathy and Triantis (2007),

26
Blecken et al. (2009), Kumar, Niedan- Olsen and Peterson (2009), Quiang and Nagurney (2012),
Gatignon, Van Wassenhove and Charles (2010)) to collect appropriate measures that will assess the
performance of the humanitarian organization towards these objectives. In doing so, the authors
identified several gaps, especially in the learning and growth perspective, where none or only a
limited number of performance measures were mentioned in the investigated literature. Therefore,
additional performance measures were suggested by the authors in order to close these gaps. This
way, the framework presented above was filled with a total of 93 potential indicators (cf. Appendix 1
for the complete list of performance measures).
The framework developed here was used as a basis for interviews with six experts from international
organizations and NGO’s, foundations and the research field.

27
4. Evaluation of the Developed Balanced Scorecard for Performance Measurement in Disaster
Relief
4.1 Research Strategy, Sample Selection and Data Analysis
The research strategy of the paper follows a multiple case study approach. According to Robson
(2002, 176), a case study involves “empirical investigation of a phenomenon within its real life
context using multiple sources of evidence.” This enables the researcher to develop a deeper
understanding of specific instances of a phenomenon (Santos and Eisenhardt 2004, 684). The authors
of this paper decided to use multiple cases in order to establish whether findings from one
organization also apply to other organizations within the field (Saunders, Lewis and Thornhill 2009,
146; Santos and Eisenhardt 2004, 685).
Data was gathered by means of semi-structured qualitative interviews, which are scheduled
conversations between a researcher and an interviewee (Rubin and Rubin 2012, 31). As opposed to
the structured interview, which uses a standardized set of questions, researchers have a list of
themes to be covered in a semi-structured interview, but questions may vary from interview to
interview depending on the organizational context that is encountered with respect to the research
topic as well as the flow of conversation (Saunders, Lewis and Thornhill 2009, 320). Through the use
of open-ended questions, interviewees are encouraged to answer at length, which allows the
researcher to explore in detail their motives, opinions and experiences (Rubin and Rubin 2012, 3; 31).
For the interviews, qualified experts from the humanitarian field were sought throughout Germany.
Before conducting the interviews, an interview guide (cf. Appendix 2) was created to serve as
orientation during the interview process and to guarantee comparability of results. The interview
guide was based on the research questions and covered areas that are likely to generate data to
address these questions (Mason 2004, 518). A total of six interviews were conducted between 11th
and 28th of August 2015 (cf. table below).

28
Ill. 11: Overview of interview partners
Interview
Partner Position
Years of
expertise
Theoretical/
practical expertise
1 Research associate at the institute for logistics and service
management at a private University of Applied Sciences 4 years Rather theoretical
2
Project manager at the foundation of a global reinsurance
company; responsible for disaster risk reduction, social
vulnerability and resilience
7 years Rather theoretical
3
Deputy CEO of an international medical aid organization
and member of the working group of a German logistics
association
8 years Theoretical and practical
4 Head of emergency and disaster relief at an international
medical aid organization 7 years Rather practical
5 Head of logistics and procurement at the German national
society of a large international humanitarian organization 15 years Rather practical
6
Founder and CEO of a national medical aid organization and
head of operations at an international humanitarian aid
organization
30 years Rather practical

29
4.2 Evaluation of the Challenges Concerning Performance Measurement and Requirements for
Performance Measurement Frameworks (RQ 1)
According to the interviewees, the greatest challenge concerning performance measurement in the
disaster relief context is that no disaster situation is like the other. Disasters vary in terms of
environmental factors, material demands as well as logistical requirements. This makes it very
difficult for organizations to plan ahead as they cannot transfer their experience from one operation
onto another.
Organizations have to respond to disasters in different countries and regions where they have to
comply with different local legislation, e.g. import regulations. Moreover, the different languages,
mentality, educational backgrounds as well as working methods of local partners and volunteers
often present an obstacle to effective performance measurement. One interviewee quotes the
following example: “There are some volunteers who have never seen a computer before. But we
need these people. We have to take them even if they do not have the desired educational
background“. The interviewees stress that it is essential that local employees understand the
necessity of performance measurement and that they are motivated as well as capable to collect the
required data.
As disaster relief is a very dynamic field and things happen ad hoc, frequent re-prioritization is
necessary. Organizations constantly have to consider a new starting base when assessing whether
their operations run efficiently. This, so the interviewees, makes it very difficult to assess the
performance of an organization over time.
Due to the heterogeneity of disasters as well as the organizations involved in disaster relief, no
standards in performance measurement have been developed so far. This makes it difficult to
compare performance across organizations. Furthermore, it is very time consuming for donors to
familiarize themselves with the different methods used for performance measurement and reporting
across organizations.
Another challenge concerning performance measurement in the disaster relief context is that no
organization has complete responsibility and control over the supply chain. From procurement to
delivery, many organizations as well as organizational structures are linked and the exchange of
information between them is often impaired. The interviewees believe that performance

30
measurement in the disaster relief context cannot be limited to an individual organization but has to
be assessed in context with the other organizations involved.
According to the interviewees, data is a challenge in many respects. In order to collect data,
electricity is essential, but not always available. Furthermore, organizations usually have no central
database but use a number of different systems to collect different kinds of data: “There are aid
organizations that use up to eleven different system. Every system is used for something else.”
Moreover, the extent to which data is collected differs from one country to the next. While an
organization collects data up to the last mile in one country, it might only collect data up to the
distribution center in another country. This makes it hard to compare performance across countries
and operations. Lastly, not all required data is available or can be used by the organization.
Another challenge that the organizations face is a lack of time, capacity and resources for
performance measurement. This is particularly true for the beginning of an operation as first
resources are usually used on-site. The interviewees state that there is usually neither time nor
resources for performance measurement at the beginning of an operation.
Lastly, the large number of stakeholders that is involved in disaster relief as well as their diverse goals
present another major challenge for performance measurement. This particularly concerns the
different kinds of donors that an organization has. One interviewee suggests that organizations
identify important stakeholders prior to the development of a performance measurement
framework in order to be able to tailor it to their goals and needs.
This leads to the requirements that performance measurement frameworks have to meet in the
disaster relief context. The interviewees addressed the following topics:
(1) The goals of the different stakeholders, but particularly the KPIs of the different donors, should be
reflected.
(2) The framework should be simple and transparent and use a limited number of easy-to-
understand quantitative as well as qualitative indicators.
(3) The framework should be flexible in order to react to different kinds of scenarios and account for
regional differences. Furthermore, it should be compatible with the systems used by the
organization.

31
(4) Organizations should be able to use the framework from the beginning of an operation in order to
be able to avoid waste from start.
Additionally, the interviewees mention several requirements that organizations have to meet in
order to be able to establish an effective performance measurement system:
(1) Employees must support performance measurement and the necessity for performance
measurement must be seen at all levels of the organization.
(2) Data should be transferable between all levels of the organization.
(3) The same database should be used for all countries and operations.
Through the interviews, the multitude of challenges that affect performance measurement in the
disaster relief context became apparent. Whereas most of the mentioned challenges above are also
extensively discussed in literature on performance measurement in the humanitarian context, the
fact that no organization has complete responsibility and control over the supply chain and
therefore, performance measurement cannot be limited to an individual organization is only touched
upon by Abidi and Scholten (2015). The authors of this paper consider this to be the key challenge
concerning performance measurement in this context. If performance measurement cannot be
limited to an individual organization, standards are essential to facilitate the measurement of
operational activities that are executed in cooperation with other organizations (cf. Abidi and
Scholten 2015, 251). However, standards are nonexistent. Furthermore, organizations seem to
already struggle with the collection of data from their own operations.
It can be concluded that the challenges with respect to measuring the performance of relief chains by
far exceed those of measuring the performance of commercial supply chains. Therefore,
performance measurement frameworks have to fulfill additional requirements in order to be
applicable in this context.
While most of the requirements mentioned by the interviewees are also of importance in the
commercial sector (e.g. limited number of indicators, compatible with the systems used by the
organization), the interviewees mentioned the following requirements that are exclusive to the
disaster relief context: (1) the performance measurement framework should reflect the goals of
different stakeholders, especially those of the different donors, (2) the performance measurement
framework should be flexible to react to different kinds of scenarios and account for regional

32
differences, and (3) the performance measurement framework should use the same database for all
countries and operations. These requirements are also addressed in the investigated literature on
humanitarian supply chain performance measurement. As pointed out by the interviewees,
performance measurement in the disaster relief context cannot be limited to an individual
organization. Therefore, the authors believe that it is necessary to add the following requirement: (4)
the framework should facilitate the measurement of operational activities that are executed in
cooperation with partners.
4.3 Evaluation of the Balanced Scorecard Perspectives (RQ 2)
In order to find out how the four perspectives of the Balanced Scorecard need to be adapted to be
applicable for performance measurement in disaster relief, the interviewees were presented the
Balanced Scorecard developed in subsection 3. As opposed to the frameworks developed by Schulz
and Heigh (2009), De Leeuw (2010) as well as Schiffling and Piecyk (2014), the customer perspective
of the framework developed in this paper is limited to the beneficiaries. Therefore, one of the goals
was to discover who the interviewees consider as customers of the humanitarian supply chain and
how they should be integrated into the BSC.
Interviewee 1 believes that the four perspectives chosen for the framework are appropriate for
performance measurement in disaster relief. As she considers the beneficiary as the ultimate
customer of the humanitarian supply chain, she agrees to limit the customer perspective to the
beneficiaries. She adds that if organizations manage to include the beneficiary into performance
measurement, they will be able to identify their impact on them. Interviewee 1 recommends
including the donor into both, the financial as well as internal processes perspective, as in-kind
donations (e.g. clothes) cannot be accounted for in the financial perspective.
Overall, interviewee 2 agrees with the four perspectives of the framework. However, he
recommends dropping the term ‘internal’ from the internal processes perspective. As a large part of
humanitarian relief efforts is concerned with international cooperation, he believes that if the
perspective were limited to internal processes, a large part (e.g. cooperation with local governments
and partners) would be missing. As he considers donors and beneficiaries to be located at opposite
sides of the supply chain, he would refrain from dividing the customer perspective into two. He
believes that donors, governments as well as relief funds should not be included into the BSC at all as

33
they play a subordinate role in performance measurement. The customer perspective should
therefore be limited to the beneficiaries.
Interviewees 3 and 4 find it necessary to make a distinction between the donor, the beneficiary as
well as the financial management of the organization. They believe that all three have different
characteristics as well as diverging goals and limits. Furthermore, they believe that the organization’s
responsibility towards their beneficiaries differs considerably from their responsibility towards their
donors. Although they believe that performance measurement should match the needs of donors,
they would not assign them an own perspective nor divide the customer perspective into two. They
believe that the donor is important in all four perspectives of the model and therefore suggest
including relevant performance measures in all four perspectives. However, these performance
measures need to be adjusted depending on the type of donors an organization has (e.g.
governments, institutional funds or private donors).
Interviewee 5 considers the beneficiary to be the most important element of the framework. He
explains that in reality, donors are often considered as customers of the humanitarian supply chain
as they are the ordering party. However, he believes that the beneficiary should be regarded as the
actual customer of the humanitarian supply chain. Therefore, he agrees to limit the customer
perspective to the beneficiaries and suggests including the donor into the financial perspective as
well as internal processes.
As opposed to the other interviewees, the interviewee 6 views the donor as the ultimate customer
and center of the humanitarian supply chain. He emphasizes the need to look after the donor in
order to keep him for future projects. Therefore, he suggests adding both, the donor as well as media
as two further perspectives to the Balanced Scorecard.
The results obtained differ from the suggestions in literature. In two of the publications (Schulz and
Heigh 2009; Schiffling and Piecyk 2014), donors and beneficiaries are considered as customers of the
humanitarian supply chain and therefore, the customer perspective includes performance measures
that are relevant for each of them. De Leeuw (2010), in addition to donor and customers, also
considers intermediaries such as governments or implementing partners such as customers of the
humanitarian supply chain. Therefore, the customer perspective of his framework includes donors,
beneficiaries as well as intermediaries. Only Moe et al. (2007) limit the customer perspective to

34
target beneficiaries. However, in their modification of the BSC, the financial perspective is replaced
by a donor perspective and remains at the top of the BSC. Therefore, it seems like Moe et al. (2007)
also consider the donor as a customer or at least a key stakeholder of the humanitarian supply chain.
Schulz and Heigh (2009), Schiffling and Piecyk (2014) as well as De Leeuw (2010) each place the
customer perspective at the top of the BSC. Also, all of the interviewees acknowledged that the
beneficiary perspective should be placed at the top of the BSC. Even interviewee 6, who considers
the donor as the ultimate customer of the humanitarian supply chain agrees: “Like you just said, it is
not important to put the financial perspective, but the beneficiary at the top of the Balanced
Scorecard.” Therefore, it can be concluded that the financial perspective should be replaced by the
customer perspective at the top of the BSC.
4.4 Evaluation the Balanced Scorecard Performance Measures (RQ 3)
In order to identify appropriate performance measures, the interviewees were provided with the list
of 93 performance indicators that was developed in subsection 3 of this paper (cf. Appendix 1). They
were asked to choose four to five performance measures from each of the four perspectives and to
rank them according to their relevance. Although the interviewees were encouraged to add
additional performance measures, none of them took the opportunity to do so.
Out of the 93 performance measures that were provided within the four perspectives, a total of 54
were chosen. The fact that none of the performance measures was chosen by all interviewees, and
only 14 indicators were chosen by either three or four of the interviewees, suggests that it is very
complex to identify performance measures that are relevant across organizations. The table below
shows the distribution of the performance measures chosen by the interviewees:

35
Ill. 12: Distribution of the performance measures chosen by the interviewees
Frequency chosen Number of indicators Percentage of indicators
Chosen by none of the interviewees 39 indicators 42%
Chosen by one interviewee 22 indicators 24%
Chosen by two interviewees 18 indicators 19%
Chosen by three interviewees 8 indicators 9%
Chosen by four interviewees 6 indicators 6%
Chosen by all interviewees 0 indicators 0%
When looking at the performance measures that were chosen by four out of five of the interviewees,
it becomes apparent that all of these are measures that are relevant to the organization regardless of
the characteristics of an operation as well as the partners an organization cooperates with.

36
Ill. 13: Performance measures chosen by four out of five interviewees
Performance Measure
Frequency
frequency with which
a measure was
selected
Relevance
relevance that each
measure was
attributed (5 = most
relevant; 1 = least
relevant)
Importance
frequency x relevance
Customer Satisfaction 4
5
18 5
4
4
Average Response Time 4
5
15 4
3
3
Degree of Relevance of Products 4
4
13 4
3
2
Degree of Cooperation with Local Government 4
5
12 4
2
1
Degree of Cooperation with Partners 4
5
12 4
2
1
Staff Development 4
5
14 5
3
1
Regardless of the operation an organization is involved in and regardless of the partners the
organization has to cooperate with, it is always important that the beneficiaries are satisfied and
receive products that are relevant to them, that the average response time is short, that the degree
of cooperation with partners and local governments is high and that staff is well trained and
qualified.
4.5 Evaluation of the Recommendations Given for Humanitarian Organizations (RQ 4)
The recommendations given by the interviewees are related to different phases of the
implementation process. Therefore, a distinction between recommendations (1) prior to the
development, (2) during the development process and (3) during the application of the BSC is made.

37
Prior to the development: One of the interviewees believes that if the BSC is only used for
performance measurement in disaster relief, the period between each application can be fairly long
and therefore, organizations might not resort to the BSC in a disaster situation. Therefore, he
believes that organizations should consider using the BSC also for performance measurement in
development work. Furthermore, the interviewees recommend that before an organization starts
using the BSC for performance measurement, they should be aware that once they start working
with it, donors and partners will expect them to continue. Organizations should also think about
what numbers they want to make available to their donors, partners as well as the public prior to the
development of a BSC. Lastly, so the interviewees, organizations should consider whether it makes
sense to develop one model for all disaster types or whether it is more favorable to classify them into
different categories and develop a framework for each of these categories (e.g. earthquakes,
tsunamis).
During the development process: The interviewees recommend that organizations consider
environmental factors (e.g. cultural and political background) as well as the organizational context
(e.g. goals of the organization or operation) when tailoring the BSC to their needs. Furthermore,
employees from different levels of the organization should be included in the implementation
process. As people from various cultural as well as educational backgrounds need to be able to work
with it, the BSC should use a clear language. Moreover, it should be simple to use and not too
scientific. Lastly, the interviewees believe that the BSC should be complementary and coherent with
other relief measures as well as in line with other types of reporting used by the organization.
During application: Organizations should make clear to their employees as well as partners why
performance measurement is important, discuss performance measures with them to ensure their
understanding and take care that they are motivated to measure performance.
As with the requirements for performance measurement frameworks (see subsection 4.2), some of
the recommendations given by the interviewees (e.g. clear language of the tool) are rather general
recommendations that are relevant to the implementation of any performance measurement
framework, regardless of its implementation in the commercial or non-profit sector.
Out of the five publications on the applicability and use of the BSC for performance measurement in
humanitarian logistics, only one gives specific recommendations concerning the implementation of

38
the framework. As also suggested by one of the interviewees, Schulz and Heigh (2009, 1046) indicate
that tool users should be involved in the development of the BSC at an early state. Furthermore, they
promote early handover of the tool from the developer to the tool administrator in order to create a
feeling of ownership and enable their understanding of the tool functions. Lastly, Schulz and Heigh
recommend that tool users and administrators agree on the definition of each input data and its
calculation modus.
5. Conclusion and Outlook
The increasing frequency and severity of natural and man-made disasters (Tatham and Hughes 2011,
66; Thomas and Kopzak 2005, 1) as well as the large expenditures of aid agencies in the area of
logistics, have made measuring the performance of their supply chains vital for all organizations
involved in disaster relief (Beamon and Balcik 2008, 5). However, their distinctive legal and financial
status (Forbes 1998, 184) as well as their double bottom-line (Beamon and Balcik 2008, 10) makes it
difficult to assess their performance with the common measures of commercial organizations.
As it compliments financial measures with measures from three other perspectives, the Balanced
Scorecard provides a promising base for an application in the humanitarian setting. Moreover, it has
explicitly been linked to non-profit organizations (Kaplan 2001).
Taking into account Kaplan’s suggestions for the non-profit sector and guided by five existing
publications on the use and applicability of the BSC in humanitarian logistics, the paper introduced a
modified version of the Balanced Scorecard to assess the performance of humanitarian supply chains
in the context of disaster relief. This modified version was used as a basis for conversations with six
experts from the field, which were aimed at determining to what extent the BSC is applicable in this
context, how it has to be adjusted and what humanitarian organizations should consider when
implementing the BSC.
Whereas the literature suggested that a modified version of the BSC has potential for an
implementation as a performance measurement framework in disaster relief, the interviews have
revealed a number of issues that complicate the applicability of the BSC in this context. These can be
reduced to two major points:

39
(1) Performance measurement cannot be limited to an individual organization but has to be assessed
along with the other organizations involved in an operation. Therefore, partners would have to
implement a BSC as well. However this is not easy to achieve due to the large number of
stakeholders (Abidi and Scholten 2014, 251) as well as the issues of humanitarian organizations to
capture consistent data from their operations.
(2) Due to the heterogeneity of disasters, the different countries of operation as well as the
environmental factors influencing operations, the BSC would have to be adjusted on a project
basis. However, this seems challenging due to the limited time, capacity and resources that
organizations have – especially at the beginning of an operation.
In order to be able to apply the BSC for performance measurement in disaster relief, standards would
be essential to facilitate the exchange of data between organizations and to make performance
comparable across organizations. Moreover, the development of different versions of the BSC for
different kinds of disasters could help organizations save time and resources adjusting the BSC at the
beginning of an operation.
The interviews have confirmed Kaplan’s modification of the Balanced Scorecard for the non-profit
sector as all of the interviewees believe that the customer perspective (here beneficiary perspective)
should be placed at the top of the Balanced Scorecard. Furthermore, the authors were able to
identify two factors that influence the applicability of performance measures for different
organizations. These factors are: (1) the operation that an organization is involved in; and (2) the
partners the organization has to cooperate with. Performance indicators that are independent of
these factors (e.g. average response time) are more likely to apply across a number of different
organizations.
The next step in the practical implementation of the Balanced Scorecard as a performance
measurement tool in disaster relief would be to develop different versions of the BSC with few, but
yet essential performance indicators and to test these in practice. This approach could first be limited
to an individual organization, but be extended over time as positive results from the testing phase
will convince more organizations to cooperate. This iterative method might yield standardized
performance indicators, a uniform documentation as well as a stringent reporting process. When
developing Balanced Scorecards for different organizations, it is essential to involve tool users at an
early stage as well as to sensitize its employees and volunteers about its importance.

40
Bibliography
Abidi, H. and Scholten, K. (2015). Applicability of Performance Measurement Systems to Humanitarian Supply Chains. In: M. Klumpp, S. De Leeuw, A. Regattieri and R. De Souza, Humanitarian Logistics and Sustainability, 1st ed. Springer, pp.235-260.
Abidi, H., De Leeuw, S. and Klumpp, M. (2014). Humanitarian supply chain performance management: a systematic literature review. Supply Chain Management: An International Journal, 19(5/6), pp.592-608.
Beamon, B. and Balcik, B. (2008). Performance measurement in humanitarian relief chains. International Journal of Public Sector Management, 21(1), pp.4-25.
Beamon, B. and Kotleba, S. (2006). Inventory management support systems for emergency humanitarian relief operations in South Sudan. The International Journal of Logistics Management, 17(2), pp.187-212.
Blecken, A. (2010). Supply chain process modelling for humanitarian organizations. International Journal of Physical Distribution & Logistics Management, 40(8/9), pp.675-692.
Blecken et al.: Blecken, A., Hellingrath, B., Dangelmeier, W. and Schulz, S. (2009). A humanitarian supply chain process reference model. International Journal of Services Technology and Management, 12(4), pp.391-413.
Bourne, M., Kennerley, M. and Franco Santos, M. (2005). Managing through measures: a study of impact on performance. Journal of Manufacturing Technology Management, 16(4), pp.373-395.
Caplice, C. and Sheffi, Y. (1995). A Review and Evaluation of Logistics Performance Measurement Systems. International Journal of Logistics Management, 6(1), pp.61-74.
Christopher, M. and Tatham, P. (2011). Introduction. In: Christopher, M. and Tatham, P, Humanitarian Logistics: Meeting the Challenge of Preparing for and Responding to Disasters. Kogan Page: London and Philadelphia, pp.1-14
Davidson, A. (2006). Key Performance Indicators in Humanitarian Logistics. Boston: MA Institute of Technology.
De Leeuw, S. (2010). Towards a Reference Mission Map for Performance Measurement in Humanitarian Supply Chains. In: L. Camarinha-Matos, X. Boucher and H. Afsarmanesh, Collaborative Networks for a Sustainable World, 1st ed. St. Etienne: Springer, pp.181-188.
EM-DAT, (2015). EM-DAT Disaster Trends. [online] Available at: http://www.emdat.be/disaster_trends/index.html [Accessed 21 Jul. 2015].
Ertem, M., Buyurgan, N. and Rossetti, M. (2010). Multiple buyer procurement auctions framework for humanitarian supply chain management. International Journal of Physical Distribution & Logistics Management, 40(3), pp.202-227.
41
Forbes, D. (1998). Measuring the Unmeasurable: Empirical Studies of Nonprofit Organization Effectiveness from 1977 to 1997. Nonprofit and Voluntary Sector Quarterly, 27(2), pp.183-202.
Gatignon, A., Van Wassenhove, L. and Charles, A. (2010). The Yogyakarta earthquake: Humanitarian relief through IFRC's decentralized supply chain. International Journal of Production Economics, 126(1), pp.102-110.
GHA, (2015). Global Humanitarian Assistance Report 2015. Bristol: Development Initiatives: Global Humanitarian Assistance.
Kaplan, R. (2001). Strategic Performance Measurement and Management in Nonprofit Organizations. Nonprofit Management Leadership, 11(3), pp.353-370.
Kaplan, R. and Norton, D. (1992). The Balanced Scorecard: Measures That Drive Performance. Harvard Business Review, (Jan.-Feb. 1992), pp.71-79.
Kaplan, R. and Norton, D. (1996). The Balanced Scorecard: Translating Strategy Into Action. Boston: Harvard Business School Press.
Kaplan, R. and Norton, D. (2004). Strategy maps. Boston: Harvard Business School Press.
Kovács, G. and Spens, K. (2007). Humanitarian logistics in disaster relief operations. International Journal of Physical Distribution & Logistics Management, 37(2), pp.99-114.
Kumar, S., Niedan‐Olsen, K. and Peterson, L. (2009). Educating the supply chain logistics for humanitarian efforts in Africa: a case study. International Journal of Productivity and Performance Management, 58(5), pp.480-500.
Mason, J. (2004). Interview Guide. In: The SAGE Encyclopedia of Social Science Research Methods, 1st ed. Thousand Oaks: Sage, pp.518.
McLachlin, R., Larson, P. and Khan, S. (2009). Not‐for‐profit supply chains in interrupted environments. Management Research News, 32(11), pp.1050-1064.
Medina-Borja, A., Pasupathy, K. and Triantis, K. (2006). Large-scale data envelopment analysis (DEA) implementation: a strategic performance management approach. Journal of the Operational Research Society, 58(8), pp.1084-1098.
Mitchell, R., Agle, B. and Wood, D. (1997). Toward a Theory of Stakeholder Identification and Salience: Defining the Principle of Who and What Really Counts. The Academy of Management Review, 22(4), p.853-886.
Moe et al.: Moe, T., Gehbauer, F., Senitz, S. and Mueller, M. (2007). Balanced scorecard for natural disaster management projects. Disaster Prevention and Management, 16(5), pp.785-806.
Moxham, C. (2009). Performance measurement: Examining the applicability of the existing body of knowledge to nonprofit organisations. International Journal of Operations & Production Management, 29(7), pp.740-763.

42
NatCatSERVICE database, (2015). Natural disaster - Annual statistics 2013 | Munich Re. [online] Available at: http://www.munichre.com/en/reinsurance/business/non-life/natcatservice/annual-statistics/index.html [Accessed 21 Jul. 2015].
Neely, A., Gregory, M. and Platts, K. (1995). Performance measurement system design: A literature review and research agenda. International Journal of Operations & Production Management, 15(4), pp.1228-1263.
Parker, C. (2000). Performance measurement. Work Study, 49(2), pp.63-66.
Pettit et al.: Pettit, S., Beresford, A., Whiting, M. and Banomyong, R. (2011). The 2004 Thailand tsunami reviewed: lessons learned. In: M. Christopher and P. Tatham, Humanitarian Logistics: Meeting the Challenge of Preparing for and Responding to Disasters, 1st ed. London and Philadelphia, pp.103-119.
Poister, T. (2003). Measuring performance in public and nonprofit organizations. San Francisco: Jossey-Bass.
Qiang, P. and Nagurney, A. (2012). A bi-criteria indicator to assess supply chain network performance for critical needs under capacity and demand disruptions. Transportation Research Part A: Policy and Practice, 46(5), pp.801-812.
Robson, C. (2002). Real World Research: a resource for social scientist and practitioner. 2nd ed. Oxford: Blackwell.
Rubin, H. and Rubin, I. (2012). Qualitative interviewing. Thousand Oaks: Sage Publications.
Santarelli et al.: Santarelli, G., Abidi, H., Regattieri, A. and Klumpp, M. (2013). A performance measurement system for the evaluation of humanitarian supply chains. In: POMS. 24th. Annual Conference of the Production and Operations Management Society.
Santos, F. and Eisenhardt, K. (2004). Multiple Case Study. In: The SAGE Encyclopedia of Social Science Research Methods, 1st ed. Thousand Oaks: Sage, pp.684-685.
Saunders, M., Lewis, P. and Thornhill, A. (2009). Research Methods for Business Students. 5th ed. Harlow, England: Prentice Hall.
Schiffling, S., Piecyk, M. (2014). Performance measurement in humanitarian logistics: a customer-oriented approach. Journal of Humanitarian Logistics and Supply Chain Management, 4(2), pp.198-221.
Schulz, S. and Heigh, I. (2009). Logistics performance management in action within a humanitarian organization. Management Research News, 32(11), pp.1038-1049.
Tatham, P. and Hughes, K. (2011). Humanitarian logistics metrics: where we are and how we might improve. In: M. Christopher and P. Tatham, Humanitarian Logistics: Meeting the Challenge of Preparing for and Responding to Disasters, 1st ed. London and Philadelphia, pp.65-84.
Thévenaz, C. and Resodihardjo, S. (2010). All the best laid plans…conditions impeding proper emergency response. International Journal of Production Economics, 126(1), pp.7-21.

43
Thomas, A. and Kopczak, L. (2005). From logistics to supply chain management: the path forward in the humanitarian sector. San Francisco: Fritz Institute.
Van der Laan, E., De Brito, M. and Vergunst, D. (2009). Performance measurement in humanitarian supply chains. International Journal of Risk Assessment and Management. 13(1), pp.22-45.
Van Wassenhove, L. (2006). Humanitarian Aid Logistics: Supply Chain Management in High Gear. The Journal of the Operational Research Society, 57(5), pp.475-489.
Wakolbinger, T. and Toyasaki, F. (2011). Impacts of funding systems on humanitarian operations. In: Christopher, M. and Tatham, P, Humanitarian Logistics; Meeting the Challenge of Preparing for and Responding to Disasters. Kogan Page: London and Philadelphia, pp.33- 46.

44
Appendix
Appendix 1: Objectives and measures of the BSC for performance measurement in disaster relief (based on De Leeuw 2010, 198)
Perspective Categories Objectives Measure and Unit
Beneficiary
Product attributes
Deliver quality products Customer Satisfaction (1-5 or %) [9] Perceived Quality of Products (1-5) [12]
Deliver relevant
products
Assessment Accuracy (1-5 or %) [5+9] Appeal Coverage (%) [5+11] Customer Satisfaction (1-5 or %) [9] Degree of Relevance of Products (1-5) [12]
Deliver sufficient
quantities
Number of People Helped (number of people) [2+9+11] Percentage or People in Need Helped (%) [12] Total Amount of Disaster Supplies Delivered to Aid Recipients (number of items or $
amount) [3] Demands Satisfied (%) [10] Demands Not Satisfied (%) [10]
Service attributes
Rapid delivery Average Response Time (days) [2+3] Order Lead Time (days) [11] Distance of Organization’s Warehouse to Disaster Location (km or hours) [12]
Reliable delivery Orders with Agreed Delivery Time in Days (%) [1] On-Time Delivery (%) [8] Delivery Date Reliability (%) [2]
Deliver sustainable aid Percentage of Goods Delivered From the Region (%) [11] Durability of Products and Services Delivered (1-5) [12]
Financial Funding management Ensure steady and
timely flow of donations Total Funds Available ($) [12] Total Donor Dollars Received per Time Period ($) [3]

45
Spending Capacity (dollars spent given by donors/total dollars requested to donors) [2]
Donation Velocity (days) [9] Percentage of Donations by Private/Institutional/Governmental Donors (% of total
donations) [12] Percentage of Earmarked Donations (%) [12]
Cost management
Ensure efficient use of
funds in a transparent
manner
Total Dollars Spent ($) [2 + 11] Total Cost of Resources Used ($ amount or % of total dollars spent) [3] Cost of Goods ($ amount or % of total dollars spent) [2] Order/Setup Costs ($ amount or % of total dollars spent) [3] Average Procurement Cost ($ amount or % of total dollars spent) [1] Transportation Cost ($ amount or % of total dollars spent) [2+11] Total Cost of Distribution Including Transportation and Handling Cost ($ or % of total
dollars spent) [3] Warehousing Cost ($ amount or % of total dollars spent) [1+2] Inventory Holding Costs ($ amount or % of total dollars spent) [3] Overhead Costs ($ amount or % or total dollars spent) [3] Administrative Costs ($ amount or % of total dollars spent) [12] Fundraising Costs ($ amount or % of total dollars spent) [12] Cost Recovery YTD (%) [1] Cost Efficiency (%) [8] Financial Efficiency (%) [5]
Budgeting Develop, monitor and
adjust budgets
Unit Budget ($) [12] Project Budget ($) [12] Deviation From Unit Budget YTD (%) [1]

46
Deviation From Project Budget YTD (%) [1]
Internal
Processes
Operations
management
Efficient and effective
processes/operational
excellence in processes
Average Response Time (days) [2+3] Order Lead Time (days) [11] Goods to Delivery Time (days) [2] Order Fulfillment Cycle Time (days) [8] Days to Activate and End Supply Chain (days) [11] On-time Delivery (%) [8] Target Fill Rate Achievement (%) [3] Order Fulfillment Rate (%) [8] Average Backorder Level (%) [3] Delivery Performance (1-5 or %) [1] Percentage of Prepositioned Goods (%) [2]
Available Stock Capacity to Supply Specified Amount of People in Specified Amount
of Time (%) [1] Stock-out Probability (%) [3] Number of Stock-outs (number or % of cycles) [3+6] Accuracy of Stock Records (%) [4] Supply Chain Adaptability (1-5) [8] Volume Flexibility (scale from 1-5) [2] Mix Flexibility (scale from 1-5) [2] Relief Stock Turnover Rate YTD (%) [1] Percentage of Goods not Distributed (%) [2] Inventory Obsolescence ($ amount or %) [3]
Donor management Target, acquire and
retain donors
Advertising Costs to Acquire a New Donor ($) [12] Percentage of New/Recurring Donors (%) [12] Donor Satisfaction Level (1-5) [2]

47
Provide feedback and
information to donors On-time Reporting to Donors (G, Y, R) [1] Donor Satisfaction with Reporting (G, Y, R) [12]
Partner management
Build partnerships with
local government Degree of Cooperation (1-5) [2]
Target, acquire and
retain partners
Degree of Cooperation (1-5) [2] Stocks Managed by Service Agreements (%) [1] Degree of Information Sharing (1-5) [2] Degree of Standardization (1-5) [2]
Innovation processes
Identify, develop and
manage new products
and services
Degree of Innovation of the Supply Chain (1-5) [12] Adoption Rate of New Products and Technologies (1-5) [12]
Regulatory and social
processes
Ensure compliance with
regulations Degree of Compliance with Legal Requirements (1-5) [12] Degree of Compliance with Environmental Standards (1-5) [12]

48
Learning and
Growth
Human capital
Build and expand supply
chain skills and
competencies
Level of Supply Chain Skills and Competencies (1-5) [12] Staff Development (%) [1] Human Resources Efficiency (1-5) [8] Percentage of Staff Participating in Training Programs (%) [9]
Manage job turnover Percentage of Job Turnover (%) [12] Training Cost Associated With Job Turnover ($) [12]
Information capital
Develop, utilize and
capitalize on supply
chain information and
communication
technology (ICT)
Level of Information and Communication Technology Available (1-5) [12] Application of Information and Communication Technology in Everyday Practice (1-5)
[12] Procurement Transactions Using Information and Communication Technology (%) [1]
Organizational capital
Nurture local leadership Percentage/Number of Local Workers Employed (% or number) [12]
Foster team work
internally and with
partners
Degree of Team Work with Partners (1-5) [12] Degree of Team work Internally (1-5) [12]
Integrate volunteers Share of Volunteers of Total Staff (%) [12] Volunteer Hours [9]
Sources: [1] Schulz and Heigh (2009), [2] Santarelli et al. (2013), [3] Beamon and Balcik (2008), [4] Van der Laan, Brito and Vergunst 2009, [5] Davidson (2006),
[6] Beamon and Kotleba (2006), [7] Medina-Borja, Pasupathy and Triantis (2007), [8] Blecken et al. (2009), [9] Kumar, Niedan-Olsen and Peterson (2009), [10]
Quiang and Nagurney (2012), [11] Gatignon, Van Wassenhove and Charles (2010) [12] additional measures identified by the author of this thesis
Notes: The measurement units are indicated in parentheses after the performance measure. Here, “1-5” refers to “on a scale from 1-5” and “G, Y, R” to the
traffic-light colors “green, yellow and red.”

49
Appendix 2: Interview guide
Introduction
Introduction of the interviewer
Topic of the scientific investigation
Procedure of the interview
Questions to the interviewer
0. Personal Background
What knowledge/experience do you have concerning humanitarian supply chain management?
How is your job related to the field of humanitarian supply chain management? Have any of your
former jobs been related to this field?
How many years of knowledge/experience do you have in this area?
Is your knowledge/experience rather theoretical or practical?
1. Performance Measurement
What are the challenges concerning performance measurement in the disaster relief context and
what requirements should performance measurement frameworks meet?
What are some of the unique challenges you have experienced/know of concerning
humanitarian supply chain performance measurement, especially with regards to disaster relief
situations?
What requirements does an effective performance measurement framework in this context have
to meet?
What performance measurement frameworks do you know of and how do they deal with the
unique challenges of the field?
2. Balanced Scorecard
2.1. Balanced Scorecard Perspectives
50
How do the four perspectives of the Balanced Scorecard need to be adapted in order to be applicable
in this context?
Are the four perspectives of the framework appropriate?
What changes would you suggest? Please give an explanation.
Donors are often considered as customers in the non-profit context. Should the “customer
perspective” (here beneficiary perspective) be divided into two to include the donor? Should
donors be given their own perspective?
2.2. Balanced Scorecard Performance Measures
What are appropriate performance measures to track in this context?
Please select four to five performance measures from each of the four perspectives and quickly
explain your choice. Please start with the most relevant measure and end with the least relevant.
Is the framework missing any important performance measures? If yes, under which perspective
would you place this performance measure? What objective does it measure?

51
2.3. Balanced Scorecard Performance Measures
What are appropriate performance measures to track in this context?
Please select four to five performance measures from each of the four perspectives and quickly
explain your choice. Please start with the most relevant measure and end with the least relevant.
Is the framework missing any important performance measures? If yes, under which perspective
would you place this performance measure? What objective does it measure?
2.4. Applicability
To what extent is the Balanced Scorecard applicable for measuring supply chain performance in the
disaster relief context?
What do you consider strengths and weaknesses of the Balanced Scorecard framework?
How would you rate the Balanced Scorecard as a performance measurement framework?
How does the Balanced Scorecard deal with the unique challenges of supply chain performance
measurement in the disaster relief context?
2.5. Recommendations Concerning the Implementation
What are recommendations for humanitarian organizations concerning the implementation of the
Balanced Scorecard as a performance measurement framework?
What should organizations consider when they customize the framework for their needs?
What should organizations consider when they implement the framework?