Embed Size (px)
Citation preview
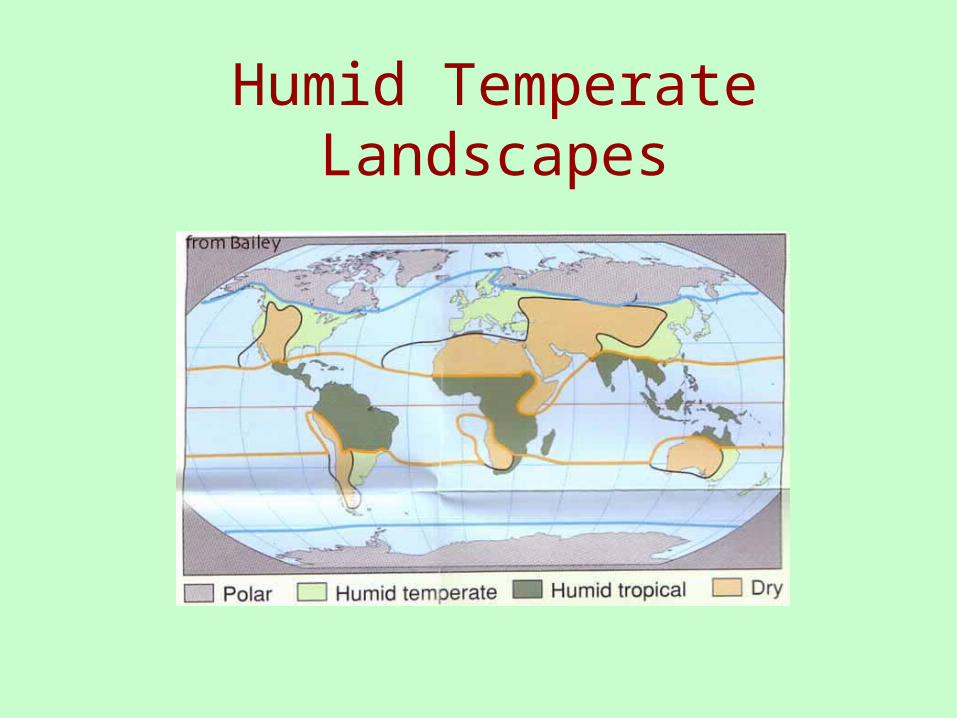
Humid Temperate Landscapes

A Regional Approach
All elements of physical geography integrated in the ecoregion approach of Robert Bailey, UCLA Geographer, U.S. Forest Service

For GCU 672 s
• Intertropical Convergence Zone (ITCZ) – brings summer rains in equatorial &
tropical latitudes
Subtropical High – brings drought, annually or seasonally
Polar Front – brings precipitation in the midlatitudes
Polar Easterlies – the cold landscapes of tundra and ice caps
Organized by basic climate processes controlling precipitation and temperature

Organization
• 1st – climate• 2nd – soils • 3rd – landforms• & hydrology• 4th – biogeography• with emphasis on the role of humans in
transporting invading species

ClimateTemperate & Cold Humid Environments
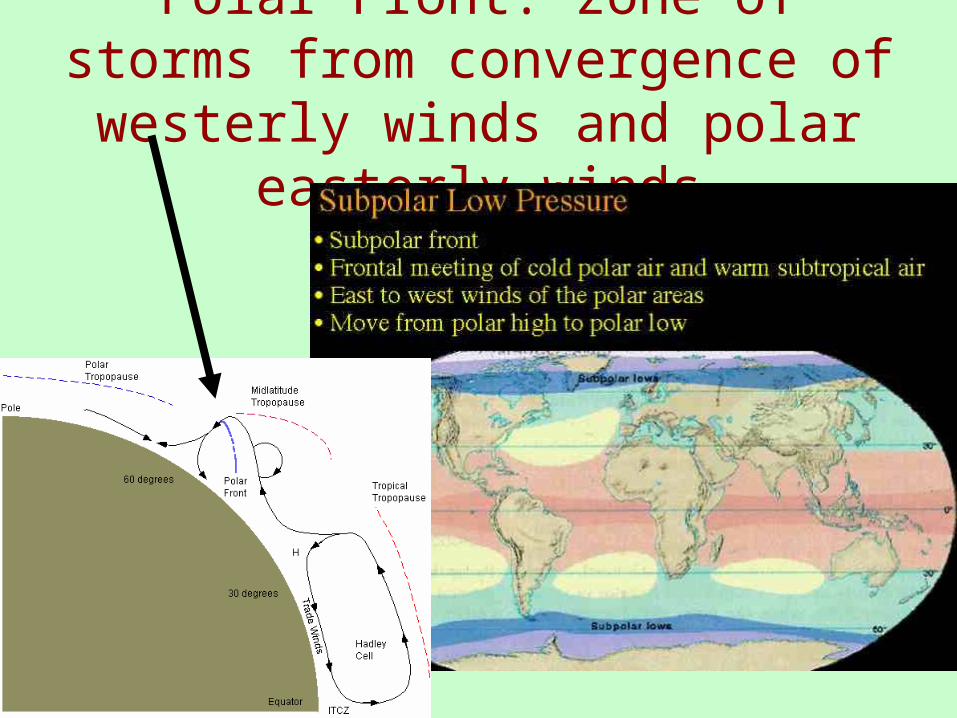
Polar Front: zone of storms from convergence of westerly winds and
polar easterly winds

Polar Jet above Polar Front

Jet Streams direct our storms

Variety of Moist Temperature & Cold Climates
• Warm & Cold Seasons
• Year-Round Precipitation
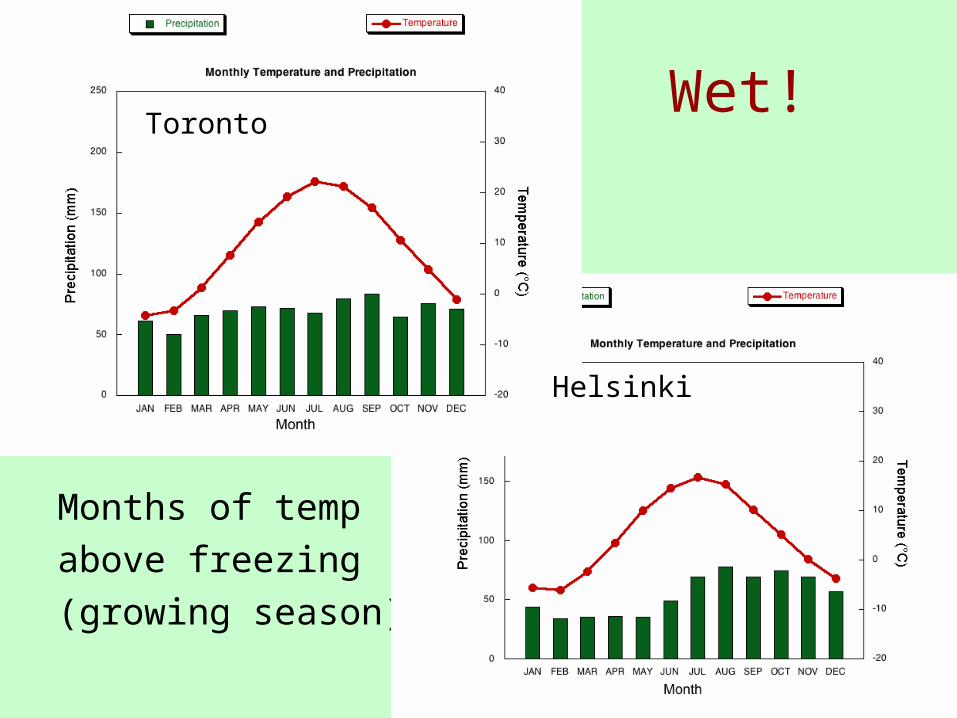
Wet!
Months of temp
above freezing
(growing season)
Helsinki
Toronto

Net Result: VegetationMiddle Climate:
Temperate & Coniferous
Forests & Grasslands

Soils
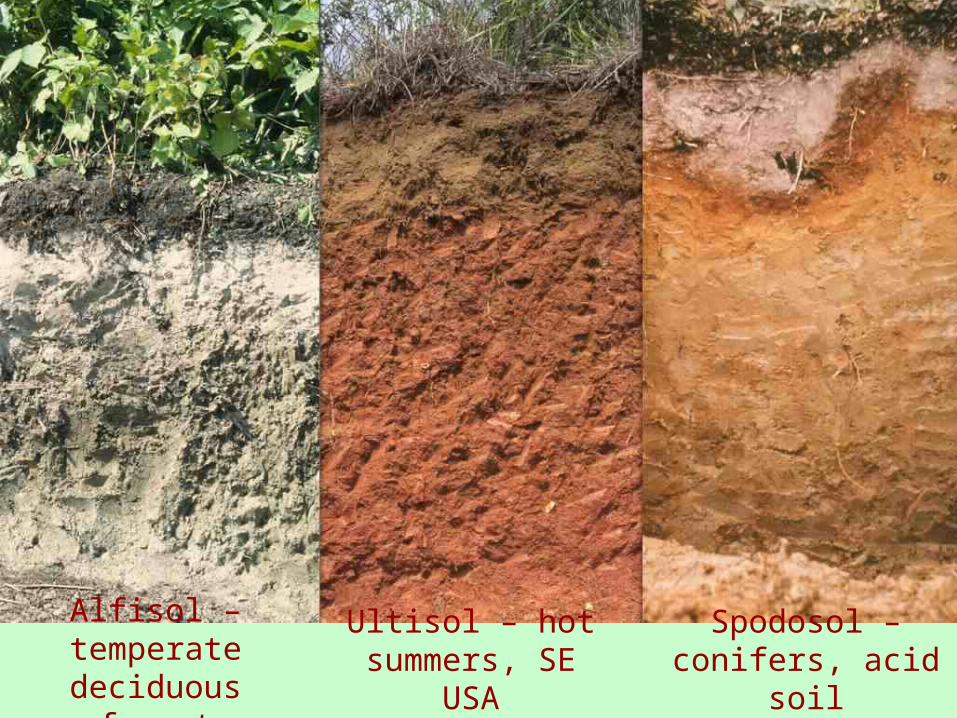
Alfisol – temperate deciduous forest
Ultisol – hot summers, SE USA
Spodosol – conifers, acid soil
Ultisol – hot
summers, SE USASpodosol –
conifers, acid soilAlfisol – temperate deciduous forest

Soil Processes
Alfisol
Organic matter accumulate
in A-horizon
clays concentrate in
B-horizona

Warm & Wet Southeast USA
Ultisol isclose totropicalsoil (oxisol)except much betternutrientholding
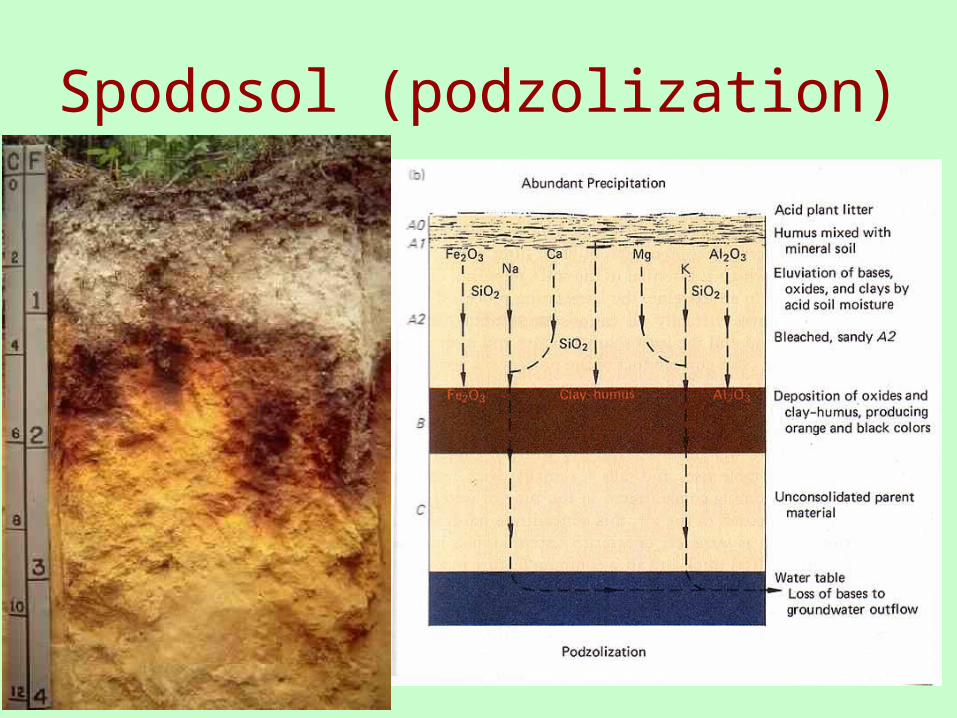
Spodosol (podzolization)
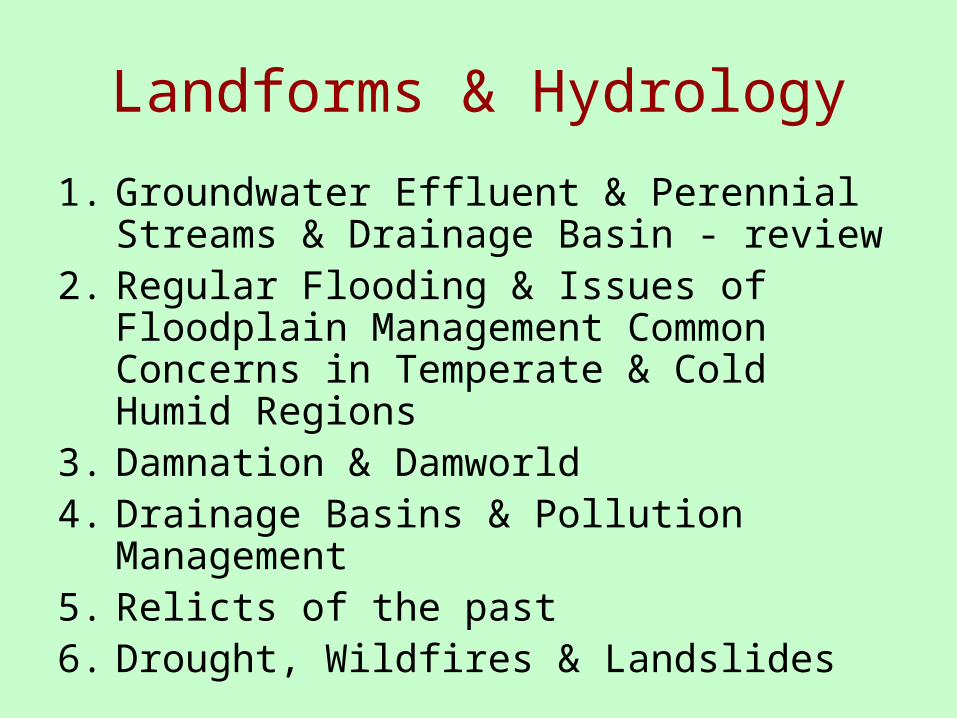
Landforms & Hydrology
1. Groundwater Effluent & Perennial Streams & Drainage Basin - review
2. Regular Flooding & Issues of Floodplain Management Common Concerns in Temperate & Cold Humid Regions
3. Damnation & Damworld4. Drainage Basins & Pollution
Management5. Relicts of the past6. Drought, Wildfires & Landslides
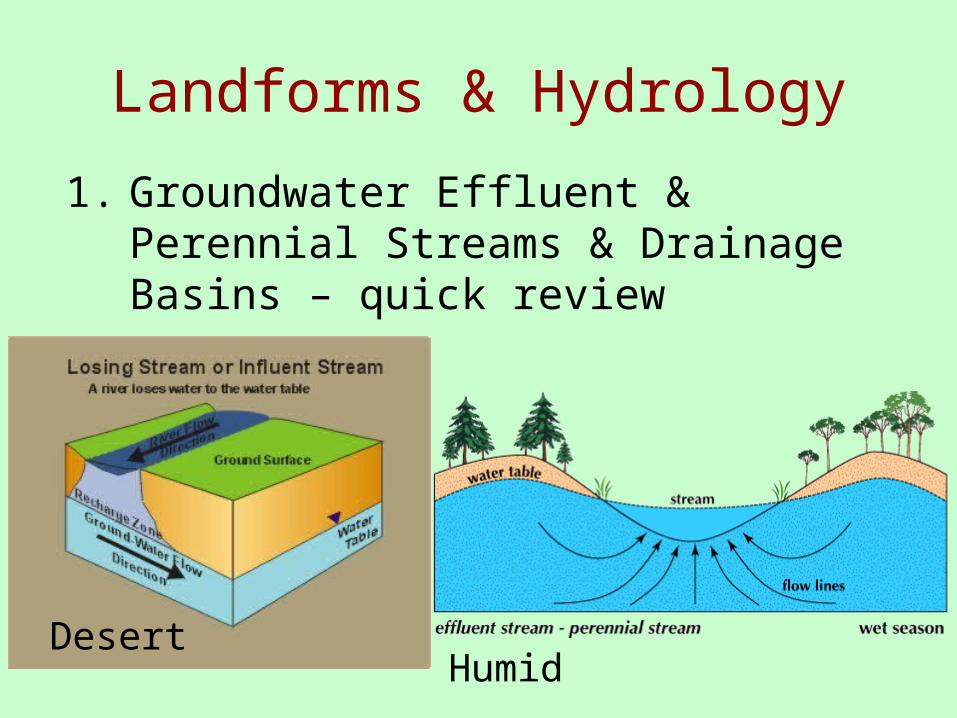
1. Groundwater Effluent & Perennial Streams & Drainage Basins – quick review
Landforms & Hydrology
DesertHumid


Water infiltrates & moves to stream
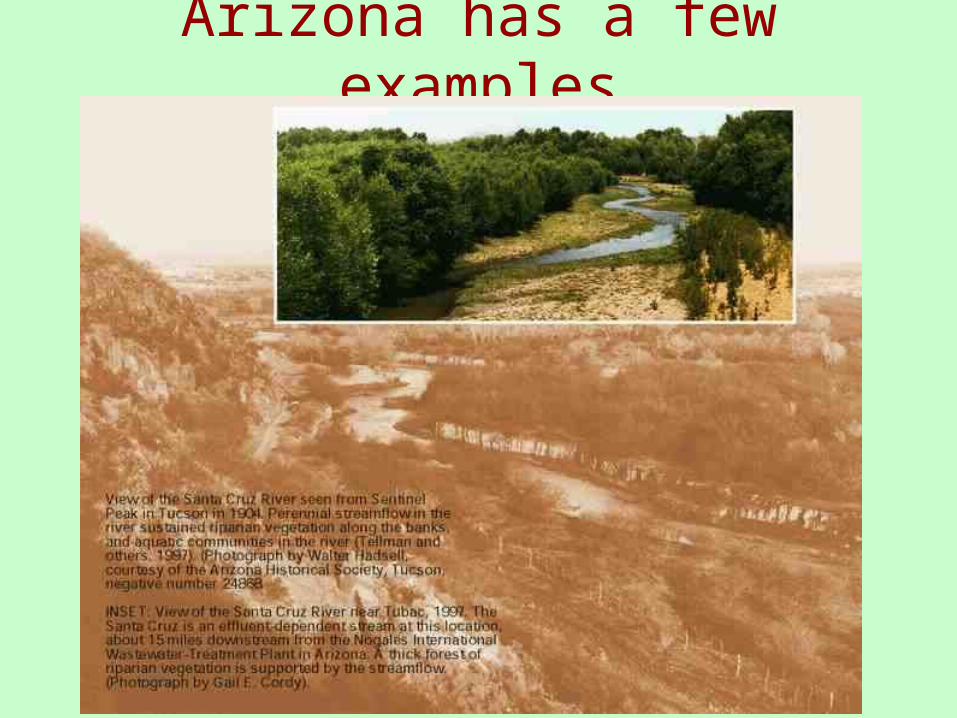
Arizona has a few examples

Perennial Streams typical in Northwest, Mountains, and Eastern USA

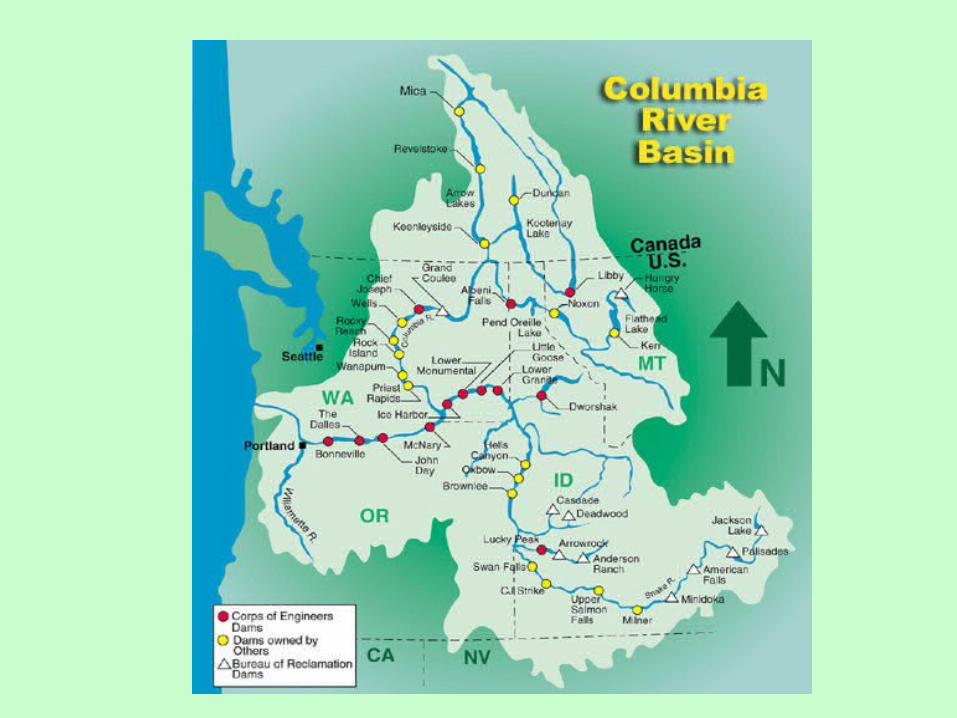
Drainage Basins ignore many political boundaries

Role and Benefits of Territorial cooperation
Projects can:
Arouse among cooperation actors a real sharing of their common problems, enhance the alpine identity, make alpine people feel that they are
part of a wider community.
increase knowledge exchanges among territories, so as to protect their heritage and prevent the hydrogeological risk
enhance the environmental sustainability of territorial choices
increase the economic integration and the competitivity of alpine communitiesbut, most of all
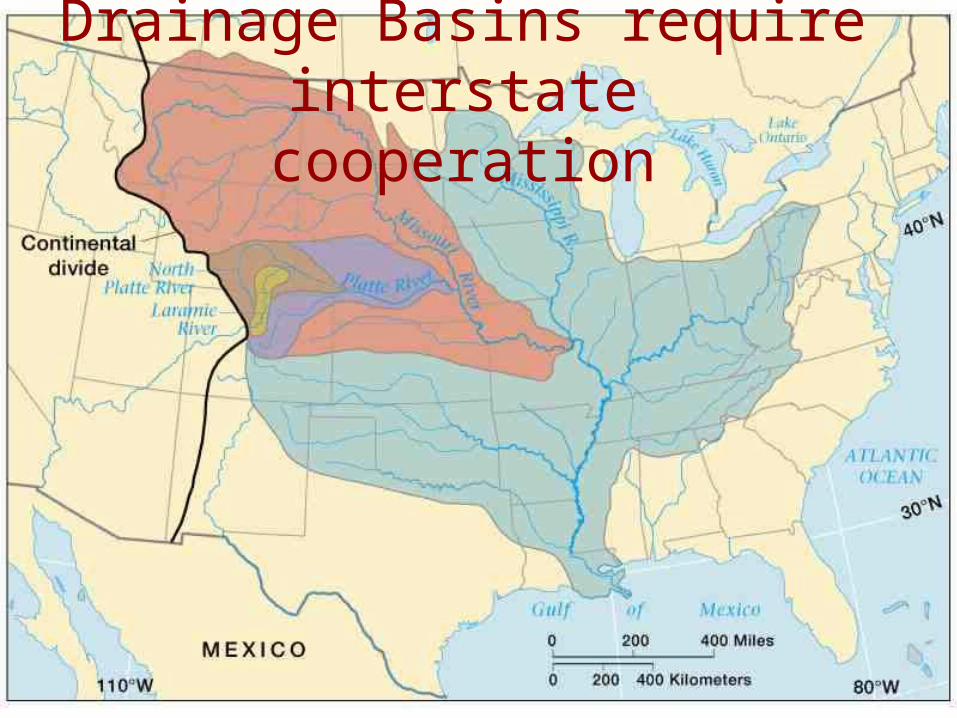
Drainage Basins require interstatecooperation

2. Regular Flooding & Issues of Floodplain Management Common Concerns in Temperate & Cold Humid Regions
Landforms & Hydrology
POTOMAC RIVER FLOODING: JUNE 28, 2006

Floodplain Definition: Geomorphic perspective
That portion of a Drainage Basin that is covered by Transported Sediment that was deposited in or near a stream channel.
That portion that receives, holds, contributes and transports sediment
That portion of a Drainage Basin that is covered by Transported Sediment that was deposited in or near a stream channel.
From FEMA

Floodplain Definition
fromhabitat
perspective
That portion of a river corridor that receives and manufactures nutrients/energy and provides habitat.

Law & the Floodplain
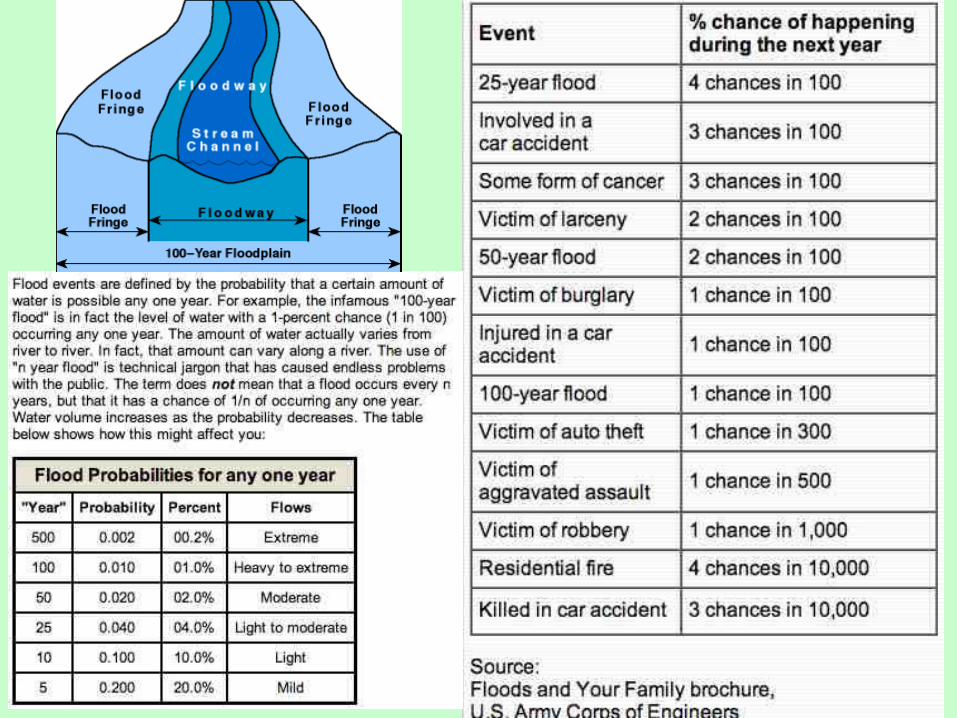
A 100 year floodplain is an area along a water course that is normally dry but has a one percent change of becoming wet in any single year.An area that receives, holds and transports excess water

Reviewing Key Definitions
• BASE FLOOD - The National Flood Insurance Program adopted the 1% chance ("100-year") flood as the base flood to indicate the minimum level of flooding to be used by a community in its floodplain management regulations and where flood insurance may be required.
• FLOODPLAIN - Low lands adjoining the channel of a river, stream, or watercourse, or ocean, lake or other body of water, which have been or may be inundated by flood water in a 1% chance flood event.
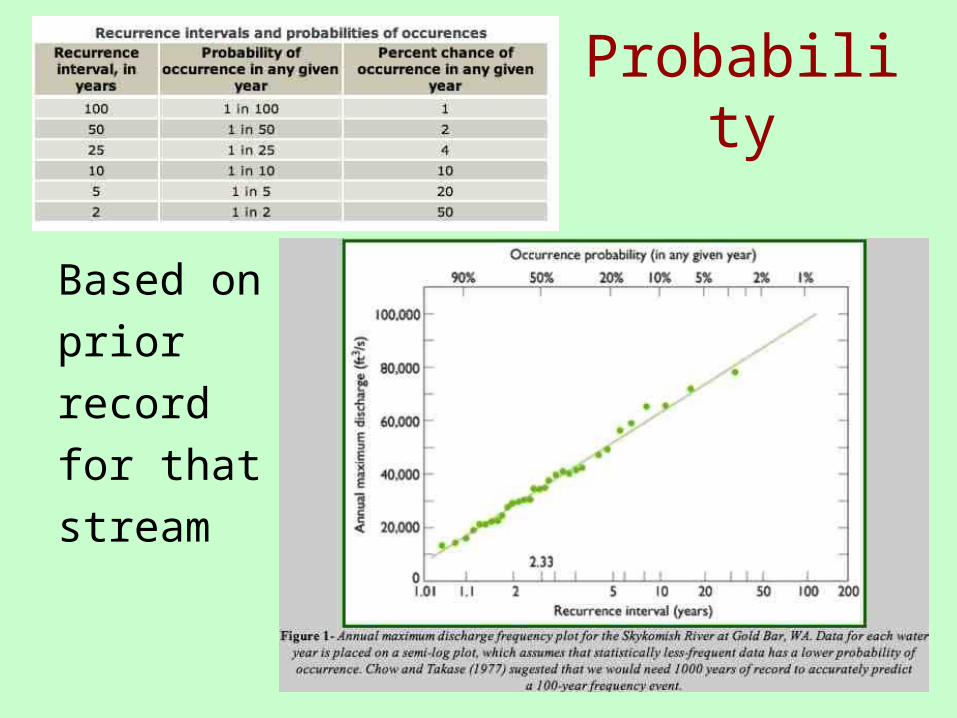
Probability
Based on
prior
record
for that
stream
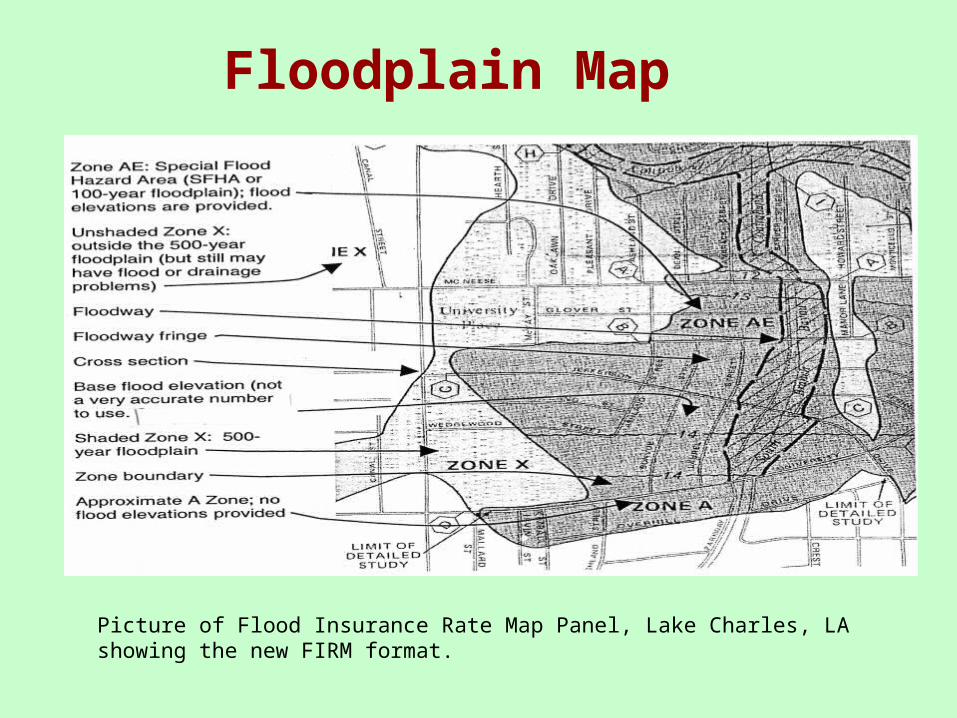
Floodplain Map
Picture of Flood Insurance Rate Map Panel, Lake Charles, LA showing the new FIRM format.
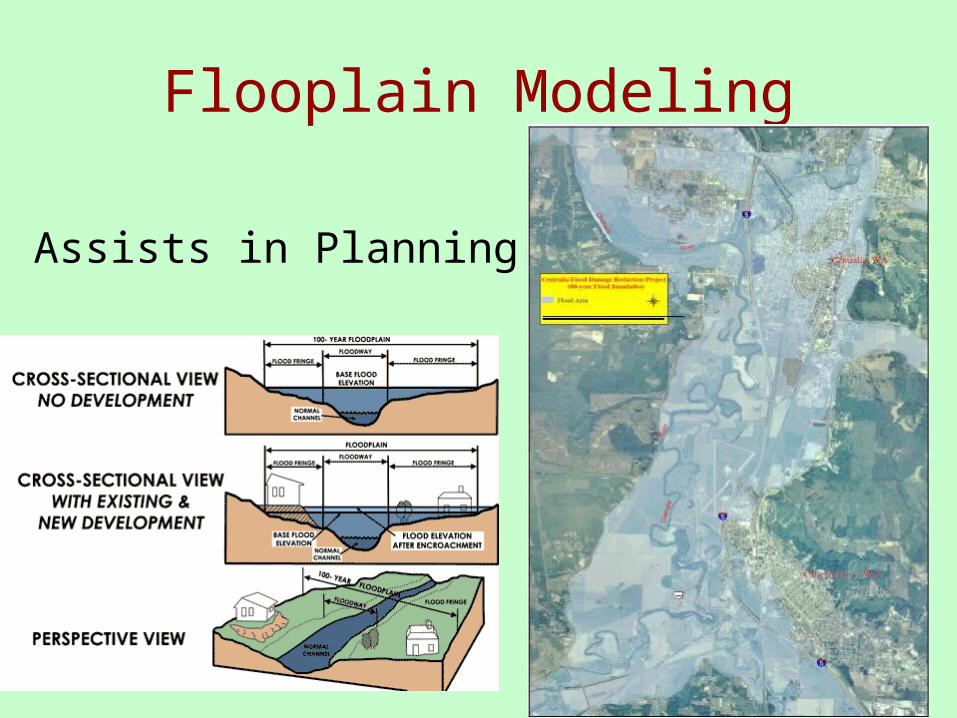
Flooplain Modeling
Assists in Planning

1 2 3 4 5 6
1990s
1980s
1970s
1960s
1950s
1940s
1930s
1920s
1910s
BILLIONS (adjusted to 1999 dollars)
Trends in Flood Damages
• $6 billion annually
• Four-fold increase from early 1900s
• Per Capita Damages increased by more than a factor of 2.5 in the previous century in real dollar terms

PresidentialDisaster
Declarations
MostlyTemperate
Humid

PHILADELPHIA: DEBRIS FROM FLOODING ON SCHUYLKILL RIVER

SYDNEY, NY: ROAD WASHOUT
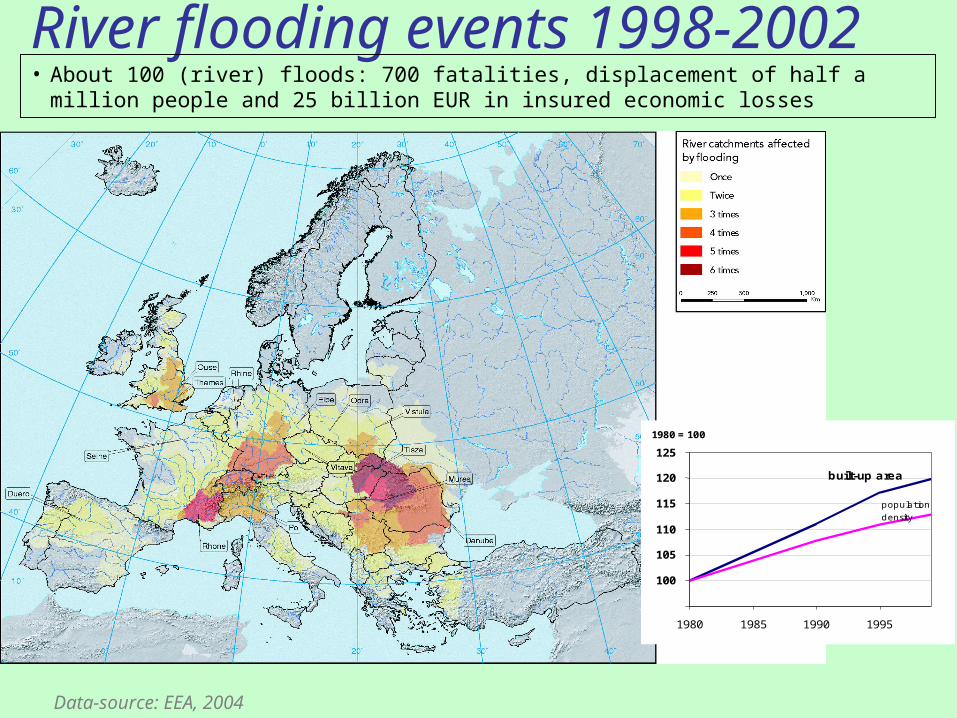
River flooding events 1998-2002 • About 100 (river) floods: 700 fatalities, displacement of half a million people and
25 billion EUR in insured economic losses
100
105
110
115
120
125
1980 1985 1990 1995
built-up area
1980 = 100
population density
Data-source: EEA, 2004

Elbe Flood 2002Elbe Flood 2002
Road betweenRoad betweenBitterfeld andBitterfeld and
Eilenburg, SaxonyEilenburg, Saxony

Planning, but what then?

Cincinnati Riverfront
Source: Port of Greater Cincinnati Development Authority
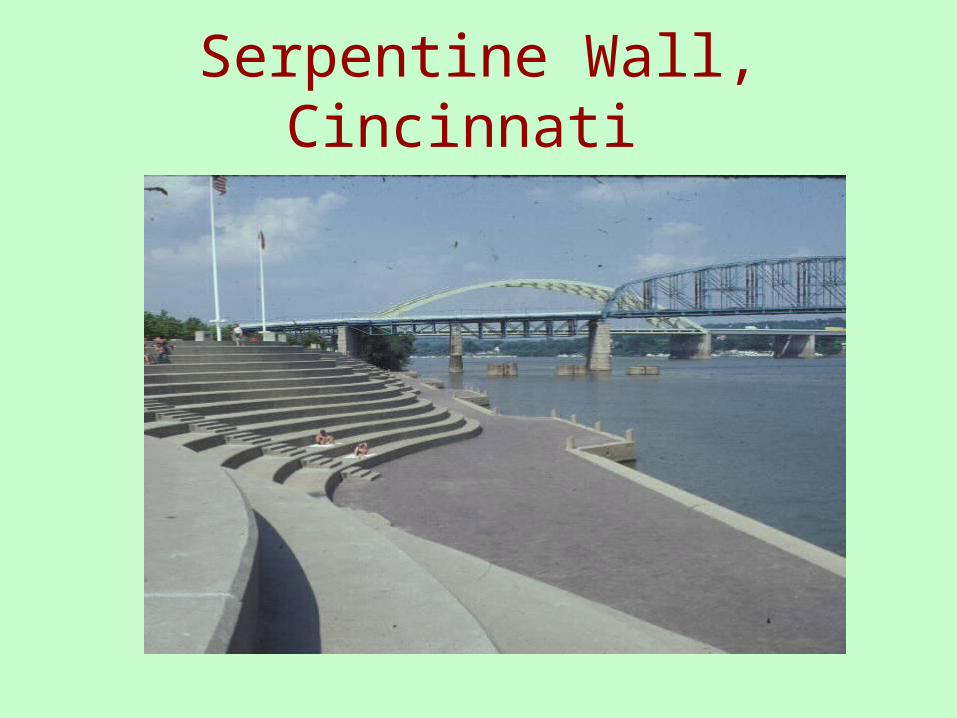
Serpentine Wall, Cincinnati

Savannah River Levee, Augusta, Georgia

Tom McCall Riverfront Park, Portland, Oregon

Indian Bend Wash,
Scottsdale, AZ
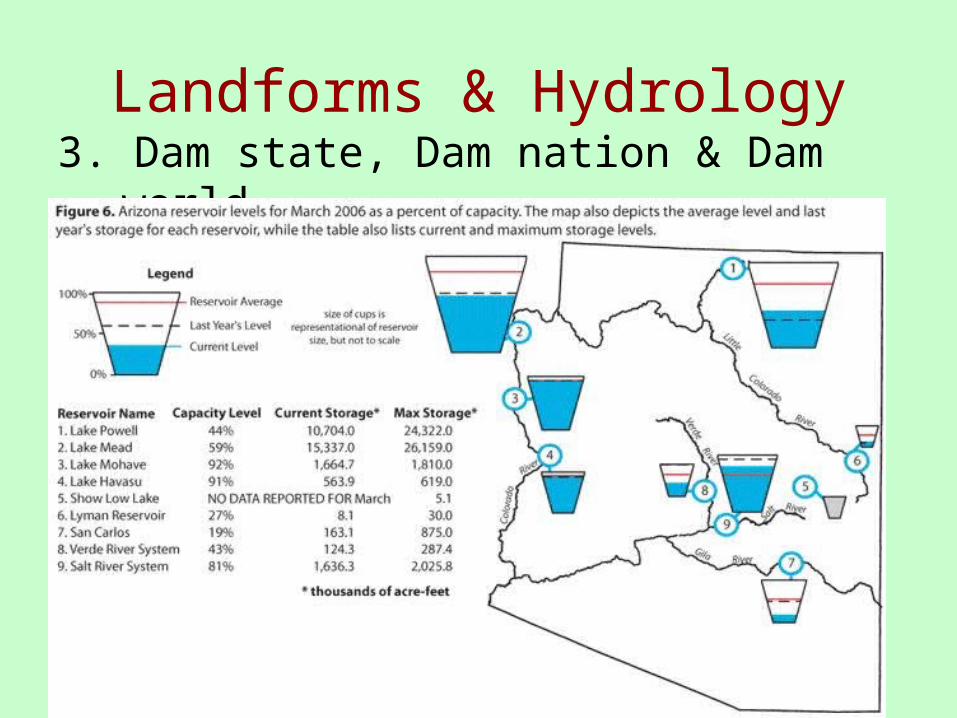
3. Dam state, Dam nation & Dam worldLandforms & Hydrology

Colo.River Dams
Hoover Dam
Glen Canyon Dam

Lake Powell and the Colorado River, Colorado Plateau, UT-AZLake Powell and the Colorado River, Colorado Plateau, UT-AZ“The building of Glen Canyon Dam ushered in the modern environmental
movement…” -- David Brower, Sierra Club
“The canyonlands did have a heart, aliving heart, and that heart was GlenCanyon and the wild Colorado.”
-- Edward Abbey
50
Glen Canyon Dam
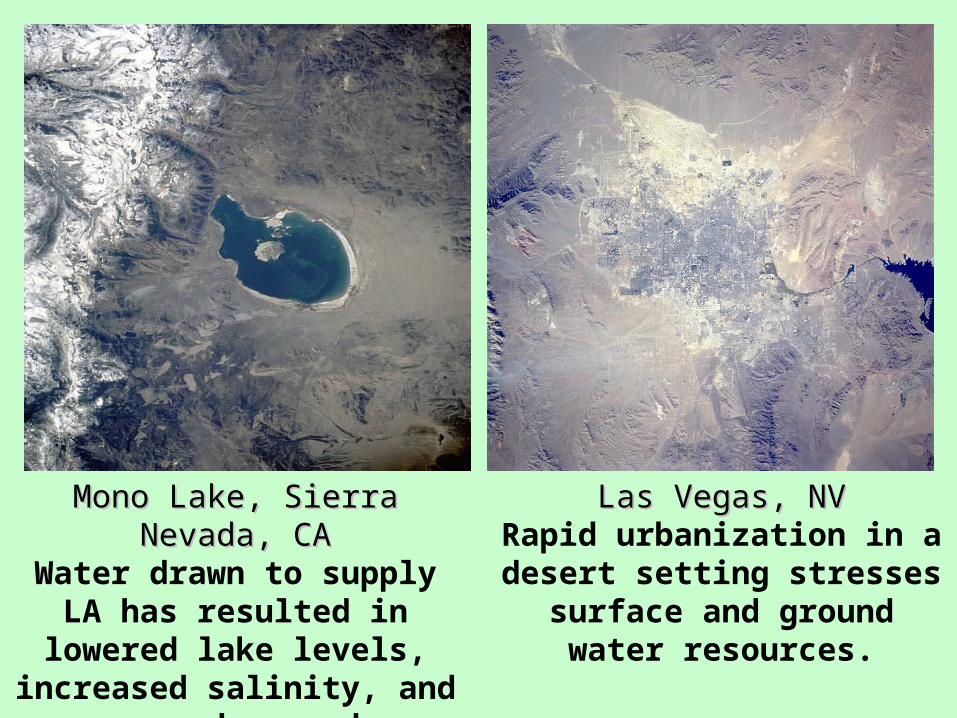
Mono Lake, Sierra Nevada, CAMono Lake, Sierra Nevada, CAWater drawn to supply LA has resulted in lowered lake levels,
increased salinity, and an endangered ecosystem.
Las Vegas, NVLas Vegas, NVRapid urbanization in a desert
setting stresses surface and ground water resources.

Upper Mississippi River SystemUpper Mississippi River System
• 37 Lock Sites
• 1,200 Miles of River
• Significant Ecosystem
(2.7 million acres)
• Constructed 1930-45
2
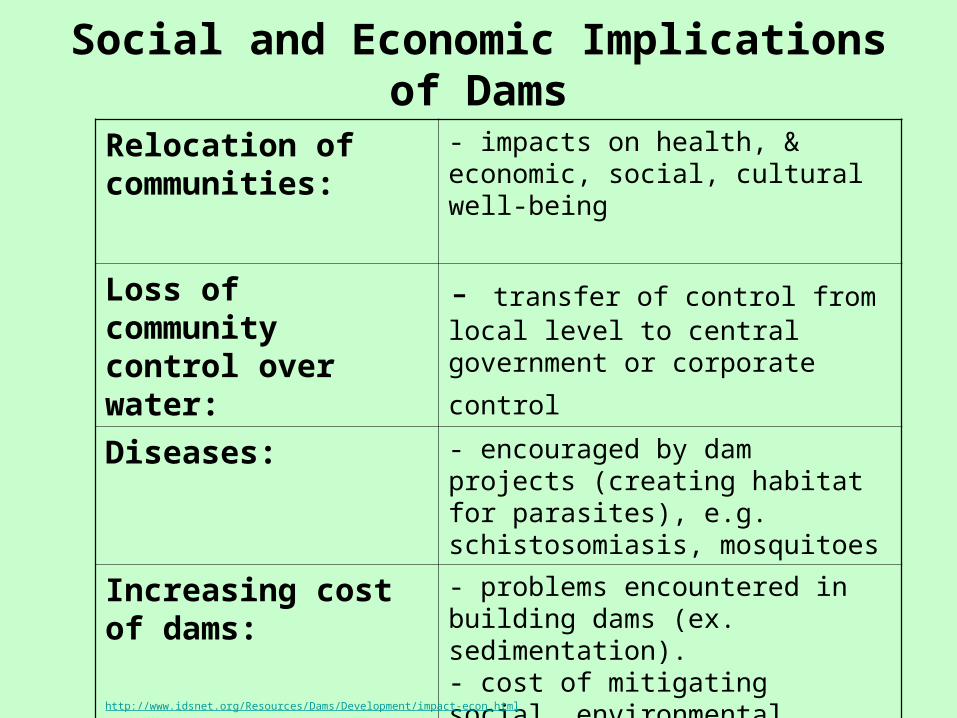
Social and Economic Implications of Dams
Relocation of communities:
- impacts on health, & economic, social, cultural well-being
Loss of community control over water:
- transfer of control from local level to central government or corporate
control Diseases: - encouraged by dam projects
(creating habitat for parasites), e.g. schistosomiasis, mosquitoes
Increasing cost of dams:
- problems encountered in building dams (ex. sedimentation).- cost of mitigating social, environmental impacts.- delays- best sites already taken -- only more remote, more difficult sites left. http://www.idsnet.org/Resources/Dams/Development/impact-econ.html

Dams can promote Malaria
• single-celled protozoa Plasmodium
• transmitted by Anopheles mosquitoes
• causes 1 million deaths per year
• fever-like symptoms• high resistance to
drugs
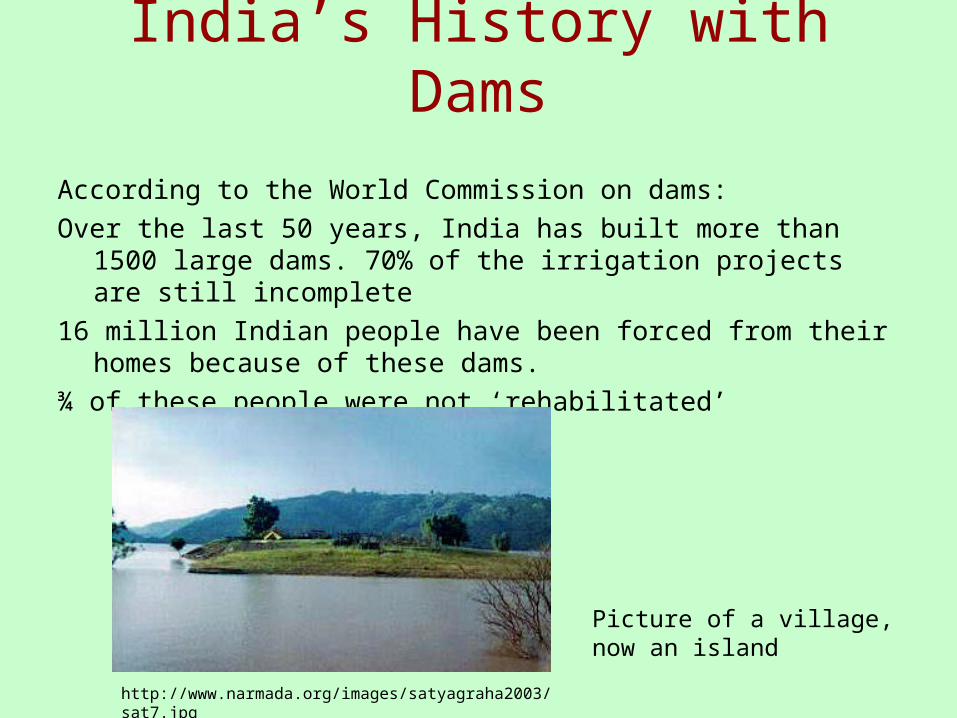
India’s History with Dams
According to the World Commission on dams:
Over the last 50 years, India has built more than 1500 large dams. 70% of the irrigation projects are still incomplete
16 million Indian people have been forced from their homes because of these dams.
¾ of these people were not ‘rehabilitated’
Picture of a village, now an island
http://www.narmada.org/images/satyagraha2003/sat7.jpg

Changes due to Three Gorges Dam construction, China
Changes due to the construction of dam
• 1987: Nature of the river and surrounding landscape before the dam
• 2004: The enormous dam is clearly visible

Changes due to Atatürk Dam, Turkey
Development of Harran region is strikingly apparent in these images
Right-hand corner of the 1999 image shows irrigated fields surrounding the town of Harran
The dam provides power and irrigation water
Imagery seen in this presentation is courtesy of Ron Dorn and other ASU colleagues, students and colleagues in other academic departments such as Profs. Oberlander at U.C. Berkeley, individual illustrations in scholarly journals such as Science and Nature, scholarly societies such as the Association of American Geographers, city, state governments, other countries government websites and U.S. government agencies such as Dr. Robert Bailey and the U.S. Forest Service, FEMA, NASA, USGS, NRCS, Library of Congress, U.S. Fish and Wildlife Service USAID and NOAA.