Embed Size (px)
Citation preview
Application Note
Hunting Interference with the Tektronix RF Scout
Interference in Today’s Wireless Networks
Today’s cellular systems often experience interference. This can show up as poor voice quality,
dropped calls, or low data rates. As network operators add voice and 3G data services, the
licensed bands become even more susceptible to interference. In addition, the trend to co-location
of wireless systems, while desirable from some points of view, contribute to the potential for
interference. This application note will discuss potential sources and types of interference and
provide a simplified process to aid in the process of locating, troubleshooting and mitigating
RF interference on your network.
Hunting Interference with the Tektronix RF ScoutApplication Note
2 www.tektronix.com/fieldtest222
3G data services are particularly sensitive to interference.
In this case, interference directly affects the data rate. As
signal quality degrades, 3G systems add protection bits to
the data stream. These extra bits ensure that the connec-
tion stays up, but slows the actual data. Even worse, if bits
are still lost, higher data layers can force re-transmissions
of the packets, slowing transmission rates even more. So
data services don’t normally fall into a “Pass/Fail” categories
like voice calls usually do. Rather, data rates are affected,
sometimes dramatically, by signal quality issues such as
interference.
A data pipe makes a good analogy. One with little interfer-
ence allows maximum bandwidth to pass. However when
there is interference, the resulting data protection added
by the 3G system reduces data throughput. This reduction
can be dramatic.
In the wireless world, interference is simply defined as any
undesired signal that diminishes the quality of voice or data
traffic over the RF or Air Interface. This interference, often
referred to as noise, is often the cause of dropped calls,
noisy connections, and slow date rates. The fix is usually
either installing more base station capacity or eliminating
the interference. While interference has many causes, the
result of interference is lower quality voice signals, lower
data rates, and ultimately, user dissatisfaction.
Finding and fixing interference problems requires the ability
to recognize potential sources of interference and the tools
to locate those sources. So the first step in recognizing
sources of interference is to understand how interfering
signals do their damage.
Receiver De-Sense and Blocking The mechanism of interference is a receiver characteristic
called De-Sense, or in extreme cases, Blocking. It turns out
that other people’s signals appearing in your uplink band
can reduce the sensitivity of your receiver. The interfering
signals do not need to be on your channel, but may be in
the same receive band. This is commonly called Receiver
Desensitization or “De-Sense”.
Because of this, receivers normally have a band pass filter,
or pre-selector, designed to limit the frequency bands
allowed into the receiver input. For instance a GSM 900
BTS receiver would have a band pass filter that passed
signals between 880MHz and 990MHz (uplink band). By
allowing these signals and rejecting others, the receiver is
allowed to operate in a quieter environment. This allows the
receiver to be more sensitive and receive quieter signals.
However, receiver pre-selectors do not normally have a
sharp cut-off frequency. This is due to equal parts econom-
ics and limitations of the technology. If a legitimate signal
is present in a nearby frequency band, as shown above,
the receiver will sum the power of this signal with the
power of the desired, in-band signal, and reduce its gain
accordingly. This can cause the desired signal to be
reduced to the point were it is noisy. The sensitivity of
the receiver has been reduced, and that’s where the term
De-Sense comes from.
When a De-Sense problem becomes severe, reception
may be completely prevented. The fault is now termed
“Receiver Blocking.”
Data Data
No Interference
Data Data
Interference
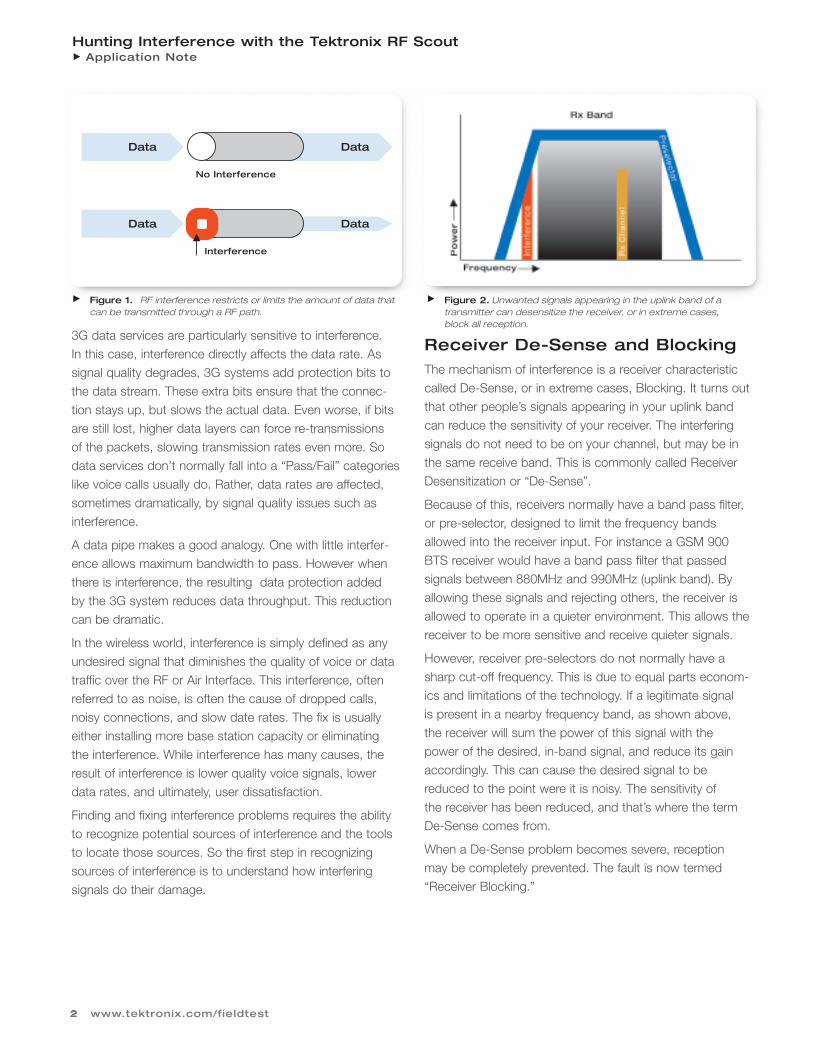
Figure 1. RF interference restricts or limits the amount of data thatcan be transmitted through a RF path.
Figure 2. Unwanted signals appearing in the uplink band of a transmitter can desensitize the receiver, or in extreme cases, block all reception.
Hunting Interference with the Tektronix RF ScoutApplication Note
3www.tektronix.com/fieldtest
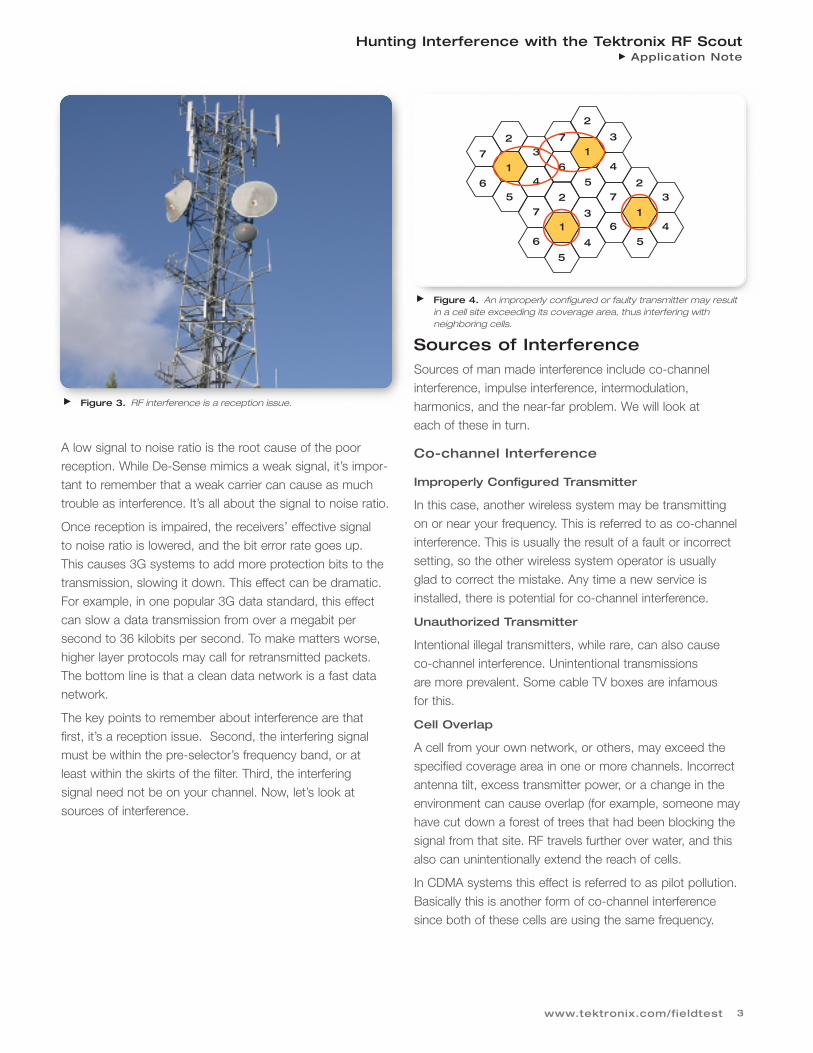
Figure 3. RF interference is a reception issue.
A low signal to noise ratio is the root cause of the poor
reception. While De-Sense mimics a weak signal, it’s impor-
tant to remember that a weak carrier can cause as much
trouble as interference. It’s all about the signal to noise ratio.
Once reception is impaired, the receivers’ effective signal
to noise ratio is lowered, and the bit error rate goes up.
This causes 3G systems to add more protection bits to the
transmission, slowing it down. This effect can be dramatic.
For example, in one popular 3G data standard, this effect
can slow a data transmission from over a megabit per
second to 36 kilobits per second. To make matters worse,
higher layer protocols may call for retransmitted packets.
The bottom line is that a clean data network is a fast data
network.
The key points to remember about interference are that
first, it’s a reception issue. Second, the interfering signal
must be within the pre-selector’s frequency band, or at
least within the skirts of the filter. Third, the interfering
signal need not be on your channel. Now, let’s look at
sources of interference.
Sources of InterferenceSources of man made interference include co-channel
interference, impulse interference, intermodulation,
harmonics, and the near-far problem. We will look at
each of these in turn.
Co-channel Interference
Improperly Configured Transmitter
In this case, another wireless system may be transmitting
on or near your frequency. This is referred to as co-channel
interference. This is usually the result of a fault or incorrect
setting, so the other wireless system operator is usually
glad to correct the mistake. Any time a new service is
installed, there is potential for co-channel interference.
Unauthorized Transmitter
Intentional illegal transmitters, while rare, can also cause
co-channel interference. Unintentional transmissions
are more prevalent. Some cable TV boxes are infamous
for this.
Cell Overlap
A cell from your own network, or others, may exceed the
specified coverage area in one or more channels. Incorrect
antenna tilt, excess transmitter power, or a change in the
environment can cause overlap (for example, someone may
have cut down a forest of trees that had been blocking the
signal from that site. RF travels further over water, and this
also can unintentionally extend the reach of cells.
In CDMA systems this effect is referred to as pilot pollution.
Basically this is another form of co-channel interference
since both of these cells are using the same frequency.
7
6
2
1
5
3
4
7
6
7
6
2
1
3
4
7
6
5
2
1
5
3
4
2
1
5
3
4
Figure 4. An improperly configured or faulty transmitter may resultin a cell site exceeding its coverage area, thus interfering with neighboring cells.
Hunting Interference with the Tektronix RF ScoutApplication Note
4 www.tektronix.com/fieldtest
Intermodulation (IM)
Anytime you have at least two strong signals and a non-
linear device, such as a diode, semiconductor junction, or
even rust, intermodulation signals can be produced. Using
an example of two strong signals (+10 dBm or greater),
it is possible for faulty equipment to produce signals as
shown in the next illustration.
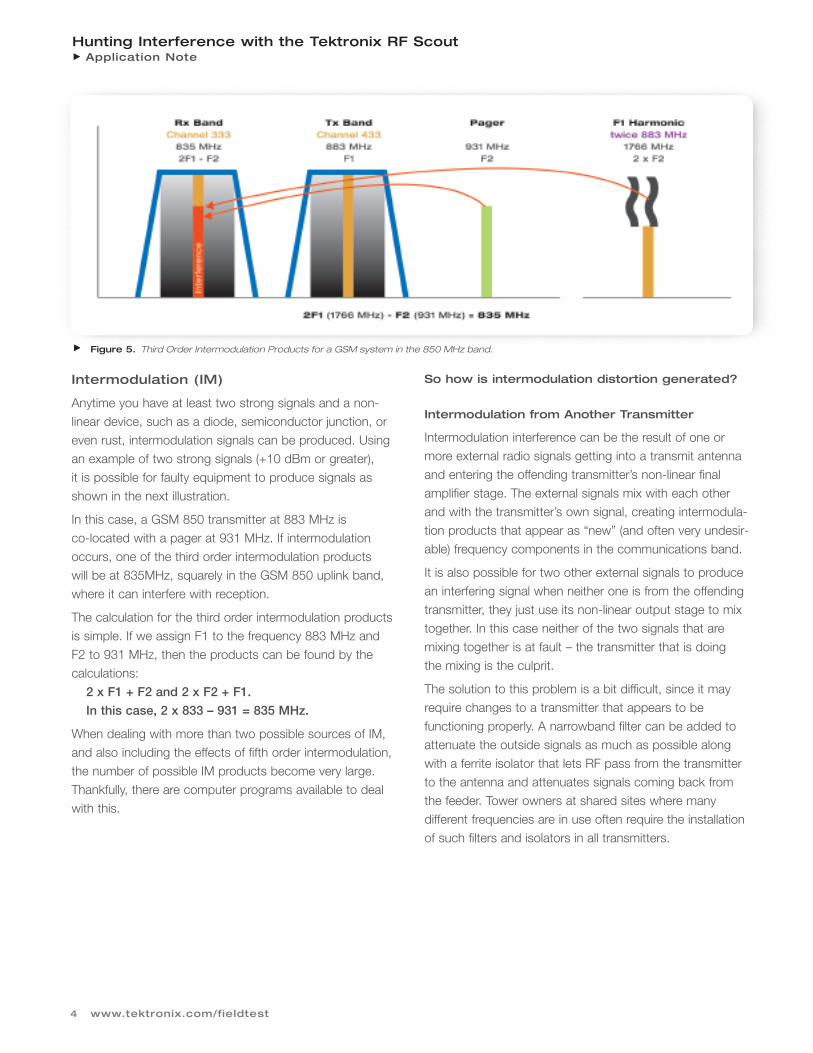
In this case, a GSM 850 transmitter at 883 MHz is
co-located with a pager at 931 MHz. If intermodulation
occurs, one of the third order intermodulation products
will be at 835MHz, squarely in the GSM 850 uplink band,
where it can interfere with reception.
The calculation for the third order intermodulation products
is simple. If we assign F1 to the frequency 883 MHz and
F2 to 931 MHz, then the products can be found by the
calculations:
2 x F1 + F2 and 2 x F2 + F1.
In this case, 2 x 833 – 931 = 835 MHz.
When dealing with more than two possible sources of IM,
and also including the effects of fifth order intermodulation,
the number of possible IM products become very large.
Thankfully, there are computer programs available to deal
with this.
So how is intermodulation distortion generated?
Intermodulation from Another Transmitter
Intermodulation interference can be the result of one or
more external radio signals getting into a transmit antenna
and entering the offending transmitter’s non-linear final
amplifier stage. The external signals mix with each other
and with the transmitter’s own signal, creating intermodula-
tion products that appear as “new” (and often very undesir-
able) frequency components in the communications band.
It is also possible for two other external signals to produce
an interfering signal when neither one is from the offending
transmitter, they just use its non-linear output stage to mix
together. In this case neither of the two signals that are
mixing together is at fault – the transmitter that is doing
the mixing is the culprit.
The solution to this problem is a bit difficult, since it may
require changes to a transmitter that appears to be
functioning properly. A narrowband filter can be added to
attenuate the outside signals as much as possible along
with a ferrite isolator that lets RF pass from the transmitter
to the antenna and attenuates signals coming back from
the feeder. Tower owners at shared sites where many
different frequencies are in use often require the installation
of such filters and isolators in all transmitters.
Figure 5. Third Order Intermodulation Products for a GSM system in the 850 MHz band.
Hunting Interference with the Tektronix RF ScoutApplication Note
5www.tektronix.com/fieldtest
Intermodulation in a Rusty Fence, Roof, etc.
Transmitters are not the only breeding ground for intermod-
ulation products – the non-linear junction could be a nearby
rusty tin roof or fence. In the presence of high-power radio
transmissions, the rust between the individual roof sections
can act as a non-linear diode.
The intermodulation effects from physical structures such
as these are difficult to pin down, since they vary with
weather conditions – as wind presses parts of the rusty
metal together and apart and rain alters the characteristics
of the rust. Seriously offending structures must be repaired
or replaced in order to restore reliable communications.
Intermodulation in Antennas or Connectors
Antennas and connectors on the antenna’s cable are
exposed to weather and humidity. As a result, they can
quickly develop corrosion. While not enough to cause signal
loss or a VSWR problem, the corrosion can act like a
very poor diode and can cause intermodulation. If there are
several transmitters near the faulty antenna or connector,
the resultant intermodulation can be strong enough to
cause dropped calls. If the culprit is an antenna, the symp-
toms tend to be consistent. If the problem is a connector
in the antenna system, and you loosen and re-tighten the
connector in the course of troubleshooting, it may go away
for a few months. In this situation you may want to take
the extra time to carefully note which connectors you are
re-loosening or re-tightening and test for a while after each.
Then if the problem goes away after touching a particular
connection, it is the likely culprit.
When looking for intermodulation problems, it’s helpful
to remember that intermodulation distortion depends on
non-linear devices such as transmitter output stages,
corrosion, perhaps in a faulty antenna, and multiple strong
signals. If one or more of the strong transmitted signals
come and go, the intermodulation will also come and go.
This can be very visible on a spectrum analyzer.
Harmonics
Harmonics are another source of interference. The term
refers to a type of transmitter fault that creates spurious
signals at multiples of the transmitter’s carrier frequency.
Many transmitters product harmonics at low levels, and
these are not normally a concern. But in two cases,
they can cause interference. The first case is when the
transmitter has a fault and produces larger than normal
harmonics. Compression, clipping, a failed output transistor,
or high VSWR due to antenna system damage can cause
this sort of failure. The second case is when the transmitter
is so powerful that the harmonics can cause interference
problems even when the harmonics are 60 to 80 dB
down from the transmitted signal. Broadcast television,
with a high transmit power, is one example of this potential
problem.
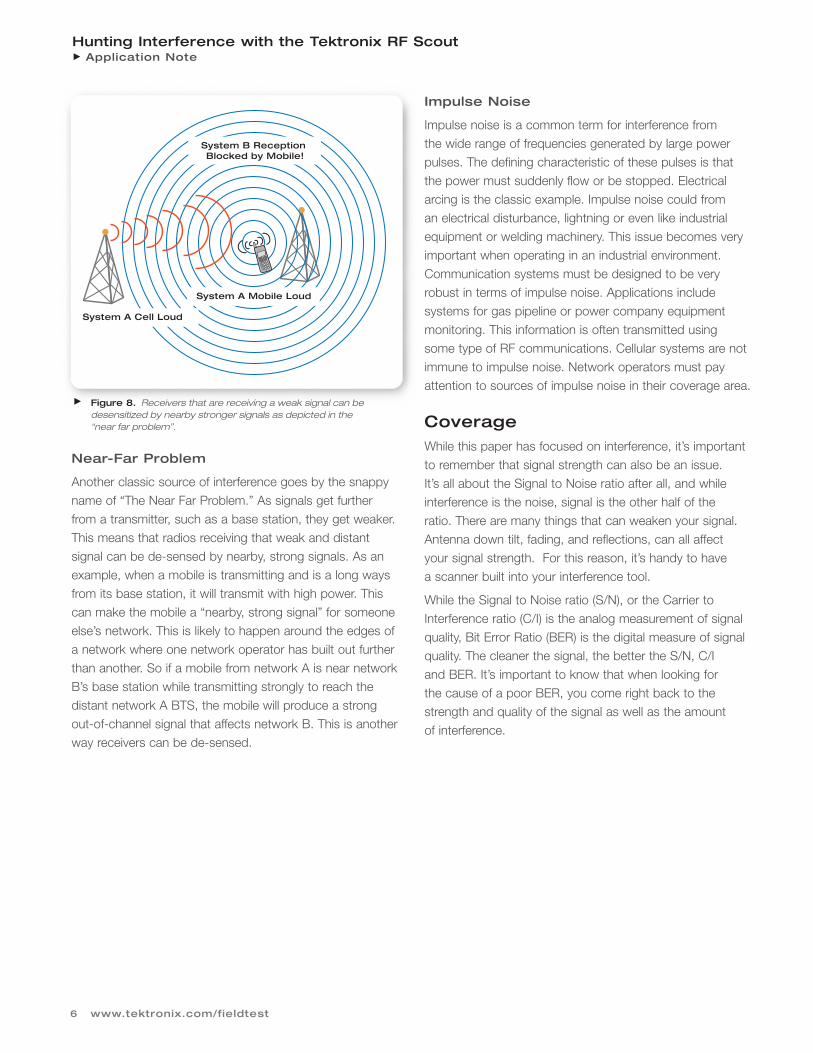
The illustration shows an example from the U. S. frequency
bands. In this case, a PCS band base station was
co-located with a UHF TV station operating on channel 38.
The third harmonic of the TV station, while legal, was still
strong enough to dramatically interfere with BTS reception,
causing Receiver De-Sense.
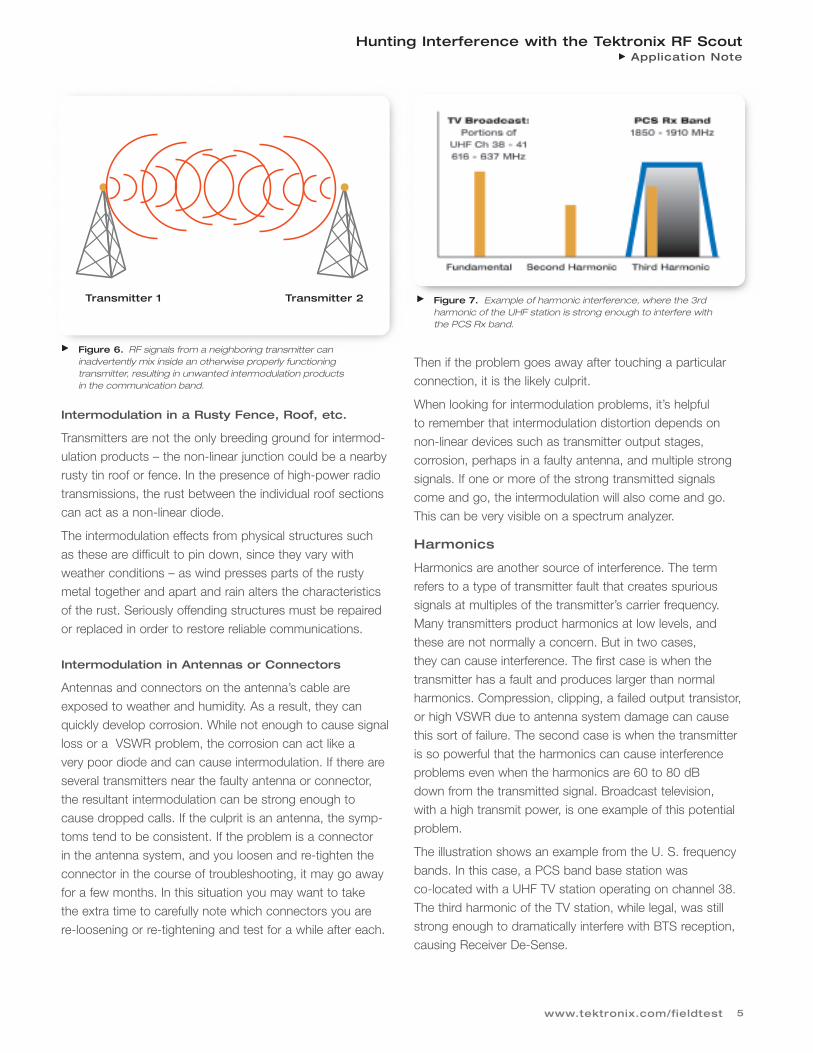
Transmitter 1 Transmitter 2
Figure 6. RF signals from a neighboring transmitter can inadvertently mix inside an otherwise properly functioning transmitter, resulting in unwanted intermodulation products in the communication band.
Figure 7. Example of harmonic interference, where the 3rd harmonic of the UHF station is strong enough to interfere with the PCS Rx band.
Hunting Interference with the Tektronix RF ScoutApplication Note
6 www.tektronix.com/fieldtest
Near-Far Problem
Another classic source of interference goes by the snappy
name of “The Near Far Problem.” As signals get further
from a transmitter, such as a base station, they get weaker.
This means that radios receiving that weak and distant
signal can be de-sensed by nearby, strong signals. As an
example, when a mobile is transmitting and is a long ways
from its base station, it will transmit with high power. This
can make the mobile a “nearby, strong signal” for someone
else’s network. This is likely to happen around the edges of
a network where one network operator has built out further
than another. So if a mobile from network A is near network
B’s base station while transmitting strongly to reach the
distant network A BTS, the mobile will produce a strong
out-of-channel signal that affects network B. This is another
way receivers can be de-sensed.
Impulse Noise
Impulse noise is a common term for interference from
the wide range of frequencies generated by large power
pulses. The defining characteristic of these pulses is that
the power must suddenly flow or be stopped. Electrical
arcing is the classic example. Impulse noise could from
an electrical disturbance, lightning or even like industrial
equipment or welding machinery. This issue becomes very
important when operating in an industrial environment.
Communication systems must be designed to be very
robust in terms of impulse noise. Applications include
systems for gas pipeline or power company equipment
monitoring. This information is often transmitted using
some type of RF communications. Cellular systems are not
immune to impulse noise. Network operators must pay
attention to sources of impulse noise in their coverage area.
Coverage While this paper has focused on interference, it’s important
to remember that signal strength can also be an issue.
It’s all about the Signal to Noise ratio after all, and while
interference is the noise, signal is the other half of the
ratio. There are many things that can weaken your signal.
Antenna down tilt, fading, and reflections, can all affect
your signal strength. For this reason, it’s handy to have
a scanner built into your interference tool.
While the Signal to Noise ratio (S/N), or the Carrier to
Interference ratio (C/I) is the analog measurement of signal
quality, Bit Error Ratio (BER) is the digital measure of signal
quality. The cleaner the signal, the better the S/N, C/I
and BER. It’s important to know that when looking for
the cause of a poor BER, you come right back to the
strength and quality of the signal as well as the amount
of interference.
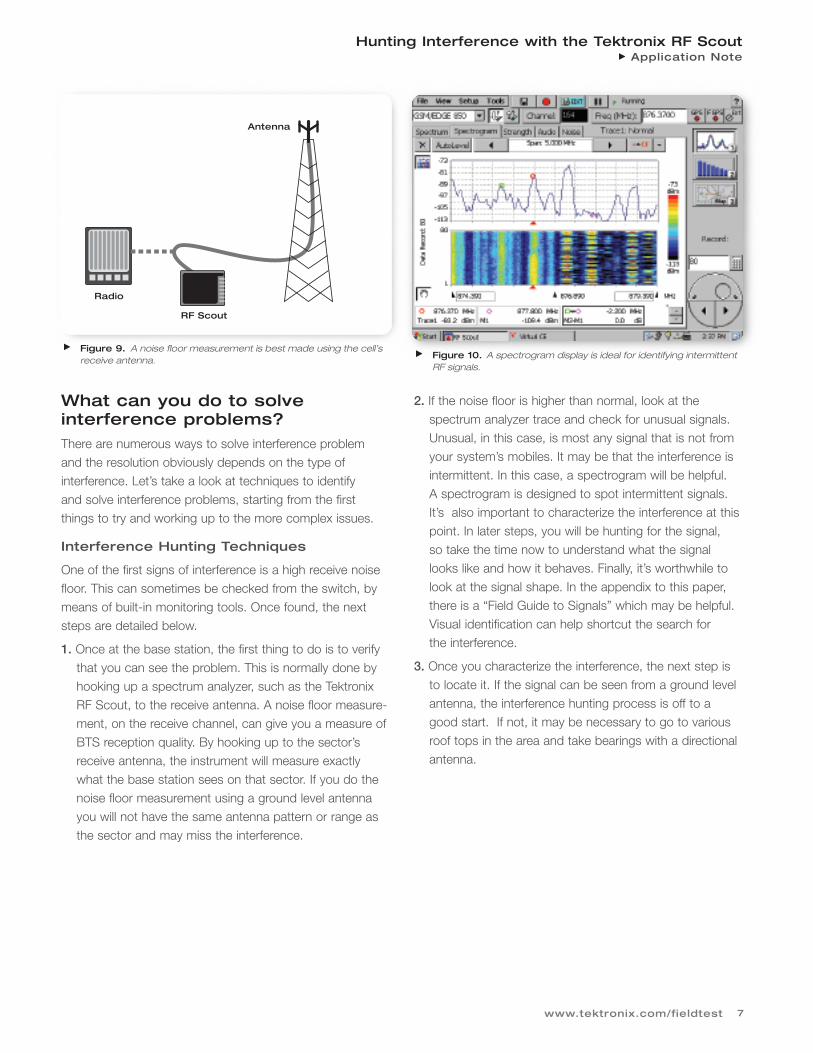
System A Mobile Loud
System A Cell Loud
System B Reception Blocked by Mobile!
Figure 8. Receivers that are receiving a weak signal can be desensitized by nearby stronger signals as depicted in the “near far problem”.
Hunting Interference with the Tektronix RF ScoutApplication Note
7www.tektronix.com/fieldtest
What can you do to solve interference problems?There are numerous ways to solve interference problem
and the resolution obviously depends on the type of
interference. Let’s take a look at techniques to identify
and solve interference problems, starting from the first
things to try and working up to the more complex issues.
Interference Hunting Techniques
One of the first signs of interference is a high receive noise
floor. This can sometimes be checked from the switch, by
means of built-in monitoring tools. Once found, the next
steps are detailed below.
1. Once at the base station, the first thing to do is to verify
that you can see the problem. This is normally done by
hooking up a spectrum analyzer, such as the Tektronix
RF Scout, to the receive antenna. A noise floor measure-
ment, on the receive channel, can give you a measure of
BTS reception quality. By hooking up to the sector’s
receive antenna, the instrument will measure exactly
what the base station sees on that sector. If you do the
noise floor measurement using a ground level antenna
you will not have the same antenna pattern or range as
the sector and may miss the interference.
2. If the noise floor is higher than normal, look at the
spectrum analyzer trace and check for unusual signals.
Unusual, in this case, is most any signal that is not from
your system’s mobiles. It may be that the interference is
intermittent. In this case, a spectrogram will be helpful.
A spectrogram is designed to spot intermittent signals.
It’s also important to characterize the interference at this
point. In later steps, you will be hunting for the signal,
so take the time now to understand what the signal
looks like and how it behaves. Finally, it’s worthwhile to
look at the signal shape. In the appendix to this paper,
there is a “Field Guide to Signals” which may be helpful.
Visual identification can help shortcut the search for
the interference.
3. Once you characterize the interference, the next step is
to locate it. If the signal can be seen from a ground level
antenna, the interference hunting process is off to a
good start. If not, it may be necessary to go to various
roof tops in the area and take bearings with a directional
antenna.
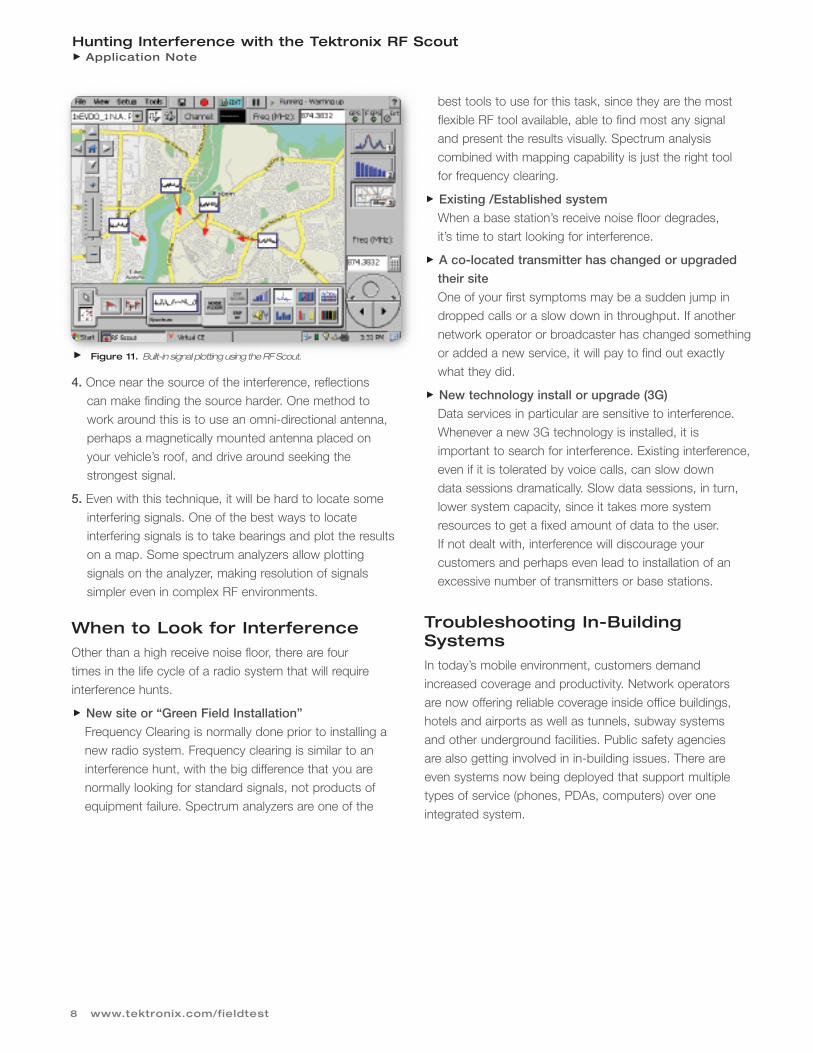
Radio
RF Scout
Antenna
Figure 9. A noise floor measurement is best made using the cell’sreceive antenna. Figure 10. A spectrogram display is ideal for identifying intermittent
RF signals.
Hunting Interference with the Tektronix RF ScoutApplication Note
8 www.tektronix.com/fieldtest
4. Once near the source of the interference, reflections
can make finding the source harder. One method to
work around this is to use an omni-directional antenna,
perhaps a magnetically mounted antenna placed on
your vehicle’s roof, and drive around seeking the
strongest signal.
5. Even with this technique, it will be hard to locate some
interfering signals. One of the best ways to locate
interfering signals is to take bearings and plot the results
on a map. Some spectrum analyzers allow plotting
signals on the analyzer, making resolution of signals
simpler even in complex RF environments.
When to Look for InterferenceOther than a high receive noise floor, there are four
times in the life cycle of a radio system that will require
interference hunts.
New site or “Green Field Installation”
Frequency Clearing is normally done prior to installing a
new radio system. Frequency clearing is similar to an
interference hunt, with the big difference that you are
normally looking for standard signals, not products of
equipment failure. Spectrum analyzers are one of the
best tools to use for this task, since they are the most
flexible RF tool available, able to find most any signal
and present the results visually. Spectrum analysis
combined with mapping capability is just the right tool
for frequency clearing.
Existing /Established system
When a base station’s receive noise floor degrades,
it’s time to start looking for interference.
A co-located transmitter has changed or upgraded
their site
One of your first symptoms may be a sudden jump in
dropped calls or a slow down in throughput. If another
network operator or broadcaster has changed something
or added a new service, it will pay to find out exactly
what they did.
New technology install or upgrade (3G)
Data services in particular are sensitive to interference.
Whenever a new 3G technology is installed, it is
important to search for interference. Existing interference,
even if it is tolerated by voice calls, can slow down
data sessions dramatically. Slow data sessions, in turn,
lower system capacity, since it takes more system
resources to get a fixed amount of data to the user.
If not dealt with, interference will discourage your
customers and perhaps even lead to installation of an
excessive number of transmitters or base stations.
Troubleshooting In-BuildingSystemsIn today’s mobile environment, customers demand
increased coverage and productivity. Network operators
are now offering reliable coverage inside office buildings,
hotels and airports as well as tunnels, subway systems
and other underground facilities. Public safety agencies
are also getting involved in in-building issues. There are
even systems now being deployed that support multiple
types of service (phones, PDAs, computers) over one
integrated system.
Figure 11. Built-in signal plotting using the RF Scout.
Hunting Interference with the Tektronix RF ScoutApplication Note
9www.tektronix.com/fieldtest
There are a number of differences when troubleshooting
an in-building system. First, in-building systems may use
a distributed antenna system (DAS). This means the test
access points vary from a traditional outside system.
Second, the signal may come from a dedicated in-building
BTS or a repeater antenna. If from a repeater, it is best
to first check the external signal to make sure that any
problem is definitely an in-building problem. Third, in the
event that the system is fed through a fiber optic system,
you may not have a electrical test port, so measuring near
an in-building antenna may be your only choice. Finally,
it is possible, and educational, to look at the RF signal
under “Near Field” conditions. Typically, this involves putting
your hand-held antenna in contact with the plastic case of
the in-building antenna. This method can give a consistent
relative RF Channel Power measurement and is useful to
troubleshoot cable and connector problems in a distributed
antenna system.
You should initially look at several key measurements that
are almost identical to outside systems. Some of these are
listed below:
Receive noise floor measurements can be used to
identify interference issues on the in-building system’s
receive channel.
Near-field RF Channel power measurements can be
used to check cable and connector issues.
Field strength measurements can be used, with a
calibrated antenna, to verify coverage.
If a scanner for your standard is available, it is one of
the preferred coverage tools.
EVM measurements spot all sorts of signal quality issues.
Signal mapping is helpful for analysis and documenta-
tion. If it can be done in the field, it’s even better.
The ultimate goal is to ensure that you have a quality signal
with no interference.
What are some examples of in-buildingproblems?
As in any environment there are numerous types of prob-
lems that can affect the quality of your reception. Examples
may be as simple as numerous carriers in an airport fighting
for spectrum. There are also other sources that are more
common with in-building coverage that range from electrical
disturbances caused by industrial equipment to unusual lab
equipment and microwave ovens.
Cable and connector issues are the biggest faults, of
course. Cabling is installed in the building, with connectors
installed on the spot, without any type of “factory floor test.”
This predictably leads to problems. The near field approach
can be powerful when troubleshooting cable and connector
issues in a distributed antenna system.
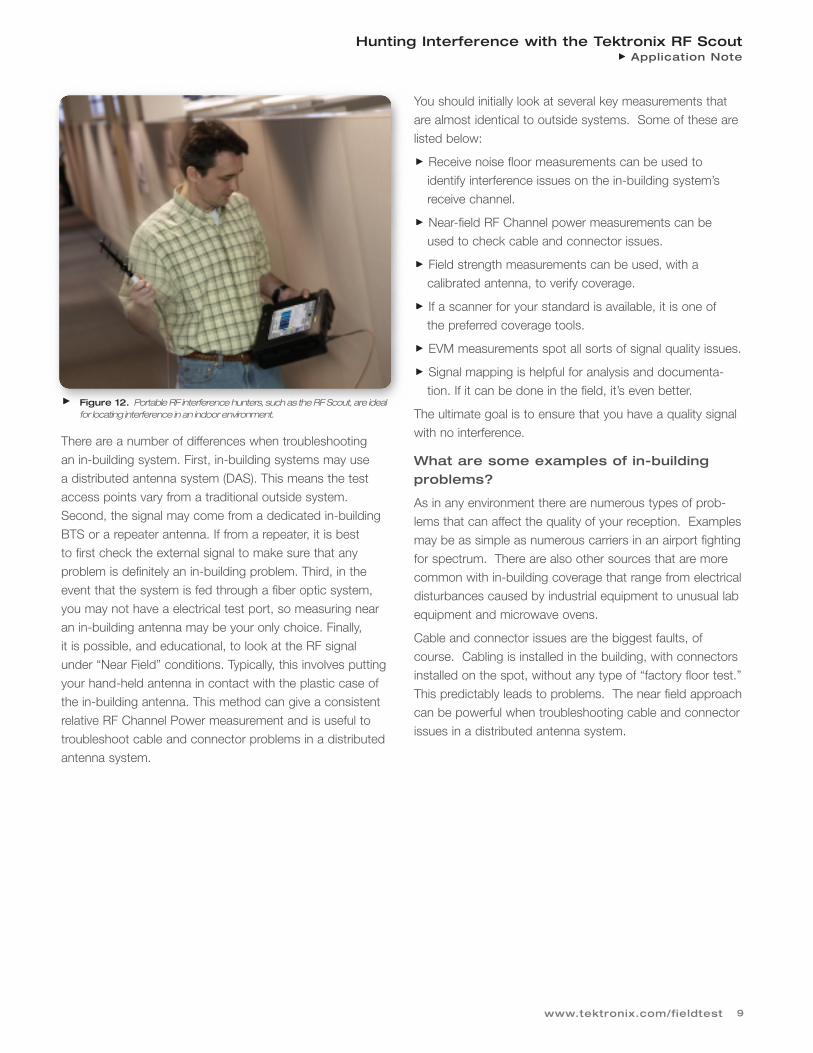
Figure 12. Portable RF interference hunters, such as the RF Scout, are idealfor locating interference in an indoor environment.
Hunting Interference with the Tektronix RF ScoutApplication Note
10 www.tektronix.com/fieldtest
Identifying Signals
When looking for interference, it is important to be able to
recognize RF signals that do not come from your system.
The table below shows some examples of other signals
and their bandwidth. The width of the signal can be an
extremely useful way of identifying the signal. The signal
width, combined with some knowledge of the signal
shapes will enable you to identify many different signals.
The “Field Guide to Signals” in the appendix will get you
started in this area.
SummaryInterference issues are becoming more and more important,
particularly as the new 3G data services are becoming
wide spread. These 3G services must coexist in a complex
RF environment with previous generations of mobile
systems. To do so, the new 3G systems are designed
to be reliable. But by adding protection, the 3G systems
slow data sessions down. Data sessions are particularly
vulnerable to interference. The other issue, for voice
services, is that as new services are installed the RF
spectrum becomes more crowded and this makes
interference more likely.
Cellular data services command a premium price. This
is due to both the widespread coverage, compared to
standards such as WiFi, and the data speed. It’s important
to deliver a high data rate to customers since they do
have a choice. Every attempt should be made to ensure
high speed and reliable data sessions because, in the long
term, that’s what sells data services.
The manufacturer’s switch statistics provide information
that gives you a good place to start when hunting for
interference issues. But identifying a sector or a base
station with an issue is only the staring place. Tools such
as the Tektronix RF Scout are fully equipped to compliment
existing network elements and provide you with an
integrated set of tools that are optimized for eliminating
interference issues.
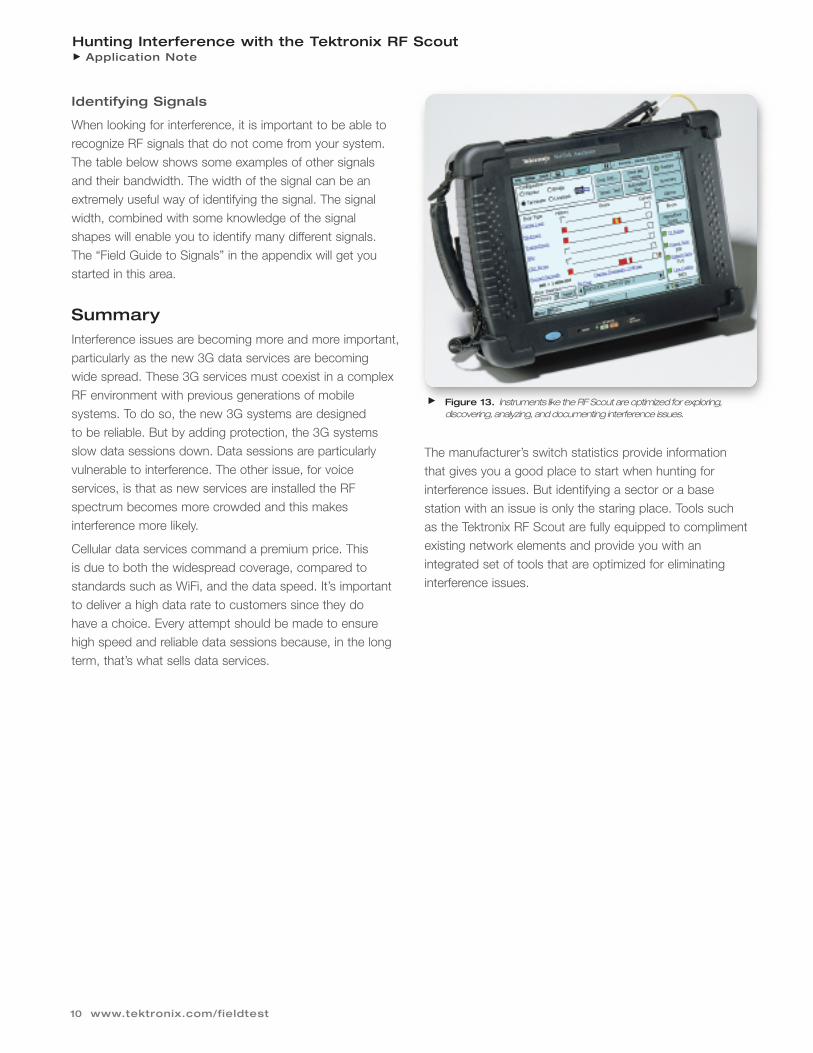
Figure 13. Instruments like the RF Scout are optimized for exploring, discovering, analyzing, and documenting interference issues.
Hunting Interference with the Tektronix RF ScoutApplication Note
11www.tektronix.com/fieldtest
Appendix – Field Guide to MobileWireless Interference TestingNow that we have become familiar with the tools and
techniques, let’s look at some examples of typical signal
types with descriptions of some of the possible sources.
Any of these signals, or related ones, may show up as
interference to your system. These descriptions may also
be generally useful in simply identifying your RF neighbors.
Analog SignalsBroadcast signals have some telltale characteristics. FM
signals for voice or music vary in width. During quiet times,
FM appears as a CW carrier without modulation. At other
times it will vary in width up to the approximate maximum
shown in Figure 16.
This changing width is its most distinguishing feature.
While AM also varies, it is narrower than FM. The best way
to confirm this type of interference is to demodulate it and
listen to it – you might also pick up the station identification.
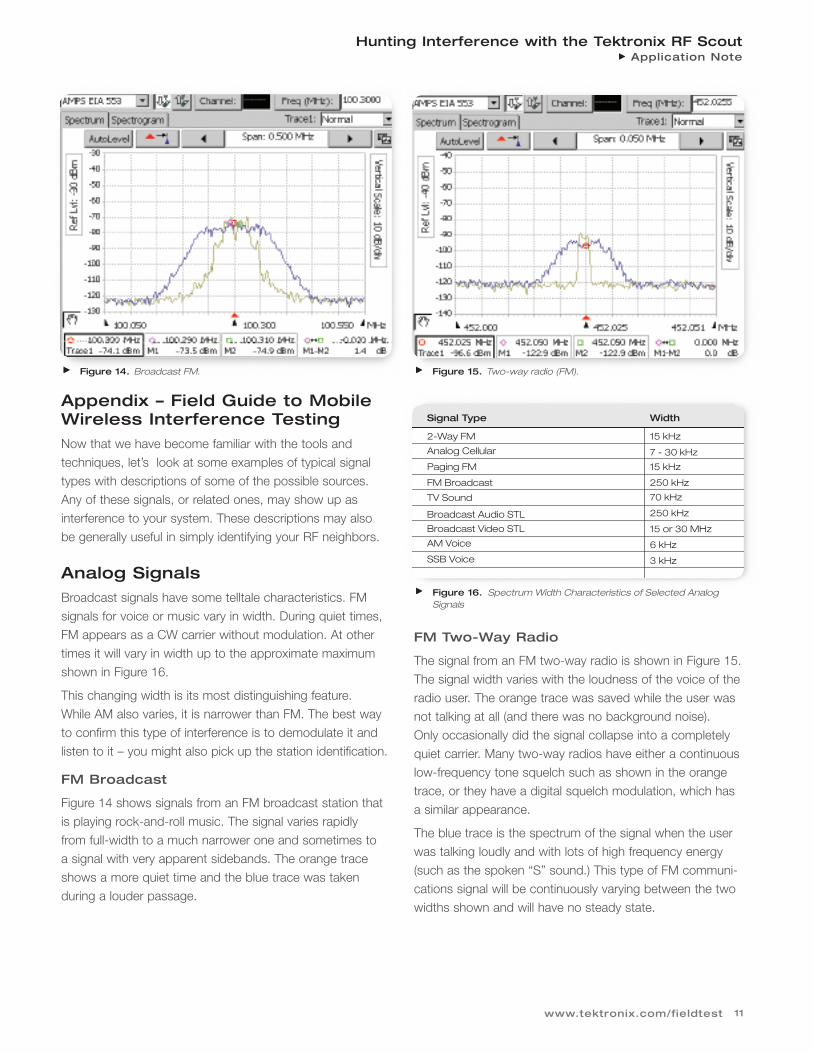
FM Broadcast
Figure 14 shows signals from an FM broadcast station that
is playing rock-and-roll music. The signal varies rapidly
from full-width to a much narrower one and sometimes to
a signal with very apparent sidebands. The orange trace
shows a more quiet time and the blue trace was taken
during a louder passage.
FM Two-Way Radio
The signal from an FM two-way radio is shown in Figure 15.
The signal width varies with the loudness of the voice of the
radio user. The orange trace was saved while the user was
not talking at all (and there was no background noise).
Only occasionally did the signal collapse into a completely
quiet carrier. Many two-way radios have either a continuous
low-frequency tone squelch such as shown in the orange
trace, or they have a digital squelch modulation, which has
a similar appearance.
The blue trace is the spectrum of the signal when the user
was talking loudly and with lots of high frequency energy
(such as the spoken “S” sound.) This type of FM communi-
cations signal will be continuously varying between the two
widths shown and will have no steady state.
Figure 14. Broadcast FM. Figure 15. Two-way radio (FM).
Signal Type
2-Way FM
Width
15 kHz
Broadcast Audio STL
Broadcast Video STL
AM Voice
SSB Voice
Analog Cellular
Paging FM
FM Broadcast
TV Sound
250 kHz
15 or 30 MHz
6 kHz
3 kHz
7 - 30 kHz
15 kHz
250 kHz
70 kHz
Figure 16. Spectrum Width Characteristics of Selected AnalogSignals
Hunting Interference with the Tektronix RF ScoutApplication Note
12 www.tektronix.com/fieldtest
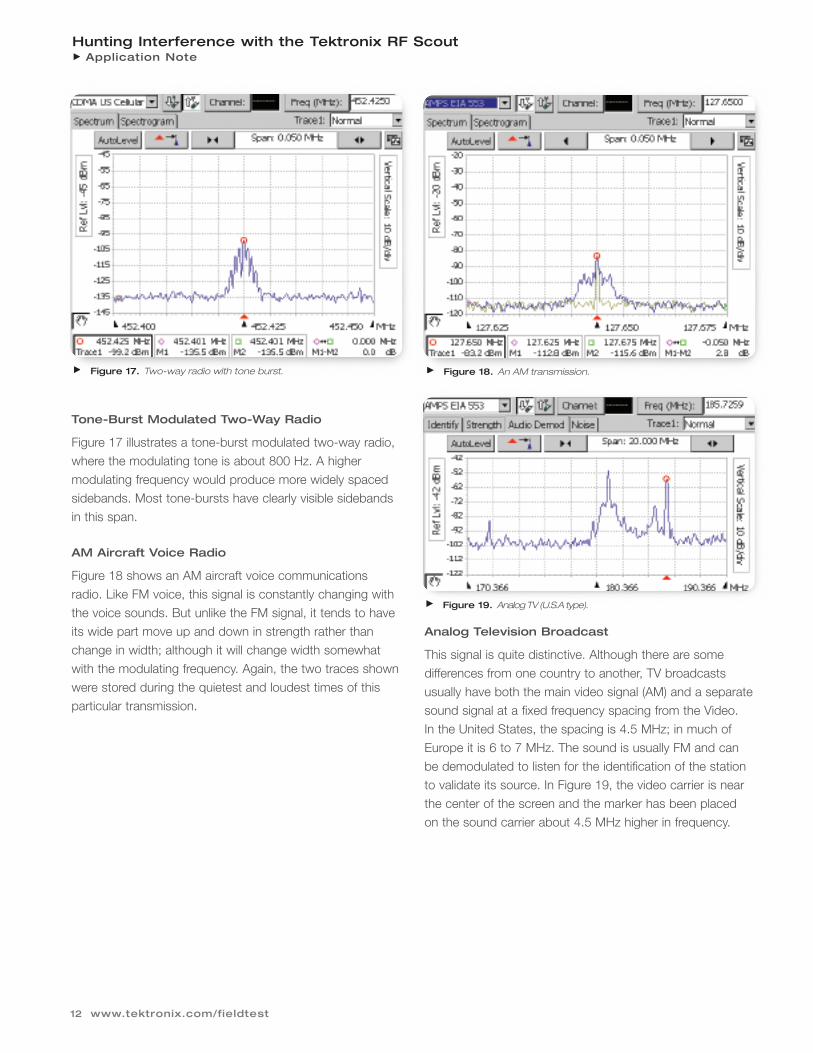
Tone-Burst Modulated Two-Way Radio
Figure 17 illustrates a tone-burst modulated two-way radio,
where the modulating tone is about 800 Hz. A higher
modulating frequency would produce more widely spaced
sidebands. Most tone-bursts have clearly visible sidebands
in this span.
AM Aircraft Voice Radio
Figure 18 shows an AM aircraft voice communications
radio. Like FM voice, this signal is constantly changing with
the voice sounds. But unlike the FM signal, it tends to have
its wide part move up and down in strength rather than
change in width; although it will change width somewhat
with the modulating frequency. Again, the two traces shown
were stored during the quietest and loudest times of this
particular transmission.
Analog Television Broadcast
This signal is quite distinctive. Although there are some
differences from one country to another, TV broadcasts
usually have both the main video signal (AM) and a separate
sound signal at a fixed frequency spacing from the Video.
In the United States, the spacing is 4.5 MHz; in much of
Europe it is 6 to 7 MHz. The sound is usually FM and can
be demodulated to listen for the identification of the station
to validate its source. In Figure 19, the video carrier is near
the center of the screen and the marker has been placed
on the sound carrier about 4.5 MHz higher in frequency.
Figure 17. Two-way radio with tone burst. Figure 18. An AM transmission.
Figure 19. Analog TV (U.S.A type).
Hunting Interference with the Tektronix RF ScoutApplication Note
13www.tektronix.com/fieldtest
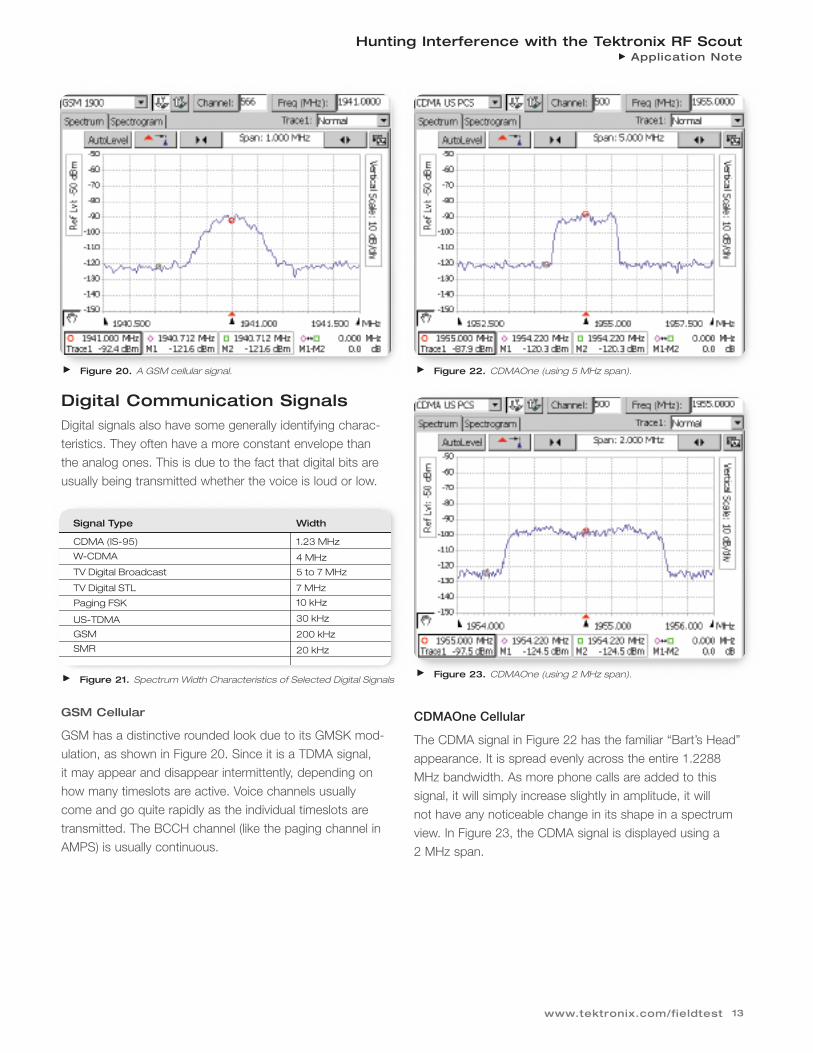
Digital Communication SignalsDigital signals also have some generally identifying charac-
teristics. They often have a more constant envelope than
the analog ones. This is due to the fact that digital bits are
usually being transmitted whether the voice is loud or low.
GSM Cellular
GSM has a distinctive rounded look due to its GMSK mod-
ulation, as shown in Figure 20. Since it is a TDMA signal,
it may appear and disappear intermittently, depending on
how many timeslots are active. Voice channels usually
come and go quite rapidly as the individual timeslots are
transmitted. The BCCH channel (like the paging channel in
AMPS) is usually continuous.
CDMAOne Cellular
The CDMA signal in Figure 22 has the familiar “Bart’s Head”
appearance. It is spread evenly across the entire 1.2288
MHz bandwidth. As more phone calls are added to this
signal, it will simply increase slightly in amplitude, it will
not have any noticeable change in its shape in a spectrum
view. In Figure 23, the CDMA signal is displayed using a
2 MHz span.
Figure 20. A GSM cellular signal. Figure 22. CDMAOne (using 5 MHz span).
Figure 23. CDMAOne (using 2 MHz span).
Signal Type
CDMA (IS-95)
Width
1.23 MHz
US-TDMA
GSM
SMR
W-CDMA
TV Digital Broadcast
TV Digital STL
Paging FSK
30 kHz
200 kHz
20 kHz
4 MHz
5 to 7 MHz
7 MHz
10 kHz
Figure 21. Spectrum Width Characteristics of Selected Digital Signals
Hunting Interference with the Tektronix RF ScoutApplication Note
14 www.tektronix.com/fieldtest
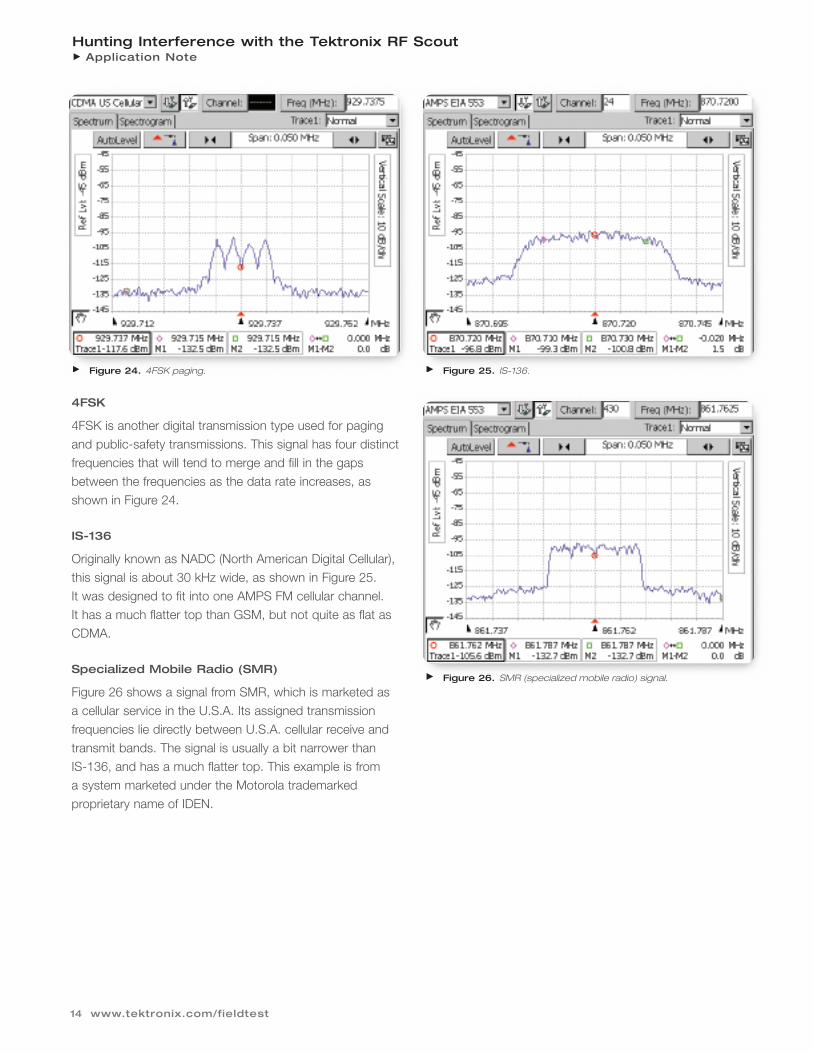
4FSK
4FSK is another digital transmission type used for paging
and public-safety transmissions. This signal has four distinct
frequencies that will tend to merge and fill in the gaps
between the frequencies as the data rate increases, as
shown in Figure 24.
IS-136
Originally known as NADC (North American Digital Cellular),
this signal is about 30 kHz wide, as shown in Figure 25.
It was designed to fit into one AMPS FM cellular channel.
It has a much flatter top than GSM, but not quite as flat as
CDMA.
Specialized Mobile Radio (SMR)
Figure 26 shows a signal from SMR, which is marketed as
a cellular service in the U.S.A. Its assigned transmission
frequencies lie directly between U.S.A. cellular receive and
transmit bands. The signal is usually a bit narrower than
IS-136, and has a much flatter top. This example is from
a system marketed under the Motorola trademarked
proprietary name of IDEN.
Figure 24. 4FSK paging. Figure 25. IS-136.
Figure 26. SMR (specialized mobile radio) signal.
Hunting Interference with the Tektronix RF ScoutApplication Note
15www.tektronix.com/fieldtest
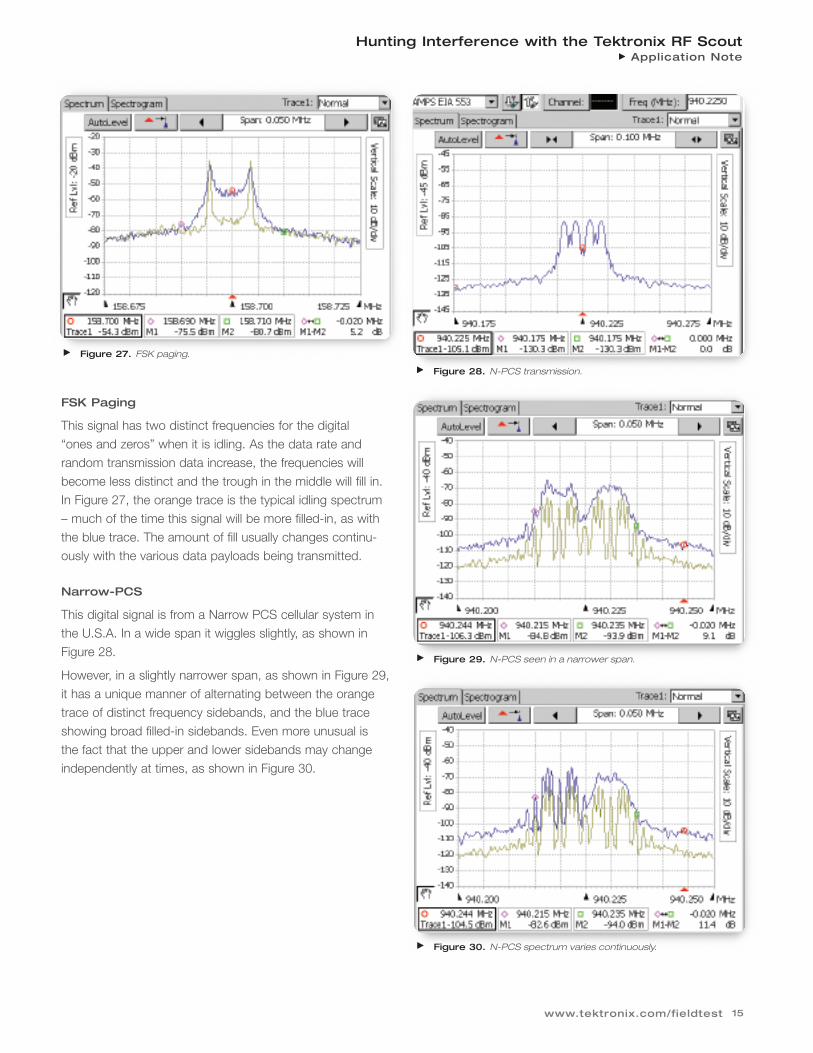
FSK Paging
This signal has two distinct frequencies for the digital
“ones and zeros” when it is idling. As the data rate and
random transmission data increase, the frequencies will
become less distinct and the trough in the middle will fill in.
In Figure 27, the orange trace is the typical idling spectrum
– much of the time this signal will be more filled-in, as with
the blue trace. The amount of fill usually changes continu-
ously with the various data payloads being transmitted.
Narrow-PCS
This digital signal is from a Narrow PCS cellular system in
the U.S.A. In a wide span it wiggles slightly, as shown in
Figure 28.
However, in a slightly narrower span, as shown in Figure 29,
it has a unique manner of alternating between the orange
trace of distinct frequency sidebands, and the blue trace
showing broad filled-in sidebands. Even more unusual is
the fact that the upper and lower sidebands may change
independently at times, as shown in Figure 30.
Figure 27. FSK paging.
Figure 29. N-PCS seen in a narrower span.
Figure 30. N-PCS spectrum varies continuously.
Figure 28. N-PCS transmission.
For Further InformationTektronix maintains a comprehensive, constantly expandingcollection of application notes, technical briefs and otherresources to help engineers working on the cutting edge oftechnology. Please visit www.tektronix.com
Copyright © 2006, Tektronix. All rights reserved. Tektronix products are covered byU.S. and foreign patents, issued and pending. Information in this publication super-sedes that in all previously published material. Specification and price changeprivileges reserved. TEKTRONIX and TEK are registered trademarks of Tektronix,Inc. All other trade names referenced are the service marks, trademarks or regis-tered trademarks of their respective companies. 06/06 DM/ xxx 2EW-19766-0
Contact Tektronix:ASEAN / Australasia (65) 6356 3900
Austria +41 52 675 3777
Balkan, Israel, South Africa and other ISE Countries +41 52 675 3777
Belgium 07 81 60166
Brazil & South America 55 (11) 3741-8360
Canada 1 (800) 661-5625
Central East Europe, Ukraine and the Baltics +41 52 675 3777
Central Europe & Greece +41 52 675 3777
Denmark +45 80 88 1401
Finland +41 52 675 3777
France +33 (0) 1 69 86 81 81
Germany +49 (221) 94 77 400
Hong Kong (852) 2585-6688
India (91) 80-22275577
Italy +39 (02) 25086 1
Japan 81 (3) 6714-3010
Luxembourg +44 (0) 1344 392400
Mexico, Central America & Caribbean 52 (55) 5424700
Middle East, Asia and North Africa +41 52 675 3777
The Netherlands 090 02 021797
Norway 800 16098
People’s Republic of China 86 (10) 6235 1230
Poland +41 52 675 3777
Portugal 80 08 12370
Republic of Korea 82 (2) 528-5299
Russia & CIS +7 (495) 7484900
South Africa +27 11 254 8360
Spain (+34) 901 988 054
Sweden 020 08 80371
Switzerland +41 52 675 3777
Taiwan 886 (2) 2722-9622
United Kingdom & Eire +44 (0) 1344 392400
USA 1 (800) 426-2200
For other areas contact Tektronix, Inc. at: 1 (503) 627-7111
Updated 12 May 2006
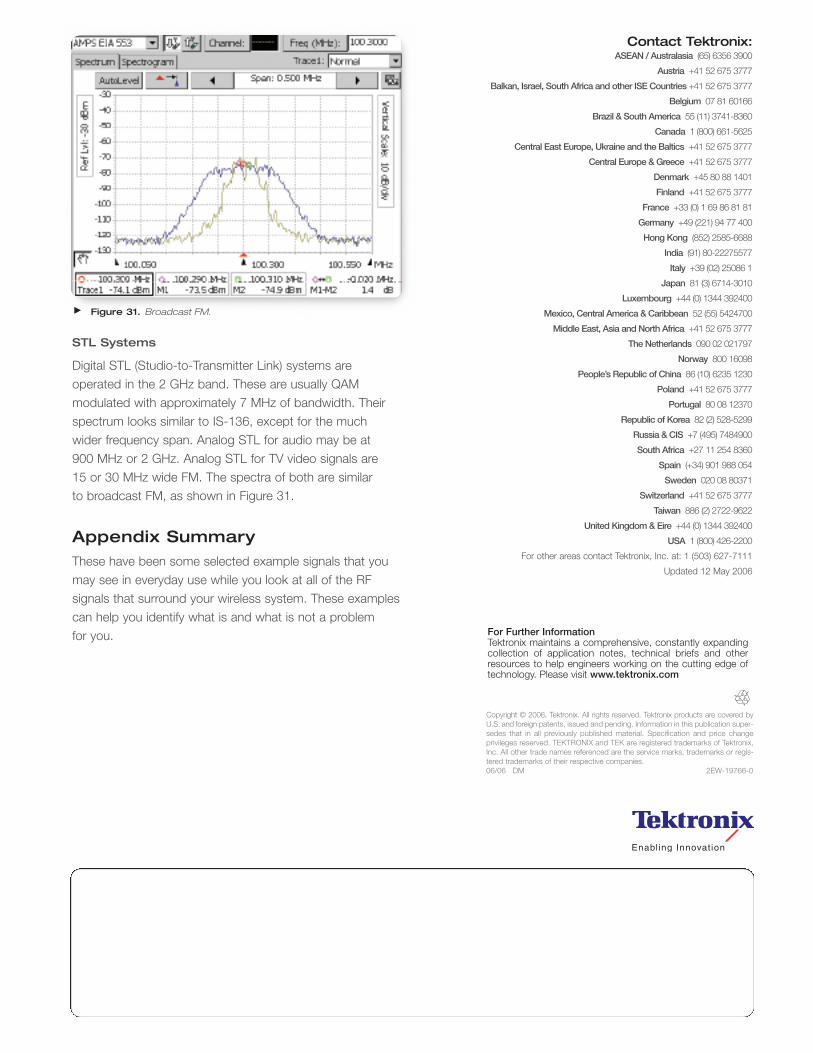
STL Systems
Digital STL (Studio-to-Transmitter Link) systems are
operated in the 2 GHz band. These are usually QAM
modulated with approximately 7 MHz of bandwidth. Their
spectrum looks similar to IS-136, except for the much
wider frequency span. Analog STL for audio may be at
900 MHz or 2 GHz. Analog STL for TV video signals are
15 or 30 MHz wide FM. The spectra of both are similar
to broadcast FM, as shown in Figure 31.
Appendix SummaryThese have been some selected example signals that you
may see in everyday use while you look at all of the RF
signals that surround your wireless system. These examples
can help you identify what is and what is not a problem
for you.
Figure 31. Broadcast FM.