Embed Size (px)
Citation preview
Mike Petters President and Chief Executive Officer
Barb Niland Corporate Vice President, Business Management
& Chief Financial Officer
Huntington Ingalls Industries
September 23, 2014
Citi 2014 Industrials Conference
Safe Harbor
1
Statements in this presentation, other than statements of historical fact, constitute "forward-looking statements" within the meaning of the Private Securities Litigation Reform Act of 1995. Forward-looking statements involve risks and uncertainties that could cause our actual results to differ materially from those expressed in these statements. Factors that may cause such differences include: changes in government and customer priorities and requirements (including government budgetary constraints, shifts in defense spending, and changes in customer short-range and long-range plans); our ability to obtain new contracts, estimate our future contract costs and perform our contracts effectively; changes in government regulations and procurement processes and our ability to comply with such requirements; our ability to realize the expected benefits from consolidation of our Ingalls facilities; natural disasters; adverse economic conditions in the United States and globally; risks related to our indebtedness and leverage; and other risk factors discussed in our filings with the U.S. Securities and Exchange Commission. There may be other risks and uncertainties that we are unable to predict at this time or that we currently do not expect to have a material adverse effect on our business, and we undertake no obligation to update any forward-looking statements. You should not place undue reliance on any forward-looking statements that we may make. This presentation also contains non-GAAP financial measures and includes a GAAP reconciliation of these financial measures. Non-GAAP financial measures should not be construed as being more important than comparable GAAP measures.

Carrier Construction
Carrier RCOH
Submarines
Fleet Support & Other
Newport NewsCoast Guard
Expeditionary Warfare
Surface Combatants
Fleet Support & Other
Ingalls
FY 2013 Revenues: $6.8 bn Employees: ~39,000
FY 2013 EBIT: $512 mn Engineers / Designers: ~7,500
FY 2013 Pension-adj. EBIT:(1) $573 mn Headquarters: Newport News, VA
Current Backlog: ~$24 bn History: 128 years
FY 2013 Revenue Breakdown
Investment Highlights
• Nation’s premier naval and principal nuclear shipbuilder
– Sole source for U.S. Navy nuclear-powered aircraft carriers and their refueling and inactivation services
– One of two builders constructing Virginia-class nuclear-powered submarines
– Builder of record for LPD, LHD and LHA-class amphibious assault ships
• Mission critical partnership with the U.S. Navy
• Significant revenue stability and visibility
• Opportunity for margin expansion and cash flow improvement
2 (1) Refer to reconciliation to reported GAAP financial data on page 26.
Company Snapshot
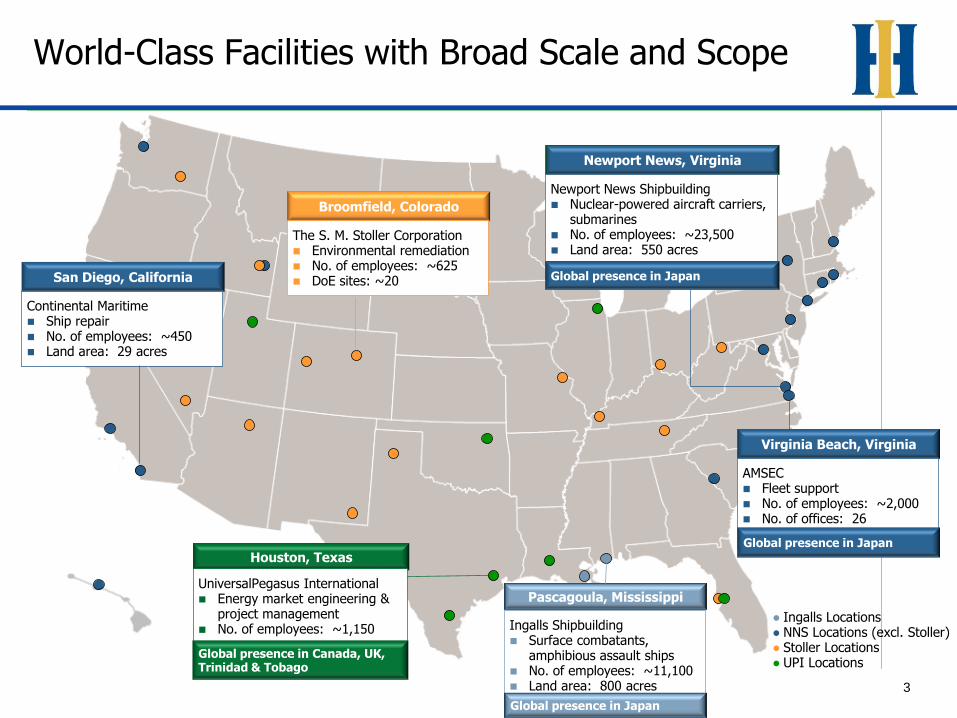
World-Class Facilities with Broad Scale and Scope
3
Broomfield, Colorado
The S. M. Stoller Corporation Environmental remediation No. of employees: ~625 DoE sites: ~20
Ingalls Shipbuilding Surface combatants,
amphibious assault ships No. of employees: ~11,100 Land area: 800 acres
San Diego, California
Continental Maritime Ship repair No. of employees: ~450 Land area: 29 acres
Virginia Beach, Virginia
AMSEC Fleet support No. of employees: ~2,000 No. of offices: 26
Houston, Texas
UniversalPegasus International Energy market engineering &
project management No. of employees: ~1,150
Pascagoula, Mississippi
● Ingalls Locations ● NNS Locations (excl. Stoller) ● Stoller Locations ● UPI Locations
Newport News, Virginia
Newport News Shipbuilding Nuclear-powered aircraft carriers,
submarines No. of employees: ~23,500 Land area: 550 acres
Global presence in Japan
Global presence in Japan
Global presence in Canada, UK, Trinidad & Tobago
Global presence in Japan
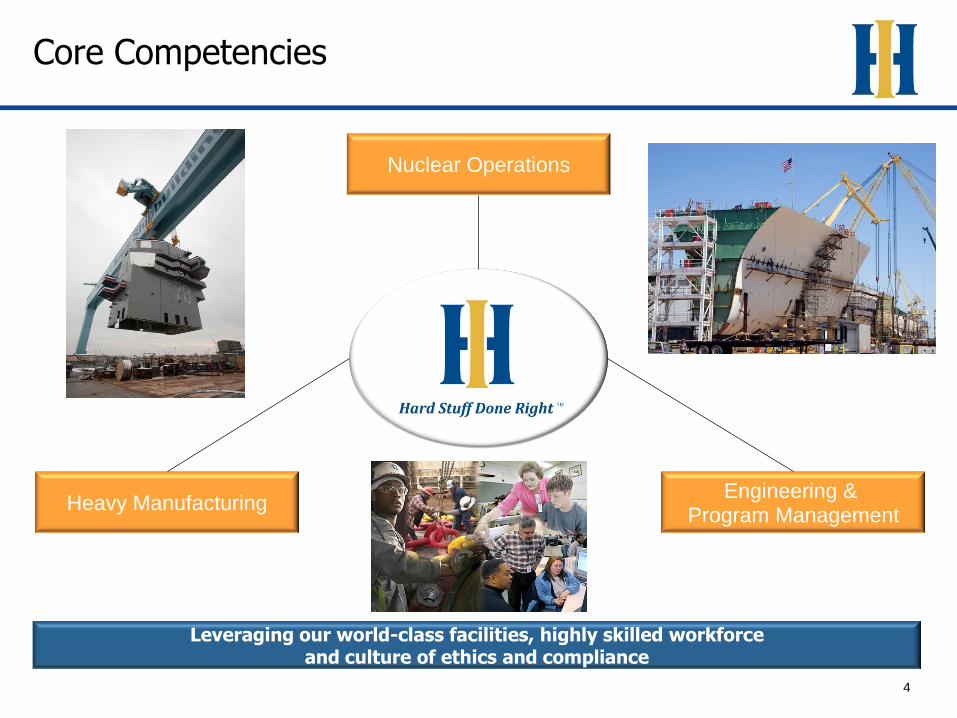
Nuclear Operations
Heavy Manufacturing
4
Core Competencies
Leveraging our world-class facilities, highly skilled workforce and culture of ethics and compliance
Engineering & Program Management
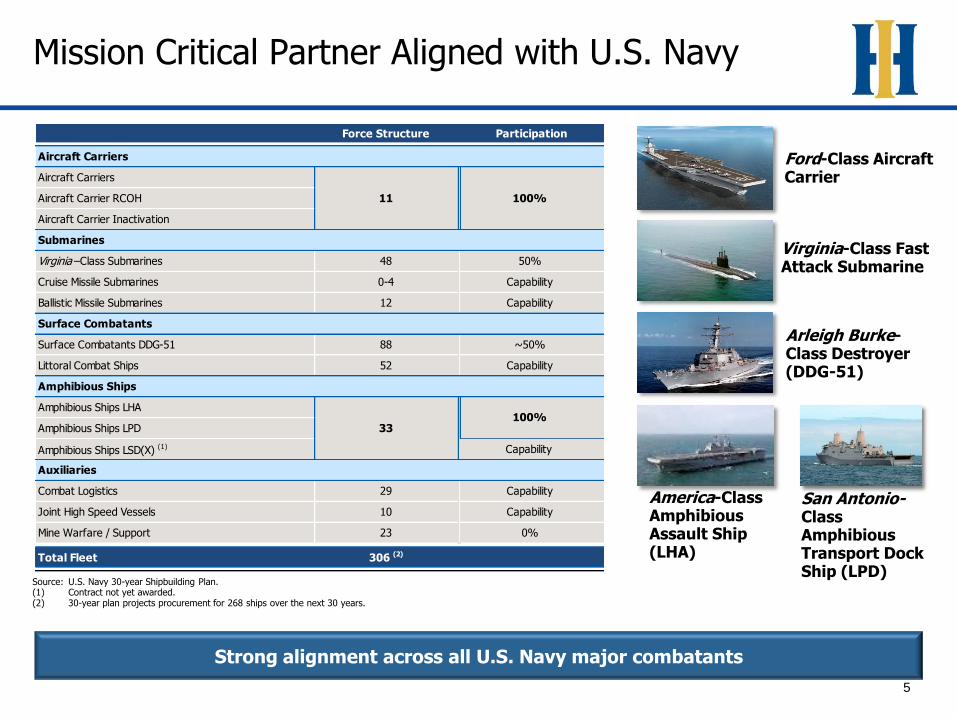
Mission Critical Partner Aligned with U.S. Navy
5
Force Structure Participation
Aircraft Carriers
Aircraft Carriers
Aircraft Carrier RCOH
Aircraft Carrier Inactivation
Submarines
Virginia –Class Submarines 48 50%
Cruise Missile Submarines 0-4 Capability
Ballistic Missile Submarines 12 Capability
Surface Combatants
Surface Combatants DDG-51 88 ~50%
Littoral Combat Ships 52 Capability
Amphibious Ships
Amphibious Ships LHA
Amphibious Ships LPD
Amphibious Ships LSD(X) (1) Capability
Auxiliaries
Combat Logistics 29 Capability
Joint High Speed Vessels 10 Capability
Mine Warfare / Support 23 0%
Total Fleet 306 (2)
11 100%
33100%
Source: U.S. Navy 30-year Shipbuilding Plan. (1) Contract not yet awarded. (2) 30-year plan projects procurement for 268 ships over the next 30 years.
Ford-Class Aircraft Carrier
Virginia-Class Fast Attack Submarine
America-Class Amphibious Assault Ship (LHA)
Arleigh Burke-Class Destroyer (DDG-51)
Strong alignment across all U.S. Navy major combatants
San Antonio-Class Amphibious Transport Dock Ship (LPD)

2-Per-Year Sub Plan
DDG-51 Re-Start
CVN-78 100% Erect
6 Key Contract
Awards
Successful Execution as an Independent Company
6
Pascagoula
Completed Spin-off
March 2011
Delivered 6 Ships
and 2 Submarines
LPD-26 and 27
DDG-113 and 114
NSC-5
SSN 786 and 787
NSC WMSL-752 USCGC Stratton
Targeted, Successful Execution
CVN-78
USS California USS Minnesota
DDG
LPD-22 – LPD-25
LHA-7
LHA-6

• Protect and Strengthen Market Position
– Continue strong execution of programs
– Selective capital investments to support current programs and new opportunities
– Maintain financial predictability, backlog and stability
• Capture New Business
– Ohio-class Replacement Program
– Energy market adjacencies
– Acquisition of The S.M. Stoller Corporation to build presence
7
Manage for Performance
Strategy: Strengthen Market Position and Execute Well for the U.S. Navy
Newport News Ingalls
Continue expanding the performance culture across the business
Capture Benefits of Serial Production
• Ingalls Operating System
− Class plans
− First time quality
− Labor resource management
− Risk & opportunity management
− Consistent recurring ship metrics
• Support Continuation of Amphibious Assault Ship Programs
• Restructuring
− $284 million in restructuring expenses recouped as allowable costs through contracts over five years starting after closure
• Potential Redeployment
− Exploring and evaluating best-use opportunities for re-developing the facility with Kinder Morgan Energy Partners
The Future of Avondale

UPI Overview
Strategic Rationale Customers and Projects
UniversalPegasus International (UPI) Overview
Deal Overview
• Fits HII’s strategy to enter adjacent markets through engineering
• Capable and experienced management team with proven engineering services track records
• Strategic adjacent market that is growing
• Provides access to a broad customer base, including many fortune 500 companies
• Creates strong engineering services growth platform for HII
Key Customers
TransCanada
Enbridge
Enterprise
Kinder Morgan
ENI U.S. Co.
• All cash transaction
• Accretive pending purchase accounting determination
• Expect EBITDA to track to industry average or slightly above
• UPI is included in the “Other” segment for financial reporting purposes
• Closed in June 2014
Projects
Keystone XL
Prince Rupert Transmission
Flanagan South Pipeline
Seaway Crude Pipeline
Trans Mountain Expansion
Longhorn Subsea Tieback
• Based in Houston, TX with ~1,500 Employees
• Global footprint with operations in Calgary, AB (Canada); London & Aberdeen (United Kingdom); Trinidad & Tobago
• Providers of engineering and project management services to the domestic and international energy markets 2014 Engineering
News Record #61
8

Submarine Construction
Aircraft Carrier Construction
Premier Nuclear Capabilities
9
CVN-78 Gerald R. Ford CVN-79 John F. Kennedy CVN-72 USS Abraham Lincoln RCOH
CVN-65 Enterprise Inactivation
Virginia-class submarine
128 years of shipbuilding experience with unique visibility and stability
• New aircraft carrier for 21st century
• Replacement for Nimitz-class
• Conducting final outfitting and test activities
• 2016 delivery
• 2nd aircraft carrier in the Ford-class
• Conducting design, engineering, material purchases and unit construction under construction preparation contract
• 2022/3 delivery
• 5th Nimitz-class carrier to be refueled
• 2013 refueling execution start
• Preparing for undocking in Q3
• 2016/7 redelivery
• First nuclear aircraft carrier inactivation
• New revenue generation for HII
• 2013 inactivation execution start
• 2016 redelivery
• Very successful teaming arrangement with Electric Boat
• Block III transitioned to 2 subs per year
• Block IV construction starting in 2014
Aircraft Carrier Inactivation
Aircraft Carrier RCOH
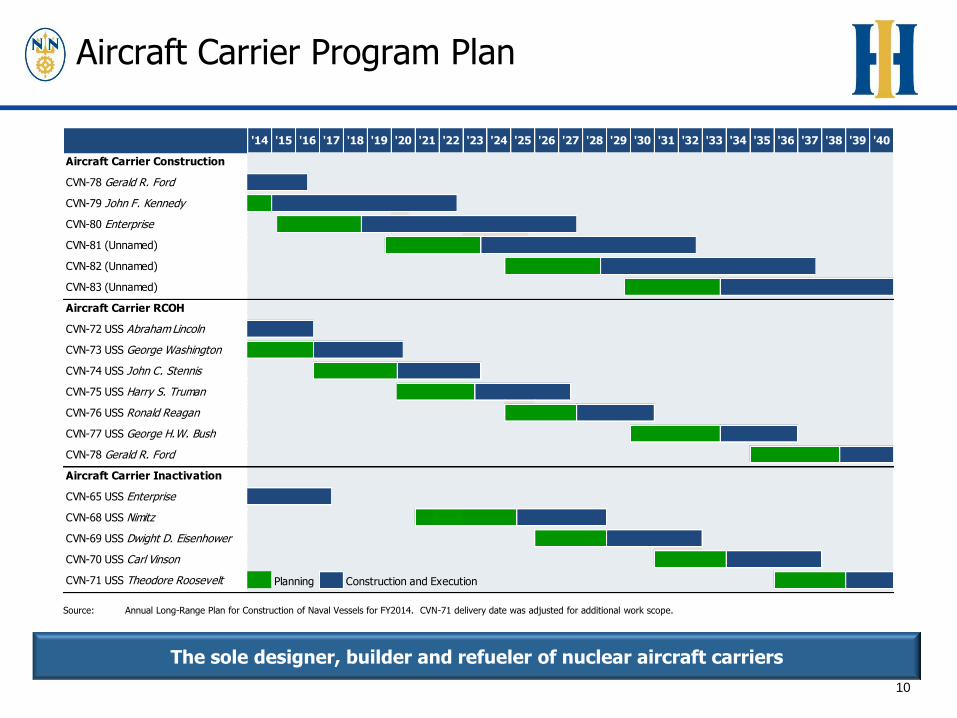
'14 '15 '16 '17 '18 '19 '20 '21 '22 '23 '24 '25 '26 '27 '28 '29 '30 '31 '32 '33 '34 '35 '36 '37 '38 '39 '40
Aircraft Carrier Construction
CVN-78 Gerald R. Ford
CVN-79 John F. Kennedy
CVN-80 Enterprise
CVN-81 (Unnamed)
CVN-82 (Unnamed)
CVN-83 (Unnamed)
Aircraft Carrier RCOH
CVN-72 USS Abraham Lincoln
CVN-73 USS George Washington
CVN-74 USS John C. Stennis
CVN-75 USS Harry S. Truman
CVN-76 USS Ronald Reagan
CVN-77 USS George H.W. Bush
CVN-78 Gerald R. Ford
Aircraft Carrier Inactivation
CVN-65 USS Enterprise
CVN-68 USS Nimitz
CVN-69 USS Dwight D. Eisenhower
CVN-70 USS Carl Vinson
CVN-71 USS Theodore Roosevelt Planning Construction and Execution
Aircraft Carrier Program Plan
10
Source: Annual Long-Range Plan for Construction of Naval Vessels for FY2014. CVN-71 delivery date was adjusted for additional work scope.
The sole designer, builder and refueler of nuclear aircraft carriers

CVN 78 Gerald R. Ford Class
Advanced
Weapons Elevators
EMALSAdvanced
Arresting Gear
Dual Band
Radar
1100 Ton AC
Plant
Ship Shell
10.2# HSLA-65
7.65# HSLA-65
7.65# HSLA-65
7.65# HSLA-65
Hangar Side Bhd
Spon
son
Web
Spon
son
Web
Spon
son
Web
7.65# HSLA-65
7.65# HSLA-65
Proposed Sponson 02 Level
Stiffeners 8x5-1/2x7.65#/12.75#T HSLA-65
No Brackets
Plasma Arc
Waste Disposal
System
Lightweight
Materials
Reverse Osmosis
Distilling Unit JP-5 Optical
Monitoring
New
Propulsion/Electric Plant
All Electric Aux
services
Zonal Electrical
Distribution System
Increased CapabilityIncreased Flexibility Increased Affordability
Focused Investment
• Greater operational availability
• 3X electric plant capacity• Sortie Generation Rates
increased by 25%
• $5 B TOC reduction
• 500-1200 billet reduction
CVN 78 Class
More capability at a lower Total Ownership Cost Utilized 3D Product Model
Designed for Producibility
Land Based Test Facility
Schedule Fidelity, Detailed Planning
11
Investments in technology enhance capability and reduce long-term operational costs
11
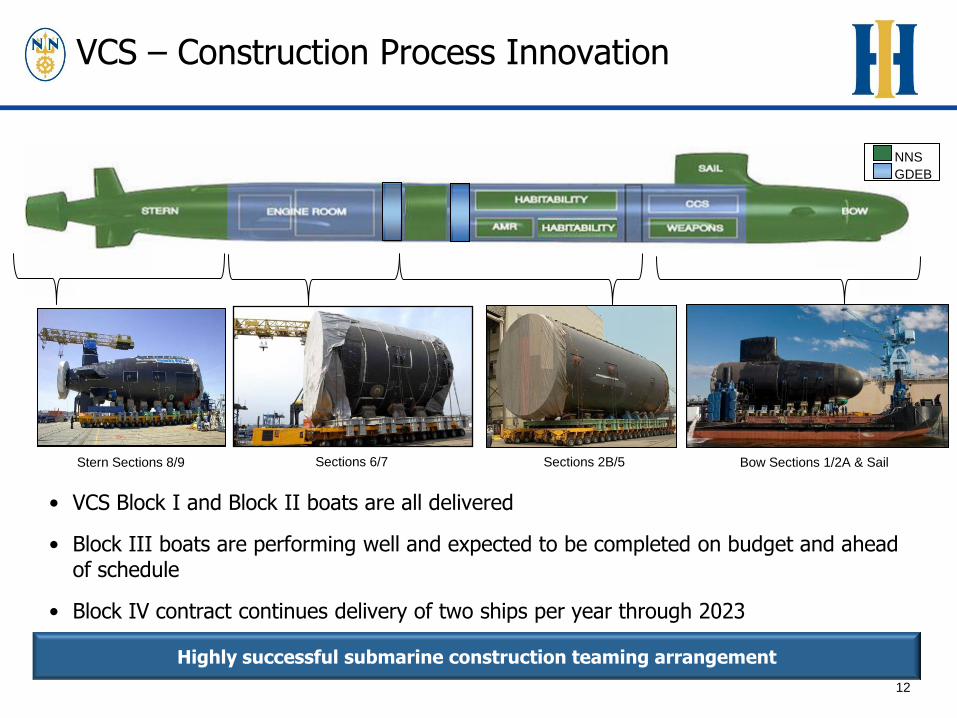
VCS – Construction Process Innovation
• VCS Block I and Block II boats are all delivered
• Block III boats are performing well and expected to be completed on budget and ahead of schedule
• Block IV contract continues delivery of two ships per year through 2023
Highly successful submarine construction teaming arrangement
12
Stern Sections 8/9 Bow Sections 1/2A & Sail Sections 6/7 Sections 2B/5
NNS
GDEB
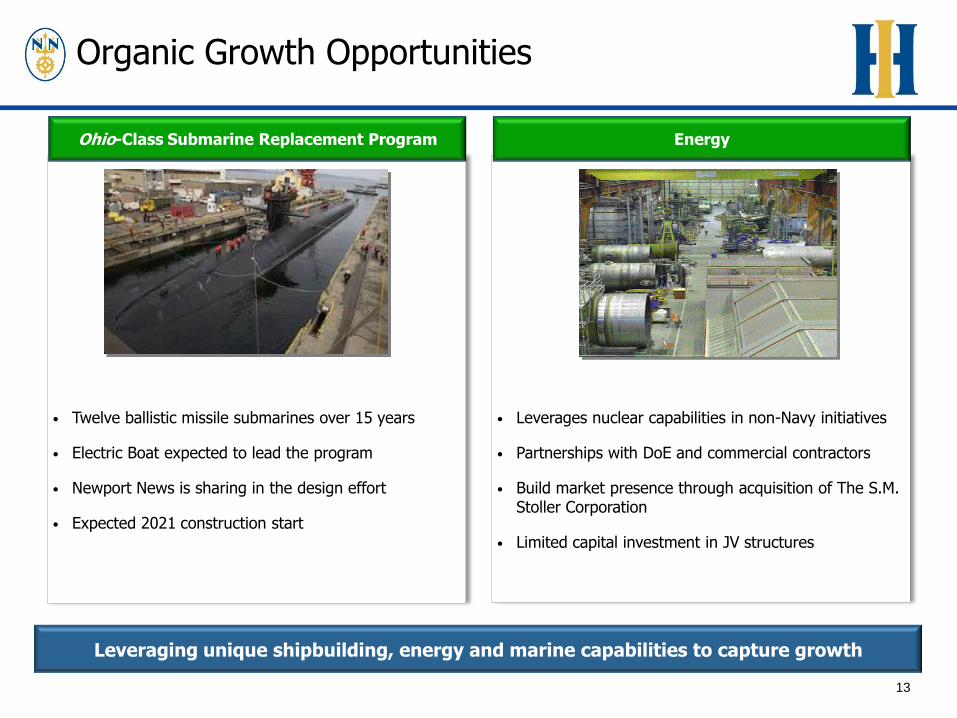
• Twelve ballistic missile submarines over 15 years
• Electric Boat expected to lead the program
• Newport News is sharing in the design effort
• Expected 2021 construction start
• Leverages nuclear capabilities in non-Navy initiatives
• Partnerships with DoE and commercial contractors
• Build market presence through acquisition of The S.M. Stoller Corporation
• Limited capital investment in JV structures
Organic Growth Opportunities
Ohio-Class Submarine Replacement Program Energy
Leveraging unique shipbuilding, energy and marine capabilities to capture growth
13

The S.M. Stoller Corporation Overview
14
• A leading U.S.-based environmental management and remediation company.
• Provides a full suite of environmental and facility management services across the spectrum of US
government departments and agencies.
• Office and project locations throughout the DOE nuclear complex.
• Strategically positioned to support HII-Energy growth opportunities.

Sole Source Shipbuilder on Three Programs
15
LHA-6 America-Class LPD-17 San Antonio-Class
Large, flexible and newly re-capitalized shipyard with 75-year history
National Security Cutter
• LHA-6 America is 1st ship in LHA(R) program
• Next generation of amphibious ship for joint operations with enhanced aviation capabilities
– Delivered April 2014
• LHA-7 Tripoli is 2nd ship
– Contract awarded in May 2012
– 2018 delivery
• Newest ship in the U.S. Navy’s amphibious fleet used to transport 700 to 800 marines, their equipment and supplies
• Delivered LPD-22 USS San Diego in 2011, LPD-23 Anchorage in Q3 2012, LPD-24 Arlington in Q4 2012, and LPD-25 Somerset in Q4 2013
• LPD-26 Murtha and LPD-27 Portland currently under construction with delivery in 2016 and 2017, respectively.
• Largest and most capable new multi-mission cutter
• Coast Guard plans to build 7 or 8 NSCs to replace aging fleet
• NSC-4 and NSC-5 under construction
• NSC-6 contract awarded in May 2013
• NSC-7 contract awarded in March 2014
• NSC-8 long lead time materials contract awarded in June 2014

• Next generation multi-mission surface combatant class (three-ship class)
• Ingalls work-share consists of composite deckhouse/hangar and steel aft peripheral vertical launch systems
• Unique composites characteristics include light weight and increased stealth
• Co-lead on ship design (work-share products related)
• DDG-1001 delivered in August 2014 which ends the program for HII
• US Navy’s primary surface combatant class
• Designed for conducting anti-air, anti-submarine, anti-surface and strike operations
• Most advanced state-of-the-art surface combat ships
• Original 62-ship program / 28 awarded to HII previously
• Awarded construction contracts for DDG-113 and DDG-114, first two ships of the program re-start
• Awarded a $3.3 billion contract for five DDG-51s in June 2013
Surface Combatant Programs
DDG-51 Arleigh Burke-Class DDG-1000 Zumwalt-Class
Ingalls expects to capture benefits of serial production
16
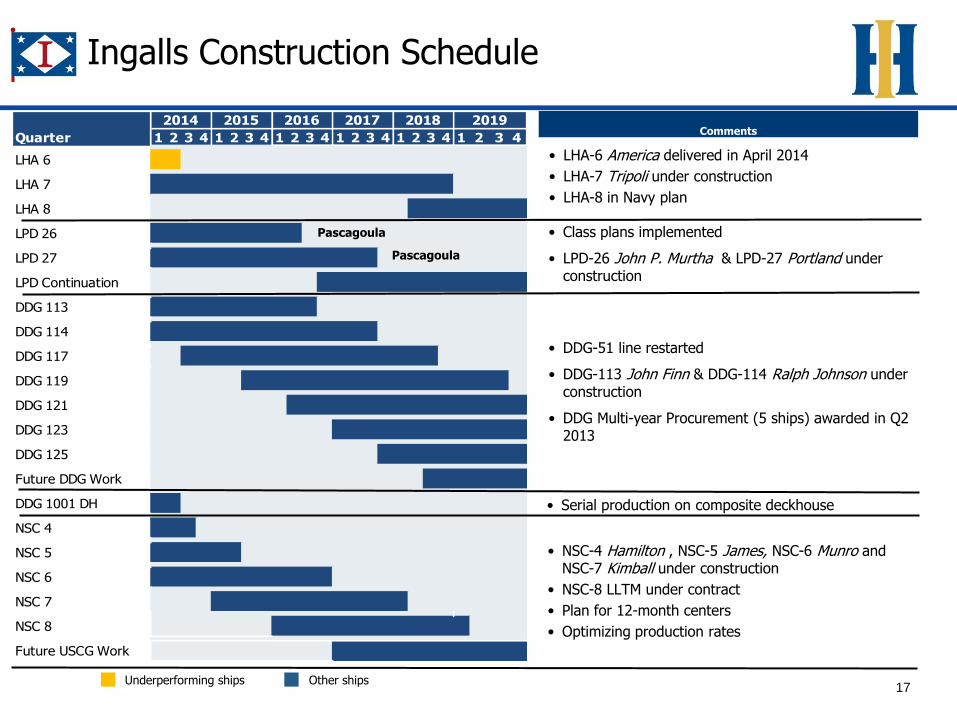
Quarter 1 2 3 4 1 2 3 4 1 2 3 4 1 2 3 4 1 2 3 4 1 2 3 4
LHA 6
LHA 7
LHA 8
LPD 26
LPD 27
LPD Continuation
DDG 113
DDG 114
DDG 117
DDG 119
DDG 121
DDG 123
DDG 125
Future DDG Work
DDG 1001 DH
NSC 4
NSC 5
NSC 6
NSC 7
NSC 8
Future USCG Work
20192015 20182014 2016 2017
Underperforming ships
Ingalls Construction Schedule
17 Other ships
Comments
• NSC-4 Hamilton , NSC-5 James, NSC-6 Munro and NSC-7 Kimball under construction
• NSC-8 LLTM under contract
• Plan for 12-month centers
• Optimizing production rates
• Class plans implemented
• LPD-26 John P. Murtha & LPD-27 Portland under construction
• DDG-51 line restarted
• DDG-113 John Finn & DDG-114 Ralph Johnson under construction
• DDG Multi-year Procurement (5 ships) awarded in Q2 2013
• Serial production on composite deckhouse
• LHA-6 America delivered in April 2014
• LHA-7 Tripoli under construction
• LHA-8 in Navy plan
Pascagoula
Pascagoula
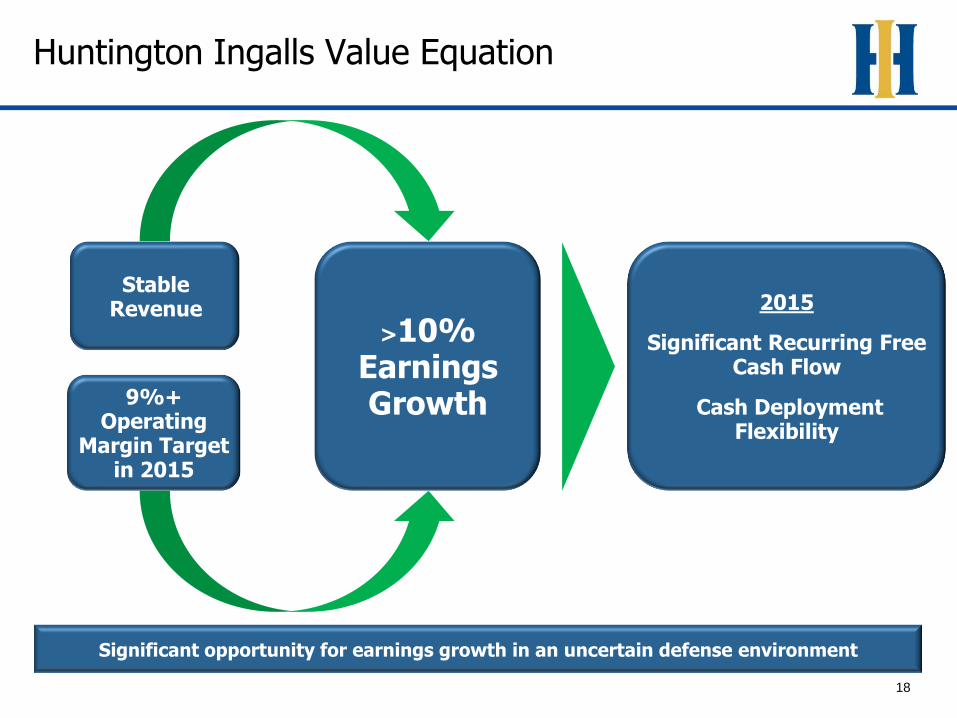
Huntington Ingalls Value Equation
18
Stable Revenue
9%+ Operating
Margin Target in 2015
Significant opportunity for earnings growth in an uncertain defense environment
>10% Earnings Growth
2015
Significant Recurring Free Cash Flow
Cash Deployment Flexibility
Unsa
ve
d D
ocu
me
nt
/ 1
2/2
9/1
0 /
10
:02
Consolidated Financial Highlights

Historical Financial Summary
20
YTD 2014 YTD 20131 FY 2013 FY 2012 FY 2011
($ in millions, except EPS)
Newport News $2,176 $2,104 $4,139 $3,840 $3,766
Ingalls 1,119 1,142 2,757 2,840 2,885
Other 20 -
Intersegment eliminations (2) (1) (76) (72) (76)
Total Revenue $3,313 $3,245 $6,820 $6,708 $6,575
Newport News 198 201 392 360 342
Ingalls 102 55 175 97 70
Total Segment Operating Income2 $300 $256 $567 $457 $412
% Margin2 9.1% 7.9% 8.3% 6.8% 6.3%
Total Operating Income2 $340 $211 $512 $358 $390
% Margin2 10.3% 6.5% 7.5% 5.3% 5.9%
Pension-adjusted Operating Income2 $297 $252 $573 $438 $413
% Margin2 9.0% 7.8% 8.4% 6.5% 6.3%
Diluted EPS $3.84 $2.00 $5.18 $2.91 ($2.05)
Pension-adjusted Diluted EPS2 $3.28 $2.53 $5.97 $3.95 $4.15
Adjusted operating margin improving, but limited by legacy underperforming contracts
1 Segment information includes realignment of AMSEC and CMSD business lines from Ingalls to Newport News segment. 2 Refer to reconciliation to reported GAAP financial data on pages 25 and 26.
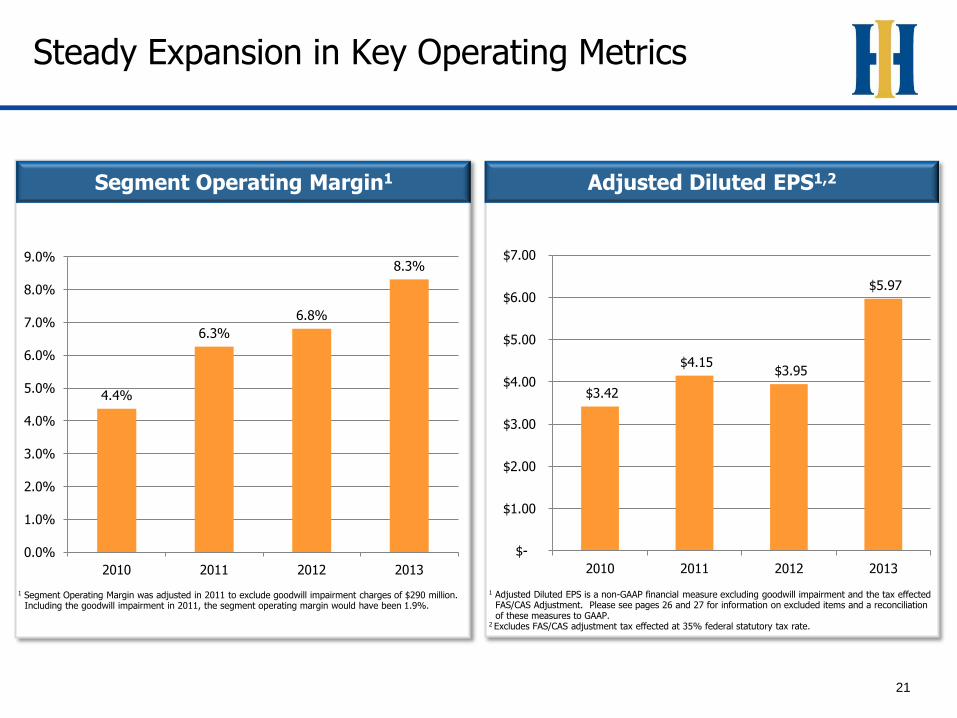
Steady Expansion in Key Operating Metrics
21
4.4%
6.3%
6.8%
8.3%
0.0%
1.0%
2.0%
3.0%
4.0%
5.0%
6.0%
7.0%
8.0%
9.0%
2010 2011 2012 2013
$3.42
$4.15 $3.95
$5.97
$-
$1.00
$2.00
$3.00
$4.00
$5.00
$6.00
$7.00
2010 2011 2012 2013
Adjusted Diluted EPS1,2 Segment Operating Margin1
1 Segment Operating Margin was adjusted in 2011 to exclude goodwill impairment charges of $290 million. Including the goodwill impairment in 2011, the segment operating margin would have been 1.9%.
1 Adjusted Diluted EPS is a non-GAAP financial measure excluding goodwill impairment and the tax effected FAS/CAS Adjustment. Please see pages 26 and 27 for information on excluded items and a reconciliation of these measures to GAAP.
2 Excludes FAS/CAS adjustment tax effected at 35% federal statutory tax rate.

22
$76
$136
$220
$266
$287
$246
$218
$181$191 $197
$162
$139
1.6%
2.5%
3.5%
4.6%
5.4%
4.3%
3.5%
2.9% 2.8% 3.0%
2.4%2.0%
$0
$100
$200
$300
2002 2003 2004 2005 2006 2007 2008 2009 2010 2011 2012 2013 Future
Capex Capex % of Revenues
Investing for Long-term Program Stability
Capital Expenditure
($ in millions)
2007 – 2011 – Carrier Inactivation/RCOH
2009 – 2014 – VCS 2-per year (Submarines)
2003 – 2009 – Ford-class (Carriers)
2003 – 2007 – New Pier (Carriers)
Long term “Maintenance” capex =
~2.0-3.0% of sales
2003 – 2008 – Electrical System and CAD Upgrade
2005 – 2009 – Hurricane spending
Substantial investments designed to protect and strengthen market position

Unsa
ve
d D
ocu
me
nt
/ 1
2/2
9/1
0 /
10
:02

Unsa
ve
d D
ocu
me
nt
/ 1
2/2
9/1
0 /
10
:02
Non-GAAP Reconciliations

Reconciliation of Non-GAAP Measures – Segment and Pension-adjusted Operating Income and Margin
25
Year Ended Dec. 31,
YTD 2014 YTD 2013 2013 2012 2011
($ in millions)
Sales and Service Revenues $3,313 $3,245 $6,820 $6,708 $6,575
Segment Operating Income 300 256 567 457 122
Adjustment for non-cash goodwill impairment1 - - - - 290
Adjusted Segment Operating Income 300 256 567 457 412
Adjusted Segment Operating Margin 9.1% 7.9% 8.3% 6.8% 6.3%
Operating Income 340 211 512 358 100
Adjustment for non-cash goodwill impairment1 - - - - 290
FAS/CAS Adjustment (43) 41 61 80 23
Adjusted Total Operating Income 297 252 573 438 413
Adjusted Operating Margin 9.0% 7.8% 8.4% 6.5% 6.3%
1 Non-cash goodwill impairment charge recorded at the Ingalls segment as a result of adverse equity market conditions that began in the second quarter of 2011 and the resultant decline
in industry market multiples and HII's market capitalization.

Reconciliation of Non-GAAP Measures – Adjusted EPS
26
Year Ended Dec. 31,
YTD 2014 YTD 2013 2013 2012 2011
($ in millions, except per share amounts) Pension-adjusted Net Earnings
Net Earnings (Loss) $190 $101 $261 $146 ($100)
Adjustment for non-cash goodwill impairment - - - - 290
After-tax FAS/CAS Adjustment1 (28) 27 40 52 15
Pension-adjusted Net Earnings $162 $128 $301 $198 $205
Outstanding Shares
Weighted-Average Diluted Shares Outstanding 49.5 50.5 50.4 50.1 48.8
Dilutive impact excluded due to net loss position - - - - 0.6
Adjusted Weighted-Average Diluted Shares Outstanding2 49.5 50.5 50.4 50.1 49.4
Pension-adjusted Diluted EPS
Diluted earnings (loss) per share $3.84 $2.00 $5.18 $2.91 ($2.05)
Non-cash goodwill impairment per share - - - -
5.94
After-tax FAS/CAS Adjustment per share1 (0.56) 0.53 0.79 1.04 0.31
Impact of Adjusted Weighted-Average Diluted Shares Outstanding - - - - (0.05)
Pension-adjusted Diluted EPS $3.28 $2.53 $5.97 $3.95 $4.15
1 Tax effected at 35% federal statutory tax rate.
2 Adjusted weighted-average diluted common shares outstanding is a non-GAAP measure defined as weighted average common shares outstanding plus the dilutive effect of stock options
and stock awards. This measure has been provided for consistency and comparability of the 2011 results with earnings per share from 2012.