Embed Size (px)
Citation preview
1 of 2
© Copyright 2011 Willis Limited/Willis Re Inc. All rights reserved: No part of this publication may be reproduced, stored in a retrieval system, or transmitted in any form or by any means, whether electronic, mechanical, photocopying, recording, or otherwise, without the written permission of Willis Limited/Willis Re Inc. Some information contained in this report may be compiled from third party sources; however, we do not guarantee and are not responsible for the accuracy of such. This report is for general guidance only, is not intended to be relied upon, and any action based on or in connection with anything contained herein should be taken only after obtaining specific advice. The views expressed in this report are not necessarily those of Willis Limited/Willis Re Inc., or any of its/their parent or sister companies, subsidiaries or affiliates (hereinafter “Willis“). Willis accepts no responsibility for the content or quality of any third party websites to which we refer. The TAOS real-time hazard and impact forecast information is provided "as is" and without warranties as to performance or any other warranties whether expressed or implied. The user is strongly cautioned to recognize that natural hazards modeling and analysis are subject to many uncertainties. These uncertainties include, but are not limited to, the uncertainties inherent in weather and climate, incomplete or inaccurate weather data, changes to the natural and built environment, limited historical records, and limitations in the state of the art of modeling, as well as limits to the scientific understanding of storm weather phenomena. Anyone making use of the hazard and impact information provided by KAC, or the information contained within, assumes all liability deriving from such use, and agrees to "hold harmless" any and all agencies or individuals associated with its creation. The user agrees to provide any subsequent users of this data with this disclaimer. The publication of the material contained herein is not intended as a representation or warranty that this information is suitable for any general or particular use.
Hazard and damage potential maps produced by Willis are based on numerical modeling results from Kinetic Analysis Corporation.
Hurricane IreneInformation from NHC Advisory 18, 5:00 PM EDT Wednesday August 24, 2011
Hurricane Irene continues impacting the Bahamas. Conditions are favorable for some additional strengthening over the next one or two days.
Intensity Measures Position & Heading Landfall Forecast (NHC)
Max Sustained Wind Speed:
120 mph (category 3)
Position Relative to Land: 215 miles SE of Nassau, Bahamas
Est. Time & Region: Today on the BahamasMin Central Pressure: 954 mb Coordinates: 23.1 N, 74.7 W
Hurricane ForceWinds (74+ mph):
60 miles from the center Bearing/Speed: NW or 310 degrees at 12 mph Est. Max Sustained Wind
Speed: 130 mph (category 3)
HURRICANE TRACKING ADVISORY
eVENT™
Forecast Summary• Within 48 hours, there is a 96% chance Irene will remain at hurricane strength (74+ mph winds), a 4% chance Irene will weaken to a tropical
storm (39-73 mph winds) and a less than 1% chance Irene will weaken to a tropical depression (winds below 39 mph) or dissipate. • The windfield map – based on the AVNO 12:00 UTC forecast (below right) – shows that this model has forecast the storm’s peak winds at
category 3 hurricane strength (111–130 mph winds). The AVNO – one of many models used by NOAA – has been statistically identified as the current “best performing” model for Hurricane Irene by Kinetic Analysis Corp.
• Hurricane conditions are occurring over portions of the southeastern Bahamas. Tropical storm conditions will continue to spread over the central Bahamas with hurricane conditions expected by tonight. Tropical storm conditions are expected in the northwestern Bahamas by late tonight with hurricane conditions expected Thursday. Irene is expected to produce additional rainfall accumulations of 1-3 inches overHispaniola, with isolated maximum storm total amounts of 15 inches possible. Rainfall accumulations of 6-12 inches are expected in the Bahamas and the Turks and Caicos Islands.
• A storm surge will raise water levels 7-11 feet above normal tide levels over the Bahamas. Swells generated by Irene will begin affecting portions of the coast of the southeastern United States on Thursday.
Forecast Track for Hurricane Irene(National Hurricane Center)
Forecast Windfield & Rain Footprint for Hurricane Irene(Based on AVNO as of 12:00 UTC) from Kinetic Analysis Corp.
Havana
Washington D.C.
NassauNassau
Hamilton
ChicagoChicago
New YorkNew York
PhiladelphiaPhiladelphia
MiamiMiami
DetroitDetroitMilwaukeeMilwaukee
ClevelandCleveland
St. LouisSt. Louis
PittsburghPittsburghBoston
Columbus
RochesterCACA
Tropic of CancerTropic of Cancer
Lake ErieLake Erie
Lake MichiganLake MichiganLake HuronLake Huron
Lake OntarioLake Ontario
Chicago
New York
Philadelphia
Miami
Tampa
Toledo
London
Memphis
Detroit
Charlotte
St. Louis
Cleveland
Milwaukee Etobicoke
Cincinnati
Pittsburgh
North York
New Orleans
Kansas City
Jacksonville
Virginia Beach
District Heights
Indianapolis City
Nashville-Davidson
LouisvilleLexington-Fayette
08-29
08-26
08-25
08-28
08-27
IL
FL
IA
MI
NY
AL
LA
GA
PAIN
AR
NC
VA
WI
OH
ON
TN
NS
MS
KY
SC
WV
MN ME
MA
VTNH
MD
NJ
DE
NB
0 500 1,000250 Miles
weak TSstrong TSCat 1Cat 2Cat 3Cat 4Cat 5All Fcst Tracks
below 1 in1 - 3 in3 - 6 in6 - 9 in9 - 12 in12 - 24 inAVNO FcstTrackNHC FcstTrack
Ï!D TD
Ï!S TS
Ï!1 Cat1
Ï!2 Cat2
Ï!3 Cat3
Ï!4 Cat4
Ï!5 Cat5
Page 2 of 2
Roy Cloutier7760 France Avenue SouthMinneapolis, MN [email protected]+1 (952) 841-6652
Contact us
Brian Owens51 Lime Street London EC3M [email protected]+44 (0)20 3124 7637
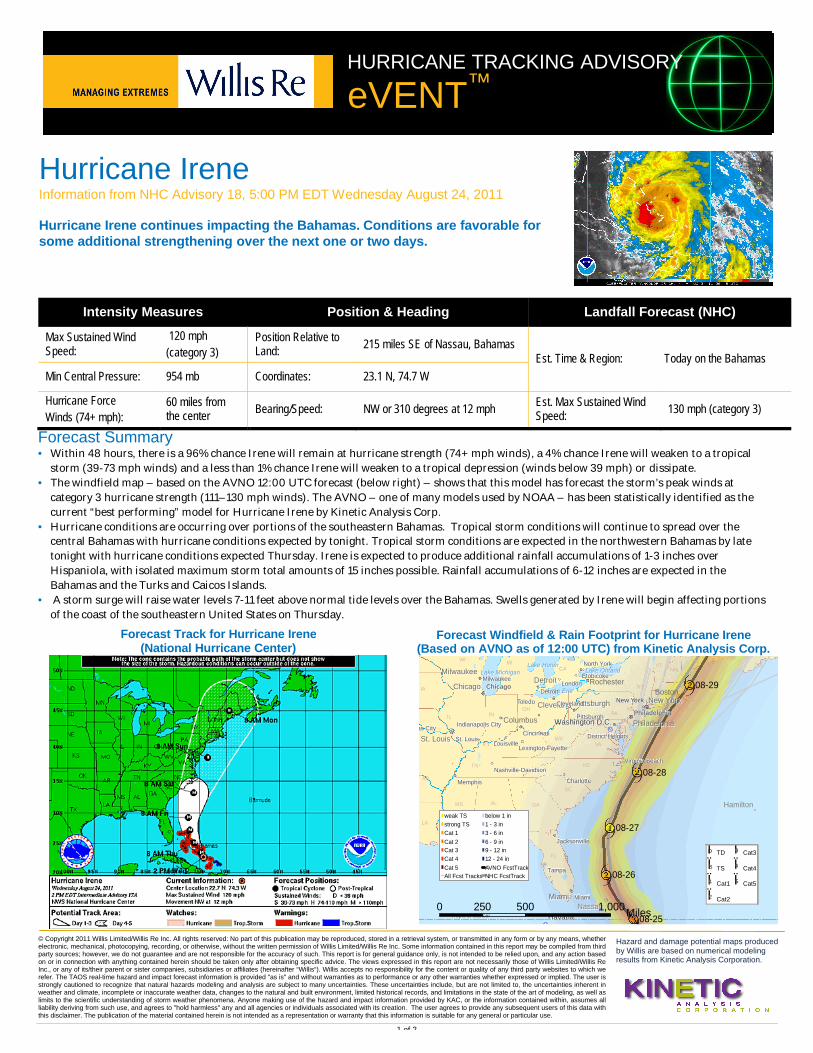
Warnings, Watches and New Tropical Cyclone PotentialA hurricane warning – meaning that hurricane conditions are expected within the warning area within 36 hours - is in effect for the southeastern, central, and northwestern Bahamas. A tropical storm warning – meaning that tropical storm conditions are expected within the warning area within 36 hours – is in effect for the Turks and Caicos Islands.
NHC Estimates of New Atlantic Tropical Cyclone FormationThe map to the right illustrates the NHC’s estimate of tropical
cyclone formation potential over the next 48 hours in the Atlantic.
There is a 60% chance of tropical cyclone formation in the red
region nearest Africa, and a 10% chance of tropical cyclone formation in the yellow region.
National Hurricane Center Tropical Cyclone Formation Estimates on August 24, 2011
Summary of Atlantic Hurricane Activity to Date
Tropical Storm Activity to DateIrene is the ninth named storm and first hurricane of the
2011 Atlantic Hurricane Season. Four named storms and
two hurricanes, Alex and Danielle, had occurred by this date
last year. The next tropical storm of 2011 will be named
Jose.
For the years 1995-2010, the average dates of the first
named storm, first hurricane and first major hurricane are
Jul 1, Aug 6 and Aug 30, respectively. Aug 18 and Sep 15 are
the average dates of the fourth and ninth named storms.
Benchmarking the 2011 Atlantic Season to DateTropical Storms
AllHurricanes
Cat 3-5 Hurricanes
2011 year to date (1/1/11 – 8/23/11) 9 1 02010 year to date (1/1/10 – 8/23/11) 4 2 01995-2010 season average 14.4 7.9 3.81950-2010 season average 10.5 6.2 2.72011 CSU season forecasts(Colorado State University at Aug 3)
16 9 5
2011 NOAA season forecasts(NOAAs Climate Prediction Center at Aug 4)
14-19 7-10 3-5
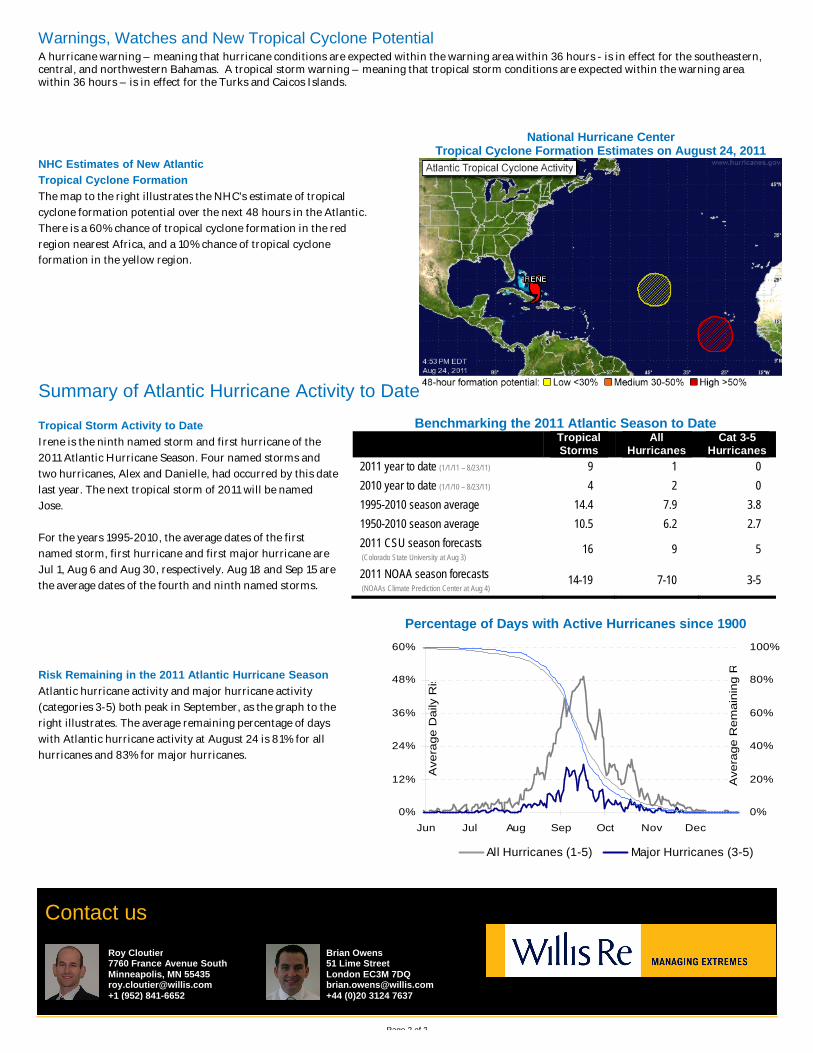
Risk Remaining in the 2011 Atlantic Hurricane SeasonAtlantic hurricane activity and major hurricane activity
(categories 3-5) both peak in September, as the graph to the
right illustrates. The average remaining percentage of days
with Atlantic hurricane activity at August 24 is 81% for all
hurricanes and 83% for major hurricanes.
Percentage of Days with Active Hurricanes since 1900
0%
12%
24%
36%
48%
60%
Jun Jul Aug Sep Oct Nov Dec
Ave
rage
Dai
ly R
isk
0%
20%
40%
60%
80%
100%
Ave
rage
Rem
aini
ng R
isk
All Hurricanes (1-5) Major Hurricanes (3-5)