Embed Size (px)
Citation preview
HVAC INSULATION- One of The Keys to a “HEALTHY BUILDING"
Glenn Brower
ASHRAE Technical Comm. Member
Knauf Fiber Glass
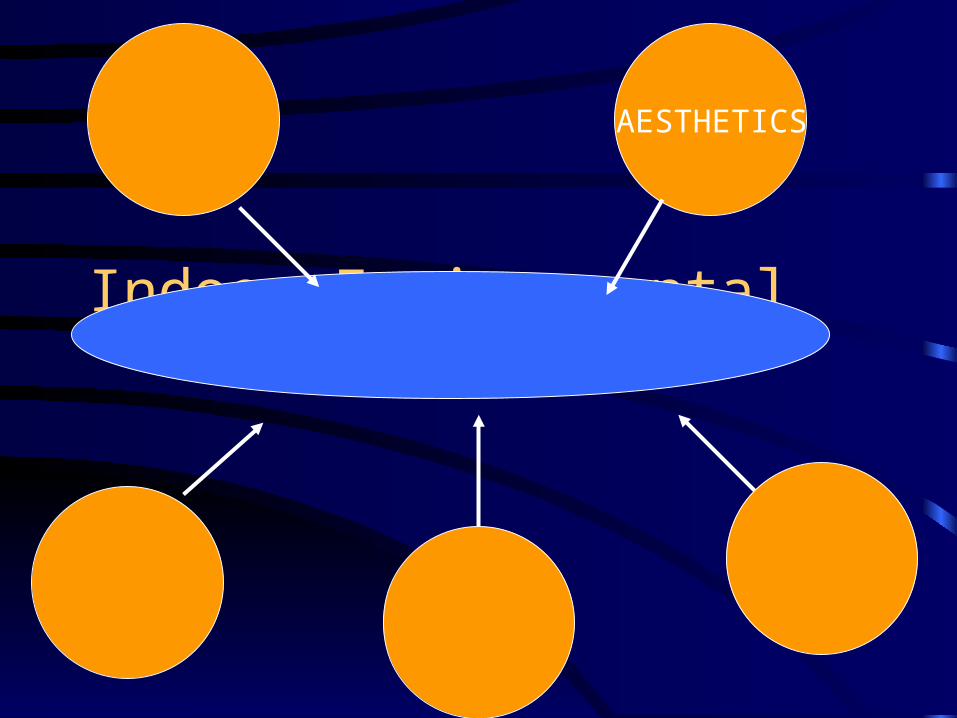
Indoor Environmental Quality
AIR PURITY THERMAL
COMFORT
ACOUSTICAL COMFORT
LIGHTING
QUALITYAESTHETICS

THE ROLE OF HVAC INSULATION IN IEQ
• Thermal - helps to deliver air at the design temperature, save energy and minimize condensation
• Acoustical - helps to reduce sound down the ducts, breakout noise, crosstalk
• ventilation - can insulate without contributing to indoor pollution
• aesthetics - depending on application, can be finished to blend in
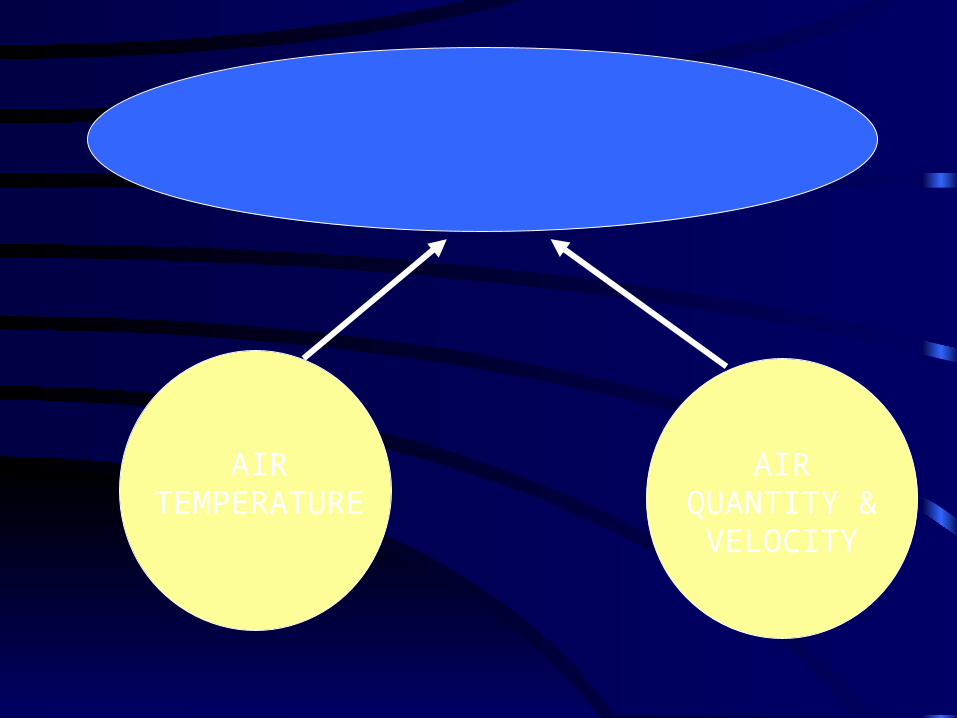
THERMAL COMFORT
AIR TEMPERATURE
AIR QUANTITY &
VELOCITY
THERMAL PERFORMANCE OF
DUCT INSULATIONS • Both internal and external insulations can deliver
required R-values– R-values should be specified based on installed
thickness• Duct Wraps are installed with 25% compression
– Most codes specify R-values based on ASTM C518 or C177 testing
• no air film benefits are allowed
– Radiant barrier insulations tested at high delta T’s will not deliver R-value in duct applications
DUCT THERMAL PERFORMANCE
• Temperature Drop or Gain can drive insulation above code requirements– example, 305mm x 610mm duct, delivering air
at 12.50 C, at a velocity of 305 meters/min over a length of 30 meters in a space at a temperature of 270 C, would have the following temperature gains:
• uninsulated, ~ 40 C
• insulated to R-0.74 m2-C/W, ~ 0.80 C
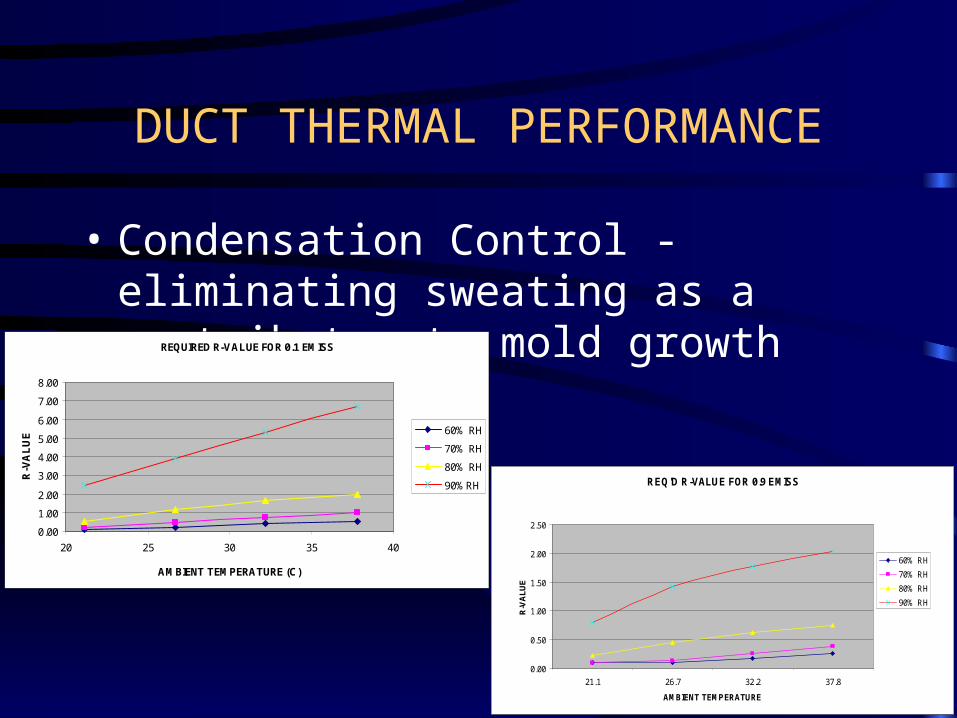
DUCT THERMAL PERFORMANCE
• Condensation Control - eliminating sweating as a contributor to mold growth
REQUIRED R-VALUE FOR 0.1 EMISS
0.00
1.00
2.00
3.00
4.00
5.00
6.00
7.00
8.00
20 25 30 35 40
AMBIENT TEMPERATURE (C)
R-V
AL
UE
60% RH
70% RH
80% RH
90%RH REQ'D R-VALUE FOR 0.9 EMISS
0.00
0.50
1.00
1.50
2.00
2.50
21.1 26.7 32.2 37.8
AMBIENT TEMPERATURE
R-V
AL
UE
60% RH
70% RH
80% RH
90% RH

AIR FLOW CONSIDERATIONS WITH INTERNAL LINED SYSTEMS
• The use of any type of material on the inside of a sheet metal duct will have some type of associated friction loss– friction loss can be calculated from surface
absolute roughness factorsgalvanized steel, 1.22 m joints 0.091 mm
galvanized steel, 0.61 m joints 0.152 mm
fg liner with mat-faced airstream 0.914 mm
fg liner with coated airstream 3.048 mm
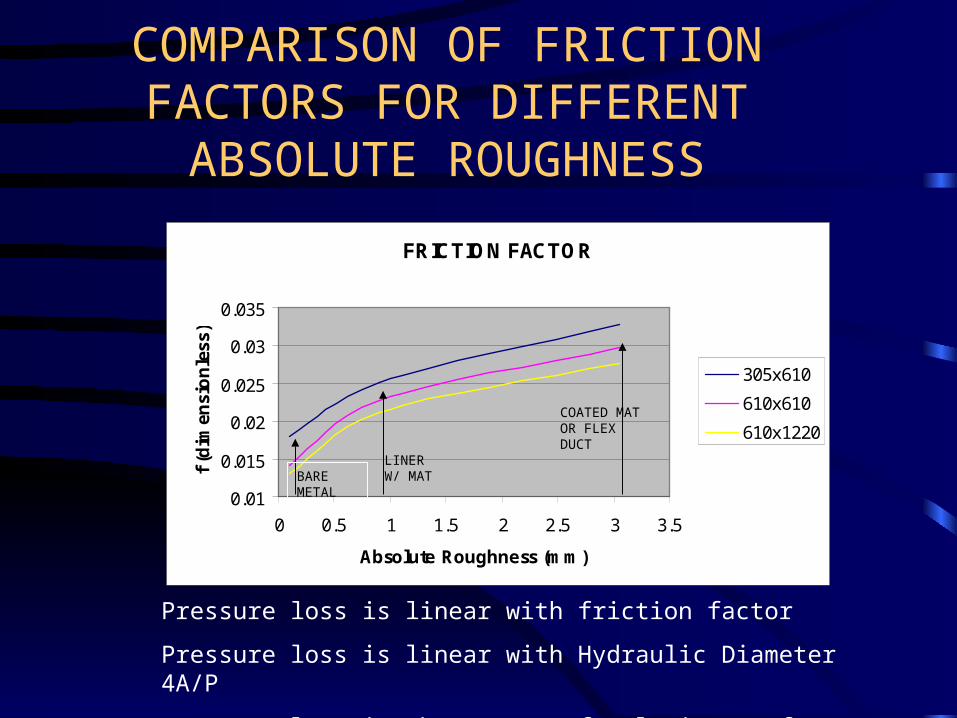
COMPARISON OF FRICTION FACTORS FOR DIFFERENT ABSOLUTE ROUGHNESS
Pressure loss is linear with friction factor
Pressure loss is linear with Hydraulic Diameter 4A/P
Pressure loss is the square of velocity, a factor of 2 in f = 30% velocity loss
FRICTION FACTOR
0.01
0.015
0.02
0.025
0.03
0.035
0 0.5 1 1.5 2 2.5 3 3.5
Absolute Roughness (mm)
f (d
imen
sio
nle
ss)
305x610
610x610
610x1220
BARE METAL
LINER W/ MAT
COATED MAT OR FLEX DUCT
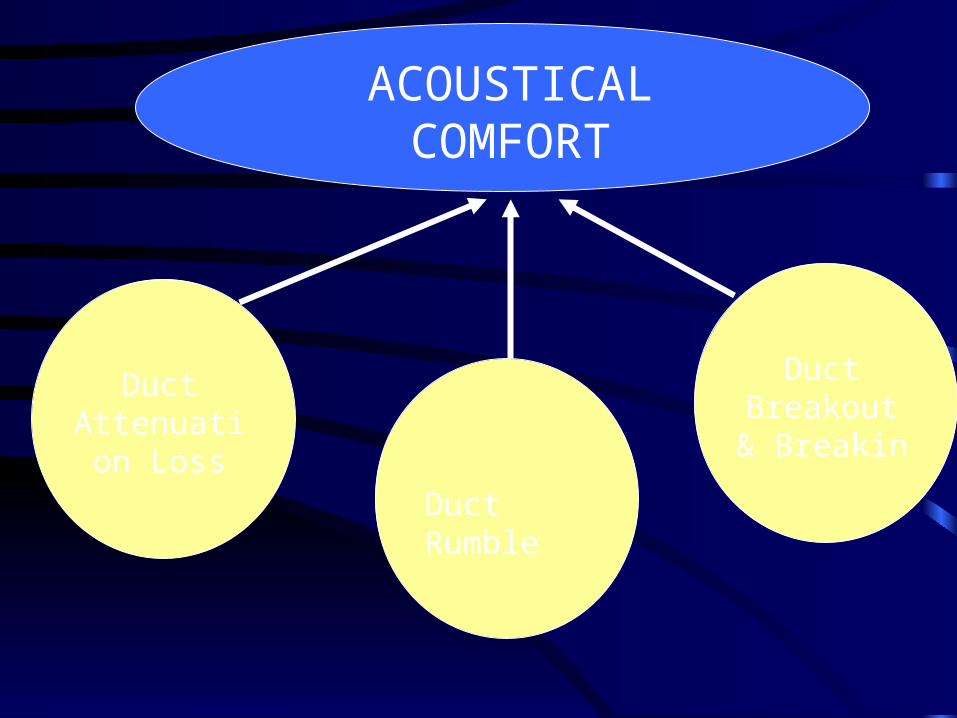
ACOUSTICAL COMFORT
Duct Attenuation
LossDuct Rumble
Duct Breakout &
Breakin

Air Ducts Are “Speaking Tubes”
Direct energy through a very focused area.
Carry equipment noise, damper noise, and other duct noise.
Can generate their own noise through expansion, contraction, or air velocity.
Carry office noise from interconnected spaces.
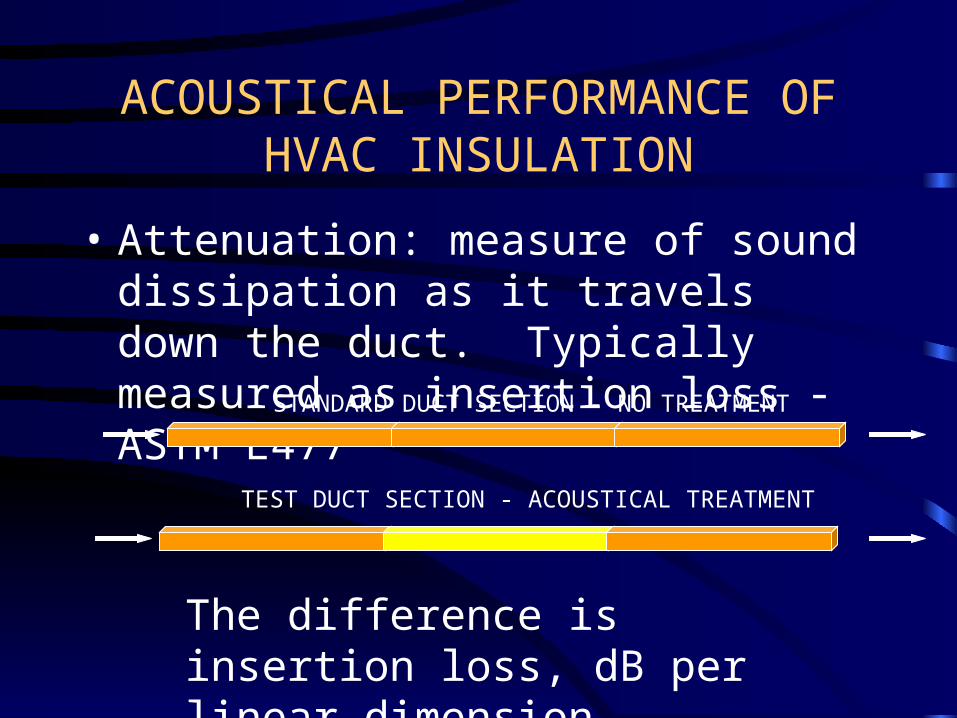
ACOUSTICAL PERFORMANCE OF HVAC INSULATION
• Attenuation: measure of sound dissipation as it travels down the duct. Typically measured as insertion loss - ASTM E477
STANDARD DUCT SECTION - NO TREATMENT
TEST DUCT SECTION - ACOUSTICAL TREATMENT
The difference is insertion loss, dB per linear dimension
THE ABILITY OF DUCT LINER TO PROVIDE ATTENUATION
• ASHRAE Applications, Sound and Vibration Control gives data on effectiveness of duct liner over a large range of rectangular duct sizes– insulation thickness is the primary driver for
attenuation
– product density is an insignificant factor
– as duct size increases, effectiveness of internal lining is diminished

COMPARISON OF ASHRAE ATTENUATION DATA FOR
RECTANGULAR DUCTS
DUCT LINERSIZE (mm)THICKNESS 125 Hz 250Hz 500 Hz 1000 Hz 2000 Hz 4000 Hz
305x305 0 0.66 0.33 0.20 0.20 0.20 0.2025 1.31 2.62 6.23 13.12 13.45 9.1951 1.64 5.25 11.48 16.41 13.45 9.19
610x610 0 0.66 0.33 0.10 0.10 0.10 0.1025 0.66 1.64 4.59 9.19 7.22 5.9151 0.98 2.95 8.20 11.48 7.22 5.91
305x610 0 0.66 0.33 0.16 0.16 0.16 0.1625 0.98 1.97 5.58 11.48 10.50 7.5551 1.31 4.27 9.84 14.11 10.50 7.55
ATTENUATION LOSS dB/meter
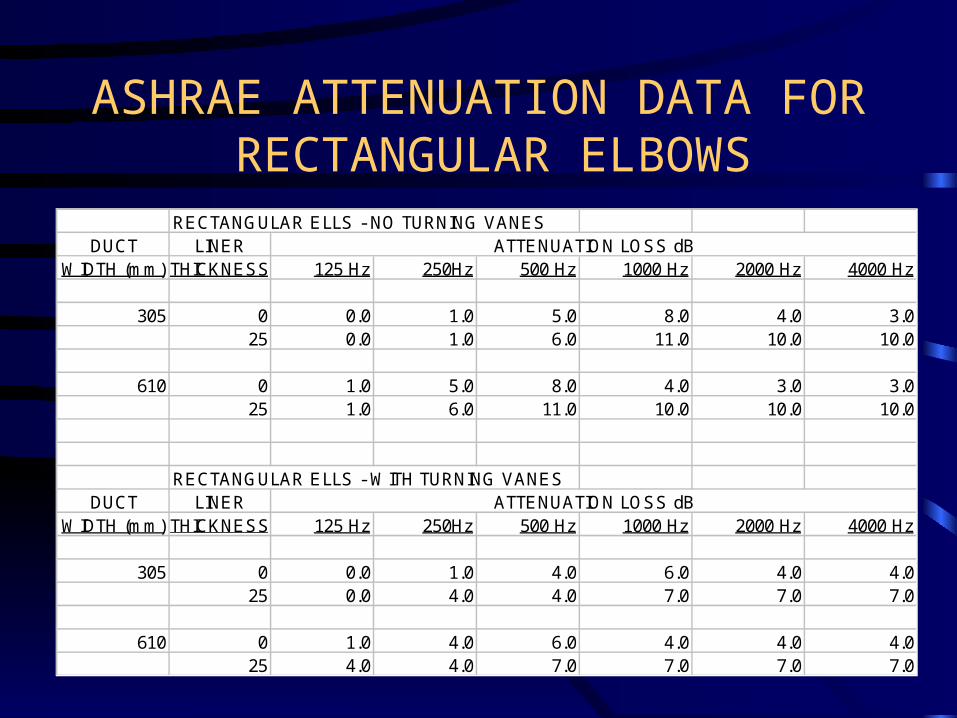
ASHRAE ATTENUATION DATA FOR RECTANGULAR ELBOWS
RECTANGULAR ELLS - NO TURNING VANESDUCT LINER
WIDTH (mm) THICKNESS 125 Hz 250Hz 500 Hz 1000 Hz 2000 Hz 4000 Hz
305 0 0.0 1.0 5.0 8.0 4.0 3.025 0.0 1.0 6.0 11.0 10.0 10.0
610 0 1.0 5.0 8.0 4.0 3.0 3.025 1.0 6.0 11.0 10.0 10.0 10.0
RECTANGULAR ELLS - WITH TURNING VANESDUCT LINER
WIDTH (mm) THICKNESS 125 Hz 250Hz 500 Hz 1000 Hz 2000 Hz 4000 Hz
305 0 0.0 1.0 4.0 6.0 4.0 4.025 0.0 4.0 4.0 7.0 7.0 7.0
610 0 1.0 4.0 6.0 4.0 4.0 4.025 4.0 4.0 7.0 7.0 7.0 7.0
ATTENUATION LOSS dB
ATTENUATION LOSS dB
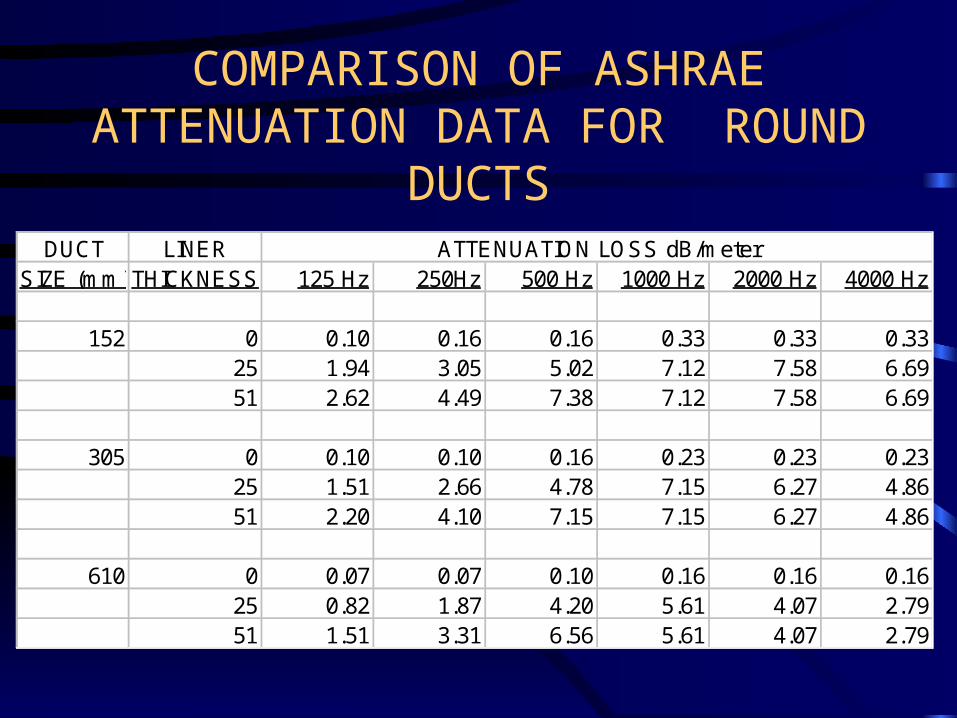
COMPARISON OF ASHRAE ATTENUATION DATA FOR ROUND
DUCTSDUCT LINER
SIZE (mm)THICKNESS 125 Hz 250Hz 500 Hz 1000 Hz 2000 Hz 4000 Hz
152 0 0.10 0.16 0.16 0.33 0.33 0.3325 1.94 3.05 5.02 7.12 7.58 6.6951 2.62 4.49 7.38 7.12 7.58 6.69
305 0 0.10 0.10 0.16 0.23 0.23 0.2325 1.51 2.66 4.78 7.15 6.27 4.8651 2.20 4.10 7.15 7.15 6.27 4.86
610 0 0.07 0.07 0.10 0.16 0.16 0.1625 0.82 1.87 4.20 5.61 4.07 2.7951 1.51 3.31 6.56 5.61 4.07 2.79
ATTENUATION LOSS dB/meter
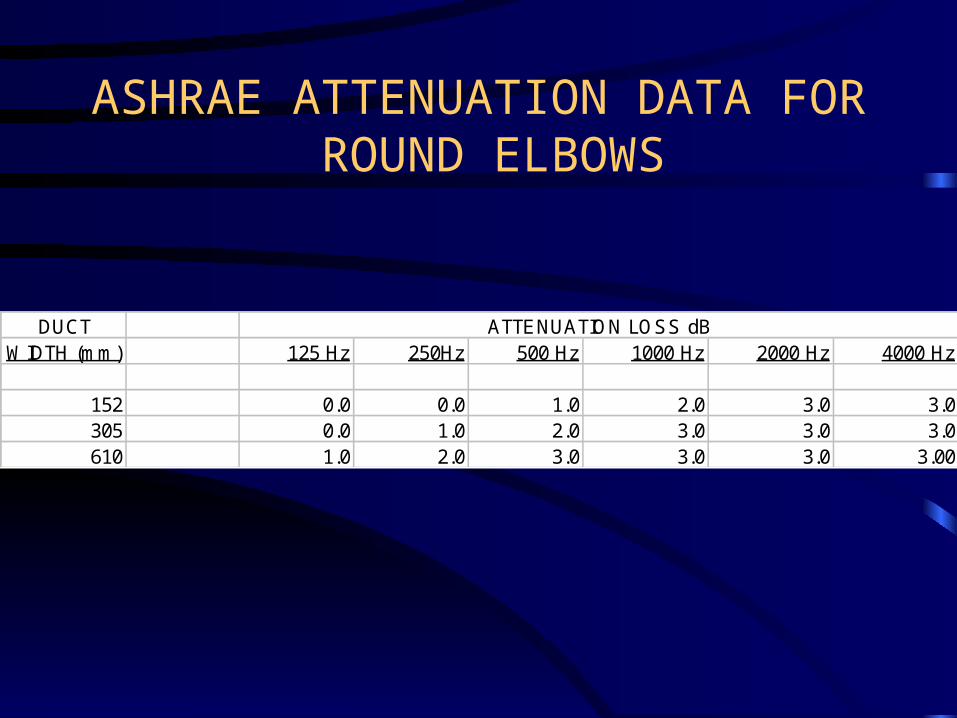
ASHRAE ATTENUATION DATA FOR ROUND ELBOWS
DUCTWIDTH (mm) 125 Hz 250Hz 500 Hz 1000 Hz 2000 Hz 4000 Hz
152 0.0 0.0 1.0 2.0 3.0 3.0305 0.0 1.0 2.0 3.0 3.0 3.0610 1.0 2.0 3.0 3.0 3.0 3.00
ATTENUATION LOSS dB
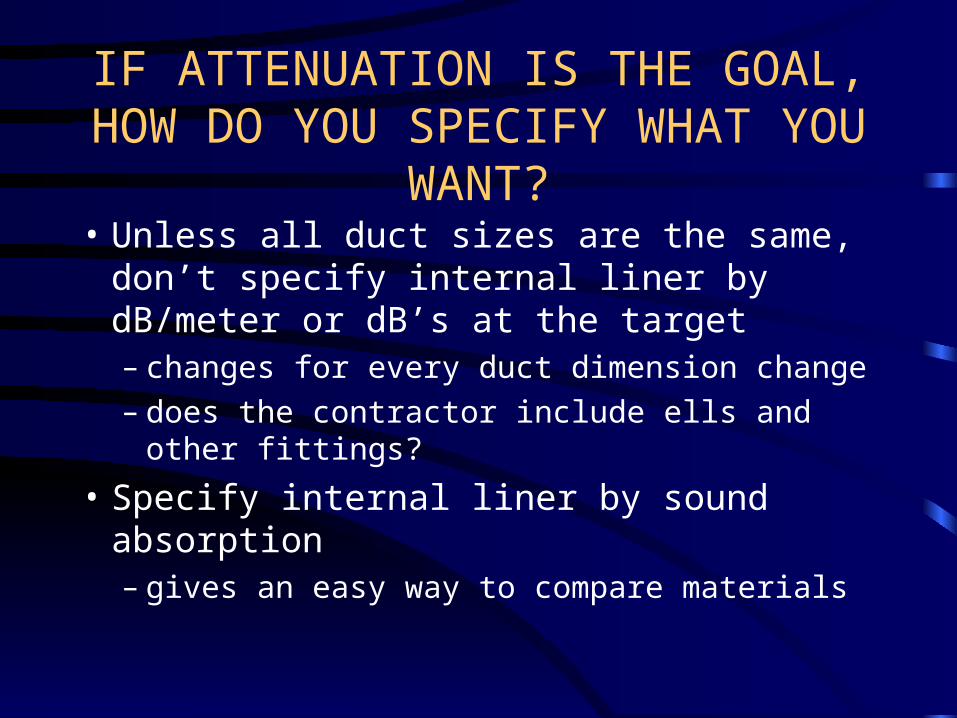
IF ATTENUATION IS THE GOAL, HOW DO YOU SPECIFY WHAT YOU
WANT?• Unless all duct sizes are the same, don’t
specify internal liner by dB/meter or dB’s at the target– changes for every duct dimension change– does the contractor include ells and other
fittings?
• Specify internal liner by sound absorption– gives an easy way to compare materials
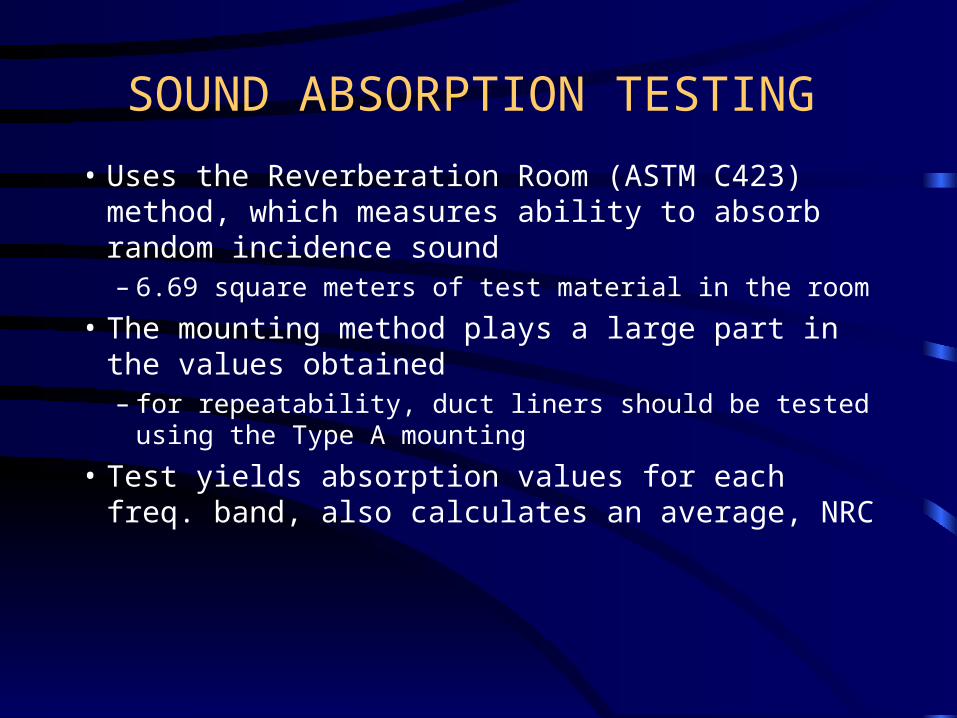
SOUND ABSORPTION TESTING
• Uses the Reverberation Room (ASTM C423) method, which measures ability to absorb random incidence sound– 6.69 square meters of test material in the room
• The mounting method plays a large part in the values obtained– for repeatability, duct liners should be tested using the Type
A mounting
• Test yields absorption values for each freq. band, also calculates an average, NRC
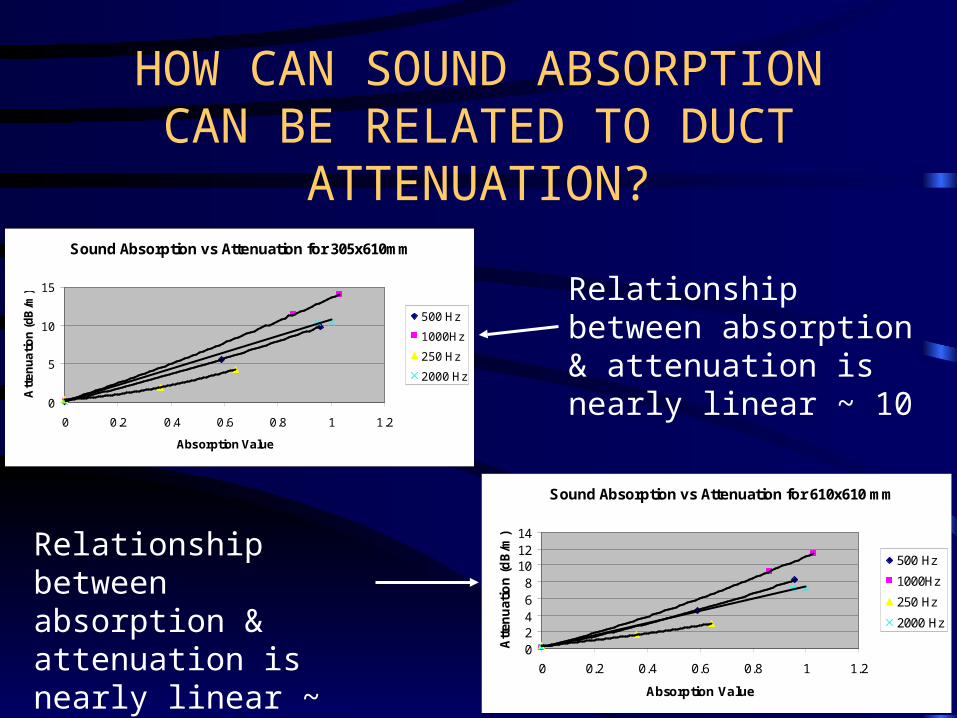
HOW CAN SOUND ABSORPTION CAN BE RELATED TO DUCT
ATTENUATION?Sound Absorption vs Attenuation for 305x610mm
0
5
10
15
0 0.2 0.4 0.6 0.8 1 1.2
Absorption Value
Att
en
ua
tio
n (
dB
/m)
500 Hz
1000Hz
250 Hz
2000 Hz
Sound Absorption vs Attenuation for 610x610 mm
02468
101214
0 0.2 0.4 0.6 0.8 1 1.2
Absorption Value
Att
enu
atio
n (
dB
/m)
500 Hz
1000Hz
250 Hz
2000 Hz
Relationship between absorption & attenuation is nearly linear ~ 10
Relationship between absorption & attenuation is nearly linear ~ 7.5

DUCT RUMBLE, BREAKOUT & BREAKIN NOISE
• Thermal insulations do not have enough mass to be effective over most frequencies
• Flexible insulations in combination with mass can be helpful– for round ducts, can be directly attached, for
rectangular, both the insulation and the mass should be physically separated from the duct

NOISE CONTROL FOR EQUIPMENT AND PIPING
Rigid insulation materials tend to pass the majority of vibrating energy right through with minimal attenuation.
Fibrous insulation is a much better attenuator. In specific applications one may have to install fibrous insulation over rigid insulation.
For extra attenuation, use multi-layered fibrous insulation with hard septums between layers.

INSERTION LOSS (dB) INTO 6" IPS SCHEDULE 40 PIPE
TEST SPECIMEN 500 Hz 1000 Hz 2000 Hz 4000 Hz
4" MIN WOOL + 2 PSF ACOUSTI-JAC 12 21 34 37
4" FIBERGLASS + 2 PSF ACOUSTI-JAC 17 30 36 42
2" MIN WOOL + 2 PSF ACOUSTI-JAC 12 27 32 37
2" FIBERGLASS + 2 PSF ACOUSTI-JAC 16 25 33 40
4" MIN WOOL + 1 PSF ACOUSTI-JAC 15 28 35 44
4" FIBERGLASS + 1 PSF ACOUSTI-JAC 15 28 35 44
2" MIN WOOL + 1 PSF ACOUSTI-JAC 10 23 30 37
2" FIBERGLASS + 1 PSF ACOUSTI-JAC 13 20 32 40

Combining Decibel Levels
0.0
0.5
1.0
1.5
2.0
2.5
3.0
3.5
0 1 2 3 4 5 6 7 8 9 10 11 12 13
dB Difference Between Two Sources
dB
To
Ad
d T
o L
arg
er
Le
ve
l
THE DILEMNA OF REDUCING NOISE FROM MULTIPLE SOURCES
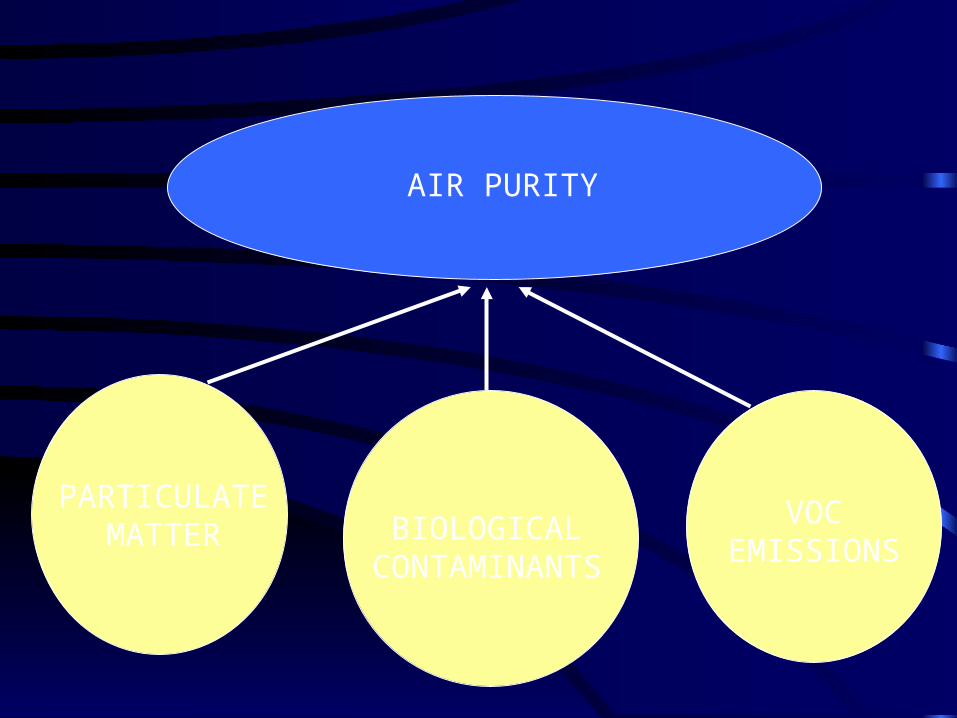
AIR PURITY
PARTICULATE MATTER BIOLOGICAL
CONTAMINANTS
VOC EMISSIONS

PARTICULATE MATTER - THE ROLE OF INSULATIONS
• External duct insulations should not contribute to dust levels in the occupied space
• Internal duct insulations are designed to be non-contributors when properly installed– FG duct liners are tested at 2.5 times rated velocity,
including an elbow without vanes, to assure that they can withstand air velocity abuse
– numerous studies have shown fiber levels to be at background levels
TOUGHNESS OF INTERNAL INSULATIONS
• The Surfaces of FG Liners will also take “normal” abuse from cleaning procedures– soft brushes or air washes will not damage the
airstream surface– cutting into the duct should be done carefully
so as not to damage the insulation– closing the duct after cleaning is also critical
for future integrity
1994 BUILDING CONSTRUCTION INDUSTRY ADVISORY COMMITTEE STUDY
• Evaluated duct cleaning methods for effectiveness in cleaning the duct surface and improving indoor air quality– contact method (conventional vacuum cleaning)– air sweep method (compressed air through a
nozzle)– mechanical brush method (rotary brush in
combination with vacuum collection)
BCIAC STUDY RESULTS
• Studied 8 identical homes in a single neighborhood, 2 homes for each method and 2 controls
• Results:– particle count readings were higher during cleaning than
before or after cleaning– cleaning did not lead to higher indoor fiber counts– air sweep method showed the greatest reduction in
bioaerosol concentration, although none caused significant improvement

HVAC INSULATIONS AND BIOLOGICAL CONTAMINANTS
• FUNGAL GROWTH– requires both moisture and nutrients– dirt and fungal spores are present almost
everywhere, therefore they will inevitably be deposited on duct surfaces
• this is true regardless of the nature of the duct surface
• the only way to minimize this deposition is through the use of better filtration
THE ROLE OF WATER AND FUNGAL GROWTH IN HVAC
SYSTEMS• Moisture is the essential element required
for fungal growth
• Studies in static environmental chambers have shown that fungal growth will initiate at RH>=65%
• Field studies in buildings where RH is regularly >65% show that fungal growth is rare
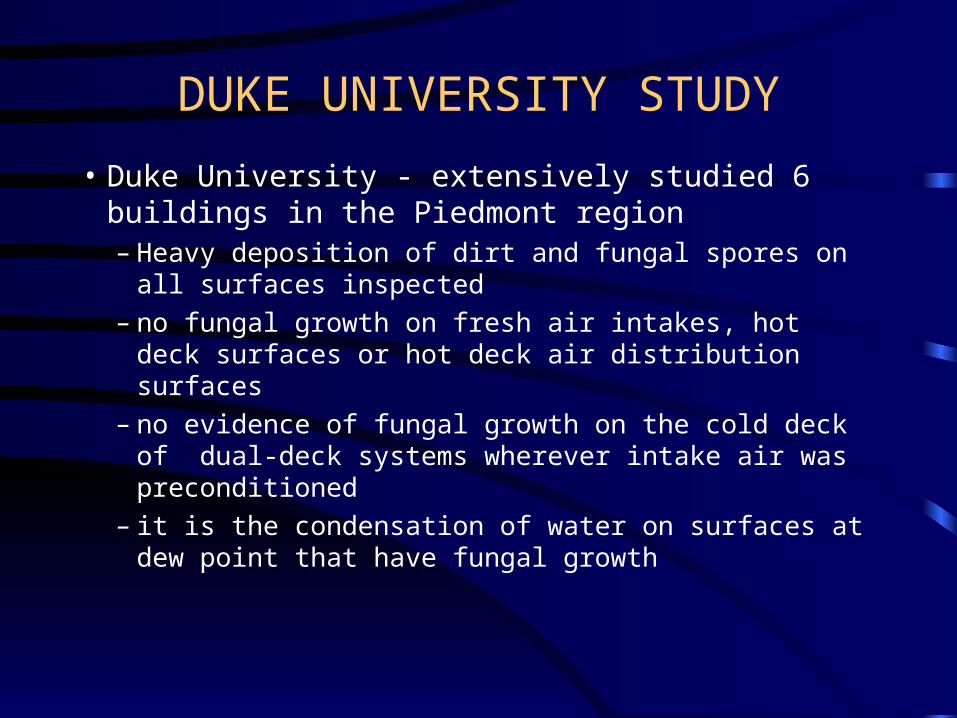
DUKE UNIVERSITY STUDY
• Duke University - extensively studied 6 buildings in the Piedmont region– Heavy deposition of dirt and fungal spores on all
surfaces inspected– no fungal growth on fresh air intakes, hot deck surfaces
or hot deck air distribution surfaces– no evidence of fungal growth on the cold deck of dual-
deck systems wherever intake air was preconditioned– it is the condensation of water on surfaces at dew point
that have fungal growth
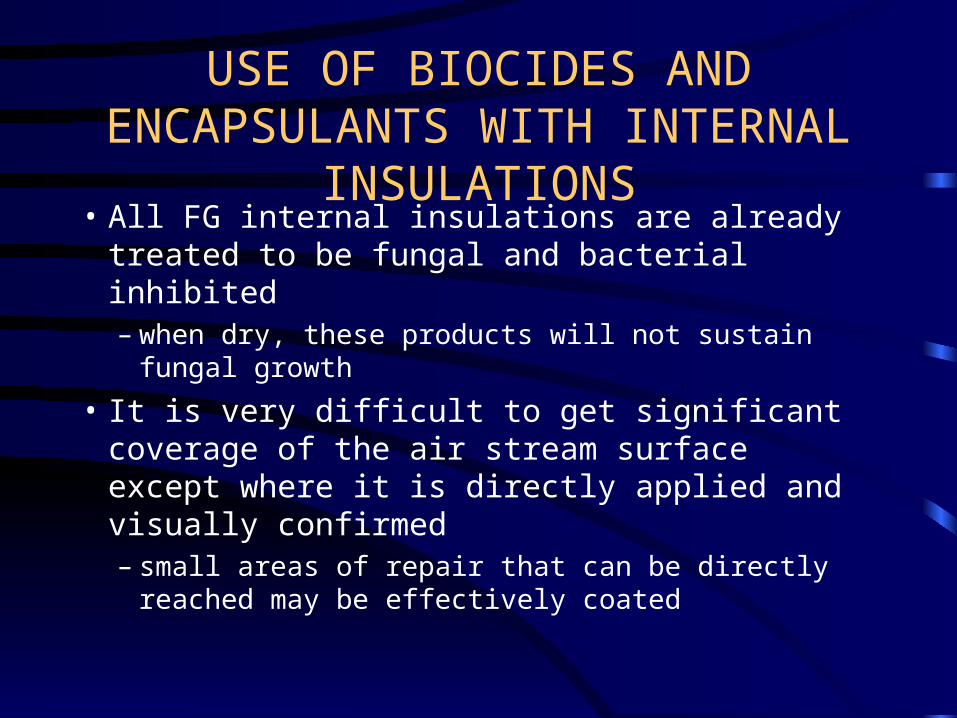
USE OF BIOCIDES AND ENCAPSULANTS WITH INTERNAL
INSULATIONS• All FG internal insulations are already treated to
be fungal and bacterial inhibited– when dry, these products will not sustain fungal
growth
• It is very difficult to get significant coverage of the air stream surface except where it is directly applied and visually confirmed– small areas of repair that can be directly reached may
be effectively coated
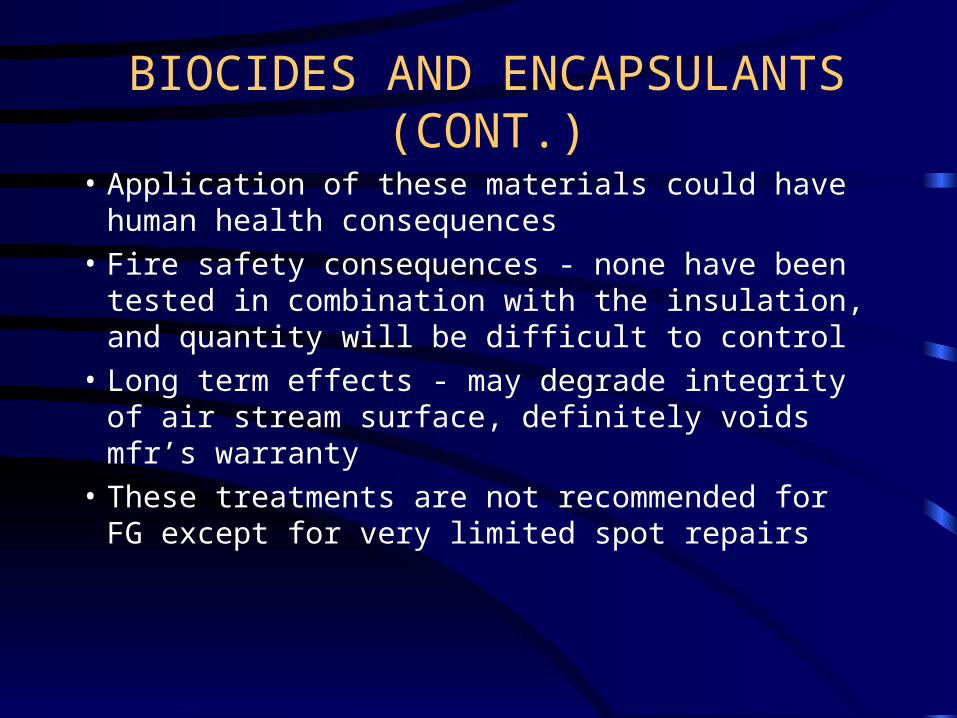
BIOCIDES AND ENCAPSULANTS (CONT.)
• Application of these materials could have human health consequences
• Fire safety consequences - none have been tested in combination with the insulation, and quantity will be difficult to control
• Long term effects - may degrade integrity of air stream surface, definitely voids mfr’s warranty
• These treatments are not recommended for FG except for very limited spot repairs
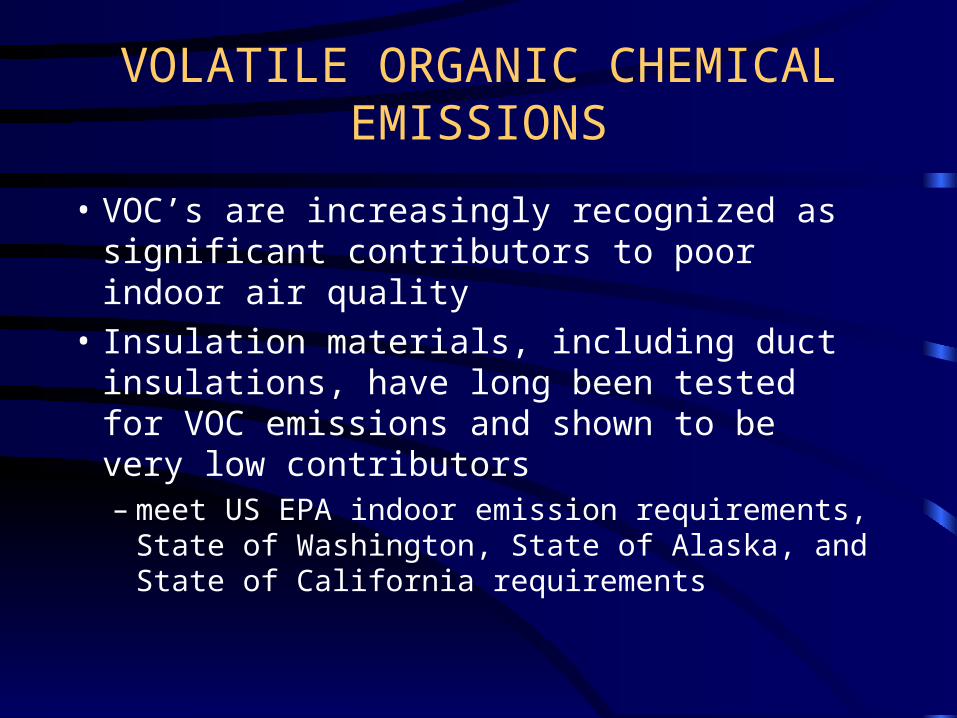
VOLATILE ORGANIC CHEMICAL EMISSIONS
• VOC’s are increasingly recognized as significant contributors to poor indoor air quality
• Insulation materials, including duct insulations, have long been tested for VOC emissions and shown to be very low contributors– meet US EPA indoor emission requirements, State of
Washington, State of Alaska, and State of California requirements
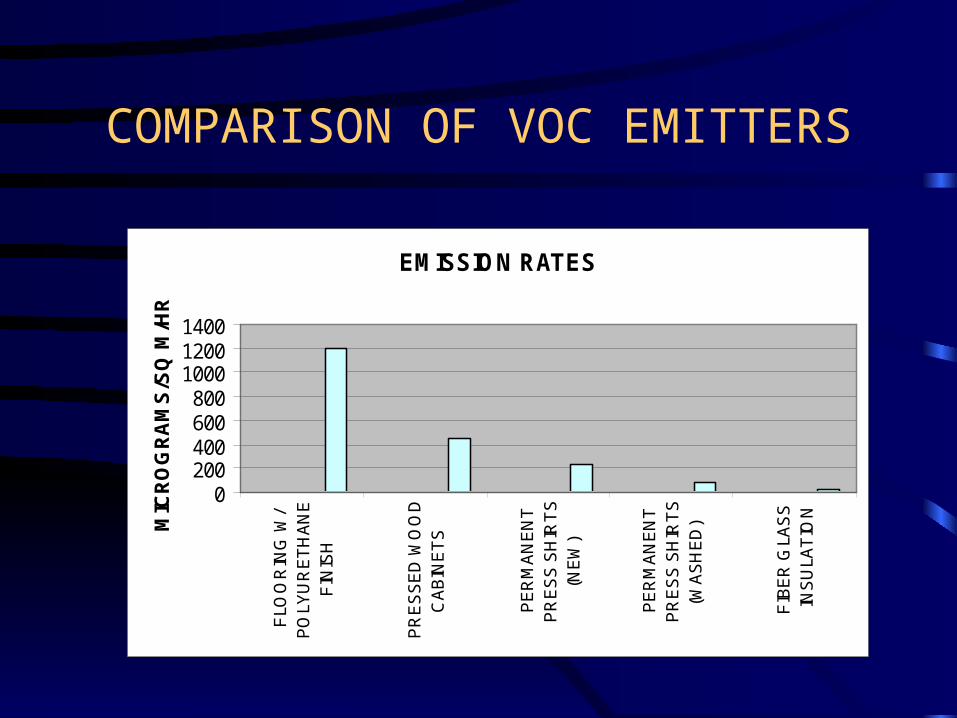
COMPARISON OF VOC EMITTERS
EMISSION RATES
0200400600800
100012001400
FLO
OR
ING
W/
PO
LYU
RE
TH
AN
EF
INIS
H
PR
ES
SE
D W
OO
DC
AB
INE
TS
PE
RM
AN
EN
TP
RE
SS
SH
IRT
S(N
EW
)
PE
RM
AN
EN
TP
RE
SS
SH
IRT
S(W
AS
HE
D)
FIB
ER
GLA
SS
INS
ULA
TIO
N
MIC
RO
GR
AM
S/S
Q M
/HR
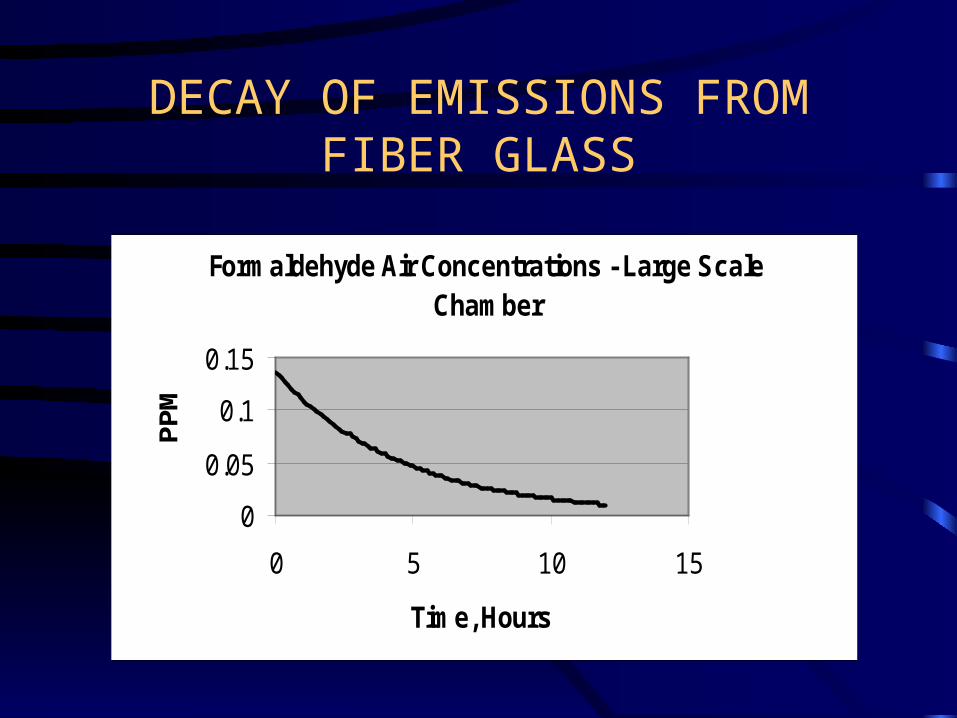
DECAY OF EMISSIONS FROM FIBER GLASS
Formaldehyde Air Concentrations - Large Scale Chamber
0
0.05
0.1
0.15
0 5 10 15
Time, Hours
PP
M
THE PRACTICALITY OF ZERO VOC EMISSION MATERIALS
• Many materials in the interior spaces of buildings emit VOC’s
• Each VOC has a normal partial pressure that is a function of RH and temperature– if there are multiple sources of a VOC each will
contribute until the partial pressure is reached– some materials that contain a VOC may actually act as a
sink in the presence of stronger sources– Zero emitting materials in the presence of high emitters
makes no sense
HOW CAN A SPECIFIER ADDRESS LOW VOC EMISSIONS?
• Follow the guidelines of the US Green Building Council– the LEED design system addresses low emitting sources
• There is a independent, recognized certification body that addresses all type of building materials and furnishings
• Greenguard is very much like Underwriters Laboratories– Greenguard is recognized by LEEDS for maximum points
SUMMARY
• Thermal benefits– radiant effects are not applicable for most ducts
• Acoustical benefits– tradeoffs to cellular non-fibrous materials carry a severe
acoustical penalty
• Minimal air quality issues in well designed systems– water is the issue, design to prevent it– filtration selection & maintenance will minimize any
need for cleaning
REFERENCE RESOURCES ON ALL ASPECTS OF INSULATION AND IEQ
• NORTH AMERICAN INSULATION MFR’S ASSOCIATION– www.naima.org
• Knauf Fiber Glass - www.knauffiberglass.com
– [email protected], – [email protected], 317-398-
4434, x8801
• ASHRAE Handbooks

![11/2013 Knauf Diamant una lastra, mille soluzioni.9634]Knauf Diamant...W11 pareti Knauf a orditura metallica 24 W118 Pareti di sicurezza Knauf 28 W61 Contropareti Knauf 30 Sistema](https://img.pdfslide.net/doc/110x75/60c9d1417ef9fe5f700db99a/112013-knauf-diamant-una-lastra-mille-9634knauf-diamant-w11-pareti-knauf-a.jpg)