Embed Size (px)
Citation preview
© 1998-2006 Rock Solid Images, all rights reserved
HYDRATE RESOURCE HYDRATE RESOURCE IDENTIFICATION AND IDENTIFICATION AND CHARACTERIZATION CHARACTERIZATION
FROM WELL LOGS FROM WELL LOGS AND SEISMICAND SEISMIC
Joel WallsJoel WallsJack Dvorkin*Jack Dvorkin*
Richard Uden**Richard Uden***RSI and Stanford University**Marathon Oil Co.
© 1998-2006 Rock Solid Images, all rights reserved
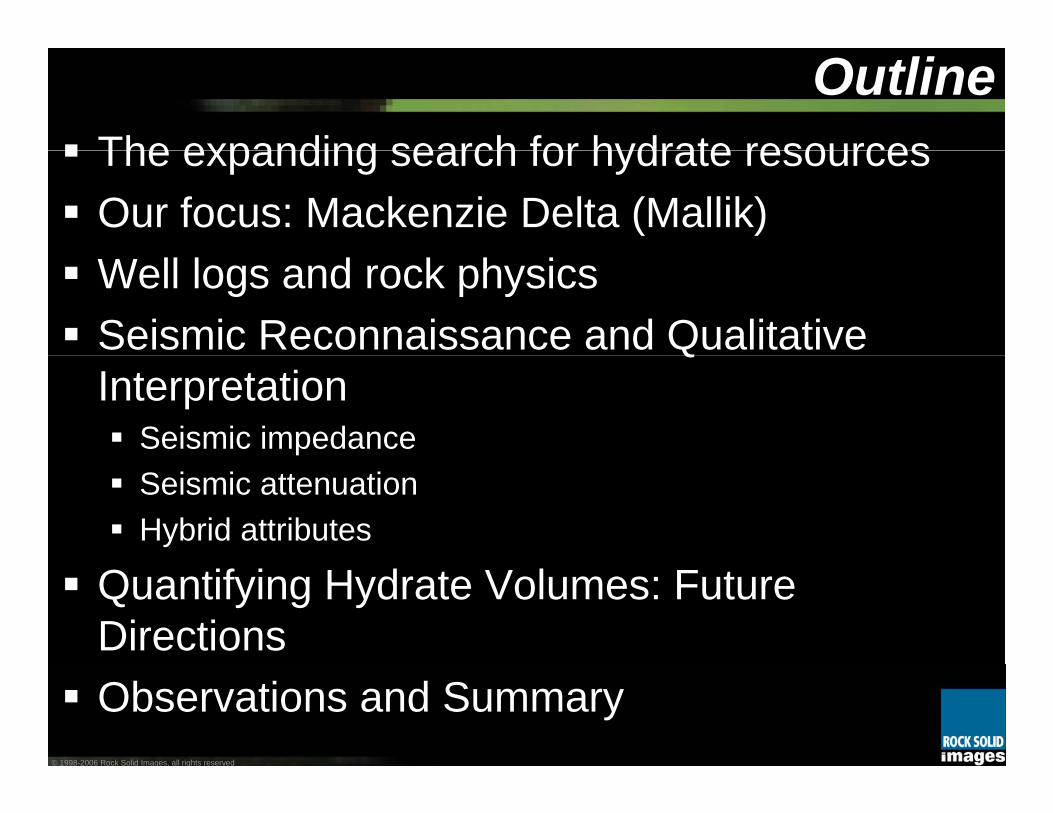
OutlineThe expanding search for hydrate resourcesOur focus: Mackenzie Delta (Mallik)Well logs and rock physicsSeismic Reconnaissance and Qualitative Interpretation
Seismic impedanceSeismic attenuationHybrid attributes
Quantifying Hydrate Volumes: Future DirectionsObservations and Summary

© 1998-2006 Rock Solid Images, all rights reserved
Nankai Trough
Sea Bottom
BSR
Expanding Search for Methane Hydrate
© 1998-2006 Rock Solid Images, all rights reserved
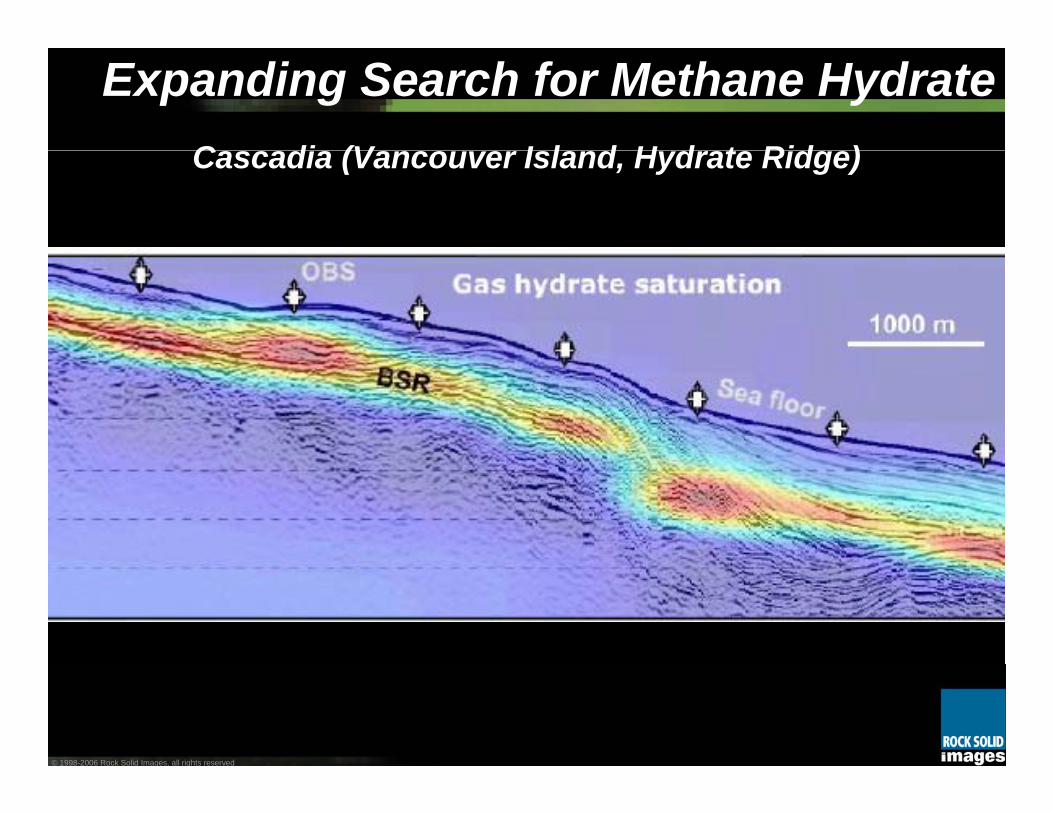
Cascadia (Vancouver Island, Hydrate Ridge)
Expanding Search for Methane Hydrate

© 1998-2006 Rock Solid Images, all rights reserved
Expanding Search for Methane Hydrate
Ecker, 2000
Outer Blake Ridge
© 1998-2006 Rock Solid Images, all rights reserved
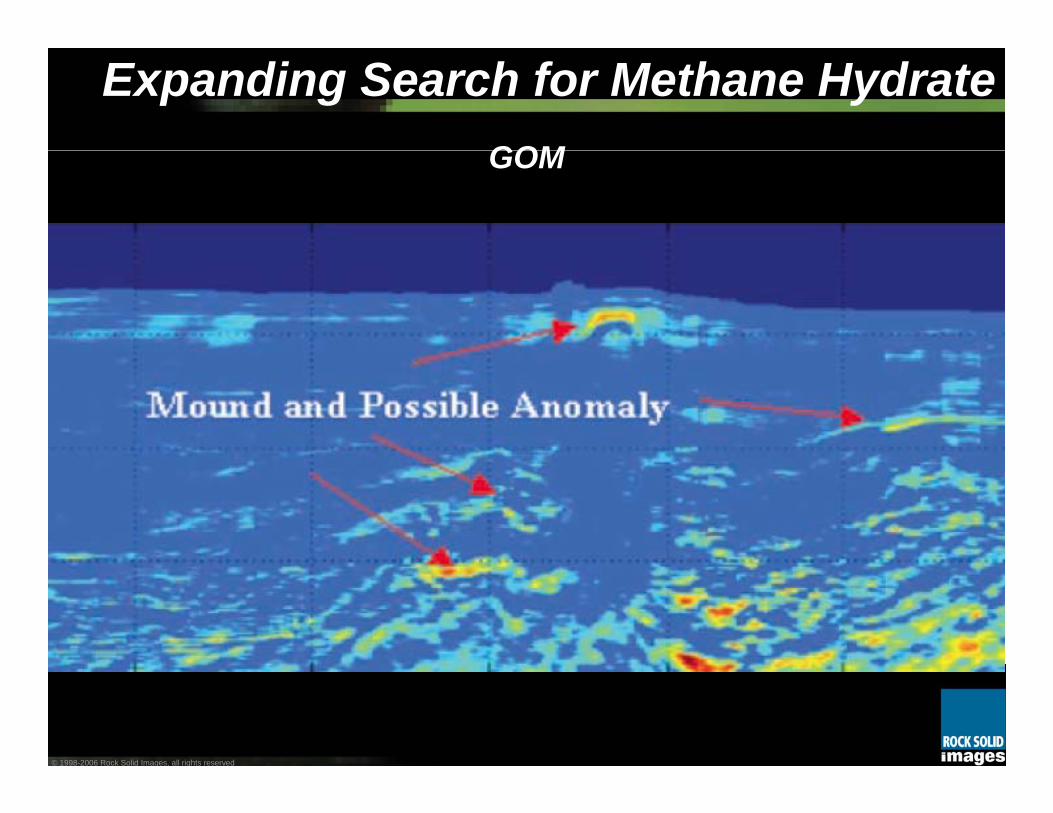
GOM
Expanding Search for Methane Hydrate
© 1998-2006 Rock Solid Images, all rights reserved
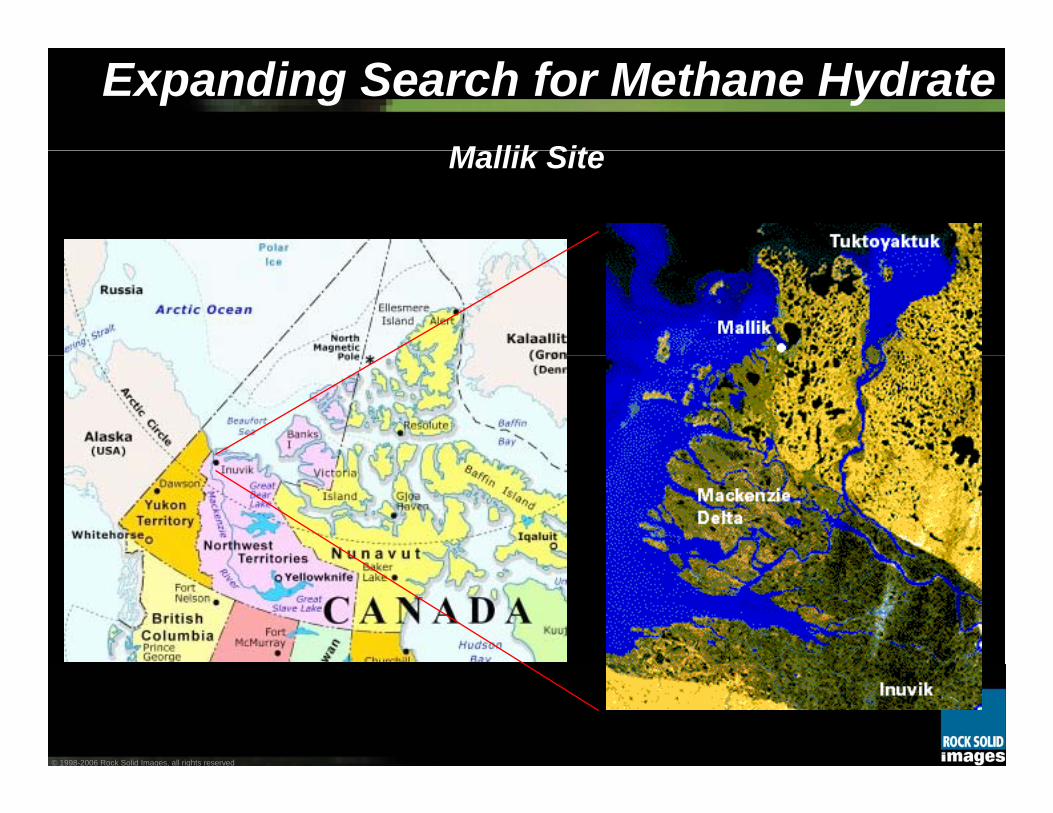
Mallik Site
Expanding Search for Methane Hydrate
© 1998-2006 Rock Solid Images, all rights reserved
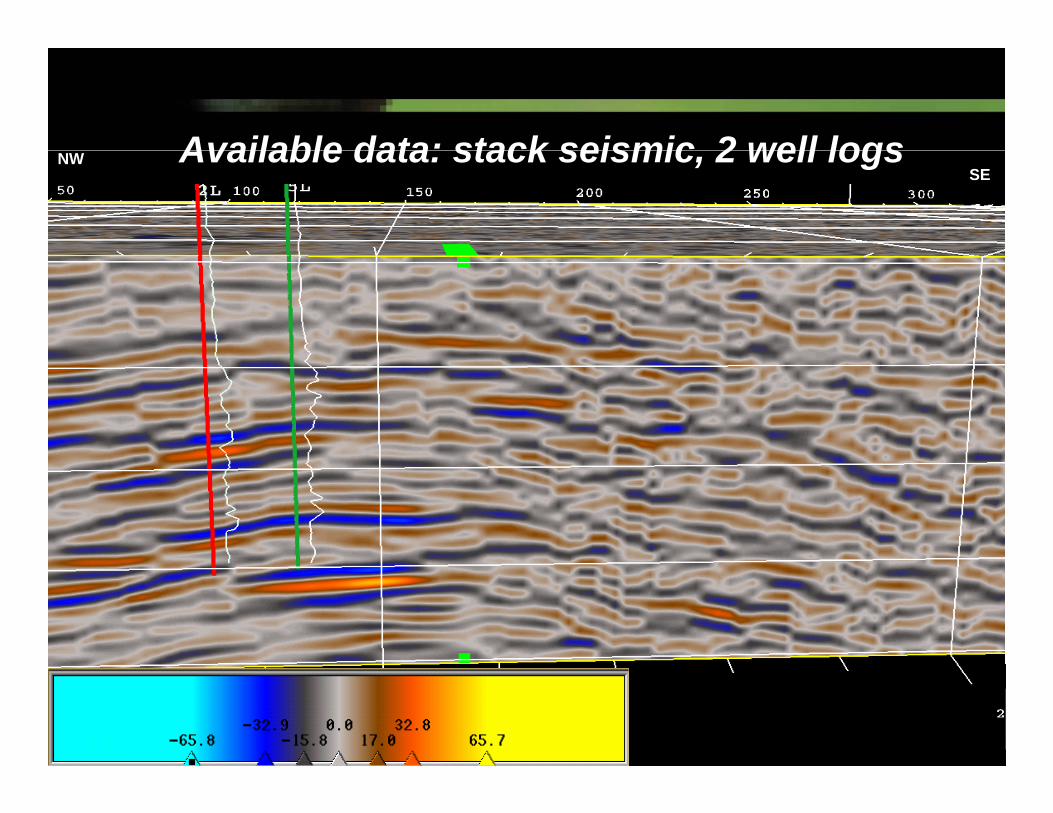
Available data: stack seismic, 2 well logs NWSE
© 1998-2006 Rock Solid Images, all rights reserved
Well Logs and Well Logs and Rock Physics Rock Physics
ModelingModeling
© 1998-2006 Rock Solid Images, all rights reserved
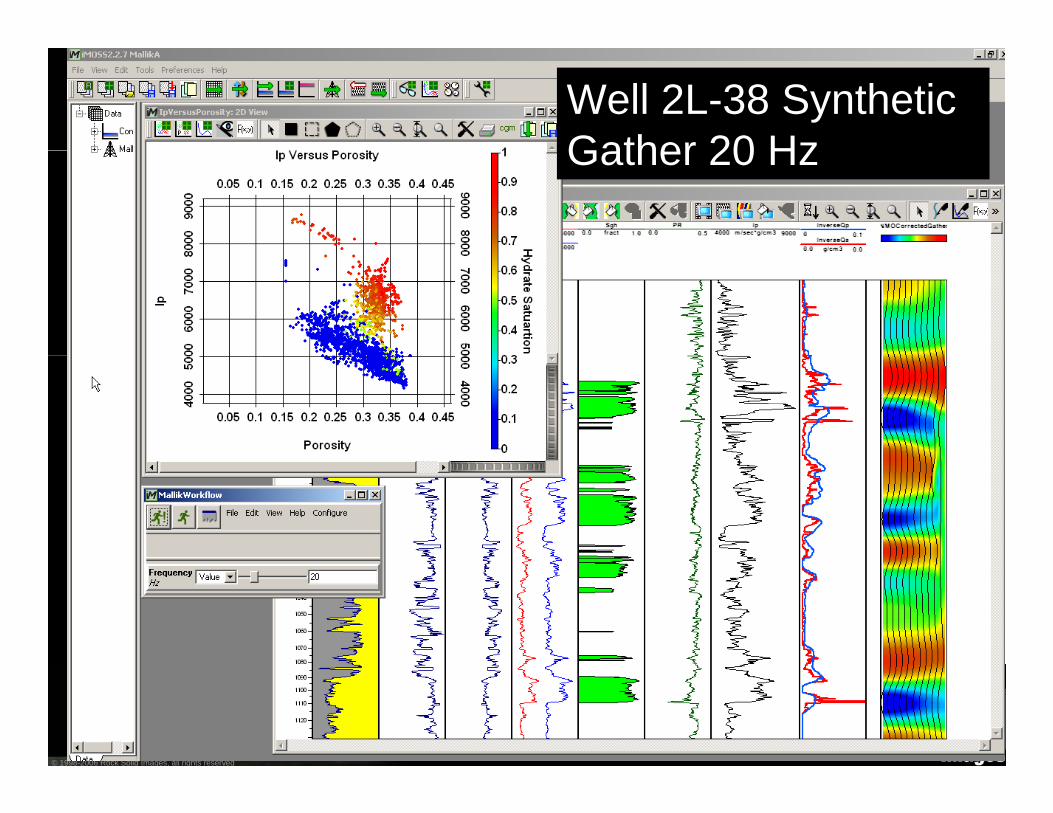
Well 2L-38 Synthetic Gather 20 Hz
© 1998-2006 Rock Solid Images, all rights reserved
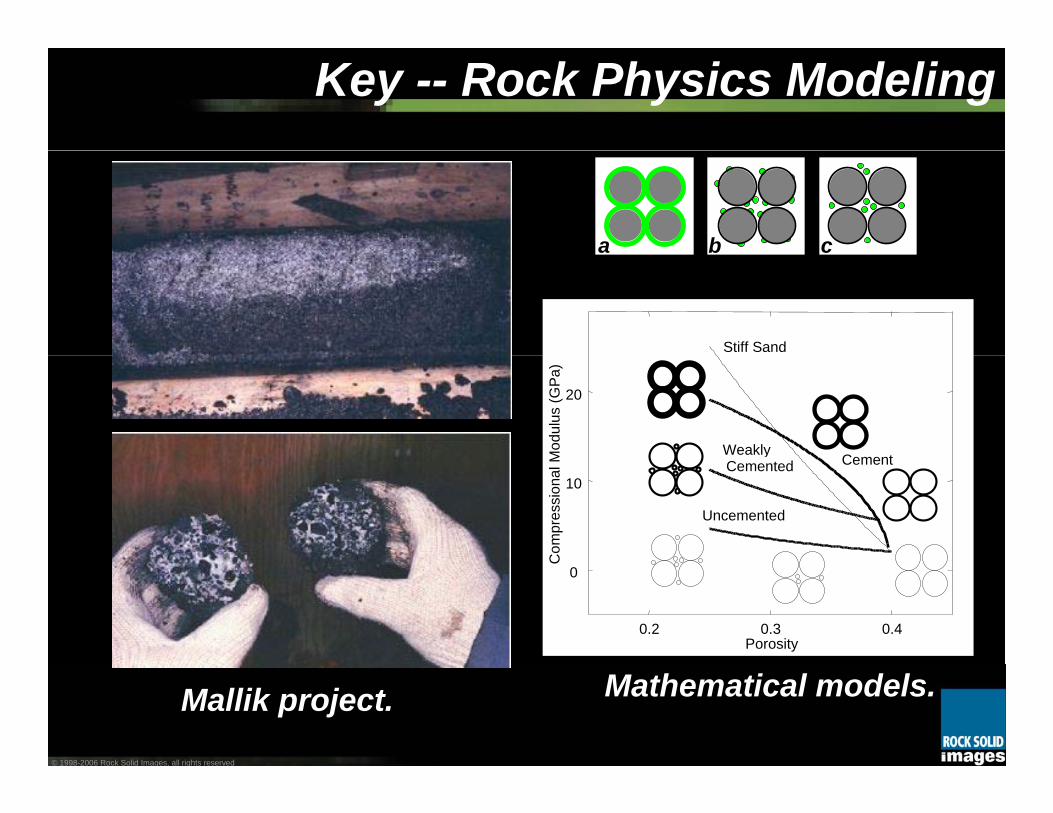
Mathematical models.Mallik project.
0
10
20
0.2 0.3 0.4
Com
pres
sion
al M
odul
us (G
Pa)
Porosity
Stiff Sand
CementWeaklyCemented
Uncemented
a b c
Key -- Rock Physics Modeling
© 1998-2006 Rock Solid Images, all rights reserved
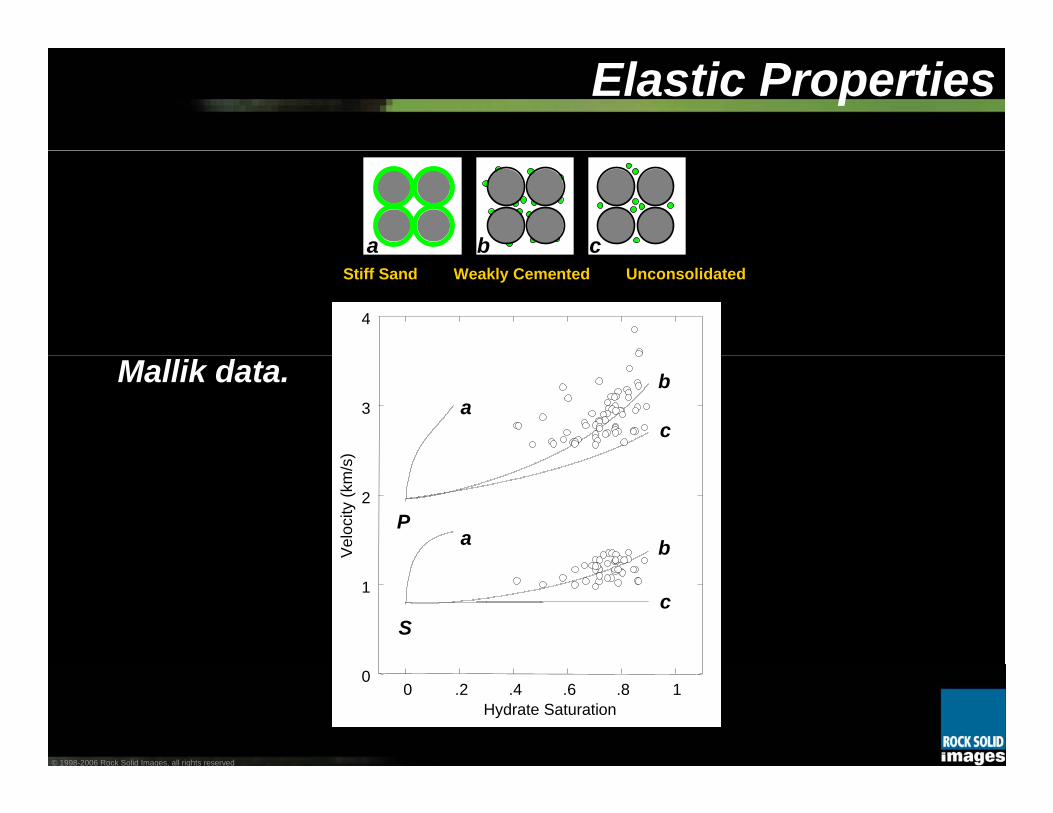
Mallik data.
Elastic Properties
a b c
0
1
2
3
4
0 .2 .4 .6 .8 1
Vel
ocity
(km
/s)
Hydrate Saturation
P
S
a
a
b
b
c
c
Stiff Sand Weakly Cemented Unconsolidated
© 1998-2006 Rock Solid Images, all rights reserved
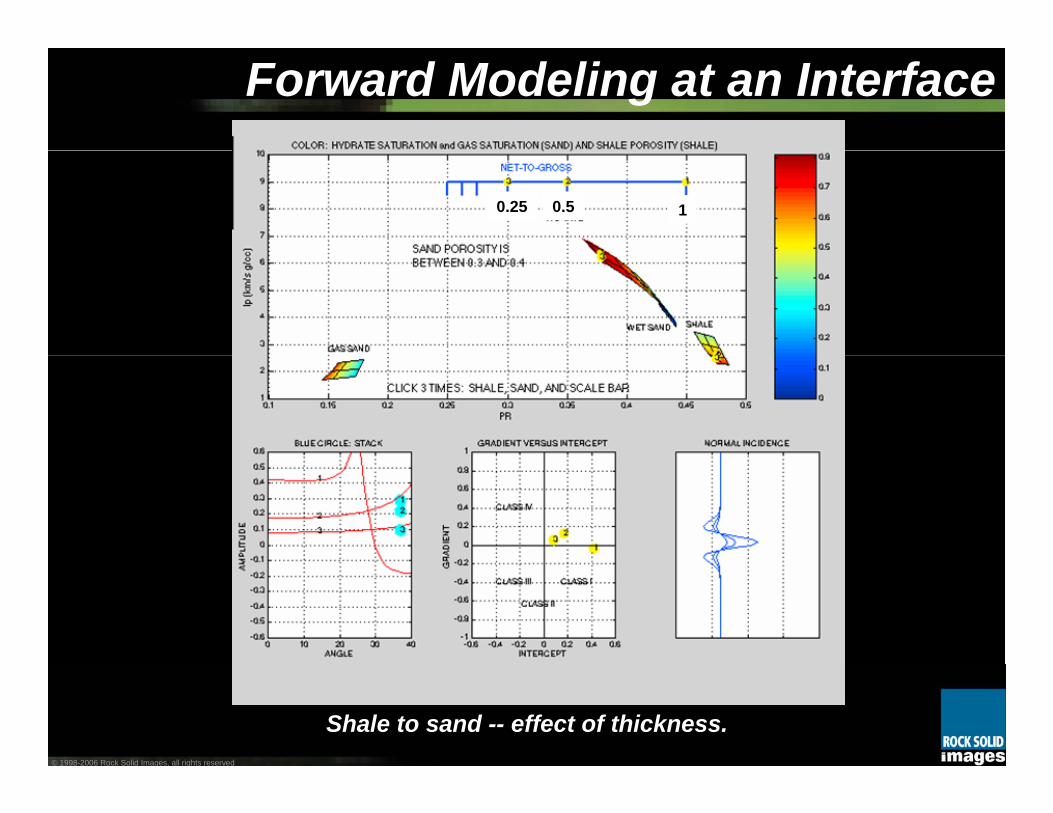
Shale to sand -- effect of thickness.
Forward Modeling at an Interface
10.50.25
© 1998-2006 Rock Solid Images, all rights reserved
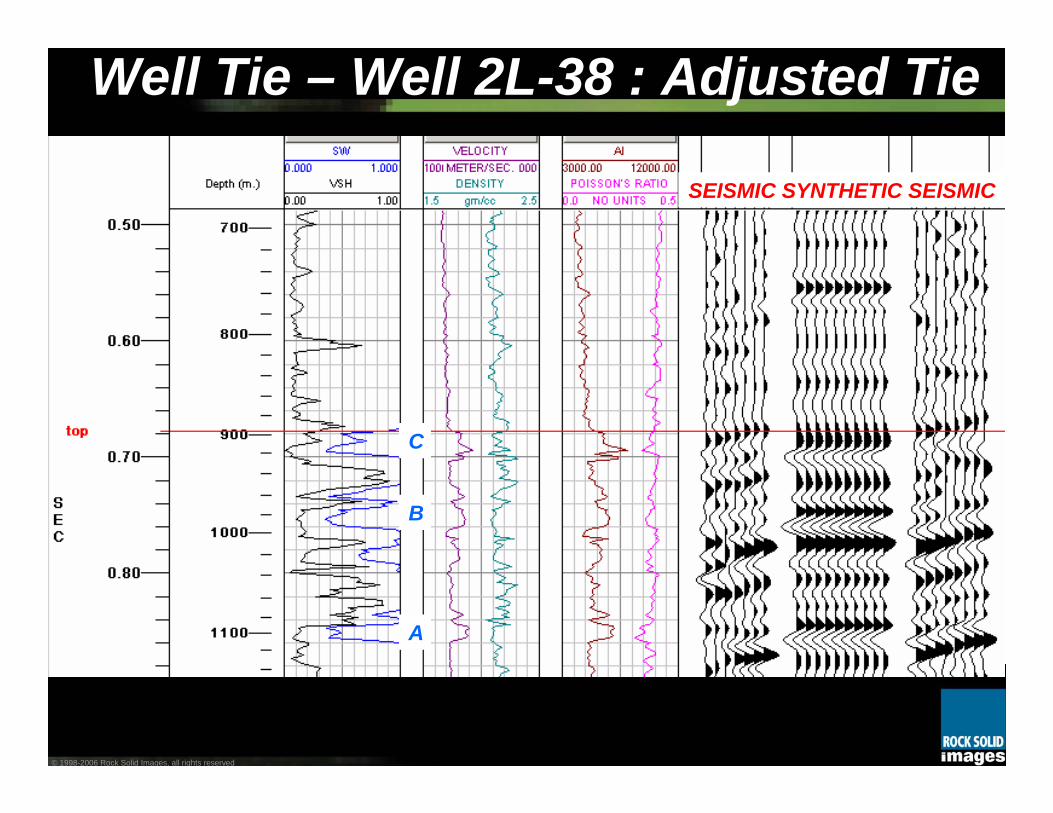
Well Tie – Well 2L-38 : Adjusted Tie
A
B
C
SEISMIC SYNTHETIC SEISMIC
© 1998-2006 Rock Solid Images, all rights reserved
Well Ties – Time AlignmentThe middle hydrate zone (B) for each well synthetic was time aligned.
The seismic response at the upper hydrate zone (C) does not match the synthetic response well in either well.
The seismic response at the base of the lower hydrate zone (A) shows a better match to the synthetic response.
Overall well tie not considered adequate for quantitative interpretation
No gathers available for seismic. Limits ability to differentiate free gas and hydrates.
Decision was made to apply qualitative methods using multiple seismic attributes.
© 1998-2006 Rock Solid Images, all rights reserved
Seismic Seismic Reconnaissance Reconnaissance and Qualitative and Qualitative InterpretationInterpretation
© 1998-2006 Rock Solid Images, all rights reserved
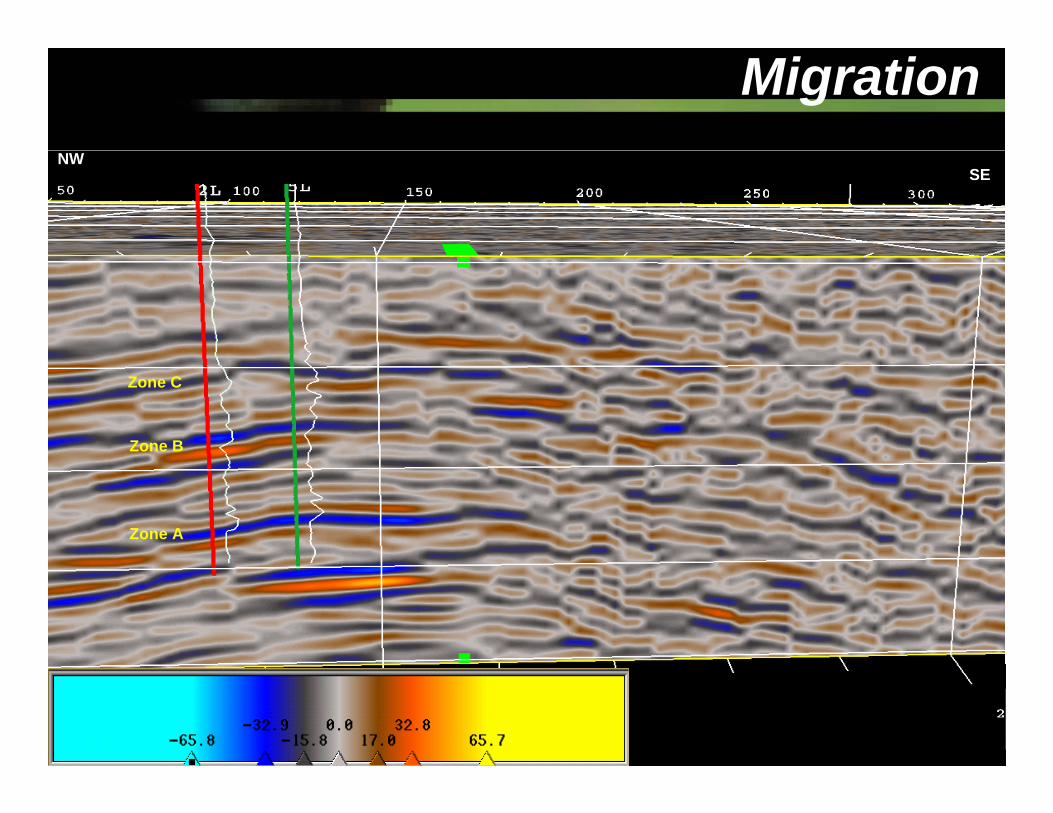
Migration
Zone A
Zone B
Zone C
NWSE
© 1998-2006 Rock Solid Images, all rights reserved
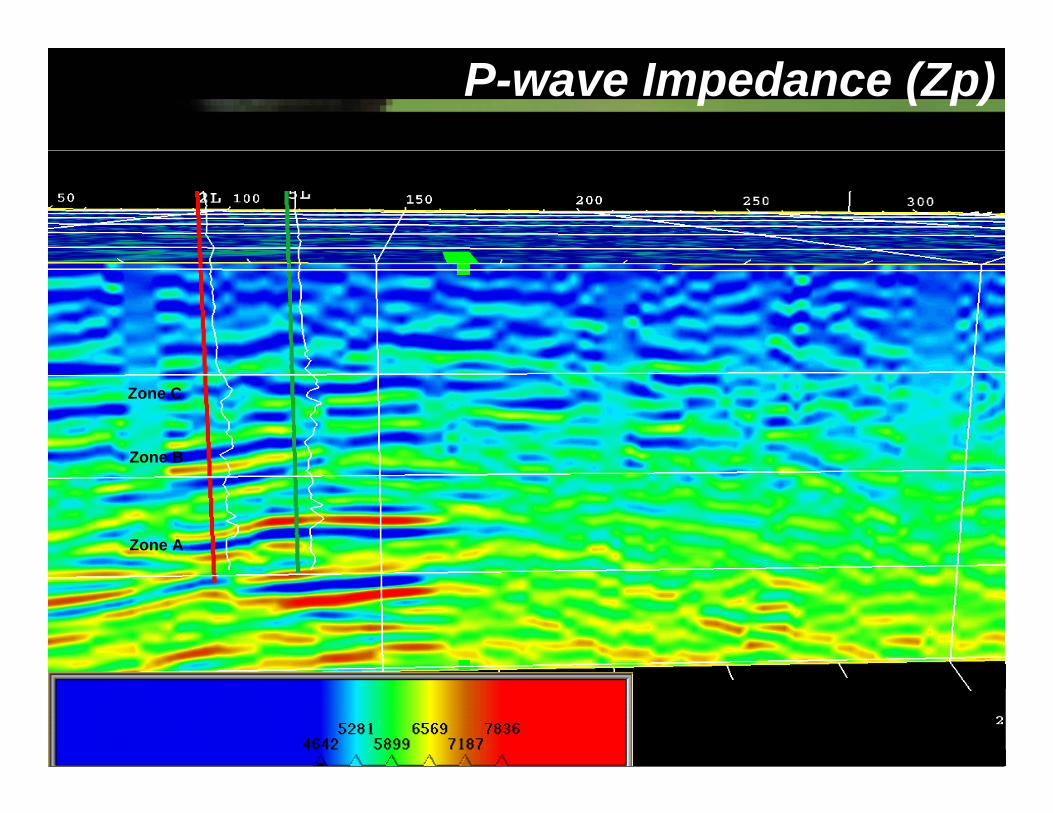
P-wave Impedance (Zp)
Zone A
Zone B
Zone C
© 1998-2006 Rock Solid Images, all rights reserved
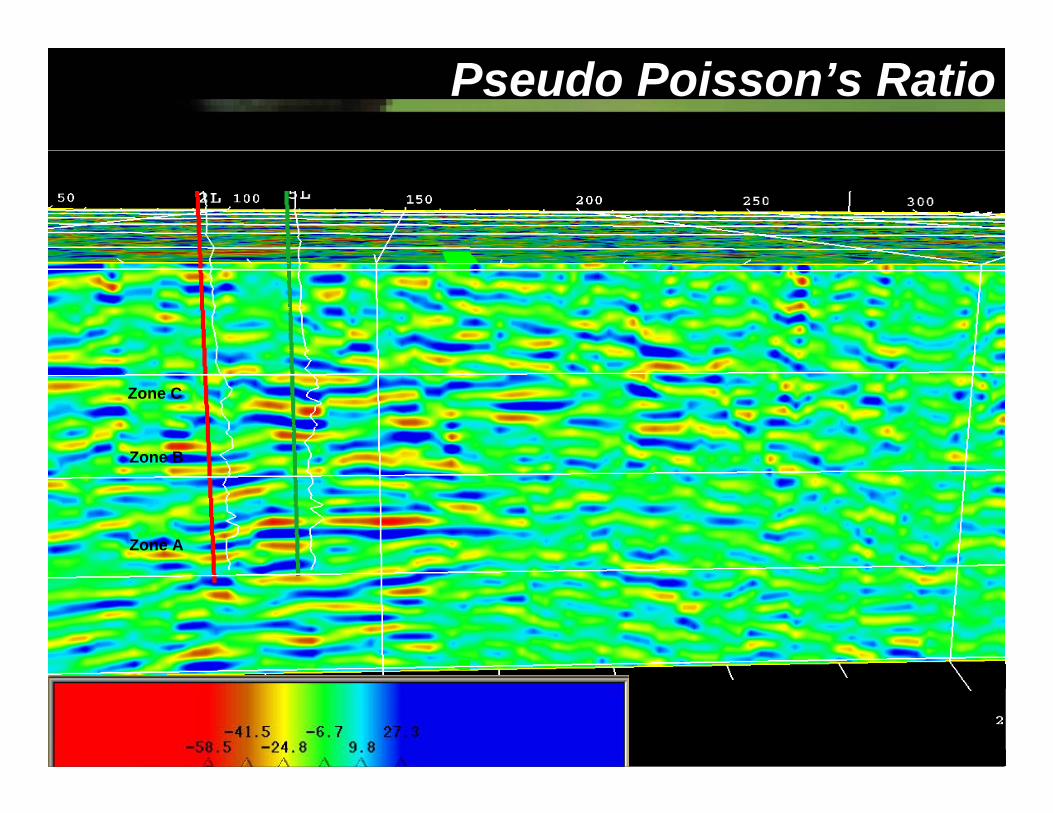
Pseudo Poisson’s Ratio
Zone A
Zone B
Zone C
© 1998-2006 Rock Solid Images, all rights reserved
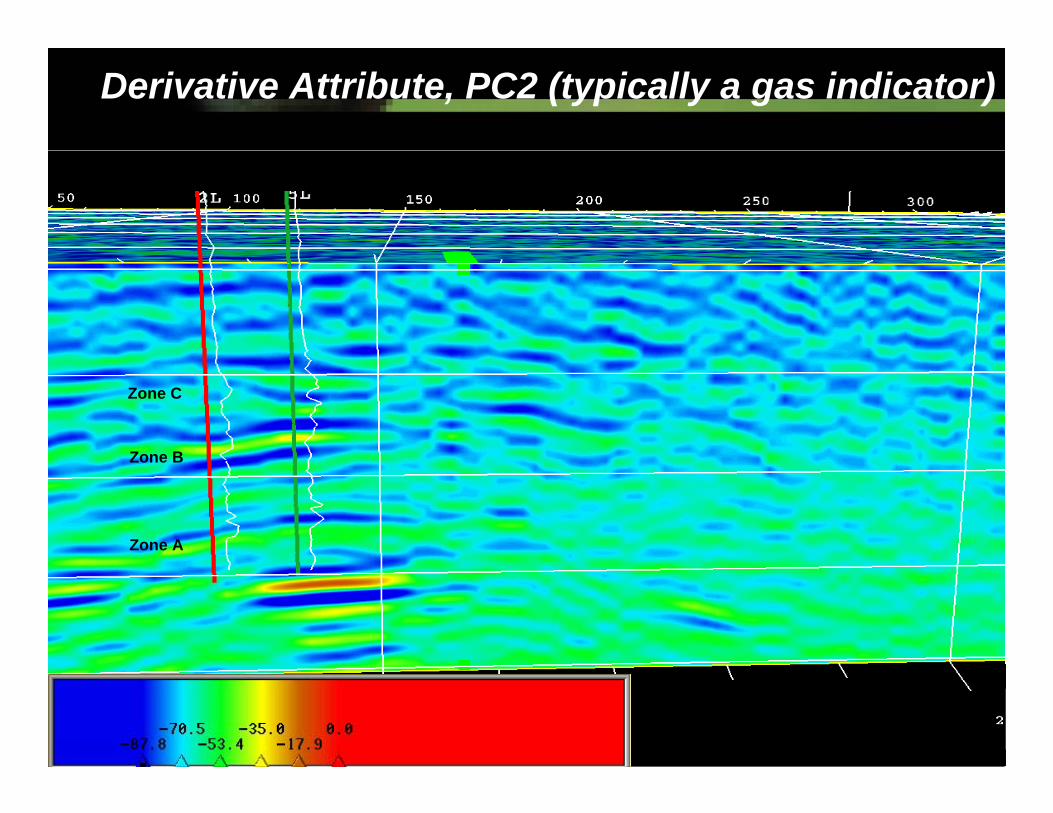
Derivative Attribute, PC2 (typically a gas indicator)
Zone A
Zone B
Zone C
© 1998-2006 Rock Solid Images, all rights reserved
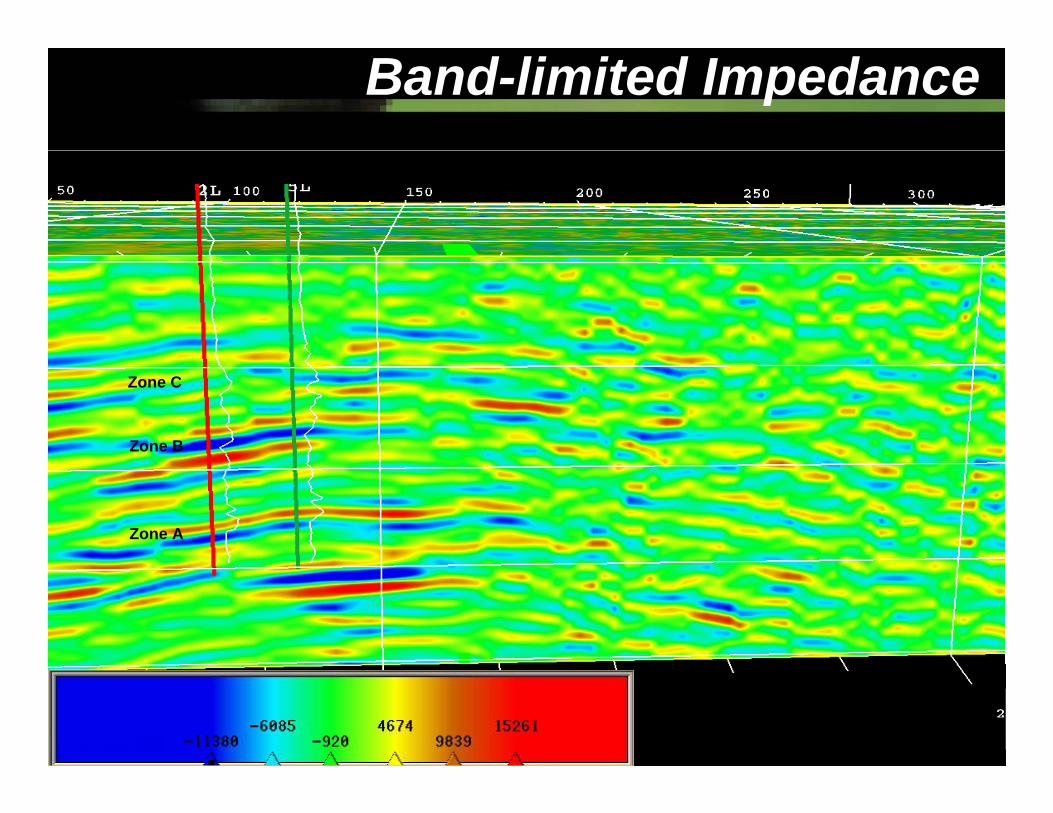
Band-limited Impedance
Zone A
Zone B
Zone C
© 1998-2006 Rock Solid Images, all rights reserved
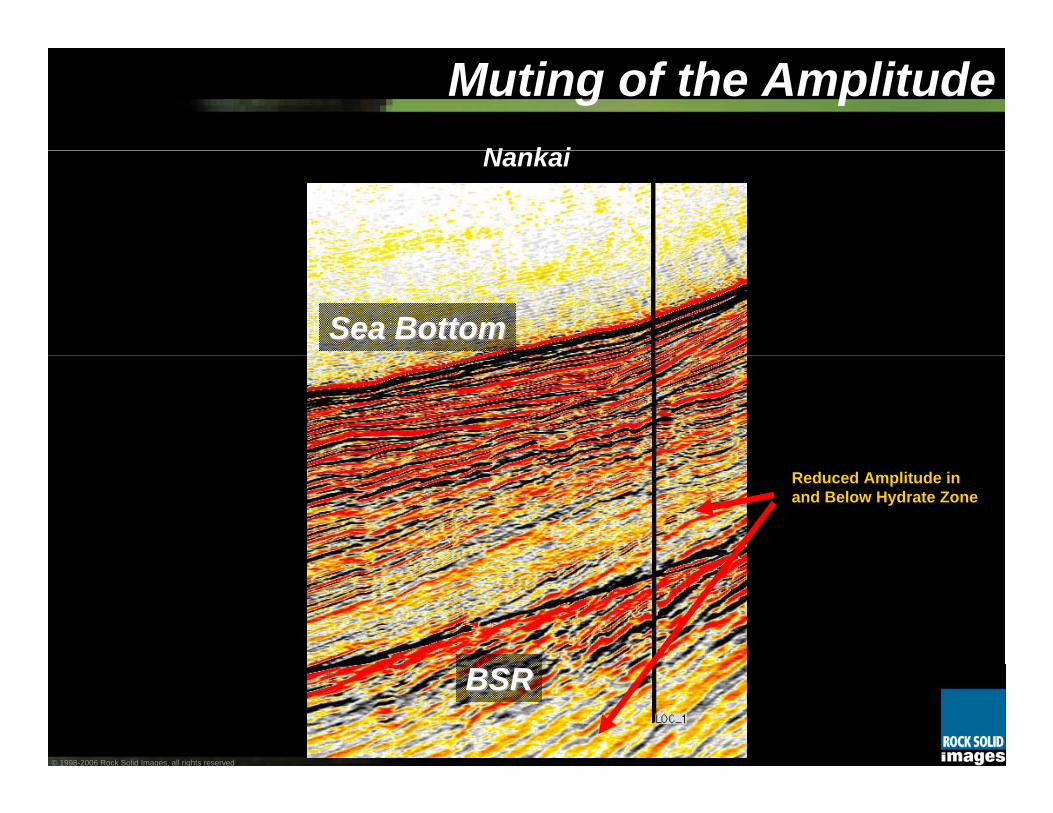
Nankai
Sea BottomSea Bottom
BSRBSR
Muting of the Amplitude
Reduced Amplitude in and Below Hydrate Zone
© 1998-2006 Rock Solid Images, all rights reserved
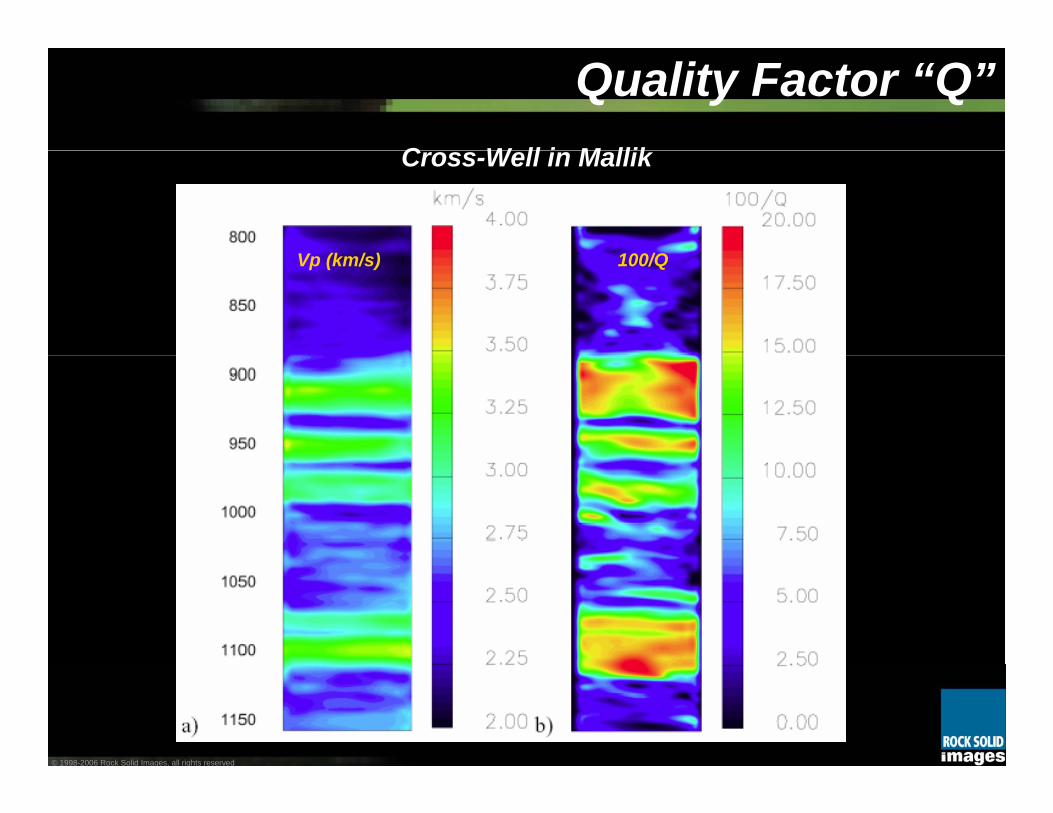
Cross-Well in Mallik
Vp (km/s) 100/Q
Quality Factor “Q”
© 1998-2006 Rock Solid Images, all rights reserved
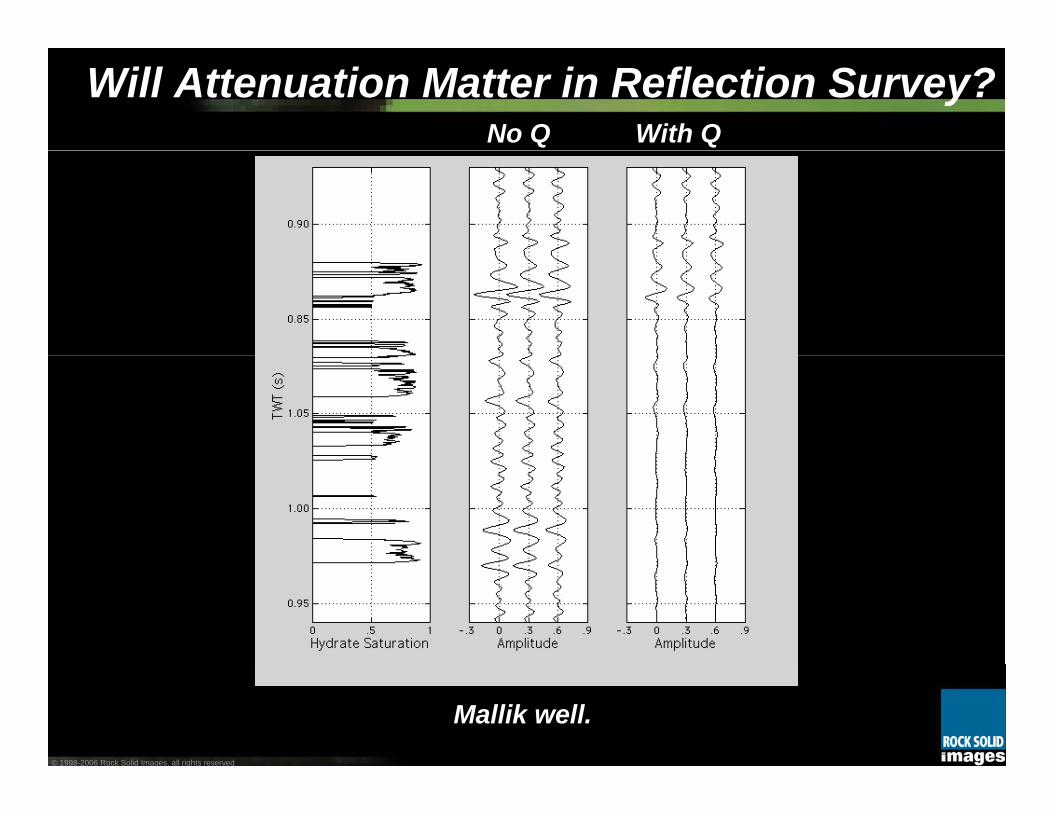
Mallik well.
No Q With QWill Attenuation Matter in Reflection Survey?
© 1998-2006 Rock Solid Images, all rights reserved
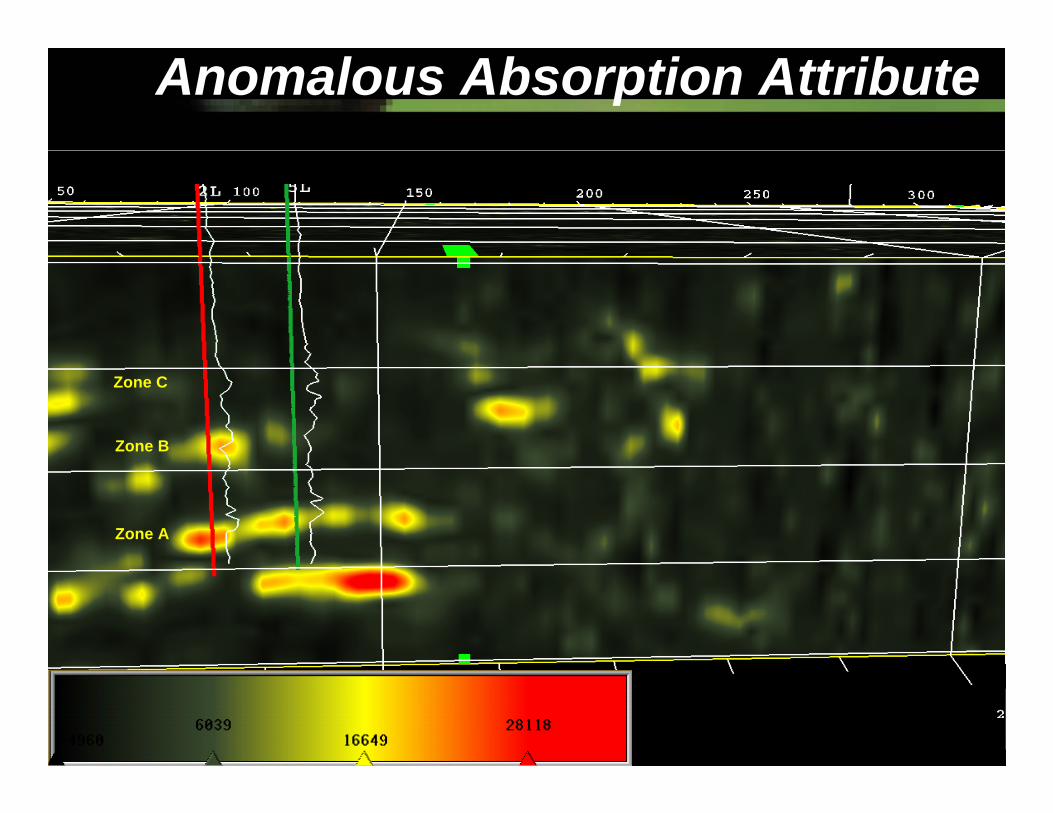
Anomalous Absorption Attribute
Zone A
Zone B
Zone C
© 1998-2006 Rock Solid Images, all rights reserved
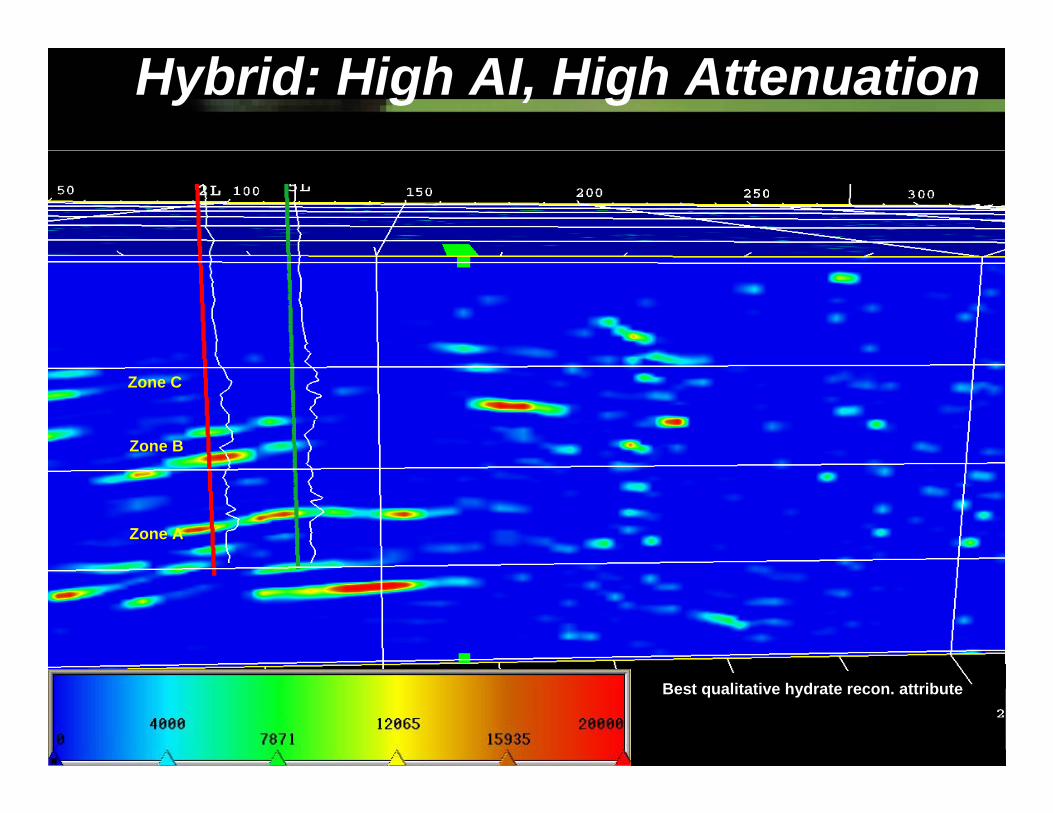
Hybrid: High AI, High Attenuation
Zone A
Zone B
Zone C
Best qualitative hydrate recon. attribute

© 1998-2006 Rock Solid Images, all rights reserved
Improving Improving Quantitative Quantitative
Interpretation; Interpretation; The FutureThe Future
© 1998-2006 Rock Solid Images, all rights reserved
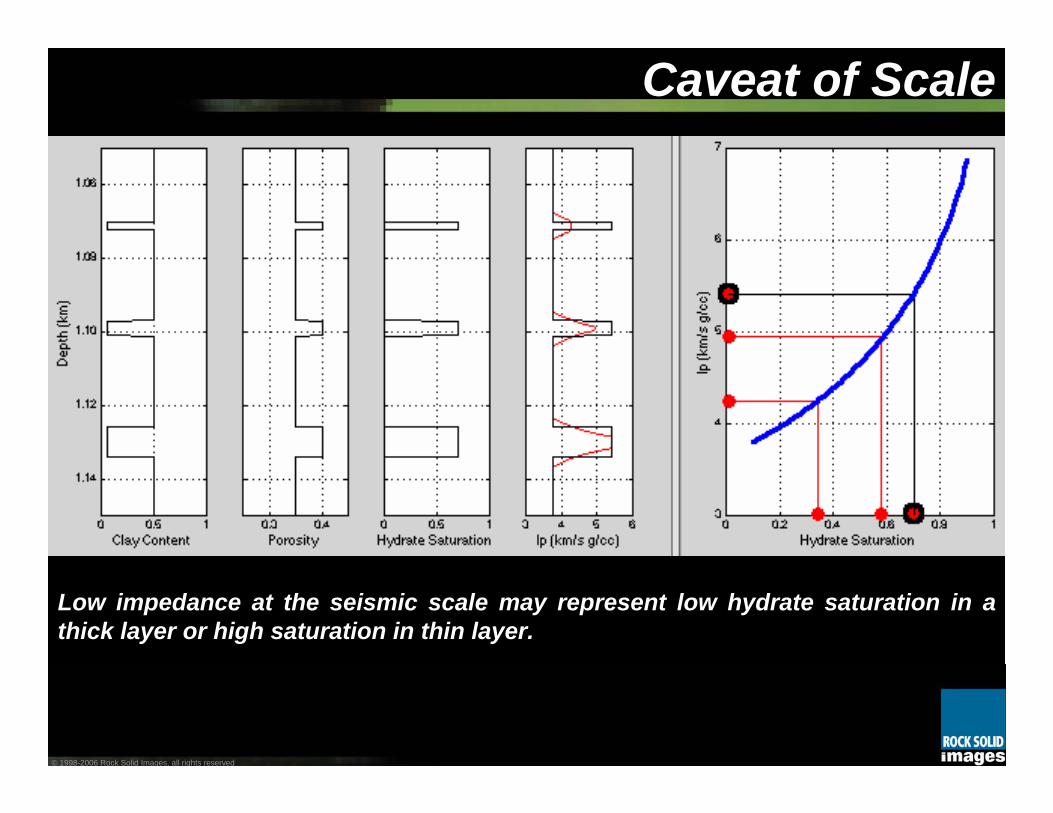
Low impedance at the seismic scale may represent low hydrate saturation in a thick layer or high saturation in thin layer.
Caveat of Scale
© 1998-2006 Rock Solid Images, all rights reserved
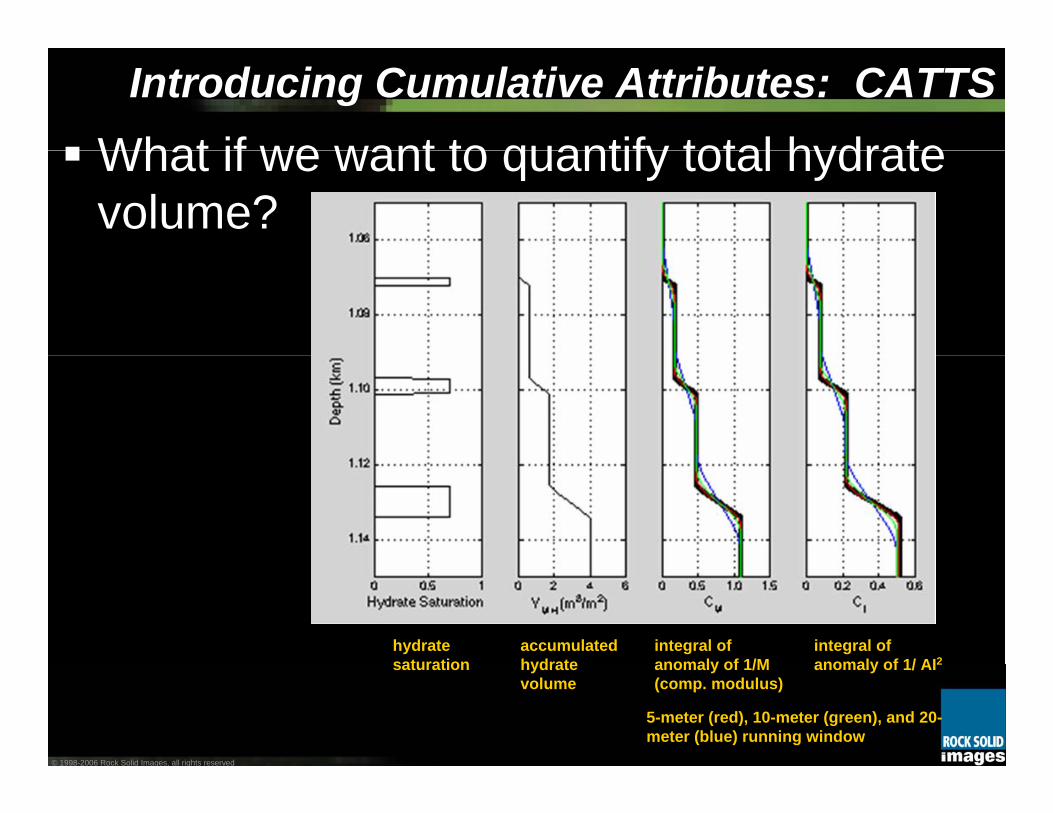
Introducing Cumulative Attributes: CATTS
What if we want to quantify total hydrate volume?
hydrate saturation
accumulated hydrate volume
integral of anomaly of 1/M(comp. modulus)
integral of anomaly of 1/ AI2
5-meter (red), 10-meter (green), and 20-meter (blue) running window
© 1998-2006 Rock Solid Images, all rights reserved
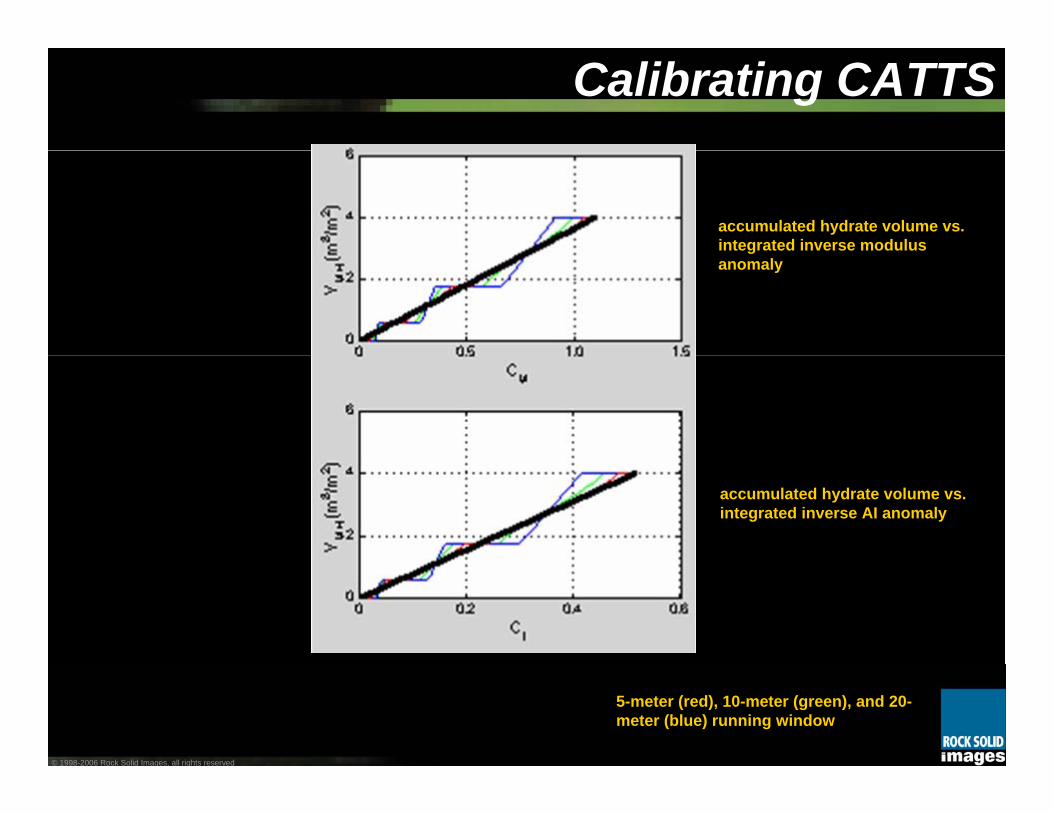
Calibrating CATTS
accumulated hydrate volume vs. integrated inverse modulus anomaly
accumulated hydrate volume vs. integrated inverse AI anomaly
5-meter (red), 10-meter (green), and 20-meter (blue) running window
© 1998-2006 Rock Solid Images, all rights reserved
New DOE Research ProjectTopic: Hydrate Characterization from Integrated Well and Seismic Data2 year, $1.2m project started Oct 1, 2006Develop and test CATTS approach plus use of other DHI’s such as impedance, AVO, and QCurrently seeking seismic and well log data sets from hydrate regionsSeismic data quality and significant hydrate accumulations are key factors in selecting best data set
© 1998-2006 Rock Solid Images, all rights reserved
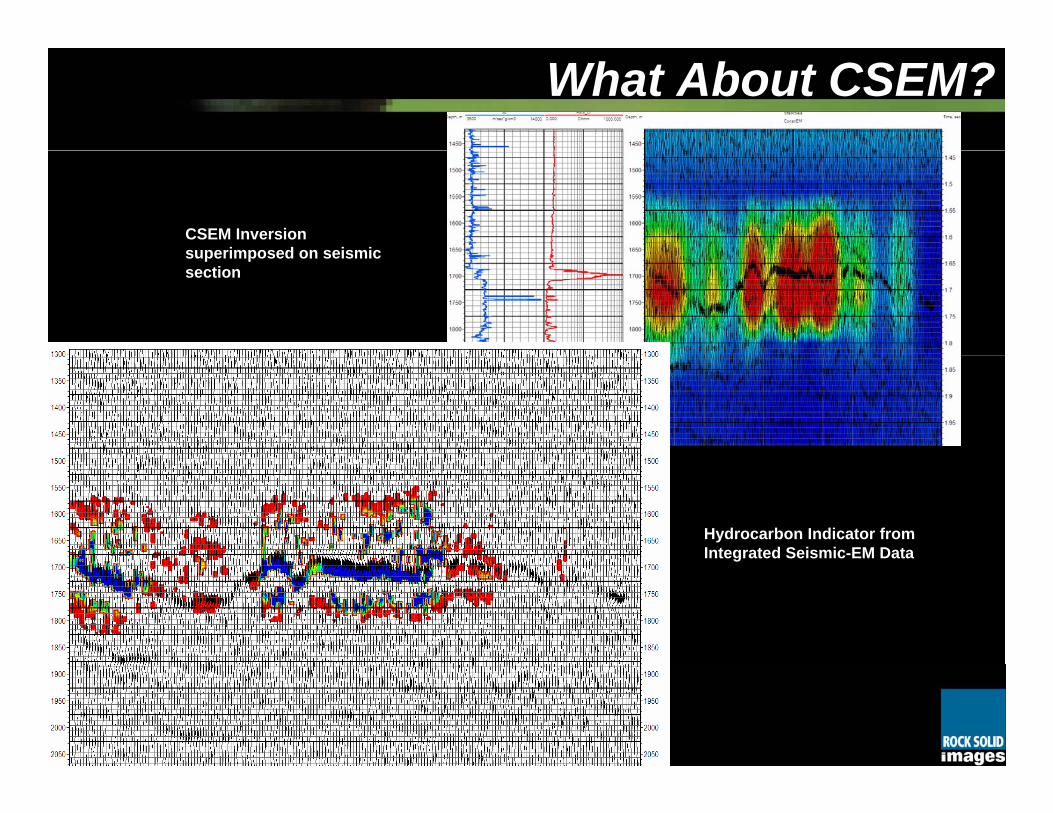
What About CSEM?
CSEM Inversion superimposed on seismic section
Hydrocarbon Indicator from Integrated Seismic-EM Data
© 1998-2006 Rock Solid Images, all rights reserved
Observations and SummaryExisting data sets teach us that
(a) the geometry of the reservoir and hydrate distribution in it affect the seismic response;(b) attenuation has to be taken into account during hydrate reservoir characterization; and, most importantly,(c) the competing effects of elastic contrast, geometry, and attenuation make seismic interpretation non-unique.
Q and Impedance combined are good recon. Tools for hydrates.Calibrating seismic to hydrate volume may be improved by assessing accumulated total hydrate volumes