Embed Size (px)
Citation preview

R E P O R T
Hydraulic Assessment of Bunnerong Canal under Inflows from Orica Groundwater Treatment Plant
Prepared for
Orica Australia Pty Ltd 16-20 Beauchamp Road Matraville NSW 2036
14 October 2004
39408-033


Contents
1 Introduction------------------------------------------------------------------------------------------------- 1-1
2 Hydraulic Assessment Approach ------------------------------------------------------------------- 2-1
2.1 Hydrologic Modelling 2-1 2.2 Hydraulic Modelling 2-2
2.2.1 Flooding Regime and Stormwater Conveyance 2-2 2.2.2 Impact Assessment 2-3 2.2.3 Dry Weather Flows 2-4 2.2.4 Tidal Flushing 2-5
3 Conclusions ------------------------------------------------------------------------------------------------ 3-1
4 References -------------------------------------------------------------------------------------------------- 4-1
5 Limitations -------------------------------------------------------------------------------------------------- 5-1
Tables
Table 2.1 Estimated Time of Concentration, tc (min) Table 2.2 Maximum of Estimated Peak Discharge (m3/s) in Bunnerong Canal Table 2.3 Modelled Flood Levels (mRL) – Pre-Development Table 2.4 Modelled Average Main Channel Velocities (m/s) – Pre-Development Table 2.5 Modelled Flood Levels (m Tidal Gauge Datum) – Pre-Development with
Sedimentation Table 2.6 Modelled Average Main Channel Velocities (m/s) – Pre-Development with
Sedimentation Table 2.7 Modelled Flood Levels (mRL) – Post-Development Table 2.8 Modelled Average Main Channel Velocities (m/s) – Post-Development Table 2.9 Modelled Flood Levels (mRL) – Post-Development with Sedimentation Table 2.10 Modelled Average Main Channel Velocities (m/s) – Post-Development with
Sedimentation Table 2.11 Modelled Water Level (mRL) and Average Main Channel Velocities (m/s) –
Dry Weather Conditions Table 2.12 Sediment Volumetric Flux (m3/s) Table 2.13 Tidal Prism Volume (m3)
Appendices
Appendix A Hydraulic Model Profiles Appendix B Construction Drawings of Bunnerong Canal
S:\PROJECTS\39408\033 GTP EIS\EIS\FINAL EIS\REV A\APPENDICES\APPENDIX I HYDRAULIC ASSESSMENT\R001B.DOC\10-NOV-04
i

SECTION 1 Introduction
1 Introduction
The operation of the proposed Groundwater Treatment Plant (GTP) project at the Botany Industrial Park (BIP) would result in a regular continuous discharge of 7.5 ML/day of treated groundwater, up to a maximum of 12 ML/day (the total capacity of the discharge line). The latter would only occur in the event that none of the process users on the BIP were reusing the treated groundwater.
This hydraulic assessment has been undertaken using that maximum potential discharge of 12 ML/day, equivalent to 0.14 m3/s. This discharge would be routed to Bunnerong Canal for discharge where it has the potential to affect the hydrologic regime of the canal.
The assessment was undertaken to determine whether the proposed additional discharge would affect any or all of:
• the ability of the canal to convey stormwater flow;
• the flooding regime of the canal;
• the likelihood of adding to the sediment transport potential of the canal flow during design flood flows and under dry weather conditions; and
• the potential impact on tidal flushing in the canal and in Brotherson Dock (the canal outlet).
The assessment methodology, results and conclusions are presented in the following sections.
It should be noted that Orica’s objective is to maximise the reuse of the treated groundwater and hence minimise discharges to Bunnerong Canal. At present, it is proposed that 7.5 ML/day would be reused, but Orica is committed to seeking other users to reuse more of it. The purpose of this assessment was to confirm that there would be no hydraulic impacts in the event of discharge to the Canal.
S:\PROJECTS\39408\033 GTP EIS\EIS\FINAL EIS\REV A\APPENDICES\APPENDIX I HYDRAULIC ASSESSMENT\R001B.DOC\10-NOV-04
1-1

SECTION 2 Hydraulic Assessment Approach
2 Hydraulic Assessment Approach
2.1 Hydrologic Modelling
There are no records of historical flood flows within Bunnerong Canal so it is not possible to calibrate or validate the models used. The lack of data therefore requires an application of experience to the results. It is important to note here that the “flood levels” quoted in this report are not validated and have not been subject to detailed assessments. They are used solely to establish any variations in flood level by the extra flow from the GTP.
The probabilistic rational method was employed to estimate design peak discharge. Design rainfall data was prepared from Australian Rainfall and Runoff using standard procedures (AR&R, 2001). The time of concentration for the catchment contributing to Bunnerong Canal for minor and major flood flows was estimated using the recommended empirical equation for eastern NSW (AR&R, 2001) and is presented in Table 2.1.
It is noted that minor flood flows were designated as those occurring with an ARI less than or equal to 5 years. The catchment area of minor flood flows is less than that of major flows because of the presence of urban stormwater of nominal 5 yr ARI design capacity. The catchment is largely urbanised (60%), therefore, the time of concentration of the impervious only fraction of the catchment was also determined, as is standard procedure.
Design peak discharge was calculated using the probabilistic rational method in accordance with standard procedures. A design run-off coefficient for the 10 yr ARI flood event for the area is reported in Australian Rainfall and Runoff as 0.85. The maximum of estimated peak discharge is reported in Table 2.2 with respect to standard ARI flood events according to the calculated durations presented in Table 2.1.
The probabilistic rational method has a tendency to overestimate flows; however, without historical comparative data, the results are considered viable and can form a basis for comparison of GTP inflow impacts.
To assess the impact of the proposed additional inflow on the flooding regime of Bunnerong Canal, the potential maximum discharge of 0.14 m3/s from the proposed GTP was added to the estimated design peak discharges presented in Table 2.2.
It is noted that the proposed additional flow represents an increase in discharge of 1.1% with respect to 1 yr ARI and 0.1% with respect to 100 yr ARI flood event.
From this, it can be inferred that the GTP inflow will have no significant impact on flood flows.
S:\PROJECTS\39408\033 GTP EIS\EIS\FINAL EIS\REV A\APPENDICES\APPENDIX I HYDRAULIC ASSESSMENT\R001B.DOC\10-NOV-04
2-1

SECTION 2 Hydraulic Assessment Approach
2.2 Hydraulic Modelling
2.2.1 Flooding Regime and Stormwater Conveyance
A simplified hydraulic representation of Bunnerong Canal was constructed using the HEC-RAS hydraulic model, V 3.1.1, US Corps of Engineers (May 2003).
Boundary conditions of the model were developed from the design peak discharges presented in Table 2.2 with the downstream tail water level set at 2.2 m representing Highest Astronomical Tide on Fort Denison Tidal Gauge Datum and 0.0 m representing Lowest Astronomical Tide. The mixed flow regime approach was also considered as the drop in bed elevation downstream of CH34.311 resulted in supercritical flow. As such, the upstream boundary condition was set at normal depth where it was assumed water surface profile was well developed and therefore could be approximated by channel bed slope. The drop in bed elevation induces an hydraulic jump downstream in the water surface profile and therefore the model domain was extended from CH-9.640 to CH-209.640 such that the downstream boundary condition was located sufficiently far from the area of interest so as to not affect validity of results. This is considered appropriate as the bed level downstream of CH34.111 does not change and the tidal boundary condition in Brotherson Dock can be considered infinitely large for flood modelling purposes.
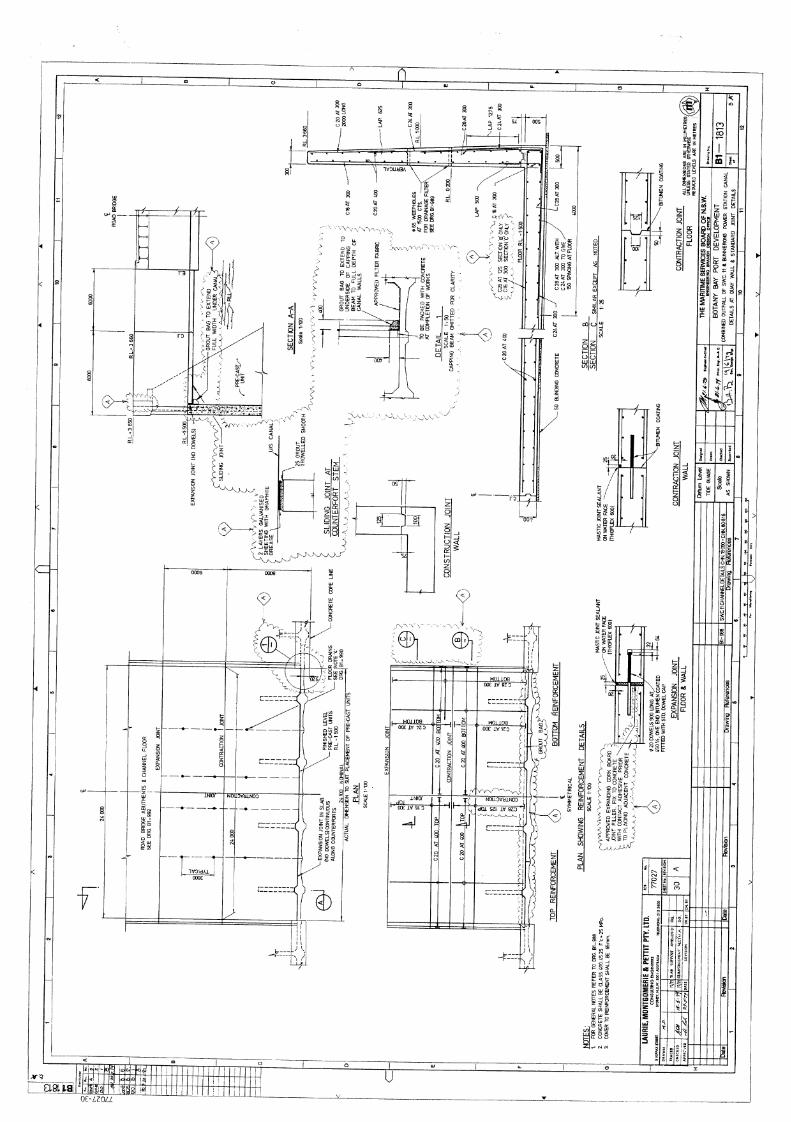
Model cross-sections were developed from the original engineering drawings associated with the construction of Bunnerong Canal. These drawings, obtained from Sydney Ports Corporation (SPC), are duplicated in Appendix B. It is noted that the height datum of the construction drawings was Fort Denison Tidal Gauge Datum and that zero on that datum is Lowest Astronomical Tide.
To simplify model development, it was assumed that the canal was constructed in accordance with design drawings given in Appendix B. As such, the design drawings were used as the basis of the canal cross-sections extending from immediately downstream of Bumborah Point Road at CH456.699 to immediately upstream of railway bridge at Brotherson Dock at CH-9.640. The curvature of Bunnerong Canal was not considered in the constructed hydraulic model. This simplification does not affect the assessment of any hydraulic impact on the flooding regime as it will be shown that flood flows are contained within the canal embankments.
Typical cross-section shape is a complex inverted trapezium with 1:40 slope from CH456.699 from centreline to approximately half canal width and then 1:25 to near vertical canal walls. The canal cross-section at CH26.390 and downstream is simple rectangular section with base of -1.5 mRL. Canal embankment height is noted as constant at 3.66 mRL along entire canal. Canal width varies from 26 m at CH456.699 to 16 m at CH355.702 and then expands to 20 m at the CH192.000 and remains at 20 m until CH34.311 where bed elevation drops to –1.5 mRL at outlet to Brotherson Dock. Canal bed slope is 0.1% between CH456.699 and CH34.311 and is 0.0% between CH26.390 and outlet at Brotherson Dock at CH-9.64. It is noted that it was assumed that the canal cross-section profile varied linearly between cross-sections described in design drawings given in Appendix B.
Surface roughness of concrete lining in the canal was represented by a Mannings’ n of 0.013.
S:\PROJECTS\39408\033 GTP EIS\EIS\FINAL EIS\REV A\APPENDICES\APPENDIX I HYDRAULIC ASSESSMENT\R001B.DOC\10-NOV-04
2-2

SECTION 2 Hydraulic Assessment Approach
It is noted that HEC-RAS does not consider momentum with respect to tail water boundary condition and instead constrains the numerical solution to normal flow at the location of tail water boundary, in this case CH-209.640. Modelled average main channel velocities were therefore not reported at CH-209.640 as the modelling approach adopted would generate non-physical results. It is further noted that reported flood levels were calculated from the modelled hydraulic grade line and therefore should not be interpreted as an accurate representation of actual flood levels. This approach is, however, suitable for the purpose of hydraulic impact assessment.
Table 2.3 presents modelled flood levels along Bunnerong Canal with respect to Tidal Gauge Datum. Modelled average main channel velocities along Bunnerong Canal are presented in Table 2.4.
A recent sediment sampling program was undertaken by Hyder Consulting Pty Ltd for Sydney Ports Corporation (Hyder Consulting Pty Ltd, 2004). They found sediment depth ranged between 1.1 m at Brotherson Dock to 0.7 m at CH 355.702 to 1.0 m downstream of Bumborah Point Road at CH456.699. Mean sediment depth was estimated to be 0.92 m. Reported particle size analysis indicated deposited sediment was mostly coarse sand. An appropriate porosity for coarse sand is 25%, therefore bed level geometry in the model was raised by 0.69 m to reflect hydraulic impact of sedimentation. Volume of sediment considered in canal was therefore approximately 466.4 m (canal length) * 20 m (average canal width) * 0.92 m (average sediment depth) = 8582 m3.
Distribution of sediment depth suggests sedimentation is a result of normal urban catchment processes rather than directly related to tidal flushing. If tidal processes were dominant then it would be expected that sediment depth would vary predictably from canal outlet at Brotherson Dock, akin to slope of beach face.
Table 2.5 presents modelled flood level along Bunnerong Canal with respect to Tidal Gauge Datum incorporating current sediment distribution. Table 2.6 presents modelled average main channel velocities along Bunnerong Canal incorporating current sediment distribution.
Based on these results, Flood Height is likely to be more sensitive to sedimentation whilst Flood Velocity (with respect to sediment transport potential) is likely to be insensitive to sedimentation.
2.2.2 Impact Assessment
To consider any impact of the proposed discharge from the GTP on the flooding regime and canal conveyance, upstream boundary conditions in the hydraulic model were adjusted to reflect the estimated design peak discharges presented in Table 2.2 plus the maximum potential inflow of 0.14 m3/s.
Table 2.7 presents modelled flood levels (mRL) along Bunnerong Canal with the GTP inflow assuming no sedimentation and Highest Astronomical Tide and Lowest Astronomical Tide downstream boundary conditions with modelled average main channel velocities presented in Table 2.8.
Table 2.9 presents modelled flood levels (mRL) along Bunnerong Canal with the GTP inflow incorporating current distribution of sediment and Highest Astronomical Tide and Lowest Astronomical Tide downstream boundary conditions with modelled average main channel velocities presented in Table 2.10.
S:\PROJECTS\39408\033 GTP EIS\EIS\FINAL EIS\REV A\APPENDICES\APPENDIX I HYDRAULIC ASSESSMENT\R001B.DOC\10-NOV-04
2-3

SECTION 2 Hydraulic Assessment Approach
The results indicate that the maximum difference in modelled flood level along Bunnerong Canal associated with the proposed GTP additional inflow is less than 0.01 m whilst the maximum difference in modelled average main channel velocity is less than 0.05 m/s.
It is noted that the modelled flood level is confined within the canal embankments and therefore the proposed development should not contribute to an increase in frequency of over bank flooding.
The results indicate that the proposed discharge from the GTP will not have a significant effect on the flooding regime or stormwater conveyance.
Results also indicate that changes in modelled average main channel velocities are less than 0.05 m/s and that this would not have significant effect on sediment transport potential during the flood events investigated.
2.2.3 Dry Weather Flows
To assess the impact of the proposed additional inflow on sediment transport potential in Bunnerong Canal during normal dry weather conditions, boundary conditions for the hydraulic model were developed from estimated maximum potential discharge of 0.14 m3/s with the downstream tail water level at Highest Astronomical Tide at 2.2 mRL, and Lowest Astronomical Tide at 0.0 mRL.
Model geometry assuming no sedimentation in canal was selected as the model scenario as the model with sedimentation and without sedimentation have the same channel bed slope and therefore would give the same result with respect to distribution of velocity along canal.
Table 2.11 presents modelled water levels (mRL) and average main channel velocities (m/s) along Bunnerong Canal during hypothetical dry weather conditions assuming no sedimentation in canal.
The results indicate that the modelled main channel velocities resulting from the proposed additional inflow during assumed normal dry weather conditions range between 0.37 m/s at CH456.699 and 0.00 m/s at CH-9.640.
These results show that the modelled main channel velocities are less than the erosion criterion from the Hjulstrom Plot for fine sand at 0.6 m/s. Fine sand was defined as having a particle size between 0.063 mm and 0.125 mm.
The estimated maximum sediment volumetric flux was calculated for average dry weather flow conditions as well as with respect to 1 yr ARI flood event, for comparison. It was assumed that frequently occurring stormwater, such as the 1yr ARI flood event, may typically have suspended sediment concentration of 100 mg/L. Sediment flux calculations are presented in Table 2.12.
S:\PROJECTS\39408\033 GTP EIS\EIS\FINAL EIS\REV A\APPENDICES\APPENDIX I HYDRAULIC ASSESSMENT\R001B.DOC\10-NOV-04
2-4

SECTION 2 Hydraulic Assessment Approach
Results indicate that sediment volumetric flux of 25.2 m3/yr associated with proposed development represents 1.3% of 1 yr ARI stormwater sediment volumetric flux of 1841 m3/yr and is therefore insignificant. The impact of proposed development on volumetric sediment flux associated with dry weather conditions and normal tidal flushing in the Bunnerong Canal is considered in Section 2.2.4.
2.2.4 Tidal Flushing
The proposed additional influx associated with the GTP was also considered with respect to impact on tidal flushing in Bunnerong Canal and, by inference, Brotherson Dock.
The maximum proposed additional inflow will be continuous at 12 ML/day at maximum, therefore the relative volumetric proportion of the GTP inflow can be assessed with respect to the calculated tidal prism at Highest Astronomical Tide and Lowest Astronomical Tide. Water surface profiles associated with these simulations are presented in Appendix A. The presence of deposited sediment in the Bunnerong Canal acts to reduce the size of tidal prism and therefore was also considered. The estimated tidal prism volume at Highest Astronomical Tide and Lowest Astronomical Tide is presented in Table 2.13 for No Sedimentation and Sedimentation scenarios.
From Table 2.13, proposed additional inflow of 0.14 m3/s represents an additional volume of between 0 m3 (less than model resolution of 0.1 m3) and 90.1 m3 with respect to the Without Sedimentation model scenario. This represents volumetric proportion ranging from minimum of 0% at Lowest Astronomical Tide to maximum of 6.2% at Highest Astronomical Tide. The proposed additional inflow of 0.14 m3/s represents an additional inflow volume of between 0 m3 (less than model resolution of 0.1 m3) and 165.5 m3 with respect to With Sedimentation model scenario. This represents volumetric proportion ranging from minimum of 0% at Lowest Astronomical Tide to maximum of 26.1% at Highest Astronomical Tide.
Results indicate that the proposed inflow may constitute a significant component of the tidal prism volume at Lowest Astronomical Tide in the scenario considering present distribution of sedimentation, however, from Table 2-9, averaged main channel velocity downstream of CH34.311 are less than 0.04 m/s and impact on water levels are less than 0.01 m. This implies that the impact of proposed inflow on tidal patterns in Bunnerong Canal is negligible as the overall volume of the receiving water is significantly greater than the inflow.
The maximum suspended sediment concentration in the discharge is 15 mg/L from Table 2.12, a negligible amount when compared to the likely suspended sediment concentration of the incoming and outgoing tide. Given that the highest relative volumetric proportion of proposed inflow is at its maximum at the Lowest Astronomical Tide, which has a duration of only 10 to 15 minutes, the impact on water quality, in terms of additional volumetric sediment flux, should not result in an increase in sedimentation in Brotherson Dock.
The impact of the proposed development on tidal flushing with respect to interaction of saline tidal water and fresh water effluent was not considered in this component of impact assessment, however, is not considered important because the primary purpose of the canal is as stormwater conveyance and the relative steady state volumetric magnitude of the1 yr ARI peak flow for Lowest Astronomical Tide condition is 7 times that of the tidal prism volume in the canal.
S:\PROJECTS\39408\033 GTP EIS\EIS\FINAL EIS\REV A\APPENDICES\APPENDIX I HYDRAULIC ASSESSMENT\R001B.DOC\10-NOV-04
2-5

SECTION 3 Conclusions
3 Conclusions
The estimated design peak discharge in Bunnerong Canal ranges between 104 m3/s for the 100 yr ARI flood event and 13.3 m3/s for the 1 yr ARI. Proposed GTP inflow to Bunnerong Canal is 0.14 m3/s at maximum and represents 0.1% to 1.1% of estimated design peak discharge with respect to 100 yr ARI and 1 yr ARI flood events. It was found that proposed additional inflow resulted in increases of less than 0.01 m change in modelled flood levels in Bunnerong Canal and less than 0.01 m/s change in modelled average main channel velocities. The modelled increase in flood level in Bunnerong Canal did not lead to overtopping of canal during standard design ARI flood events.
The modelled increase in main channel velocity is less than 0.01 m/s and therefore should not lead to an increased sediment transport potential within Bunnerong Canal during flooding.
Modelled average main channel velocities during normal dry weather flow were found to range between 0.00 m/s and 0.37 m/s and these velocities are less than the estimated erosion criterion for fine sand of 0.6 m/s. The modelled average main channel velocities at the canal outlet at Brotherson Dock were less than 0.01 m/s. Hence the proposed additional inflow should not increase sediment transport potential within Bunnerong Canal, especially considering estimated flow velocity downstream of CH34.311 is less than 0.01 m/s.
Estimated sediment volumetric flux during dry weather conditions associated with proposed GTP is 25.2 m3/yr which is only 1.3% of the 1 yr ARI stormwater sediment volumetric flux of 1841 m3/yr and is therefore not a significant change to existing conditions.
The estimated volume of the tidal prism in the canal is 20316 m3 at Highest Astronomical Tide assuming no sedimentation in the canal and is 14089 m3 considering current distribution of sediment. The estimated tidal prism in the canal at Lowest Astronomical Tide is 1461 m3 and 635 m3 assuming no sedimentation in the canal and with current distribution of sediment respectively. The proposed additional inflow at Lowest Astronomical Tide represents an increase in tidal prism volume of 90 m3 (6.2%) with respect to no sedimentation model geometry and an increase in tidal prism volume of 165 m3 (26.1%) with respect to current distribution of sediment model geometry. Results indicate that the proposed inflow may constituent a significant component of the tidal prism volume at Lowest Astronomical Tide, however, averaged main channel velocity downstream of CH34.311 are less than 0.04 m/s which implies that the impact on tidal patterns in Brotherson Dock is negligible.
As the volume of treated water discharge from the GTP to Bunnerong Canal is approximately 1% of the 1 in 1 year flood event, the impact on salinity levels of water in the Canal is considered unlikely to affect the overall salinity profile in the Canal. The potential impact on existing water quality in the Canal is further reduced during flood conditions when the stormwater volume entering the system is significantly greater than the volume of the treated water discharge.
Brotherson Dock contains a significantly greater volume of saline water than the Canal, therefore it is considered that the impact of the treated water discharge would not affect the salinity profile in the Dock. It should be noted that Bunnerong Canal has operated as a stormwater discharge to Brotherson Dock over many years, and therefore the additional inflow from the GTP is unlikely to have a significant impact on existing water quality in the Dock.
S:\PROJECTS\39408\033 GTP EIS\EIS\FINAL EIS\REV A\APPENDICES\APPENDIX I HYDRAULIC ASSESSMENT\R001B.DOC\10-NOV-04
3-1

SECTION 4 References
4 References
IEAust, 2001. Australian Rainfall and Runoff, Institute of Engineers Australia, Sydney, NSW, Australia.
Hyder Consulting Pty Ltd, 2004. Bunnerong Canal Sediment Investigation – DRAFT REPORT, Report No. 5000-NS02448-ENR-01, Sydney Ports Corporation, Sydney, NSW, Australia.
US Army Corp of Engineers, 2003. HEC-RAS – Hydrologic Engineering Center-River Analysis System, V3.1.1, United States Army Corp of Engineers, Davis, CA, USA.
S:\PROJECTS\39408\033 GTP EIS\EIS\FINAL EIS\REV A\APPENDICES\APPENDIX I HYDRAULIC ASSESSMENT\R001B.DOC\10-NOV-04
4-1

SECTION 5 Limitations
5 Limitations
URS Australia Pty Ltd (URS) has prepared this report for the use of Orica Australia Pty Ltd in accordance with the usual care and thoroughness of the consulting profession. It is based on generally accepted practices and standards at the time it was prepared. No other warranty, expressed or implied, is made as to the professional advice included in this report. It is prepared in accordance with the scope of work and for the purpose outlined in the Proposal dated 25th June 2004.
The methodology adopted and sources of information used by URS are outlined in this report. URS has made no independent verification of this information beyond the agreed scope of works and URS assumes no responsibility for any inaccuracies or omissions. No indications were found during our investigations that information contained in this report as provided to URS was false.
This report was prepared between June and October 2004 and is based on the conditions encountered and information reviewed at the time of preparation. URS disclaims responsibility for any changes that may have occurred after this time.
This report should be read in full. No responsibility is accepted for use of any part of this report in any other context or for any other purpose or by third parties. This report does not purport to give legal advice. Legal advice can only be given by qualified legal practitioners.
S:\PROJECTS\39408\033 GTP EIS\EIS\FINAL EIS\REV A\APPENDICES\APPENDIX I HYDRAULIC ASSESSMENT\R001B.DOC\10-NOV-04
5-1

Tables
S:\PROJECTS\39408\033 GTP EIS\EIS\FINAL EIS\REV A\APPENDICES\APPENDIX I HYDRAULIC ASSESSMENT\R001B.DOC\10-NOV-04

Tables
Table 2.1 Estimated Time of Concentration, tc (min)
Minor Flood Flows (< 5 yr ARI) Major Flood Flows (> 5 yr ARI)
Total Catchment (2.91 km2)
Impervious Fraction (1.75 km2)
Total Catchment (3.86 km2)
Impervious Fraction (2.32 km2)
tc (min) 68 min. 56 min. 76 min. 63 min.
Table 2.2 Maximum of Estimated Peak Discharge (m3/s) in Bunnerong Canal
ARI Design Peak Discharge (m3/s)
100 yr 104.0 50 yr 85.0 20 yr 63.0 10 yr 48.0 5 yr 32.7 2 yr 20.6 1 yr 13.3
Table 2.3 Modelled Flood Levels (mRL) – Pre-Development
Water Levels (mRL) Chainage (m) 100 yr ARI 50 yr ARI 20 yr ARI 10 yr ARI 5 yr ARI 2 yr ARI 1 yr ARI
Tail Water HAT LAT HAT LAT HAT LAT HAT LAT HAT LAT HAT LAT HAT LAT
456.699 2.61 2.53 2.45 2.24 2.32 1.89 2.27 1.62 2.23 1.31 2.21 1.03 2.20 0.84
355.702 2.16 1.95 2.16 1.74 2.17 1.50 2.18 1.32 2.19 1.09 2.20 0.87 2.20 0.71
240.000 2.03 1.68 2.09 1.49 2.14 1.29 2.17 1.13 2.18 0.92 2.19 0.72 2.20 0.57
192.000 2.15 1.82 2.16 1.62 2.18 1.37 2.19 1.17 2.19 0.94 2.20 0.72 2.20 0.56
115.314 2.11 1.74 2.14 1.54 2.17 1.29 2.18 1.10 2.19 0.87 2.20 0.65 2.20 0.48
34.311 2.08 1.66 2.12 1.47 2.16 1.22 2.18 1.03 2.19 0.81 2.20 0.58 2.20 0.41
26.390 2.16 0.40 2.17 0.22 2.19 -0.29 2.19 -0.43 2.20 -0.56 2.20 -0.66 2.20 -0.01
18.060 2.19 0.19 2.19 0.07 2.19 -0.95 2.20 -1.09 2.20 0.00 2.20 0.00 2.20 0.00
14.760 2.18 0.01 2.19 0.01 2.19 -0.93 2.20 -1.07 2.20 0.00 2.20 0.00 2.20 0.00
6.360 2.20 0.17 2.20 0.11 2.20 0.05 2.20 0.03 2.20 0.01 2.20 0.00 2.20 0.00
-1.240 2.23 0.33 2.22 0.22 2.21 0.12 2.21 0.07 2.20 0.03 2.20 0.01 2.20 0.01
-9.640 2.21 0.19 2.21 0.12 2.20 0.07 2.20 0.04 2.20 0.02 2.20 0.01 2.20 0.00
* HAT is Highest Astronomical Tide; LAT is Lowest Astronomical Tide
S:\PROJECTS\39408\033 GTP EIS\EIS\FINAL EIS\REV A\APPENDICES\APPENDIX I HYDRAULIC ASSESSMENT\R001B.DOC\10-NOV-04

Tables
Table 2.4 Modelled Average Main Channel Velocities (m/s) – Pre-Development
Average Main Channel Velocities (m/s) Chainage (m) 100 yr ARI 50 yr ARI 20 yr ARI 10 yr ARI 5 yr ARI 2 yr ARI 1 yr ARI
Tail Water HAT LAT HAT LAT HAT LAT HAT LAT HAT LAT HAT LAT HAT LAT
456.699 1.73 1.79 1.53 1.70 1.21 1.56 0.95 1.44 0.66 1.30 0.42 1.16 0.27 1.06
355.702 3.27 3.64 2.68 3.39 1.98 2.98 1.50 2.63 1.01 2.23 0.64 1.84 0.41 1.54
240.000 3.28 4.00 2.61 3.69 1.90 3.21 1.43 2.79 0.96 2.34 0.60 1.92 0.39 1.59
192.000 2.47 2.92 2.01 2.69 1.48 2.39 1.13 2.14 0.76 1.82 0.48 1.53 0.31 1.29
115.314 2.46 2.99 1.99 2.76 1.46 2.45 1.11 2.20 0.75 1.88 0.47 1.59 0.30 1.37
34.311 2.41 2.98 1.93 2.74 1.41 2.43 1.07 2.17 0.72 1.84 0.45 1.56 0.29 1.35
26.390 1.71 4.07 1.39 3.87 1.03 5.34 0.79 5.37 0.53 5.08 0.33 4.64 0.22 0.76
18.060 1.48 3.23 1.21 2.84 0.90 6.06 0.69 6.20 0.47 1.14 0.29 0.72 0.19 0.47
14.760 1.53 3.73 1.25 3.05 0.93 5.96 0.71 6.08 0.48 1.18 0.30 0.74 0.19 0.48
6.360 1.29 2.86 1.05 2.43 0.79 1.87 0.60 1.45 0.41 0.99 0.26 0.63 0.16 0.41
-1.240 0.86 1.75 0.71 1.52 0.53 1.21 0.40 0.95 0.27 0.66 0.17 0.42 0.11 0.27
-9.640 1.08 2.37 0.88 2.01 0.66 1.56 0.50 1.21 0.34 0.83 0.21 0.53 0.14 0.34
* HAT is Highest Astronomical Tide; LAT is Lowest Astronomical Tide
Table 2.5 Modelled Flood Levels (m Tidal Gauge Datum) – Pre-Development with Sedimentation
Water Levels (mRL) Chainage (m) 100 yr ARI 50 yr ARI 20 yr ARI 10 yr ARI 5 yr ARI 2 yr ARI 1 yr ARI
Tail Water HAT LAT HAT LAT HAT LAT HAT LAT HAT LAT HAT LAT HAT LAT
456.699 3.22 3.22 2.93 2.93 2.60 2.57 2.42 2.31 2.29 1.99 2.23 1.72 2.21 1.52
355.702 2.65 2.65 2.44 2.44 2.26 2.18 2.21 2.00 2.20 1.77 2.20 1.55 2.20 1.40
240.000 2.37 2.37 2.16 2.16 2.10 1.94 2.14 1.80 2.17 1.59 2.19 1.40 2.20 1.26
192.000 2.45 2.45 2.25 2.25 2.18 2.02 2.18 1.83 2.19 1.60 2.20 1.39 2.20 1.24
115.314 2.35 2.35 2.16 2.16 2.13 1.93 2.16 1.75 2.18 1.51 2.19 1.31 2.20 1.16
34.311 2.24 2.24 2.06 2.06 2.09 1.84 2.14 1.66 2.17 1.43 2.19 1.23 2.20 1.08
26.390 2.13 1.07 2.15 0.91 2.17 0.71 2.19 0.27 2.19 0.13 2.20 0.03 2.20 -0.04
18.060 2.18 0.87 2.19 0.67 2.19 0.41 2.20 -0.39 2.20 -0.52 2.20 -0.61 2.20 0.01
14.760 2.17 0.66 2.18 0.48 2.19 0.26 2.19 -0.37 2.20 -0.50 2.20 -0.60 2.20 0.01
6.360 2.21 0.72 2.20 0.56 2.20 0.37 2.20 -0.37 2.20 -0.50 2.20 0.04 2.20 0.02
-1.240 2.26 0.92 2.24 0.72 2.22 0.49 2.21 0.32 2.21 0.16 2.20 0.07 2.20 0.03
-9.640 2.22 0.74 2.21 0.57 2.21 0.38 2.20 0.24 2.20 0.12 2.20 0.05 2.20 0.02
* HAT is Highest Astronomical Tide; LAT is Lowest Astronomical Tide
S:\PROJECTS\39408\033 GTP EIS\EIS\FINAL EIS\REV A\APPENDICES\APPENDIX I HYDRAULIC ASSESSMENT\R001B.DOC\10-NOV-04

Tables
Table 2.6 Modelled Average Main Channel Velocities (m/s) – Pre-Development with
Sedimentation
Average Main Channel Velocities (m/s) Chainage (m) 100 yr ARI 50 yr ARI 20 yr ARI 10 yr ARI 5 yr ARI 2 yr ARI 1 yr ARI
Tail Water HAT LAT HAT LAT HAT LAT HAT LAT HAT LAT HAT LAT HAT LAT
456.699 1.79 1.79 1.69 1.69 1.53 1.56 1.32 1.44 0.99 1.30 0.65 1.16 0.43 1.06
355.702 3.63 3.63 3.36 3.36 2.82 3.00 2.22 2.65 1.52 2.24 0.96 1.84 0.62 1.53
240.000 4.01 4.01 3.75 3.75 2.91 3.32 2.17 2.88 1.43 2.42 0.89 1.96 0.57 1.61
192.000 3.03 3.03 2.79 2.79 2.18 2.46 1.66 2.19 1.12 1.88 0.70 1.56 0.45 1.30
115.314 3.14 3.14 2.90 2.90 2.20 2.56 1.65 2.28 1.10 1.98 0.69 1.65 0.44 1.40
34.311 3.18 3.18 2.94 2.94 2.14 2.58 1.58 2.29 1.05 2.00 0.65 1.67 0.42 1.42
26.390 2.25 4.13 1.82 3.87 1.34 3.51 1.02 5.24 0.69 5.05 0.43 4.61 0.28 4.55
18.060 1.83 3.25 1.49 3.03 1.11 2.74 0.85 6.12 0.57 5.86 0.36 5.43 0.23 0.85
14.760 1.88 3.82 1.54 3.57 1.14 3.21 0.87 6.00 0.59 5.70 0.37 5.21 0.24 0.87
6.360 1.58 3.12 1.29 2.85 0.96 2.47 0.74 5.09 0.50 4.84 0.31 1.11 0.20 0.73
-1.240 1.05 1.85 0.86 1.71 0.65 1.51 0.49 1.32 0.33 1.04 0.21 0.73 0.14 0.49
-9.640 1.32 2.58 1.08 2.37 0.81 2.05 0.62 1.78 0.42 1.36 0.26 0.92 0.17 0.61
* HAT is Highest Astronomical Tide; LAT is Lowest Astronomical Tide
Table 2.7 Modelled Flood Levels (mRL) – Post-Development
Water Levels (mRL) Chainage (m) 100 yr ARI 50 yr ARI 20 yr ARI 10 yr ARI 5 yr ARI 2 yr ARI 1 yr ARI
Tail Water HAT LAT HAT LAT HAT LAT HAT LAT HAT LAT HAT LAT HAT LAT
456.699 2.61 2.54 2.45 2.24 2.32 1.89 2.27 1.63 2.23 1.31 2.21 1.03 2.20 0.84
355.702 2.16 1.96 2.16 1.74 2.17 1.50 2.18 1.32 2.19 1.09 2.20 0.87 2.20 0.71
240.000 2.03 1.68 2.09 1.50 2.14 1.29 2.17 1.14 2.18 0.93 2.19 0.73 2.20 0.58
192.000 2.15 1.82 2.16 1.62 2.18 1.37 2.19 1.17 2.19 0.94 2.20 0.72 2.20 0.56
115.314 2.11 1.74 2.14 1.54 2.17 1.29 2.18 1.10 2.19 0.87 2.20 0.65 2.20 0.48
34.311 2.08 1.66 2.12 1.47 2.16 1.23 2.18 1.03 2.19 0.81 2.20 0.58 2.20 0.41
26.390 2.16 0.40 2.17 0.22 2.19 -0.29 2.19 -0.43 2.20 -0.56 2.20 -0.66 2.20 -0.01
18.060 2.19 0.19 2.19 0.07 2.19 -0.95 2.20 -1.09 2.20 0.00 2.20 0.00 2.20 0.00
14.760 2.18 0.01 2.19 0.01 2.19 -0.92 2.20 -1.07 2.20 0.00 2.20 0.00 2.20 0.00
6.360 2.20 0.17 2.20 0.11 2.20 0.05 2.20 0.03 2.20 0.01 2.20 0.00 2.20 0.00
-1.240 2.23 0.33 2.22 0.22 2.21 0.12 2.21 0.07 2.20 0.03 2.20 0.01 2.20 0.01
-9.640 2.21 0.19 2.21 0.13 2.20 0.07 2.20 0.04 2.20 0.02 2.20 0.01 2.20 0.00
S:\PROJECTS\39408\033 GTP EIS\EIS\FINAL EIS\REV A\APPENDICES\APPENDIX I HYDRAULIC ASSESSMENT\R001B.DOC\10-NOV-04

Tables
Table 2.8 Modelled Average Main Channel Velocities (m/s) – Post-Development
Average Main Channel Velocities (m/s) Chainage (m) 100 yr ARI 50 yr ARI 20 yr ARI 10 yr ARI 5 yr ARI 2 yr ARI 1 yr ARI
Tail Water HAT LAT HAT LAT HAT LAT HAT LAT HAT LAT HAT LAT HAT LAT
456.699 1.73 1.79 1.53 1.70 1.21 1.56 0.95 1.44 0.66 1.30 0.42 1.16 0.27 1.06
355.702 3.27 3.64 2.68 3.39 1.98 2.98 1.51 2.64 1.01 2.23 0.64 1.85 0.41 1.54
240.000 3.29 4.00 2.62 3.69 1.90 3.21 1.43 2.80 0.96 2.35 0.61 1.93 0.39 1.60
192.000 2.47 2.92 2.01 2.69 1.49 2.39 1.13 2.14 0.76 1.83 0.48 1.53 0.31 1.30
115.314 2.47 2.99 1.99 2.76 1.46 2.45 1.11 2.20 0.75 1.88 0.47 1.60 0.30 1.38
34.311 2.41 2.98 1.93 2.75 1.42 2.43 1.07 2.17 0.72 1.84 0.46 1.56 0.29 1.36
26.390 1.71 4.07 1.39 3.87 1.03 5.34 0.79 5.37 0.53 5.09 0.34 4.65 0.22 0.77
18.060 1.49 3.24 1.21 2.85 0.90 6.06 0.69 6.20 0.47 1.15 0.30 0.73 0.19 0.47
14.760 1.53 3.73 1.25 3.05 0.93 5.96 0.71 6.08 0.48 1.18 0.30 0.75 0.20 0.48
6.360 1.29 2.86 1.06 2.43 0.79 1.87 0.60 1.45 0.41 1.00 0.26 0.63 0.17 0.41
-1.240 0.86 1.75 0.71 1.53 0.53 1.21 0.40 0.95 0.27 0.66 0.17 0.42 0.11 0.27
-9.640 1.08 2.37 0.88 2.02 0.66 1.56 0.50 1.21 0.34 0.83 0.22 0.53 0.14 0.34
Table 2.9 Modelled Flood Levels (mRL) – Post-Development with Sedimentation
Water Levels (mRL) Chainage (m) 100 yr ARI 50 yr ARI 20 yr ARI 10 yr ARI 5 yr ARI 2 yr ARI 1 yr ARI
Tail Water HAT LAT HAT LAT HAT LAT HAT LAT HAT LAT HAT LAT HAT LAT
456.699 3.22 3.22 2.93 2.93 2.61 2.57 2.42 2.31 2.29 2.00 2.23 1.72 2.21 1.53
355.702 2.65 2.65 2.44 2.44 2.26 2.18 2.21 2.00 2.20 1.77 2.20 1.56 2.20 1.40
240.000 2.37 2.37 2.16 2.16 2.10 1.94 2.14 1.80 2.17 1.59 2.19 1.40 2.20 1.26
192.000 2.45 2.45 2.26 2.26 2.18 2.02 2.18 1.83 2.19 1.60 2.20 1.40 2.20 1.24
115.314 2.35 2.35 2.16 2.16 2.13 1.93 2.16 1.75 2.18 1.52 2.19 1.32 2.20 1.17
34.311 2.25 2.25 2.06 2.06 2.09 1.83 2.14 1.66 2.17 1.43 2.19 1.23 2.20 1.08
26.390 2.12 1.07 2.15 0.91 2.17 0.71 2.19 0.27 2.19 0.14 2.20 0.04 2.20 -0.04
18.060 2.18 0.88 2.19 0.67 2.19 0.41 2.20 -0.39 2.20 -0.52 2.20 -0.61 2.20 0.01
14.760 2.17 0.66 2.18 0.48 2.19 0.26 2.19 -0.37 2.20 -0.50 2.20 -0.59 2.20 0.01
6.360 2.21 0.72 2.20 0.57 2.20 0.37 2.20 -0.37 2.20 -0.50 2.20 0.04 2.20 0.02
-1.240 2.26 0.92 2.24 0.73 2.22 0.49 2.21 0.32 2.21 0.16 2.20 0.07 2.20 0.03
-9.640 2.22 0.74 2.21 0.58 2.21 0.38 2.20 0.24 2.20 0.12 2.20 0.05 2.20 0.02
S:\PROJECTS\39408\033 GTP EIS\EIS\FINAL EIS\REV A\APPENDICES\APPENDIX I HYDRAULIC ASSESSMENT\R001B.DOC\10-NOV-04

Tables
Table 2.10 Modelled Average Main Channel Velocities (m/s) – Post-Development with
Sedimentation
Average Main Channel Velocities (m/s) Chainage (m) 100 yr ARI 50 yr ARI 20 yr ARI 10 yr ARI 5 yr ARI 2 yr ARI 1 yr ARI
Tail Water HAT LAT HAT LAT HAT LAT HAT LAT HAT LAT HAT LAT HAT LAT
456.699 1.79 1.79 1.69 1.69 1.53 1.56 1.32 1.45 0.99 1.30 0.66 1.16 0.43 1.06
355.702 3.63 3.63 3.36 3.36 2.82 3.00 2.23 2.65 1.53 2.25 0.97 1.85 0.62 1.53
240.000 4.01 4.01 3.75 3.75 2.92 3.32 2.17 2.88 1.44 2.43 0.90 1.97 0.58 1.62
192.000 3.03 3.03 2.79 2.79 2.19 2.47 1.67 2.20 1.12 1.88 0.71 1.56 0.46 1.30
115.314 3.14 3.14 2.90 2.90 2.21 2.57 1.65 2.29 1.10 1.98 0.69 1.66 0.44 1.41
34.311 3.18 3.18 2.94 2.94 2.15 2.59 1.59 2.30 1.05 2.00 0.66 1.67 0.42 1.43
26.390 2.25 4.14 1.82 3.87 1.34 3.51 1.02 5.25 0.69 5.02 0.43 4.59 0.28 4.50
18.060 1.83 3.25 1.50 3.04 1.11 2.74 0.85 6.12 0.57 5.87 0.36 5.42 0.23 0.86
14.760 1.89 3.82 1.54 3.57 1.14 3.22 0.87 6.00 0.59 5.71 0.37 5.20 0.24 0.88
6.360 1.58 3.12 1.30 2.83 0.97 2.47 0.74 5.09 0.50 4.84 0.32 1.11 0.20 0.74
-1.240 1.05 1.85 0.86 1.71 0.65 1.51 0.50 1.33 0.34 1.04 0.21 0.73 0.14 0.49
-9.640 1.32 2.58 1.08 2.35 0.81 2.06 0.62 1.78 0.42 1.36 0.27 0.93 0.17 0.62
Table 2.11 Modelled Water Level (mRL) and Average Main Channel Velocities (m/s) –
Dry Weather Conditions
Chainage (m) Water Level (mRL) Velocity (m/s)
Tail Water HAT LAT HAT LAT 456.699 2.20 0.25 0.00 0.37 355.702 2.20 0.15 0.00 0.37 240.000 2.20 0.04 0.00 0.33 192.000 2.20 0.02 0.00 0.23 115.314 2.20 0.00 0.00 0.16 34.311 2.20 0.00 0.00 0.08 26.390 2.20 0.00 0.00 0.01 18.060 2.20 0.00 0.00 0.00 14.760 2.20 0.00 0.00 0.01 6.360 2.20 0.00 0.00 0.00 -1.240 2.20 0.00 0.00 0.00 -9.640 2.20 0.00 0.00 0.00
S:\PROJECTS\39408\033 GTP EIS\EIS\FINAL EIS\REV A\APPENDICES\APPENDIX I HYDRAULIC ASSESSMENT\R001B.DOC\10-NOV-04

Tables
Table 2.12 Sediment Volumetric Flux (m3/s)
Dry Weather Flow 1 yr ARI
Suspended Sediment Concentration 15 mg/L 100 mg/L Discharge 0.14 m3/s 13.3 m3/s Sediment Mass Flux 180 kg/d 4.7 x 10⁶ kg/h Sediment Volumetric Flux 25.2 m3/yr 1841 m3/yr
Table 2.13 Tidal Prism Volume (m3)
No Sedimentation Sedimentation Model/Scenario
HAT LAT HAT LAT
Tidal Prism Only 20315.9 1461.1 14088.9 634.6
Tidal Prism and GTP 20315.9 1551.2 14088.9 800.1
S:\PROJECTS\39408\033 GTP EIS\EIS\FINAL EIS\REV A\APPENDICES\APPENDIX I HYDRAULIC ASSESSMENT\R001B.DOC\10-NOV-04
Appendix A Hydraulic Model Profiles
S:\PROJECTS\39408\033 GTP EIS\EIS\FINAL EIS\REV A\APPENDICES\APPENDIX I HYDRAULIC ASSESSMENT\R001B.DOC\10-NOV-04

Appendix A Hydraulic Model Profiles
-300 -200 -100 0 100 200 300 400 500-2
-1
0
1
2
3
Bunnerong_Canal_METRIC Plan: High_Tide
Main Channel Distance (m)
Ele
vatio
n (m
)
Legend
EG Q100+GTP
EG Q100
WS Q100+GTP
WS Q100
Crit Q100+GTP
Crit Q100
Ground
-209
.64
-9.6
4
6.36
14.7
626
.39
34.3
11
115.
314
192
240
355.
702
456.
699
Bunnerong Bunnerong
Figure A-1: Energy and hydraulic grade line of 100 yr ARI flood event with downstream boundary condition as Highest Astronomical Tide
S:\PROJECTS\39408\033 GTP EIS\EIS\FINAL EIS\REV A\APPENDICES\APPENDIX I HYDRAULIC ASSESSMENT\R001B.DOC\10-NOV-04
A-1

Appendix A Hydraulic Model Profiles
-300 -200 -100 0 100 200 300 400 500-2
-1
0
1
2
3
Bunnerong_Canal_METRIC Plan: Low_Tide
Main Channel Distance (m)
Ele
vatio
n (m
)
Legend
EG Q100+GTP
EG Q100
WS Q100+GTP
WS Q100
Crit Q100
Crit Q100+GTP
Ground
-209
.64
-9.6
4
6.36
14.7
626
.39
34.3
11
115.
314
192
240
355.
702
456.
699
Bunnerong Bunnerong
Figure A-2: Energy and hydraulic grade line of 100 yr ARI flood event with downstream boundary condition as Lowest Astronomical Tide.
S:\PROJECTS\39408\033 GTP EIS\EIS\FINAL EIS\REV A\APPENDICES\APPENDIX I HYDRAULIC ASSESSMENT\R001B.DOC\10-NOV-04
A-2

Appendix A Hydraulic Model Profiles
-300 -200 -100 0 100 200 300 400 500
-1
0
1
2
3
4
Bunnerong_Canal_METRIC Plan: High_Tide /w Sedimentation
Main Channel Distance (m)
Ele
vatio
n (m
)
Legend
EG Q100+GTP
EG Q100
WS Q100+GTP
WS Q100
Crit Q100+GTP
Crit Q100
Ground
-209
.64
-9.6
4
6.36
14.7
626
.39
34.3
11
115.
314
192
240
355.
702
456.
699
Bunnerong Bunnerong
Figure A-3: Energy and hydraulic grade line of 100 yr ARI flood event with downstream boundary condition as Highest Astronomical Tide incorporating current distribution of sedimentation
S:\PROJECTS\39408\033 GTP EIS\EIS\FINAL EIS\REV A\APPENDICES\APPENDIX I HYDRAULIC ASSESSMENT\R001B.DOC\10-NOV-04
A-3

Appendix A Hydraulic Model Profiles
-300 -200 -100 0 100 200 300 400 500
-1
0
1
2
3
4
Bunnerong_Canal_METRIC Plan: Low_Tide /w Sedimentation
Main Channel Distance (m)
Ele
vatio
n (m
)
Legend
EG Q100+GTP
EG Q100
WS Q100+GTP
Crit Q100+GTP
WS Q100
Crit Q100
Ground
-209
.64
-9.6
4
6.36
14.7
626
.39
34.3
11
115.
314
192
240
355.
702
456.
699
Bunnerong Bunnerong
Figure A-4: Energy and hydraulic grade line of 100 yr ARI flood event with downstream boundary condition as Lowest Astronomical Tide incorporating current distribution of sedimentation
S:\PROJECTS\39408\033 GTP EIS\EIS\FINAL EIS\REV A\APPENDICES\APPENDIX I HYDRAULIC ASSESSMENT\R001B.DOC\10-NOV-04
A-4

Appendix A Hydraulic Model Profiles
-300 -200 -100 0 100 200 300 400 500-2.0
-1.5
-1.0
-0.5
0.0
0.5
1.0
1.5
2.0
2.5
Bunnerong_Canal_METRIC Plan: High_Tide
Main Channel Distance (m)
Ele
vatio
n (m
)
Legend
EG GTP
WS GTP
Crit GTP
Ground
-209
.64
-9.6
4
6.36
14.7
626
.39
34.3
11
115.
314
192
240
355.
702
456.
699
Bunnerong Bunnerong
Figure A-5: Energy and hydraulic grade line of dry weather inflow from GTP with downstream boundary condition as Highest Astronomical Tide.
S:\PROJECTS\39408\033 GTP EIS\EIS\FINAL EIS\REV A\APPENDICES\APPENDIX I HYDRAULIC ASSESSMENT\R001B.DOC\10-NOV-04
A-5

Appendix A Hydraulic Model Profiles
-300 -200 -100 0 100 200 300 400 500-2.0
-1.5
-1.0
-0.5
0.0
0.5
Bunnerong_Canal_METRIC Plan: Low_Tide
Main Channel Distance (m)
Ele
vatio
n (m
)
Legend
EG GTP
WS GTP
Crit GTP
Ground
-209
.64
-9.6
4
6.36
14.7
626
.39
34.3
11
115.
314
192
240
355.
702
456.
699
Bunnerong Bunnerong
Figure A-6: Energy and hydraulic grade line of dry weather inflow from GTP with downstream boundary condition as Lowest Astronomical Tide
S:\PROJECTS\39408\033 GTP EIS\EIS\FINAL EIS\REV A\APPENDICES\APPENDIX I HYDRAULIC ASSESSMENT\R001B.DOC\10-NOV-04
A-6

Appendix B Construction Drawings of
Bunnerong Canal
S:\PROJECTS\39408\033 GTP EIS\EIS\FINAL EIS\REV A\APPENDICES\APPENDIX I HYDRAULIC ASSESSMENT\R001B.DOC\10-NOV-04