Embed Size (px)
Citation preview

Hydraulic Fracturing and Formation Damagein a Sedimentary Geothermal Reservoir
A. Reinicke, B. Legarth, G. Zimmermann, E. Huenges and G. Dresen
ENGINE – ENhanced Geothermal Innovative Network for EuropeWorkshop 3, "Stimulation of reservoir and microseismicity"
Kartause Ittingen, Zürich, June 29 – July 1, 2006, Switzerland

The Geothermal in-situ Laboratory Groß Schönebeck 3/90
in-situ laboratoryGroß Schönebeck
In 2002 hydraulic stimulation experiments were conducted in a remediated Rotliegend-well Groß Schönebeck 3/90.
the aim:
Development of technologies to use primary low-productive aquifers for geothermal power generation
objectives:
• enhance the inflow performance• create new highly conductive flow paths
in a porous-permeable rock matrix• maximise potential inflow area• testing the technical feasibility of the
fracturing concept

Hydraulic Stimulation Technique: Waterfracs (WF)
wf xf
low viscous gels: η = 10 cP
without proppants orsmall proppant concentration: c = 50 - 200 g/l
long fractures: xf ≤ 250 m
small width: wf ~ 1 mm
• connect reservoir regions far from well / maximise inflow area
• reduction in costs compared to HPF
• application is limited to reservoirs with small permeability
• success is dependent on the self propping potential of the reservoir rock

Hydraulic Stimulation Technique: Hydraulic Proppant Fracs (HPF)
high viscous gels: η ≥ 100 cP
high proppant concentration: c = 200 - 2000 g/l
shorter fractures: xf ≤ 150 m
large width: wf = 1 - 25 mm
• wide range of formations (permeabilities) can be treated
• good control of stimulation parameters
• wellbore skin can be bypassed
• treatments are more expensive
wf xf

Lithology, Temperature Profile and PetrophysicalReservoir Parameters
initial productivity indexPIprefrac: 1.2 m³ h-1MPa-1
HPF treatments ofsandstones to
enhance productivity

Technical Concept and Chronology of Operations of HPF Treatments in 2002
perforation: 4168 - 4169 m
sand up to 4190 mpacker set. Depth:4130 m
1. lifttestdatafrac 1
T-Logmainfrac 1 with proppants
2. lifttest
sand up to 4122 mpacker set. Depth:4085 m
datafrac 2T-Log
mainfrac 2 with proppants
extract sand plugflowmeter logcasinglift test

HPF Treatments: Datafrac 1 and Mainfrac 1
Datafrac 1 Mainfrac 1
Lack of experience with open hole packer treatments at high temperaturesless aggressive frac design• smaller volumes: ~ 100 m3
• lower proppant concentrations: ~ 280 g/l• lower pumping rates: ~ 2 m3/min

Hydraulic Reservoir Behaviour and Stimulation Effect
PIprefrac : 1.2 m³ h-1MPa-1
PIpostfrac : 2.1 m³ h-1MPa-1
PIpredicted : 8.3 m³ h-1MPa-1 (1)
significant upward extension of inflow area due to new axial fractures
inflow impairment due to non-Darcy-flow effects and proppant
pack damage
(1) Legarth, et al., 2005a

Potential Damage Effects in a Propped Fracture
filtrate invasion,filter cake
(fracture face skin / FFS)
gel residues,chemical precipitates
accumulatedfines:• mechanical
erosion• fines
generationduringfracturing
formation
proppant
proppantcrushing,
compaction
σσeffeffwwff
xxff
σσeffeff proppantembedment Zone
flow direction(2) Legarth, et al., 2005b

Experimental Setup for Proppant Rock Interaction Testing
σ1 [MPa] Axial stressσ3 [MPa] Conf. pressurePP [bar] Pore pressureQi [ml/min] Flow rate
⎥⎦
⎤⎢⎣
⎡+
⋅+
⋅⋅=
3
3
2
2
1
1
kL
kL2
kL2
AηQ∆P
A [m²] area of the sampleη [Pas] dyn. viscosityk1 [m²] permeability of the rockk2 [m²] permeability of FFS zonek3 [m²] permeability of proppant packL1 [m] length of one half of the sampleL2 [m] extent of FFS zone L3 [m] fracture width Lt [m] total length
L1/k1
L1/k1
L3/k3
L2/k2
L2/k2

Triaxial Test of a Propped Fracture:Permeability and AE-Activity at Different Stress Levels
Normalised AE-Density [%]
Rock: Bentheim sandstone Porosity: 23% Initial Permeability (k1): 1250 mDProppants: Carbo Lite Mesh: 20/40 Concentration: 2lbs/ft²Test data: Ø = 50 mm σ3 = 10 MPa Q = 50 ml/min
105 ± 3 mD112 ± 4 mD116 ± 4 mD125 ± 5 mDPermeabilitywith propped fracture (kt)
50 MPa35 MPa20 MPa5 MPaEffective Stress
( ) t2t1t
21t2 kLkkL
Lkkk+−
=
L2 = 4 mm Lt = 125 mmk3 = ∞(260 D @ 50 MPa eff. stress)
k2 = 3.7 mD

Conclusions
• clear productivity (PI) enhancement achieved• new axial propped fractures were created
BUT:• productivity increase less than expected• post-job damage (mechanical, non Darcy flow effects)
HPF treatment in geothermal research well Groß Schönebeck 3/90
Proppant rock interaction testing
• Crushing of grains and/or proppants starts at low effective stress (~5 MPa) • Concentration of AEs at the fracture face• With increasing effective stress AE activity moves into the proppant pack• Drastic reduction of sample permeability


References:
(1) Legarth, B., Huenges, E. and Zimmermann, G., 2005a. Hydraulic Fracturing in Sedimentary Geothermal Reservoirs: Results and Implications, Int. Journal of Rock Mech., Vol. 42 p. 1028–1041
(2) Legarth, B., Raab, S., Huenges, E., 2005b. Mechanical Interactions between proppants and rock and their effect on hydraulic fracture performance, DGMK-Tagungsbericht 2005-1, Fachbereich Aufsuchungund Gewinnung, 28.-29. April 2005, Celle, Deutschland, pp. 275-288
(3) Cinco-Ley, H., Samaniego-V, F., 1977. Effect of Wellbore Storage and Damage on the Transient Pressure Behaviour of vertically Fractured Wells, SPE 6752
(4) Romero, D.J., Valkó, P.P., Economides, M.J., 2003. Optimization of the Productivity Index and the Fracture Geometry of a Stimulated Well With Fracture Face and Choke Skin, SPE 81908
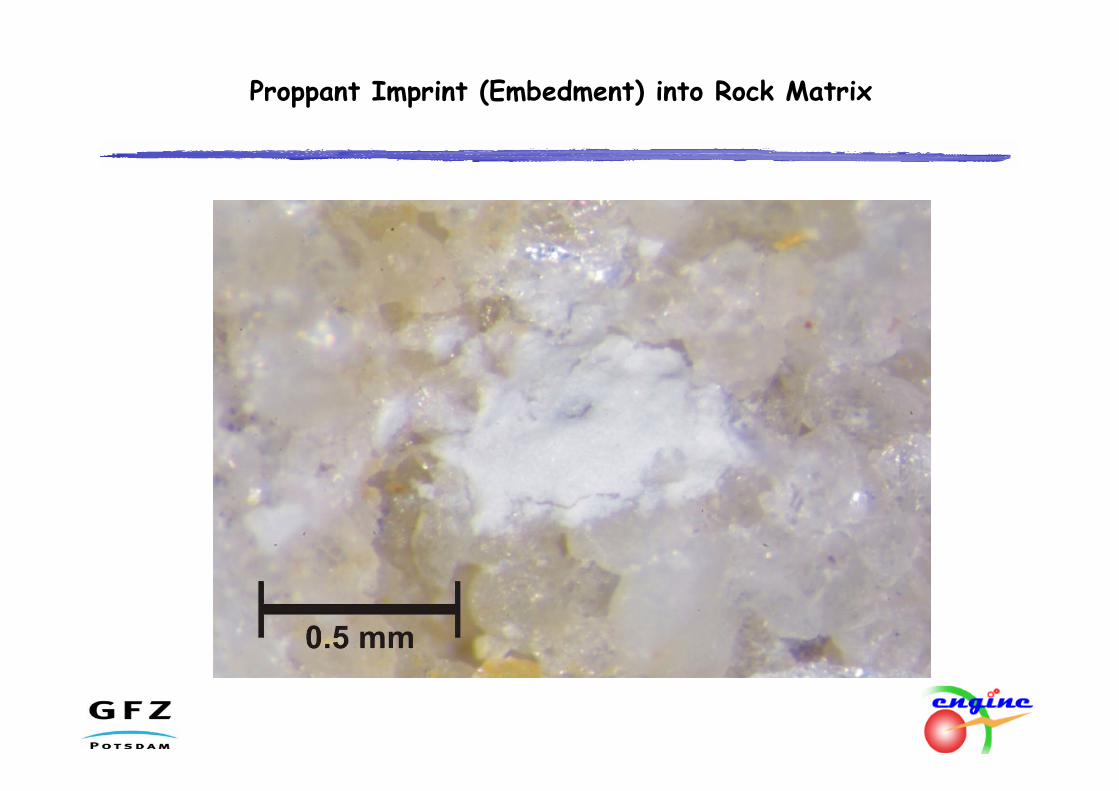
Proppant Imprint (Embedment) into Rock Matrix

Triaxial Test of a Propped Fracture Crushed Proppants and Fines
1 mm

Lab Testing: Picture of crushed Proppants and Fines
1 mm

Mechanical Induced FFS
[2] Legarth, et al., 2005
proppant
grain

Fracture Face Skin (FFS)
sff [-] Fracture Face Skin-factor w [m] Fracture widthws [m] Skin zone depthk [m²] Reservoir permeabilityks [m²] Skin zone permeabilityxf [m] Fracture half length
⎟⎟⎠
⎞⎜⎜⎝
⎛−
⋅⋅
= 1kk
x2wπs
sf
sff
Eq. 1) Fracture Face Skin-factor [1]
kxf
wksws
[1] Cinco-Ley, et al., 1977

Triaxal Test on Bentheim Sandstone
L = 100 mmØ = 50 mmσ3 = 10 MPaQ = 35 ml/min∆k < 10 %Strain rate: 4 * 10-5 s-1
E: Young’s Modulus

Micrograph of the Created Shear Fracture / Permeability of Damaged Zone
1 mm
d21
d23
d22
d2
d1
α
d2= 0.12 mm
α= 63°
d1= 0.27 mm =L2
k2= 0.7 mD( )α cos
dd 21 =
( ) t2t1t
21t2 kLkkL
Lkkk+−
=

Lab Testing: AE-Activity
STEP 15 Mpa
125 mD
STEP 220 Mpa116 mD
STEP 335 Mpa112 mD
STEP 450 Mpa105 mD
Resolution < 2 mm / Amplitude > 3 V

Triaxial Test of a Propped Fracture
105±3 mD112±4 mD116±4 mD125±5 mDPermeability of
sample withpropped fracture
1310±120 mD1270±30 mD1250±40 mD1200±300 mDInitial permeability
50 MPa35 MPa20 MPa5 MPaDifferential pressure
σDiff
σDiff
L1 L2 L3
L1 L2 L3
LS Proppants:σtmax = 3.7 GPa @ 50MPaσtmax = 2.7 GPa Lit.
Normalised AE-Activity [%]

Hertzien Contact of Proppants
( )3 iP
2
P E4FRν13a
⋅⋅⋅−⋅
=
Eq. 4) Contact radius
σDiff
σDiff
L1 L2 L3
L1 L2 L3
( )2P
itmax a2
F2ν1σ⋅Π⋅−
=
Eq. 5) Maximum tensile stress
aP[m] contact radiusσtmax [GPa] maximum tensile stressν [1] Poisson ratioRP [m] proppant radiusE [GPa] Young’s modulusFi [kN] load on single proppant
LS Proppants:E (Al2O3): 380 GPaν (Al2O3): 0.23

Experimental Procedure for Proppant Testing
1) Triaxial test with intact sample
Determination of Young’s Modulus and initial permeability
50 mm
120
mm

1) Triaxial test with intact sample
Determination of Young’s Modulus and initial permeability
2) Tensile fracture via 3-Point-Bending-Test
Generation of a naturally rough fracture face
Experimental Procedure for Proppant Testing

Experimental Procedure for Proppant Testing
5 mm
1) Triaxial test with intact sample
Determination of Young’s Modulus and initial permeability
2) Tensile fracture via 3-Point-Bending-Test
Generation of a naturally rough fracture face
Triaxial test with fractured sample (small axial load)
Determination of permeability of fractured sample

1) Triaxial test with intact sample
Determination of Young’s Modulus and initial permeability
2) Tensile fracture via 3-Point-Bending-Test
Generation of a naturally rough fracture face
Triaxial test with fractured sample (small axial load)
Determination of permeability of fractured sample
3) Opening the fracture, filling with proppants, closing fracture
aligned
Experimental Procedure for Proppant Testing

a) Triaxial test with intact sample
Determination of Young’s Modulus and initial permeability
b) Tensile fracture via 3-Point-Bending-Test
Generation of a naturally rough fracture face
Triaxial test with fractured sample (small axial load)
Determination of permeability of fractured sample
c) Opening the fracture, filling with proppants, closing fracture
aligned
Triaxial test with propped fracture within range of elasticity
Determination of fracture stiffness, fracture width,
permeability and AE-activity
Experimental Procedure for Proppant Testing

Lab Testing: Step 1) Initial Loading of the Sample
σ3 = 10 MPaQ = 50 ml/minStrain rate: 8 * 10-6 s-1
E: Young’s Modulus

Lab Testing: Step 1) 2nd Loading Cycle
σ3 = 10 MPaStrain rate: 8 * 10-6 s-1
E: Young’s Modulus

Lab Testing: Step 2) Reloading of the Sample with Fracture
Lt = 120.15 mmσ3 = 0 MPaQ = 50 ml/minStrain rate: 8 * 10-6 s-1

Lab Testing: Step 3) Reloading of the Sample withProppant Filled Fracture
LS Proppants:2 lbs/ft², 20/40 meshChemistry: 51% Al2O3
45% SiO2
4% Otherσtmax = 2.7 GPa [3]
Lt = 125.15 mmσ3 = 10 MPaQ = 50 ml/minStrain rate: 8 * 10-6 s-1
E: Young’s Modulus
[3] Legarth, et al., 2005

Lab Testing: Calculated Fracture Width vs. Closure Stress
iDiff LE
Displ.w ⋅−=σ

Conceptual Model: Minimum Detectable Depth of a FFS Zone
⎥⎦
⎤⎢⎣
⎡−⋅
⋅⋅
=21
212 kk
kkηQA∆∆PL
Eq. 4) Minimum depth of the hydraulic resistor L2/k2 for a given ∆∆P
∆∆P: Pressure transducer resolution
1
1
2

Maximum flow rate for a Reynolds Number = 0.06
Eq. 5) Flow rate as a function of the Reynolds number (for flow in a porous media)
dρΦηrπRe Q
2s
⋅⋅⋅⋅⋅
= Q [m³/s] flow rateRe [1] Reynolds numberrs [m] sample diameterη [Pas] dyn. viskosity
Φ [1] porosityρ [kg/m³] densityd [m] characteristic length

The new Set-Up
Flow / pressureports for axial flow
Rock sampleConfiningpressure
Flow / pressureports forhorizontal flow
Small slots of 0.4 mm for in- and outflow ports
Uniaxialpressure