Embed Size (px)
Citation preview
Hydraulic, Geotechnical, Geomorphic, and Biologic Data for the Cache River/ Heron Pond Area in Southern Illinois
By ROBERT R. HOLMES, JR.
U.S. GEOLOGICAL SURVEY
Open-File Report 96-467
Prepared in cooperation with theILLINOIS DEPARTMENT OF NATURAL RESOURCES,OFFICE OF WATER RESOURCES
Urbana, Illinois 1996
U.S. DEPARTMENT OF THE INTERIOR BRUCE BABBITT, Secretary
U.S. GEOLOGICAL SURVEY
Gordon P. Eaton, Director
The use of firm, trade, and brand names in this report is for identification purposes only and does not constitute endorsement by the U.S. Geological Survey
For additional information write to:
District Chief U.S. Geological Survey 221 N. Broadway Urbana, Illinois 61801
Copies of this report can be purchased from:
U.S. Geological Survey Branch of Information Services Box 25286 Denver, CO 80225
CONTENTS
Abstract............................................................................................................^^ 1Introduction .............................................................................................................................._^ 1Hydraulic Data...................................................................................................................................................................^ 3GeotechnicalData.................................................................................................................................................................. 3Geomorphic Data................................................................................................................................................................... 5Biologic Data......................................................................................................................................................................... 9Summary................................................................................................................................................................................ 10References............................................................................................................................................................................. 11
FIGURES
1. Map showing Cache River/ Heron Pond area in southern Illinois, and velocity and geomorphic crosssections........................................................................................................................................................................ 2
2. Map showing measured overbank-flow velocities and observed velocity direction in the Cache River/HeronPond area in southern Illinois on April 30, 1996........................................................................................................ 5
3. Graph showing flow-duration curve for the Cache River at Forman, 111. (03612000)............................................... 64. Graph showing discharge hydrograph for the Cache River at Forman, 111. (03612000)............................................ 75. Map showing location of soil boreholes and ground-water piezometers in the Cache River/Heron Pond
area in southern Illinois............................................................................................................................................... 86. Map showing locations of bank rods in the Cache River/Heron Pond area in southern Illinois................................ 14
7-12. Graphs Showing:7. Geomorphic cross section G1 in the Cache River/Heron Pond area in southern Illinois.................................. 168. Geomorphic cross section G2 in the Cache River/Heron Pond area in southern Illinois.................................. 179. Geomorphic cross section G3 in the Cache River/Heron Pond area in southern Illinois.................................. 18
10. Geomorphic cross section G4 in the Cache River/Heron Pond area in southern Illinois.................................. 1911. Geomorphic cross section G5 in the Cache River/Heron Pond area in southern Illinois.................................. 2012. Cross section at the discontinued U.S. Geological Survey streamflow-gaging station in the
Cache River/Heron Pond area in southern Illinois............................................................................................. 21
TABLES
1. Water-surface elevation, discharge, and velocity data collected in the Cache River/Heron Pond areain southern Illinois................................................................................................................................................... 4
2. Ground-water elevations in the Cache River/Heron Pond area in southern Illinois............................................... 93. Results of geotechnical tests for soil boreholes in the Cache River/Heron Pond area in southern Illinois............ 104. Results of detailed geotechnical tests at soil borehole S2 in the Cache River/Heron Pond area in southern
Illinois .................................................................................................................................................................^ 115. Bank loss as determined from bank rods at the Cache River/Heron Pond area in southern Illinois....................... 15
Contents III
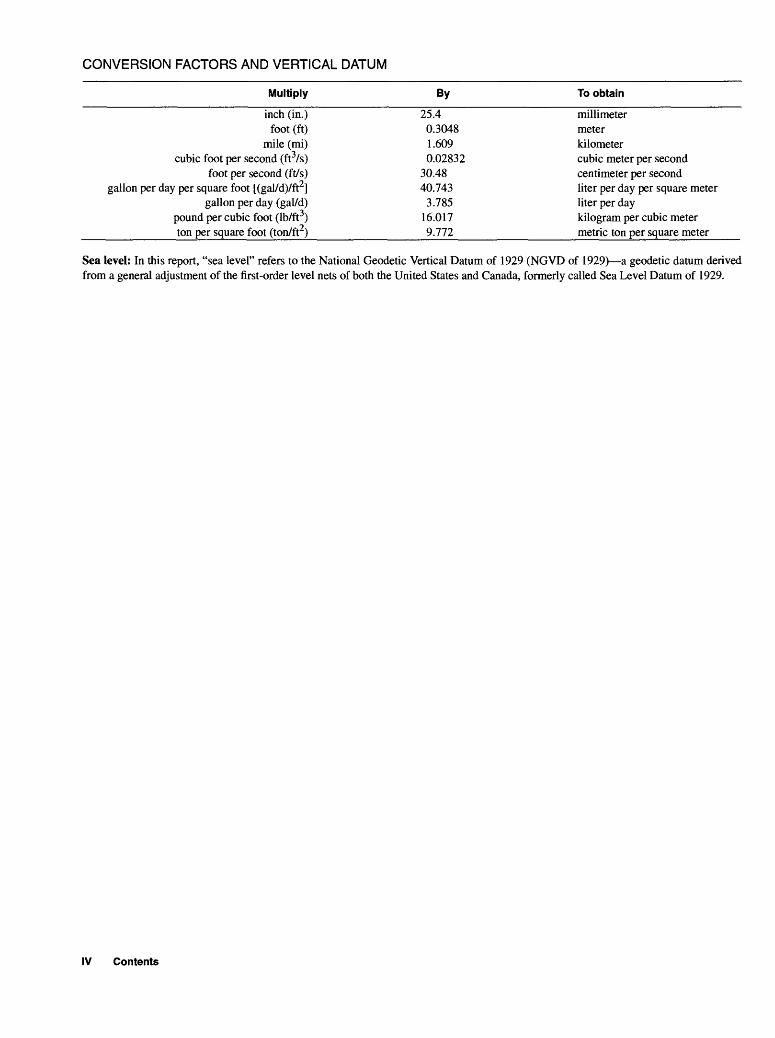
CONVERSION FACTORS AND VERTICAL DATUM
Multiply By To obtain
inch (in.) 25.4 millimeterfoot (ft) 0.3048 meter
mile (mi) 1.609 kilometercubic foot per second (ft3/s) 0.02832 cubic meter per second
foot per second (ft/s) 30.48 centimeter per secondgallon per day per square foot [(gal/d)/ft2] 40.743 liter per day per square meter
gallon per day (gal/d) 3.785 liter per daypound per cubic foot (Ib/ft ) 16.017 kilogram per cubic meter
__________ton per square foot (ton/ft )_____________9.772______________metric ton per square meter___
Sea level: In this report, "sea level" refers to the National Geodetic Vertical Datum of 1929 (NGVD of 1929) a geodetic datum derived from a general adjustment of the first-order level nets of both the United States and Canada, formerly called Sea Level Datum of 1929.
IV Contents
Hydraulic, Geotechnical, Geomorphic, and Biologic Data for the Cache River/ Heron Pond Area in Southern IllinoisBy Robert R. Holmes, Jr.
Abstract
Heron Pond, located in extreme southern Illinois, lies immediately adjacent to the upper Cache River. The upper Cache River is encroach ing on Heron Pond, which has raised the issue of the possibility of a failure of the Heron Pond wall, the area between Heron Pond and the upper Cache River. Hydraulic, geotechnical, geomorphic, and biologic data were collected by the U.S. Geologi cal Survey (USGS) in cooperation with the Illinois Department of Natural Resources, Office of Water Resources (IDNR/OWR) for use in designing a mitigation plan by the IDNR/OWR to prevent the failure of the Heron Pond wall. The river is sluggish during floods with velocities generally 1-2 feet per second. Biologic activity in the area have increased bank instability, which already is a problem because of saturated soils in the Heron Pond wall. In the area adjacent to the Heron Pond, the right descending bank of the upper Cache River receded 0.5 foot between September 21, 1995 and June 25, 1996. Comparisons between two surveys, 1958 and 1995, indicate that the channel near the discontinued USGS streamflow- gaging station near the Burlington Northern Rail road crossing has widened by more than 10 feet with less than 0.5 foot of incision.
INTRODUCTION
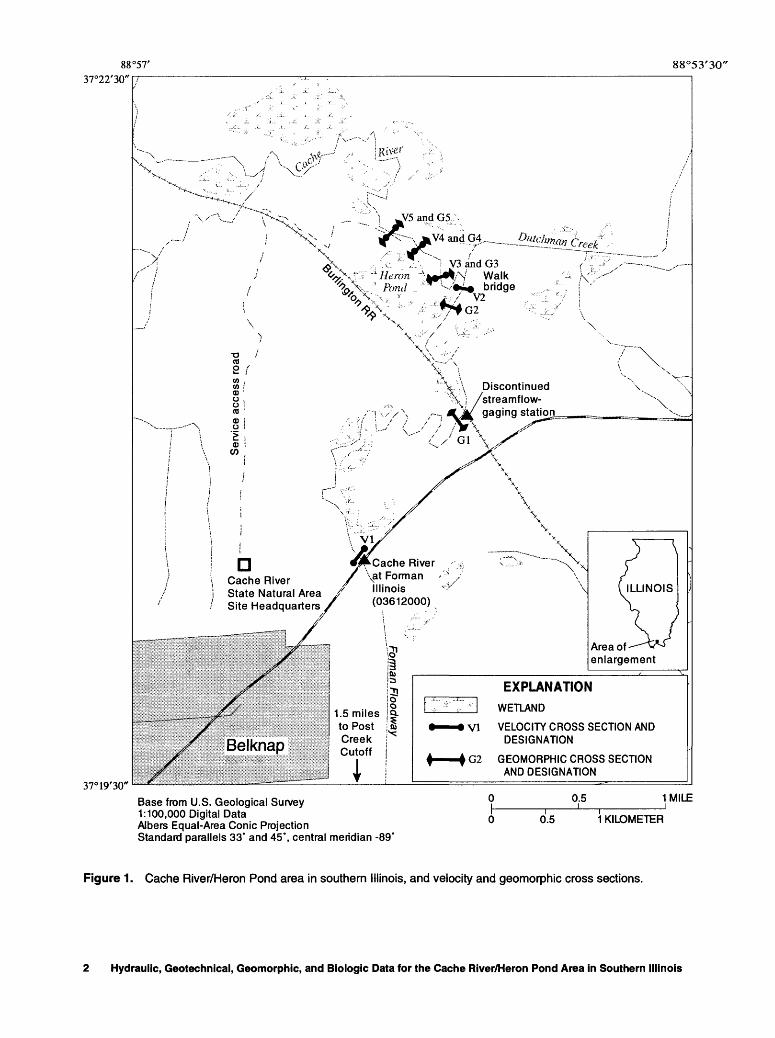
The Federally protected natural area at Heron Pond, located adjacent to the upper Cache River in
southern Illinois (fig. 1), is a part of a cypress/tupolo wetland rich in biodiversity. This area of the State, sometimes called "Illinois' hidden bayou," has been called a scenic treasure and most recently given the title of "Wetland of International Importance" (Smith, 1996). The Cache River, with nearly vertical banks, appears to be encroaching on Heron Pond. At one loca tion, the river is within 35 ft of the pond. The elevation difference between Heron Pond and the bottom of the Cache River channel is approximately 13 ft. Heron Pond is approximately 4 mi upstream from the begin ning of the Forman Floodway/Post Creek Cutoff area and less than 0.25 mi upstream from the inflow of Dutchman Creek (fig. 1). The apparent lateral progres sion of the nearly vertical banks of the upper Cache River and its proximity to Heron Pond has raised the issue of the possibility of a failure of the Heron Pond wall, the area between Heron Pond and the upper Cache River. This failure probably would be detrimen tal to the ecosystem of Heron Pond.
Any effort to prevent failure of the wall and subsequent collapse of the pond requires knowledge of factors such as the hydraulics of the Cache River, the properties of the soils in the area, the biologic effects on streambank stability, and the hydrology of the area. As part of a study (September 1995 until July 1996) to gain this knowledge, the U.S. Geological Survey (USGS) in cooperation with the Illinois Depart ment of Natural Resources, Office of Water Resources (IDNR/OWR) collected information on the Cache River channel velocities, ground-water elevations in the area, channel geometry, water-surface profiles, soil- structural characteristics, biologic effects on stream- bank stability, streambank-progression rates, and stream channel changes. Soil-structural characteristics
Introduction
°57' 88°53'30'37°22'30"
37°19'30"
Discontinued ) /streamflow-
in station
/Cache River \at Form an
I State Natural Area / l"!!?°l® rtx / Site Headquarters/ (03612000)
Cache River
Area of enlargement
1.5 miles to Post Creek Cutoff
I
EXPLANATION
WETLAND
i VI VELOCITY CROSS SECTION AND DESIGNATION
G2 GEOMORPHIC CROSS SECTION AND DESIGNATION
Base from U.S. Geological Survey1:100,000 Digital DataAlbers Equal-Area Conic ProjectionStandard parallels 33' and 45°, central meridian -89'
0.5 1MILE
0.5 1 KILOMETER
Figure 1. Cache River/Heron Pond area in southern Illinois, and velocity and geomorphic cross sections.
2 Hydraulic, Geotechnical, Geomorphic, and Biologic Data for the Cache River/Heron Pond Area in Southern Illinois
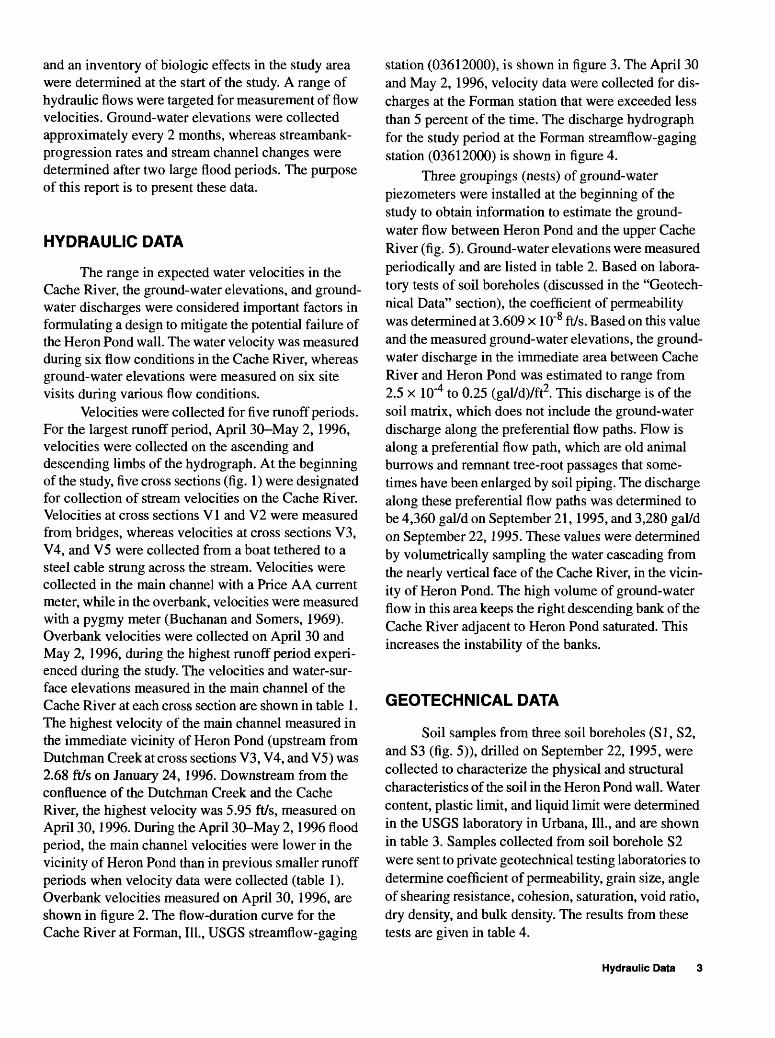
and an inventory of biologic effects in the study area were determined at the start of the study. A range of hydraulic flows were targeted for measurement of flow velocities. Ground-water elevations were collected approximately every 2 months, whereas streambank- progression rates and stream channel changes were determined after two large flood periods. The purpose of this report is to present these data.
HYDRAULIC DATA
The range in expected water velocities in the Cache River, the ground-water elevations, and ground- water discharges were considered important factors in formulating a design to mitigate the potential failure of the Heron Pond wall. The water velocity was measured during six flow conditions in the Cache River, whereas ground-water elevations were measured on six site visits during various flow conditions.
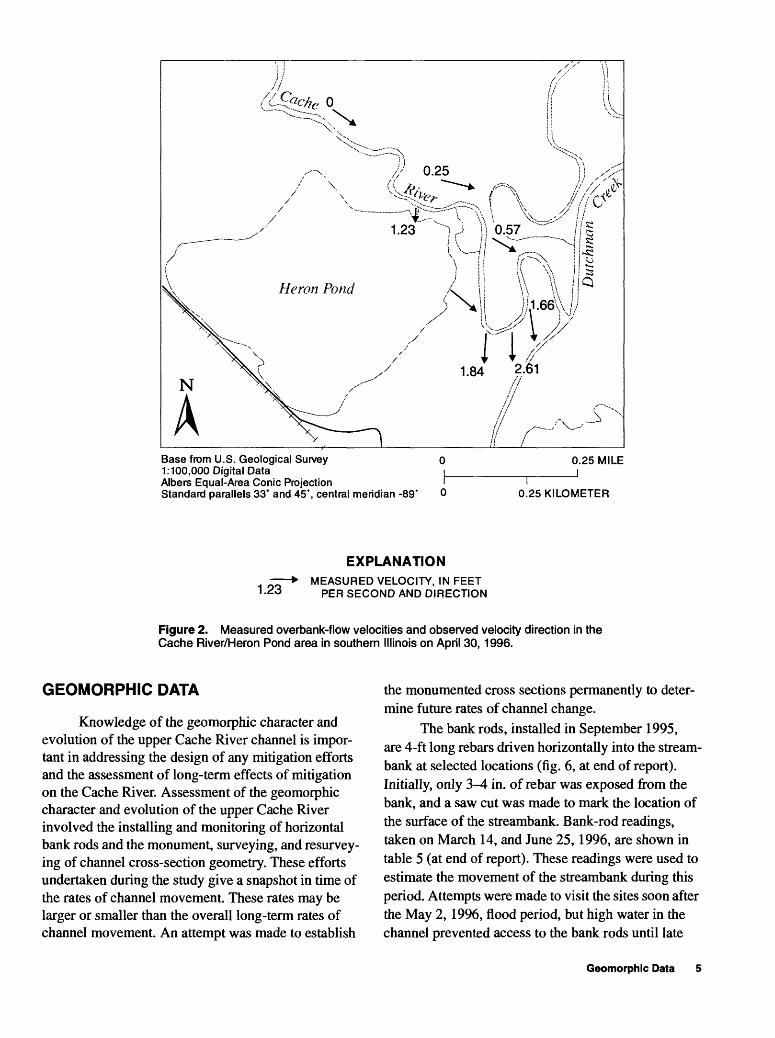
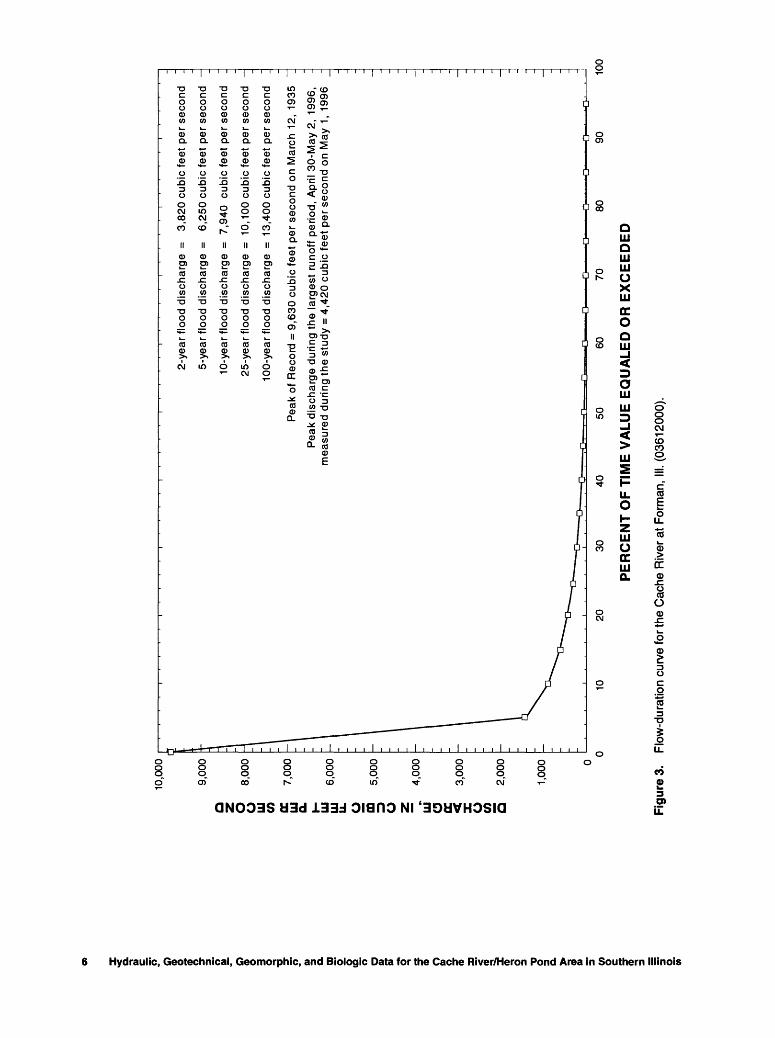
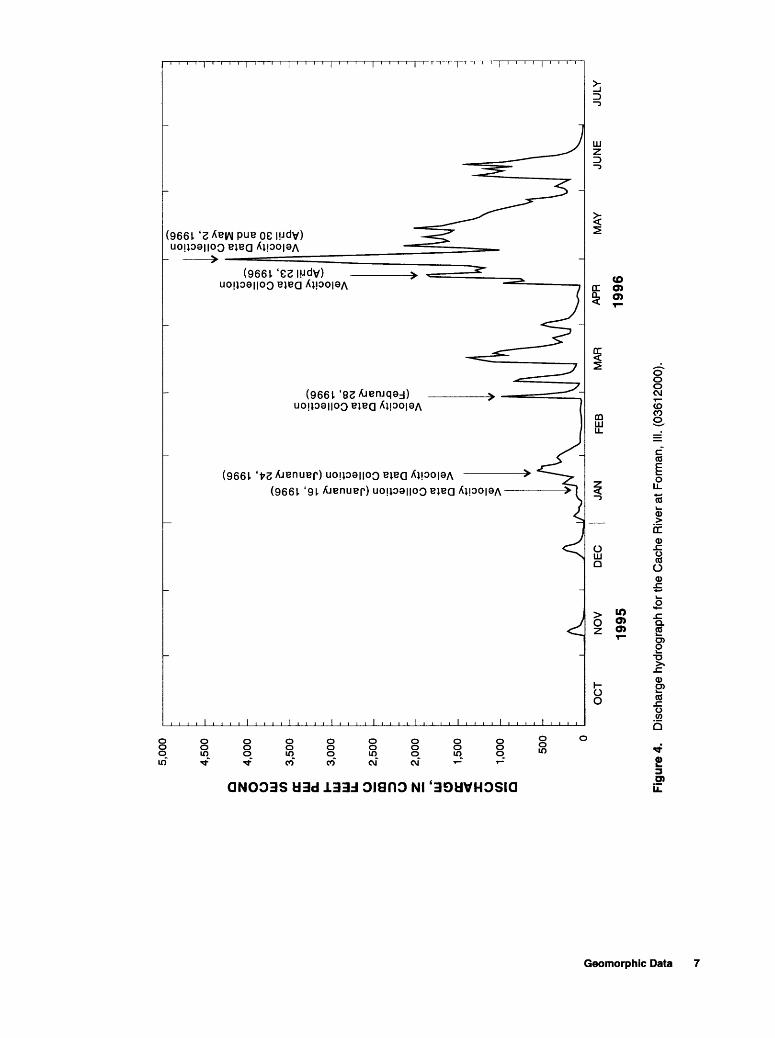
Velocities were collected for five runoff periods. For the largest runoff period, April 30 May 2, 1996, velocities were collected on the ascending and descending limbs of the hydrograph. At the beginning of the study, five cross sections (fig. 1) were designated for collection of stream velocities on the Cache River. Velocities at cross sections VI and V2 were measured from bridges, whereas velocities at cross sections V3, V4, and V5 were collected from a boat tethered to a steel cable strung across the stream. Velocities were collected in the main channel with a Price AA current meter, while in the overbank, velocities were measured with a pygmy meter (Buchanan and Somers, 1969). Overbank velocities were collected on April 30 and May 2, 1996, during the highest runoff period experi enced during the study. The velocities and water-sur face elevations measured in the main channel of the Cache River at each cross section are shown in table 1. The highest velocity of the main channel measured in the immediate vicinity of Heron Pond (upstream from Dutchman Creek at cross sections V3, V4, and V5) was 2.68 ft/s on January 24,1996. Downstream from the confluence of the Dutchman Creek and the Cache River, the highest velocity was 5.95 ft/s, measured on April 30,1996. During the April 30-May 2,1996 flood period, the main channel velocities were lower in the vicinity of Heron Pond than in previous smaller runoff periods when velocity data were collected (table 1). Overbank velocities measured on April 30,1996, are shown in figure 2. The flow-duration curve for the Cache River at Forman, 111., USGS streamflow-gaging
station (03612000), is shown in figure 3. The April 30 and May 2, 1996, velocity data were collected for dis charges at the Forman station that were exceeded less than 5 percent of the time. The discharge hydrograph for the study period at the Forman streamflow-gaging station (03612000) is shown in figure 4.
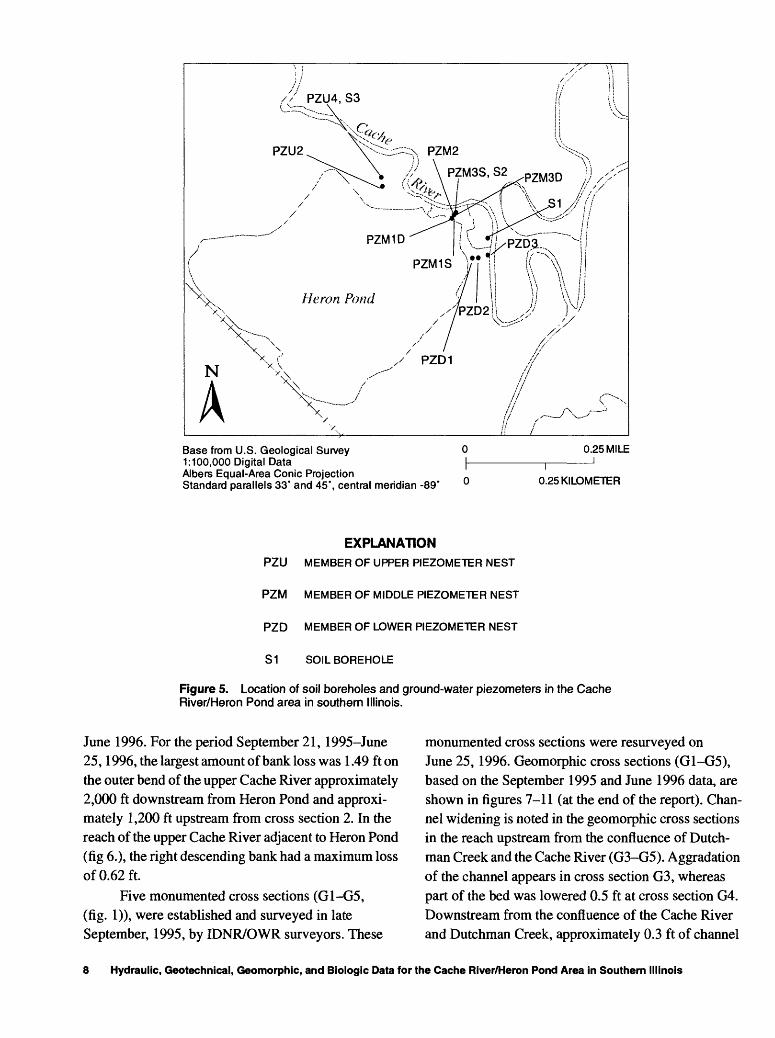
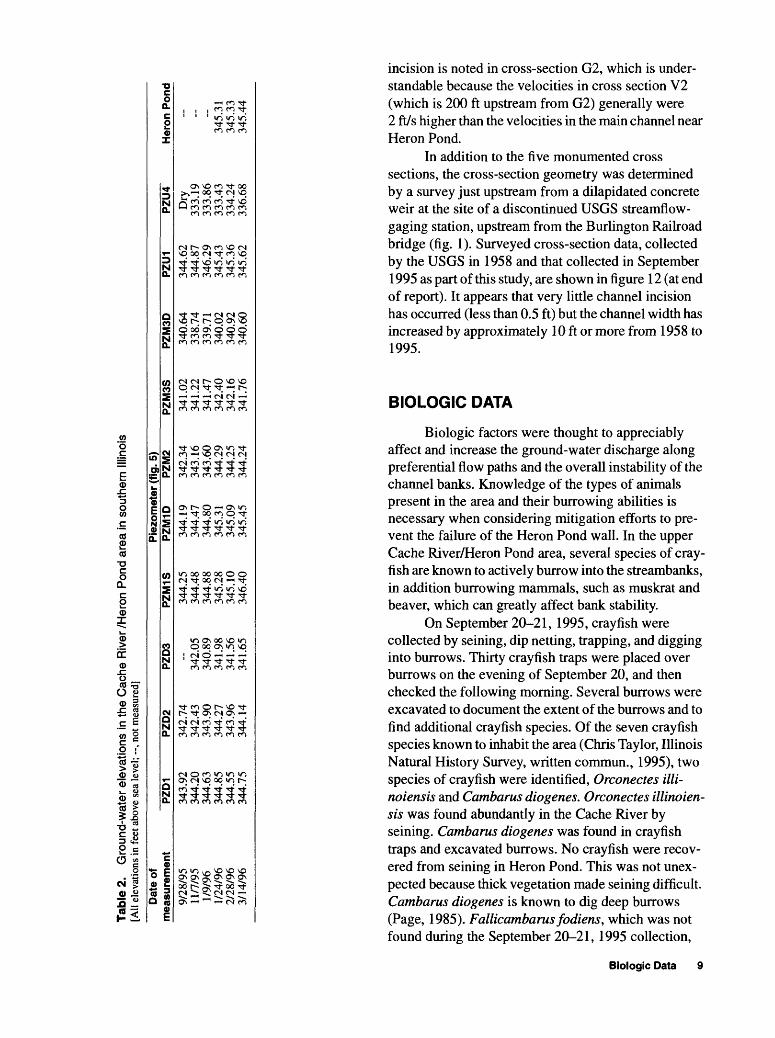
Three groupings (nests) of ground-water piezometers were installed at the beginning of the study to obtain information to estimate the ground- water flow between Heron Pond and the upper Cache River (fig. 5). Ground-water elevations were measured periodically and are listed in table 2. Based on labora tory tests of soil boreholes (discussed in the "Geotech- nical Data" section), the coefficient of permeability was determined at 3.609 x 10"8 ft/s. Based on this value and the measured ground-water elevations, the ground- water discharge in the immediate area between Cache River and Heron Pond was estimated to range from 2.5 x 10'4 to 0.25 (gal/d)/ft2. This discharge is of the soil matrix, which does not include the ground-water discharge along the preferential flow paths. Flow is along a preferential flow path, which are old animal burrows and remnant tree-root passages that some times have been enlarged by soil piping. The discharge along these preferential flow paths was determined to be 4,360 gal/d on September 21,1995, and 3,280 gal/d on September 22,1995. These values were determined by volumetrically sampling the water cascading from the nearly vertical face of the Cache River, in the vicin ity of Heron Pond. The high volume of ground-water flow in this area keeps the right descending bank of the Cache River adjacent to Heron Pond saturated. This increases the instability of the banks.
GEOTECHNICAL DATA
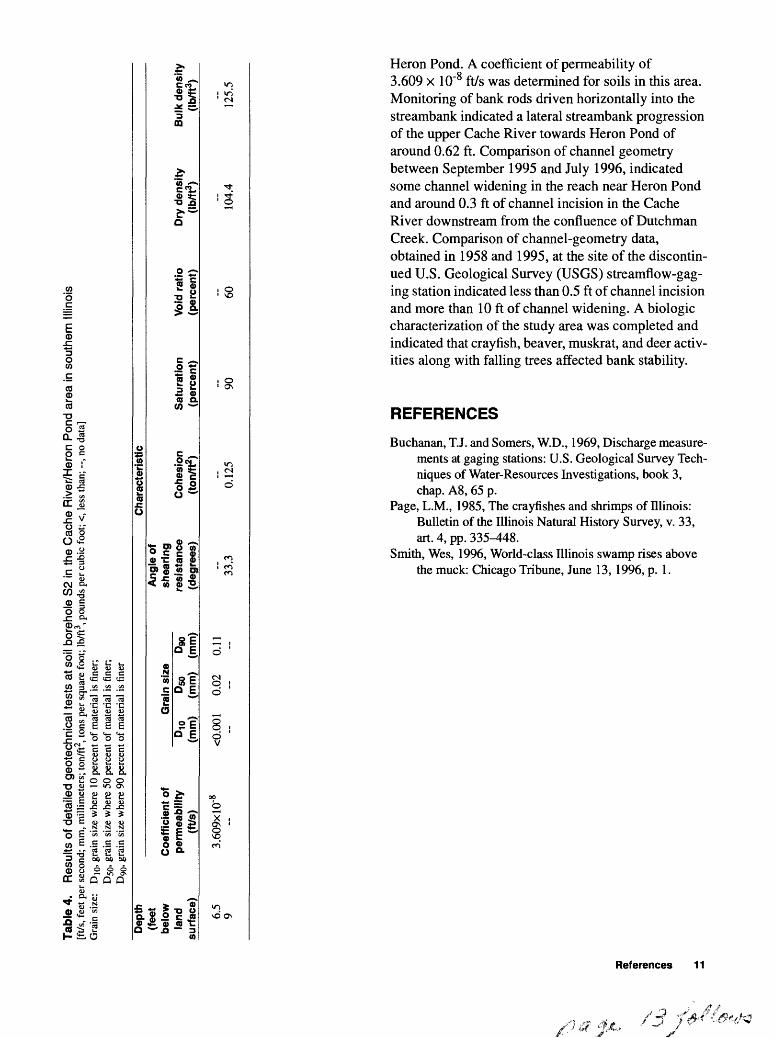
Soil samples from three soil boreholes (SI, S2, and S3 (fig. 5)), drilled on September 22, 1995, were collected to characterize the physical and structural characteristics of the soil in the Heron Pond wall. Water content, plastic limit, and liquid limit were determined in the USGS laboratory in Urbana, 111., and are shown in table 3. Samples collected from soil borehole S2 were sent to private geotechnical testing laboratories to determine coefficient of permeability, grain size, angle of shearing resistance, cohesion, saturation, void ratio, dry density, and bulk density. The results from these tests are given in table 4.
Hydraulic Data
CO'o.c
£.c 50(ncCO£CO
T3
0Q.C2 0i0>
'CL
0>.csO
£c _~ eS T3 td<D T3
0 ° . »
0 'o -a2 SCO H"D 35
. £"£
8 8§*^T3 £
«l<u~ 8 2>8
58.o IT(0 u~ ,0T3 <*->
_ oC !S 2 3W af
4$>%
0) "o £ro M
Q) O75 °^ o
^}
T-' D
<D &o
11i- 5,
a
JexQ
1
0
5 S a eo ^J -5 "^IM518§££r- C <* «
§ S o1*160 E £
C/3 £ edO * S<*> & to
D # |*-> T" >C jD 0g « §T 2 u3 £ £c3 c5 c5
> > >
L:J5
|C
1oS
oU
P0-,
Heron Pond ent to Heror
o c5
sft> -.a 1 ̂ -» CQ
"S ^-c S
IIU T3
J3 Cc: u° 11> CQ
=5 S a to'e ^E 3u u £ £e3 e3
> >
**. =^8S5|» c $: -> ^
J£i1 C . k. (0 ^^0 OJ ^5 Wo « *- ^^ C f !&
> 5>^-
1*.E S 5. . o ^x ~ £ a » ^^S >
a>0)^«^
It(0 *~*
0
8 o SSf3 » -Q m(fl (0 (0 S
» ^ 1? §« 5 »
1 ^
E cm ° °O^-g^c E 9 T£ii!l5 «i
3 0
**
a>o E o S.- 0)1- a
£
*-c
if5 »i
. ^ >-<» o 28 .S ^ w « E6 S g
en O CN en CN o o r~ H f\) H 1
^i- r- o NOCN vo m ir 1 CN » ' j
NO CS OONO r~ o in<N CN ~ ~ j
1 . . . .ON ' ' ' '
m o ON o"-i vo OO CNo <!fr -^ NO i CN en en enen en en en
OOOOOOO CN CN CN
O*cN*en «nCN CN CN CN
8 in CN en CN m CN i en en --3- '
NO NO NO NO NO
« CN en ^ m
oo in o oo --tf ON ON oo in --tfCN r 1 r 1 r 1
OO CN ON T-H CNen r- CN o NO < CN < ' * ' ' '
r-~ r- Q oo oOO CN O NO OOen Tf CN CN '-i
in r~> CN *-H r-OO ^5 NO NO ^~*in NO en en en
CN r- CN NO o « O oo O NO ^ r- OO ON ON CN en en en enen en en en en
OOOOO00 CN CN CN«n ON r- ^O (N en «n
£§§!§
ON ON ON ON ON
>££££
r- oo NO r- '-iON f~ NO "-i ONen CN '-i
CN CN NO in r-in Tf oo CN enr I CN > < * '
en Tf CN en O oo ^ NO en r-rj- -^ CN r-,
O -^ CN O NO
T r
oo in r- NO en O "* NO ON -^1-t~- ON ON ON O CN en en en -^1-m en en en en
OOOOO «n ON r- -HO (N en «n
oo oo oo in in < en * S « NO m -^
ON ON ON ON ON OO OO OO OO OO CN CN CN CN CNCN CN CN" CN CN
>222£
NO en oo ON NO Tf ON CN oo CNCN i 1 r ll
en in CN O ooNO --3- en ONen en *-* j
oo in oo O oo oo en O r- ONin in CN '-i |
o o ON NO r- i -3- r- ON NO r-^ in^ r- NO inCN'CN
en r- o oo * o in * oo en ^ NOO en en ^ ̂ inen en en en en en
OOOOO j00 CN CN CN«n ON r- 'O CN en «n
O 0 O O t~- O CN O ^ CN CN OO CN O in oo O
ON ON ON ON ON ON en en ^ en en ^CN CN CN CN JN CN^^^^^^
TJCO
< CN en ^ in &*
uffi
NO NO t~- ^f Or~ r-H en NO r- en ^< |
en NO r- ONO ON ON Tf ONCN CN j
m CN o r-in en *-* j
NO ^ NO r~- ^ ' o\ o^Npjr-jr-
oo CN NO NO in oo -3- r- oo NOen NO r- j t~- r-en en en en en
OOOOO |00 CN CN CN>n ON r-; »-^
CN CN CN CN
§ o o in «n o CN CN en CN en en ON oo r- r-
ON ON ON ON ON ON
O O O O O O
-* * * ^ * *
aco
CN en -t m ^ >»» §
UN
X
ON ON r- m "tf ON in -^l- OO --tfr I CN i < *'
OO ON « ONO in O ON NO
ON o r- "-i moo NO NO ON r~in en ̂ j
O in oo ON j OO ON CN -^ r-
en CN r-T~ T
CN en in O ^- en en r- -^l-in NO r- j r- r- en ^~ ^~ ^~ "^en en en en en
OOOOO ! OO CN (N CNin ON r-^ i O*cN*enin(N CN (N CN
O in in ON -!fr r- in in en O en Ot~- O O O ON r i
NO NO NO NO NO NO
In in in in in in
a
p~* CN en Tf in ^
SX
Hydraulic, Geotechnical, Geomorphic, and Biologic Data for the Cache River/Heron Pond Area in Southern Illinois
1.23 ^J> \\ 0.57
Base from U.S. Geological Survey o1:100,000 Digital Data i_Albers Equal-Area Conic Projection IStandard parallels 33* and 45°, central meridian -89° 0
0.25 MILE
0.25 KILOMETER
1.23
EXPLANATIONMEASURED VELOCITY, IN FEET
PER SECOND AND DIRECTION
Figure 2. Measured overbank-flow velocities and observed velocity direction in the Cache River/Heron Pond area in southern Illinois on April 30,1996.
GEOMORPHIC DATA
Knowledge of the geomorphic character and evolution of the upper Cache River channel is impor tant in addressing the design of any mitigation efforts and the assessment of long-term effects of mitigation on the Cache River. Assessment of the geomorphic character and evolution of the upper Cache River involved the installing and monitoring of horizontal bank rods and the monument, surveying, and resurvey- ing of channel cross-section geometry. These efforts undertaken during the study give a snapshot in time of the rates of channel movement. These rates may be larger or smaller than the overall long-term rates of channel movement. An attempt was made to establish
the monumented cross sections permanently to deter mine future rates of channel change.
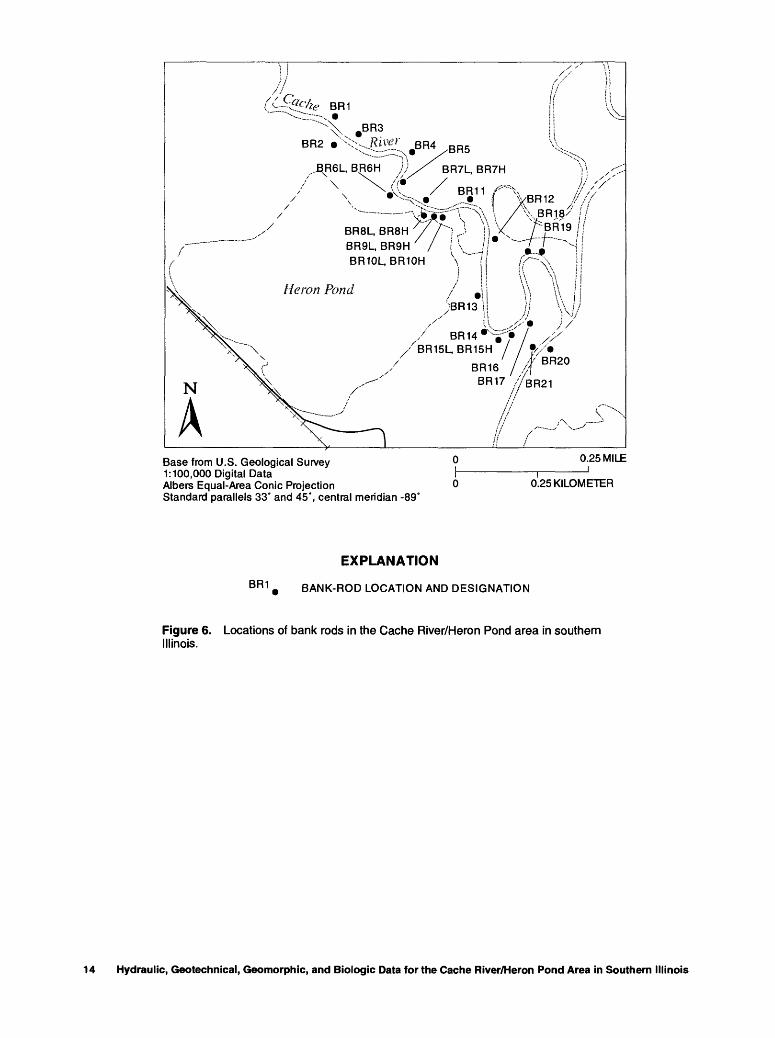
The bank rods, installed in September 1995, are 4-ft long rebars driven horizontally into the stream- bank at selected locations (fig. 6, at end of report). Initially, only 3-4 in. of rebar was exposed from the bank, and a saw cut was made to mark the location of the surface of the streambank. Bank-rod readings, taken on March 14, and June 25, 1996, are shown in table 5 (at end of report). These readings were used to estimate the movement of the streambank during this period. Attempts were made to visit the sites soon after the May 2, 1996, flood period, but high water in the channel prevented access to the bank rods until late
Geomorphic Data
I c 0> Q.
00 5' o I a 3 o> 5' CO o CD 3 O »'
10,0
00
2-y
ea
r flo
od d
isch
arg
e =
3
,82
0 c
ub
ic f
ee
t p
er
seco
nd
5-y
ear
floo
d d
isch
arg
e =
6
,25
0 c
ubic
feet
pe
r se
con
d
10-y
ear
floo
d d
isch
arg
e =
7
,94
0
cubic
fe
et
pe
r se
con
d
25-y
ear
flood d
isch
arg
e =
10
,100
cubic
feet
pe
r se
con
d
10
0-y
ea
r flo
od d
isch
arg
e =
13
,400
cubic
feet
pe
r se
con
d
Pea
k of
Rec
ord
= 9
,63
0 c
ubic
feet
pe
r se
con
d o
n M
arch
12,
193
5
Pea
k d
isch
arg
e d
uring t
he
larg
est
ru
no
ff p
eriod,
Apr
il 30-M
ay
2, 1
996,
m
easu
red d
urin
g t
he
stu
dy
= 4
,42
0 c
ubic
feet
pe
r se
con
d o
n M
ay 1
, 19
96
1020
30
40
50
60
70
80
PE
RC
EN
T O
F T
IME
VA
LU
E E
QU
AL
ED
OR
EX
CE
ED
ED
90
Figu
re 3
. Fl
ow-d
urat
ion
curv
e fo
r the
Cac
he R
iver
at
Form
an,
III. (
0361
2000
).
100
n (5*DISCHARGE, IN CUBIC FEET PER SECOND
en o o
en o o
en o o
COen o o8
en o o
01 "o
8
CQ CD
3"O
CD
O
ICD3J
oCO O)
IV)o o o
o o
(O z£ o 01 <
D m O
to(O O)
c z m
Velocity Data Collection (January 16,1996)< Velocity Data Collection (January 24,1996)
Velocity Data Collection (February 28,1996)
Velocity Data Collection (April 23, 1996)
Velocity Data Collection (April 30 and May 2,1996)
// PZU4, S3
PZU2 :^ir^s PZM2 v
L. \ P?M3S ' S2^PZM3D
PZM1D
Heron Pond
/ PZD1
Base from U.S. Geological Survey 0 1:100,000 Digital Data \- Albers Equal-Area Conic Projection Standard parallels 33' and 45', central meridian -89' °
0.25 MILE
0.25 KILOMETER
EXPLANATION
PZU MEMBER OF UPPER PIEZOMETER NEST
PZM MEMBER OF MIDDLE PIEZOMETER NEST
PZD MEMBER OF LOWER PIEZOMETER NEST
S1 SOIL BOREHOLE
Figure 5. Location of soil boreholes and ground-water piezometers in the Cache River/Heron Pond area in southern Illinois.
June 1996. For the period September 21, 1995-June 25,1996, the largest amount of bank loss was 1.49 ft on the outer bend of the upper Cache River approximately 2,000 ft downstream from Heron Pond and approxi mately 1,200 ft upstream from cross section 2. In the reach of the upper Cache River adjacent to Heron Pond (fig 6.), the right descending bank had a maximum loss of 0.62 ft.
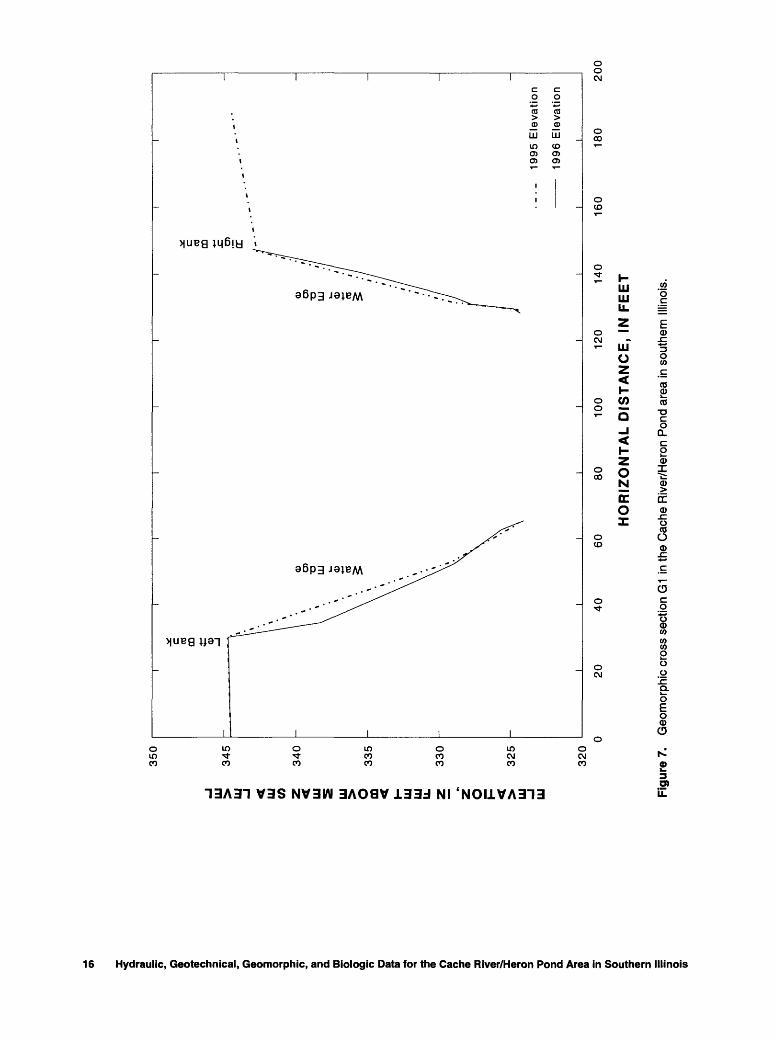
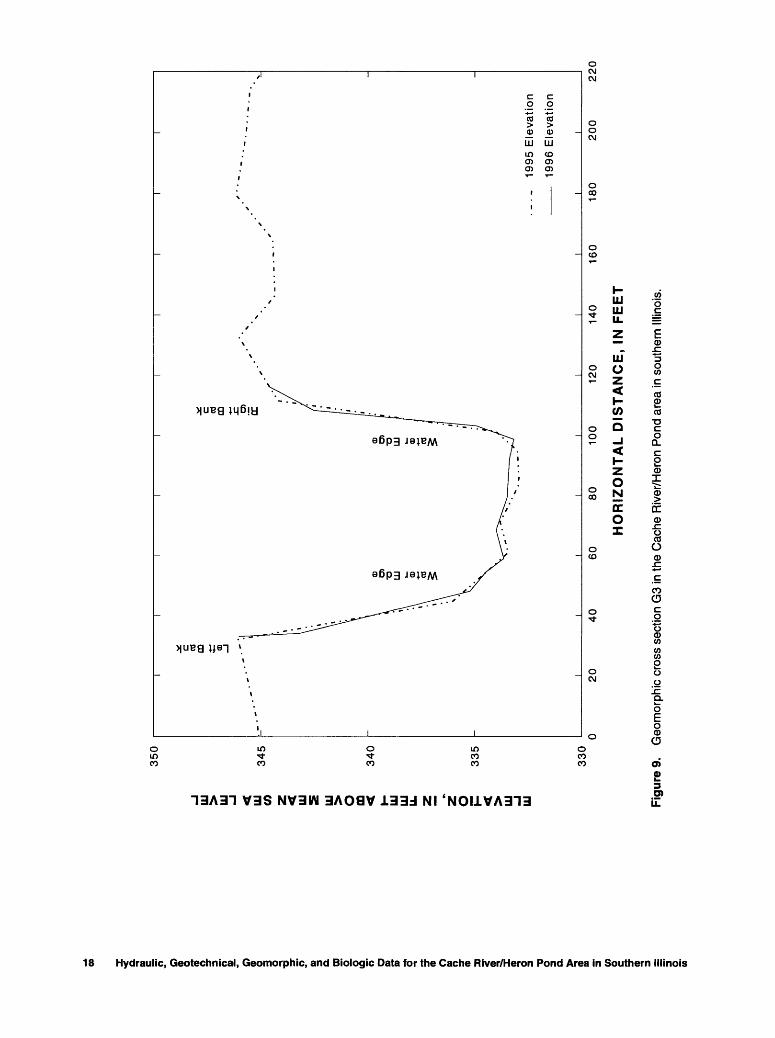
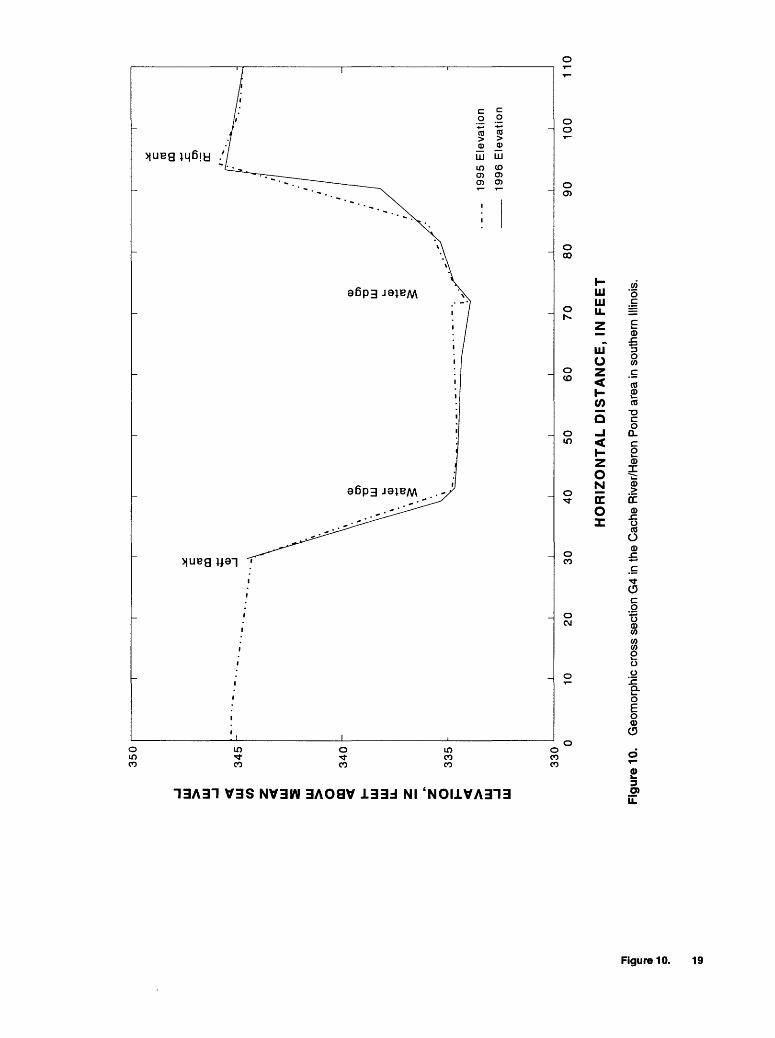
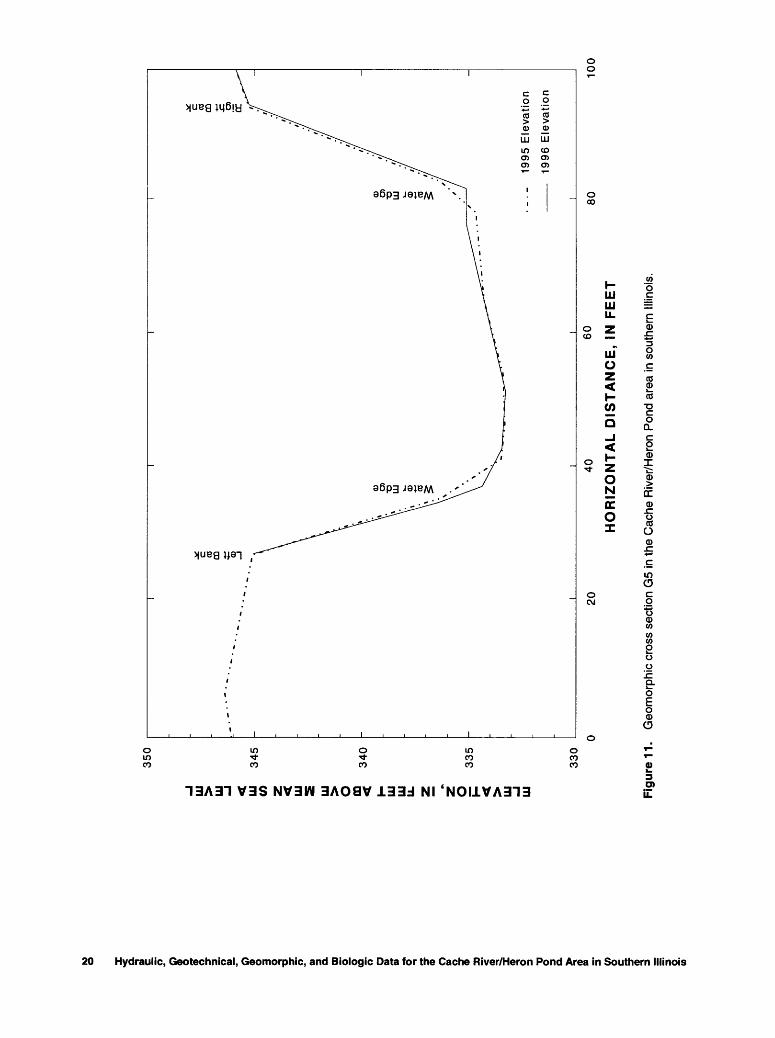
Five monumented cross sections (G1-G5, (fig. 1)), were established and surveyed in late September, 1995, by IDNR/OWR surveyors. These
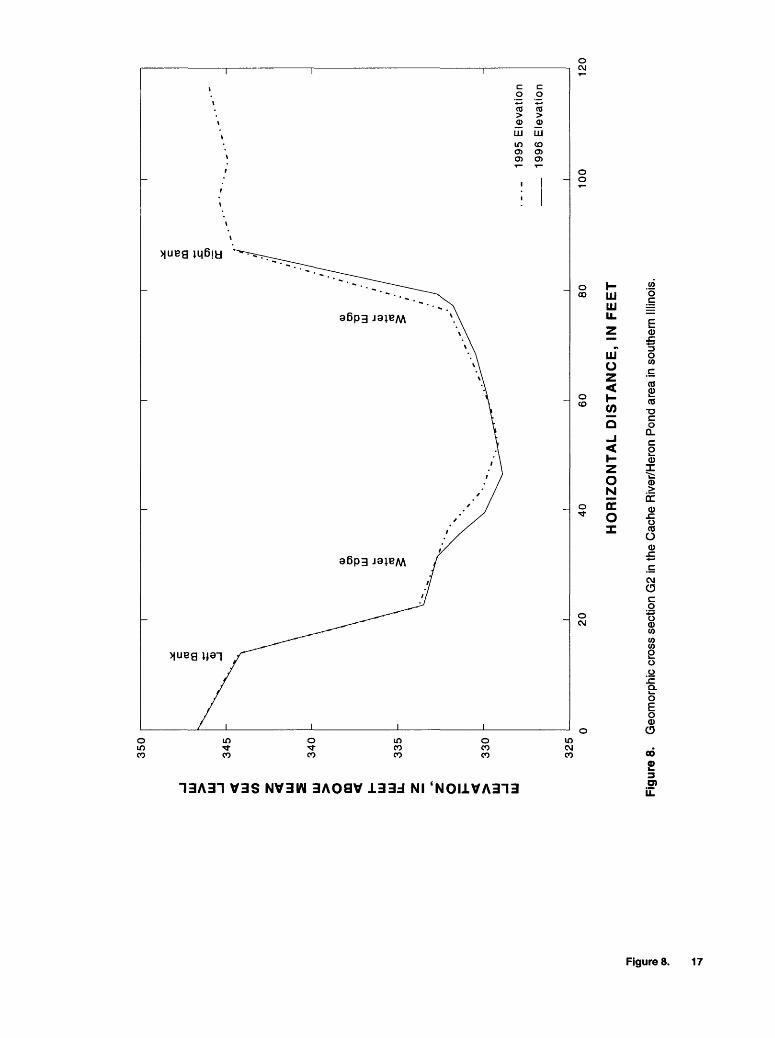
monumented cross sections were resurveyed on June 25, 1996. Geomorphic cross sections (G1-G5), based on the September 1995 and June 1996 data, are shown in figures 7-11 (at the end of the report). Chan nel widening is noted in the geomorphic cross sections in the reach upstream from the confluence of Dutch man Creek and the Cache River (G3-G5). Aggradation of the channel appears in cross section G3, whereas part of the bed was lowered 0.5 ft at cross section G4. Downstream from the confluence of the Cache River and Dutchman Creek, approximately 0.3 ft of channel
8 Hydraulic, Geotechnical, Geomorphic, and Biologic Data for the Cache River/Heron Pond Area in Southern Illinois
CO"o
£CD
-C3
8_CO CDCO
O0_CgCDI
CD
(fCD.CO
ofV |
c igl.2 !
CD u® "5
&.jP ,jj
05 >? -§"O ^c **o t=O
'cn
g«_O
Ol f
0 JS3 «l_ < ,
10
.SPi.00E°0
Q.
5
0CBQ
T3COQ.C80x
«tD
T-13^1
0CO5o!
(0CO5°-
CM
i
oi£
(0
iOL,
COONQ.
CM
NQ.
i ONQ.
"c0
1(0 <00E
-H en ^t i i i en en -^t' ' ' >n <n <n
en en en
ON vo en ^t oo >^-^ oq ^ CN vq
Qu en en en rt vo en en en en enen en en en en
CN f- ON en vo CNvo oo CN ^ en voTJ- ^t vo <n <n <n^^ ^^ ^^ ^^ ^^ ^^en en en en en en
S 1* * « CN CN O C** C** f^ ON vo
O 00 ON O O O ^- en en ^ ^ ̂ i"en en en en en en
CN CN r- O VO VO O CN -<t * "^ C--^H ~* ~* CN CN i
en en en en en en
^ vo Q ON <n -?t en i *O CN CN CNCN en en ^ ̂ ̂
en en en en en en
ON f- O '-i ON <n i ^t oo en O -*t^ TJ- ^I <n in <nen en en en en en
<n oo oo oo O OCN * 00 CN -H -<tT^- T^- Tt >/-)>/-) VQ
en en en en en en
</ > ON oo vo >nO oo ON <n vo
! (N O -H *->
en en en en en
r- -^ ON CN ON -^CN CN en TJ en ^
en en en en en rn
CN O en >n >n »n ON CN VO 00 >n f~-m ^1" ^1" ^1" ^1" TJ-"^" ^ ̂ ̂ ̂ ̂ Ten en en en en en
<n <n yo vo vo vo ON ON Q^ ON ON ON00 f- Q^ ^ 00 ^f
ON * « "^ ^ CN en
incision is noted in cross-section G2, which is under standable because the velocities in cross section V2 (which is 200 ft upstream from G2) generally were 2 ft/s higher than the velocities in the main channel near Heron Pond.
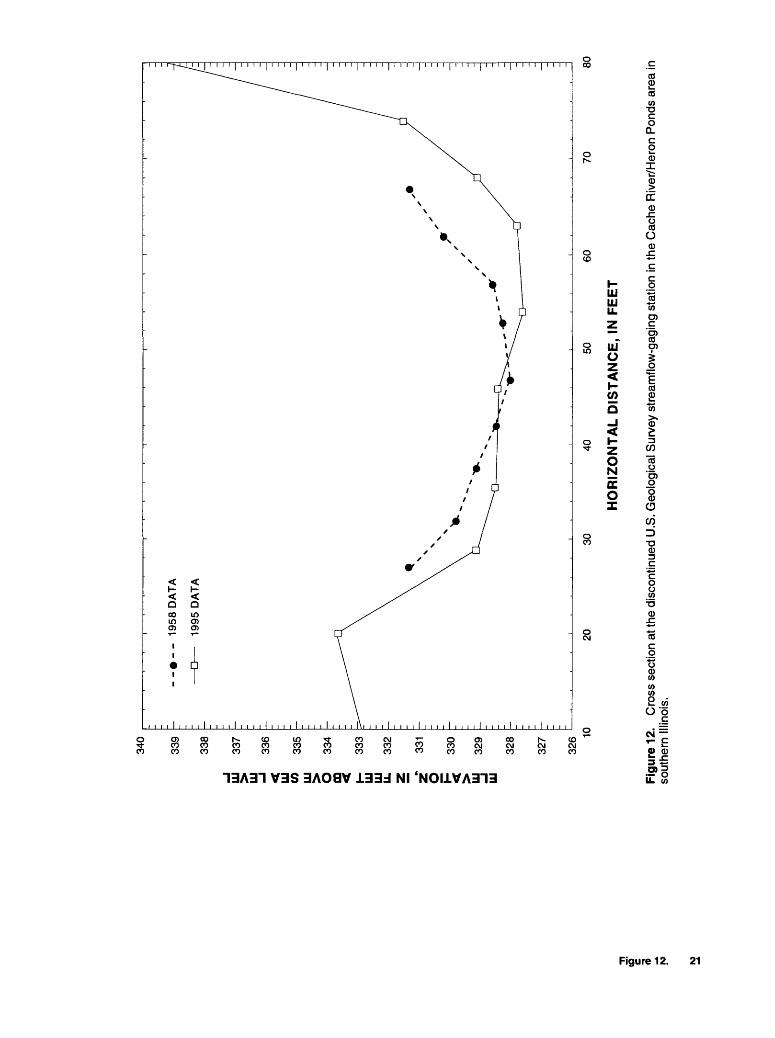
In addition to the five monumented cross sections, the cross-section geometry was determined by a survey just upstream from a dilapidated concrete weir at the site of a discontinued USGS streamflow- gaging station, upstream from the Burlington Railroad bridge (fig. 1). Surveyed cross-section data, collected by the USGS in 1958 and that collected in September 1995 as part of this study, are shown in figure 12 (at end of report). It appears that very little channel incision has occurred (less than 0.5 ft) but the channel width has increased by approximately 10 ft or more from 1958 to 1995.
BIOLOGIC DATA
Biologic factors were thought to appreciably affect and increase the ground-water discharge along preferential flow paths and the overall instability of the channel banks. Knowledge of the types of animals present in the area and their burrowing abilities is necessary when considering mitigation efforts to pre vent the failure of the Heron Pond wall. In the upper Cache River/Heron Pond area, several species of cray fish are known to actively burrow into the streambanks, in addition burrowing mammals, such as muskrat and beaver, which can greatly affect bank stability.
On September 20-21, 1995, crayfish were collected by seining, dip netting, trapping, and digging into burrows. Thirty crayfish traps were placed over burrows on the evening of September 20, and then checked the following morning. Several burrows were excavated to document the extent of the burrows and to find additional crayfish species. Of the seven crayfish species known to inhabit the area (Chris Taylor, Illinois Natural History Survey, written commun., 1995), two species of crayfish were identified, Orconectes illi- noiensis and Cambarus diogenes. Orconectes illinoien- sis was found abundantly in the Cache River by seining. Cambarus diogenes was found in crayfish traps and excavated burrows. No crayfish were recov ered from seining in Heron Pond. This was not unex pected because thick vegetation made seining difficult. Cambarus diogenes is known to dig deep burrows (Page, 1985). Fallicambarusfodiens, which was not found during the September 20-21, 1995 collection,
Biologic Data 9
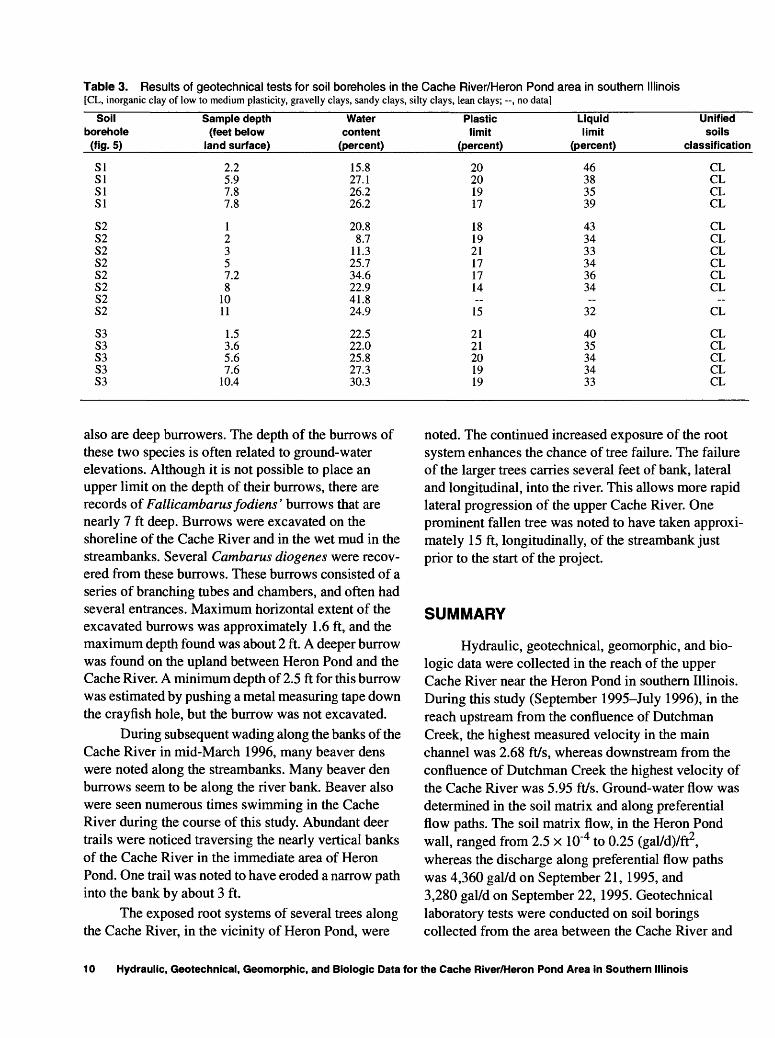
Table 3. Results of geotechnical tests for soil boreholes in the Cache River/Heron Pond area in southern Illinois[CL, inorganic clay of low to medium plasticity, gravelly clays, sandy clays, silty clays, lean clays; , no data]
Soil borehole(fig. 5)
SISISISI
S2S2S2S2S2S2S2S2
S3S3S3S3S3
Sample depth (feet below
land surface)
2.25.97.87.8
12357.28
1011
1.53.65.67.6
10.4
Water content
(percent)
15.827.126.226.2
20.88.7
11.325.734.622.941.824.9
22.522.025.827.330.3
Plastic limit
(percent)
20201917
181921171714
15
2121201919
Liquid limit
(percent)
46383539
433433343634
32
4035343433
Unified soils
classification
CLCLCLCL
CLCLCLCLCLCL
CL
CLCLCLCLCL
also are deep borrowers. The depth of the burrows of these two species is often related to ground-water elevations. Although it is not possible to place an upper limit on the depth of their burrows, there are records of Fallicambarus fodiens' burrows that are nearly 7 ft deep. Burrows were excavated on the shoreline of the Cache River and in the wet mud in the streambanks. Several Cambarus diogenes were recov ered from these burrows. These burrows consisted of a series of branching tubes and chambers, and often had several entrances. Maximum horizontal extent of the excavated burrows was approximately 1.6 ft, and the maximum depth found was about 2 ft. A deeper burrow was found on the upland between Heron Pond and the Cache River. A minimum depth of 2.5 ft for this burrow was estimated by pushing a metal measuring tape down the crayfish hole, but the burrow was not excavated.
During subsequent wading along the banks of the Cache River in mid-March 1996, many beaver dens were noted along the streambanks. Many beaver den burrows seem to be along the river bank. Beaver also were seen numerous times swimming in the Cache River during the course of this study. Abundant deer trails were noticed traversing the nearly vertical banks of the Cache River in the immediate area of Heron Pond. One trail was noted to have eroded a narrow path into the bank by about 3 ft.
The exposed root systems of several trees along the Cache River, in the vicinity of Heron Pond, were
noted. The continued increased exposure of the root system enhances the chance of tree failure. The failure of the larger trees carries several feet of bank, lateral and longitudinal, into the river. This allows more rapid lateral progression of the upper Cache River. One prominent fallen tree was noted to have taken approxi mately 15 ft, longitudinally, of the streambank just prior to the start of the project.
SUMMARY
Hydraulic, geotechnical, geomorphic, and bio logic data were collected in the reach of the upper Cache River near the Heron Pond in southern Illinois. During this study (September 1995-July 1996), in the reach upstream from the confluence of Dutchman Creek, the highest measured velocity in the main channel was 2.68 ft/s, whereas downstream from the confluence of Dutchman Creek the highest velocity of the Cache River was 5.95 ft/s. Ground-water flow was determined in the soil matrix and along preferential flow paths. The soil matrix flow, in the Heron Pond wall, ranged from 2.5 x 10'4 to 0.25 (gal/d)/ft2 , whereas the discharge along preferential flow paths was 4,360 gal/d on September 21,1995, and 3,280 gal/d on September 22, 1995. Geotechnical laboratory tests were conducted on soil borings collected from the area between the Cache River and
10 Hydraulic, Geotechnical, Geomorphic, and Biologic Data for the Cache River/Heron Pond Area in Southern Illinois
CO"oc
£CD"3oCOC
CO£CO
T3C ' io 2n &C 02 c.CD :
"C: cs
if 1JB V*O iT
Ol
CD .a~^~ 3
C g
CVJ &
®10 5
ll"5 3 .. ..w £ S3 S3 S3 g jj c c c
CO a .23 .23 .23 52 «* 13 13 13£ % -c -c -c
| l|| 1 _c *t *S *S ofl\ <£N C C C
S 2 III01 S2 o o o^^ <U »-H IO ^
0) W <U fli <U » C ttj <D <D CO 3 J3 J= J= 5 1 * * *
M * .H .H .2 Q c '»» 'S3 'S3co E .§ .5 .5 -cT S 2 23 Q GO GO GO
g 8 0 0 g
OC « Q Q Q
|rfl
H ^o
_ow
12(0
6
« ^Cn
3 ffi
tc"O .a
Q
0 j?
2 i^ wT3 v. i 3
S c-.2 c1 ^^ 0)<a a.(0 ""
c _.2"^(0 ?» c0 *
o i* § ?CO (Q CO
g> S .2 g>i_ "**"
~
Q ECON **.
cQ E 2 ~O
Q",E
ft -^o .g«^ !§ ^^
o ^o o.
0) H£ "55 to *t Q "-".a 30)
«s
^1 2
i Oi vo
' °
c>
i ^' S
_
d
CNO j O
§ :
00
0"x i1 'ro
3.
Heron Pond. A coefficient of permeability ofo
3.609 x 10 ft/s was determined for soils in this area. Monitoring of bank rods driven horizontally into the streambank indicated a lateral streambank progression of the upper Cache River towards Heron Pond of around 0.62 ft. Comparison of channel geometry between September 1995 and July 1996, indicated some channel widening in the reach near Heron Pond and around 0.3 ft of channel incision in the Cache River downstream from the confluence of Dutchman Creek. Comparison of channel-geometry data, obtained in 1958 and 1995, at the site of the discontin ued U.S. Geological Survey (USGS) streamflow-gag- ing station indicated less than 0.5 ft of channel incision and more than 10 ft of channel widening. A biologic characterization of the study area was completed and indicated that crayfish, beaver, muskrat, and deer activ ities along with falling trees affected bank stability.
REFERENCES
Buchanan, TJ. and Somers, W.D., 1969, Discharge measure ments at gaging stations: U.S. Geological Survey Tech niques of Water-Resources Investigations, book 3, chap. A8, 65 p.
Page, L.M., 1985, The crayfishes and shrimps of Illinois: Bulletin of the Illinois Natural History Survey, v. 33, art. 4, pp. 335-448.
Smith, Wes, 1996, World-class Illinois swamp rises above the muck: Chicago Tribune, June 13, 1996, p. 1.
References 11
TABLE 5
FIGURES 6-12
BR1
BR3BR2 BR5
,BR6H yV/ BR7L, BR7H\
BR8L, BR8H BR9L, BR9HBR10L, BR10H \
j
Heron Pond / J/ 9 \yBR13 \
II//i> /
\ ///\.BR18/ /
BR15L, BR15H // Af BR20
BR17 //BR21
Base from U.S. Geological Survey1:100,000 Digital DataAlbers Equal-Area Conic ProjectionStandard parallels 33° and 45', central meridian -89°
0.25 MILE
0.25 KILOMETER
BR1
EXPLANATION
BANK-ROD LOCATION AND DESIGNATION
Figure 6. Locations of bank rods in the Cache River/Heron Pond area in southern Illinois.
14 Hydraulic, Geotechnical, Geomorphic, and Biologic Data for the Cache River/Heron Pond Area in Southern Illinois
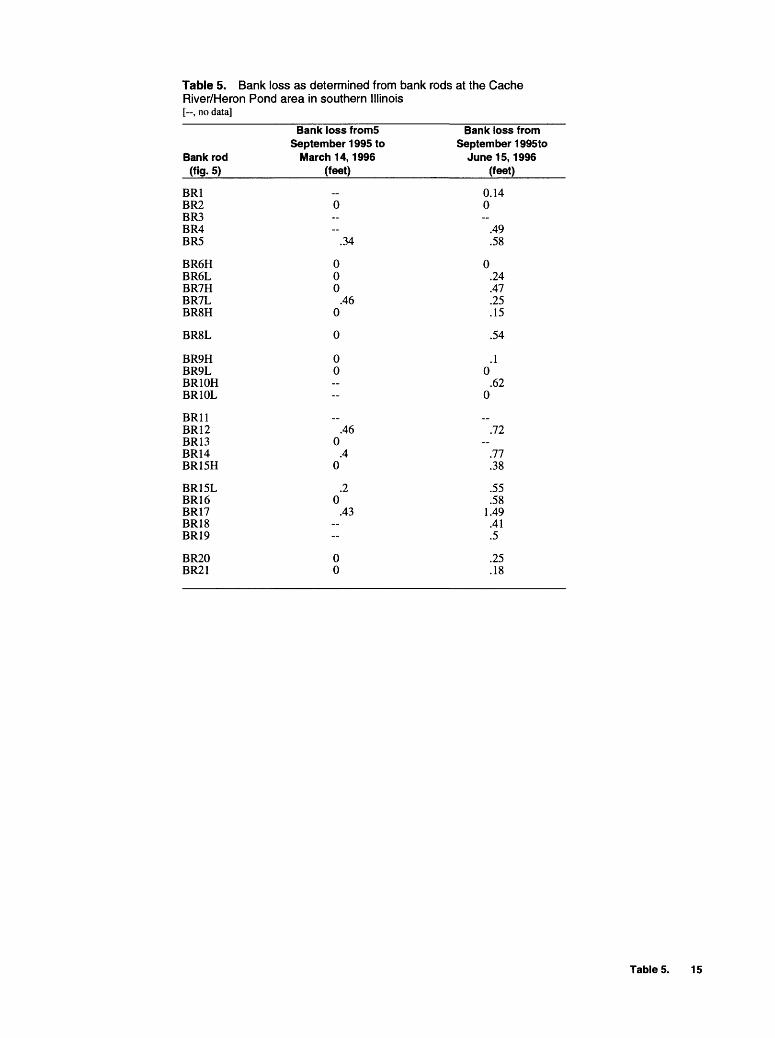
Table 5. Bank loss as determined from bank rods at the Cache River/Heron Pond area in southern Illinois[--, no data]
Bank rod(fig. 5)
BR1BR2BR3BR4BR5
BR6HBR6LBR7HBR7LBR8H
BR8L
BR9HBR9LBR10HBR10L
BR11BR12BR13BR14BR15H
BR15LBR16BR17BR18BR19
BR20BR21
Bank loss fromS September 1995 to
March 14, 1996 (feet)
..0
.34
000
.460
0
00 --
_.46
0.4
0
.20
.43 -
00
Bank loss from September 1995 to
June 15, 1996 (feet)
0.140
.49
.58
0.24.47.25.15
.54
.10
.620
_.72
.77.38
.55
.581.49
.41
.5
.25
.18
Tables. 15
0> a
oq
5] <§ o 0 I I a>
111
>
111
UJ 111 2
Ul O
CD < H
UJ
UJ u.
35
0
345
340
33
5
330
Z O H < >
325
UJ UJ
320
c CO
COc CO
CO g>
be
0 20
40
60
80
10
0 12
0 14
0
HO
RIZ
ON
TA
L D
IST
AN
CE
, IN
FE
ET
Figu
re 7
. G
eom
orph
ic c
ross
sec
tion
G1
in t
he C
ache
Riv
er/H
eron
Pon
d ar
ea in
sou
ther
n Ill
inoi
s.
. _ .
_ 19
95 E
leva
tion
1996
Ele
vatio
n
j_______i_
_____
160
180
200
350
(Q i OB
LU >
LU _J <
LU
(/> Z
<
LU 5 LU > o CD LU
LU
U.
LU _J
LU
345
340
33
5
330
325
20
40
60
80
HO
RIZ
ON
TA
L D
IST
AN
CE
, IN
FE
ET
Figu
re 8
. G
eom
orph
ic c
ross
sec
tion
G2
in th
e C
ache
Riv
er/H
eron
Pon
d ar
ea in
sou
ther
n Ill
inoi
s.
_ 19
95 E
leva
tion
._
1996
Ele
vatio
n
100
120
350
I 3 5' 2L O 8 u a
oq
5.' I 5' O o> sr s- 3D I
LLJ
>
LU _J <
LU
(/> Z
<
LU 2 LU > O
CD < I-
LU
LU Z
O LU _J
LU
345
340
335
330
c CO CDc CO
C
D
. -
1995
Ele
vatio
n
1996
Ele
vatio
n
0 2Q
40
60
80
10
0 12
0 14
0 16
0
HO
RIZ
ON
TA
L D
IST
AN
CE
, IN
FE
ET
Figu
re 9
. G
eom
orph
ic c
ross
sec
tion
G3
in th
e C
ache
Riv
er/H
eron
Pon
d ar
ea in
sou
ther
n Ill
inoi
s.
180
200
220
350
345
340
Ill
111 111 z 111 2
ill O
ffl I-
111
111
u. 2
335
<
>
111
_l
111
330
10
1995 E
levation
1996 E
levation
2030
(O I _k o
40
50
60
70
80
HO
RIZ
ON
TA
L D
IST
AN
CE
, IN
FE
ET
Figu
re 1
0.
Geo
mor
phic
cro
ss s
ectio
n G
4 in
the
Cac
he R
iver
/Her
on P
ond
area
in s
outh
ern
Illin
ois.
9010
011
0
p o 10) 0) a CO c n O 0) sr £» o if 3 <o
350
UJ
UJ
UJ
345
-
Z
UJ 5 UJ O 3
340
I-
UJ
UJ
335
UJ _l
UJ
330
- . -
1995 E
levation
19
96
Ele
vation
20
40
60
HO
RIZ
ON
TA
L D
IST
AN
CE
, IN
FE
ET
80
100
Fig
ure
11.
G
eom
orph
ic c
ross
sec
tion
G5
in t
he C
ache
Riv
er/H
eron
Pon
d ar
ea in
sou
ther
n Ill
inoi
s.
11
to' i
340
339
338
UJ
337
UJ -1
336
UJ UJ33
5
O
334
DO H
333
UJ UJ LL
332
Z O H
< UJ
331
330
329
328
327
326 10
1958
DA
TA
1995
DA
TA
2030
40
50
60
HO
RIZ
ON
TA
L D
IST
AN
CE
, IN
FE
ET
7080
Figu
re 1
2.
Cro
ss s
ectio
n at
the
disc
ontin
ued
U.S
. G
eolo
gica
l Sur
vey
stre
amflo
w-g
agin
g st
atio
n in
the
Cac
he R
iver
/Her
on P
onds
are
a in
so
uthe
rn I
llino
is.