Embed Size (px)
Citation preview
Working with our communities for a better environment E mahi ngatahi e pai ake ai te taiao
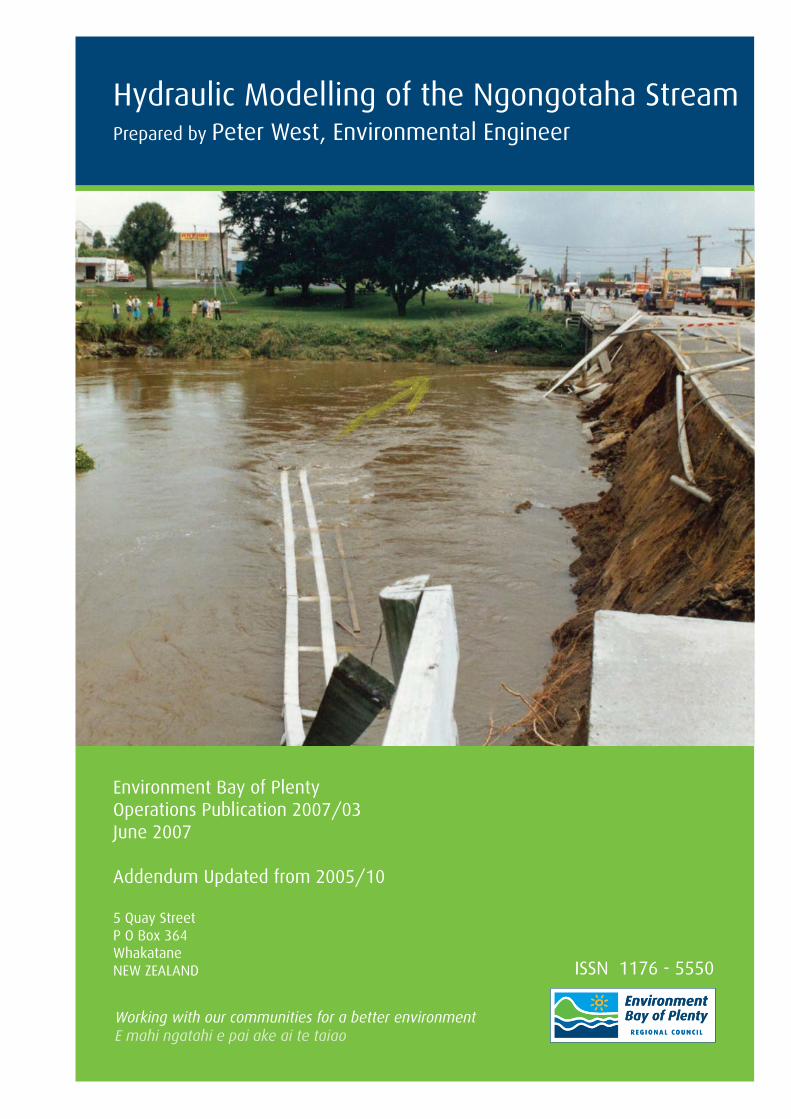
Hydraulic Modelling of the Ngongotaha StreamPrepared by Peter West, Environmental Engineer
Environment Bay of PlentyOperations Publication 2007/03June 2007
Addendum Updated from 2005/10
5 Quay StreetP O Box 364WhakataneNEW ZEALAND ISSN 1176 - 5550
Environment Bay of Plenty i
Operations Publication 2005/10 Hydraulic Modelling of the Ngongotaha Stream
Acknowledgements
Rotorua District Council recorded the flood levels from the May 1999 event and some from January 1986. NIWA operate the river gauge on the Ngongotaha at State Highway 5, and provided the historical stage data and flow ratings. David Marvin carried out the surveying with help from Peter Vercoe and myself. The hydrological flow magnitude frequency analysis was carried out by Peter Blackwood.
Cover Photo: Erosion of the Right bank upstream of Ngongotaha Bridge following the
5 January 1986 flood event.

Environment Bay of Plenty
Operations Publication 2005/10 Hydraulic Modelling of the Ngongotaha Stream
Contents
Chapter 1: Introduction ......................................................................................1
Chapter 2: Model Layout....................................................................................3
2.1 Model Software.................................................................................................3
2.2 Surveyed Cross Sections .................................................................................3
2.3 Floodways ........................................................................................................3
2.4 Bridges .............................................................................................................3
2.5 Stream Mouth ...................................................................................................4
2.6 File Storage ......................................................................................................5
Chapter 3: Hydrology ........................................................................................11
3.1 Hydrograph Shape..........................................................................................11
3.2 Design Flows ..................................................................................................11
3.3 Lake Level ......................................................................................................13
Chapter 4: Calibration.......................................................................................15
4.1 Calibration Events...........................................................................................15
4.1.1 Event of 17 December 2005 ...........................................................................15
4.1.2 Event of 1 May 1999 at 23.5 m3/s...................................................................16
4.1.3 Event of 5 January 1986 at 44 m3/s................................................................17
Chapter 5: Results .............................................................................................23
5.1 Model outcomes .............................................................................................23
5.2 Spill potential at Brake Road ..........................................................................23
References............................................................................................................29
Addendum ............................................................................................................31
Addendum I – Newly Available Aerial Survey Information.........................................32

1
Operations Publication 2005/10 Hydraulic Modelling of the Ngongotaha Stream
Chapter 1: Introduction The Ngongotaha Stream drains some 77 square kilometres of land including the Northern slopes of Mount Ngongotaha and part of the Mamaku Plateaux. It discharges into Lake Rotorua several kilometres north of Rotorua City. The bed and banks over the modelled reaches consist mainly of loose, lightweight pumicious soils, and the stream has a pronounced meander plan form. There is a significant bed load of sand and gravel sized particles even at medium to low flows. In places armouring has been installed to fix the stream’s location.
A flood control scheme was built in the lower 740m in 1985 by the then Bay of Plenty Catchment Commission. This involved stopbanks and flood spillways across several meander bends. In 1987 they let a contract for stream widening and clearing of vegetation for the remaining 4800 m to State Highway 5. A community led programme of clearing willow and blackberry and planting native grasses and trees has been underway since about 2001. These works have all had significant impacts on the hydraulic characteristics of the stream, and must be taken into account during modelling.
This investigation initially focused on the lower 1.5 km of stream channel, to about Te Manga Place, but was extended upstream to State Highway 5, following concerns about potential spilling at Brake Road during 1% AEP events.

3
Operations Publication 2005/10 Hydraulic Modelling of the Ngongotaha Stream
Chapter 2: Model Layout
2.1 Model Software
The model was constructed within the Mike 11 software from DHI. This is recognised throughout New Zealand as a comprehensive 1 dimensional hydraulic modelling package. It is capable of modelling dynamic boundary conditions over a complex network of branches. Essentially the programme solves the discharge/head relationship between every connected node point for each time step. It has the capacity to carry out a range of standard bridge, culvert or weir calculations.
2.2 Surveyed Cross Sections
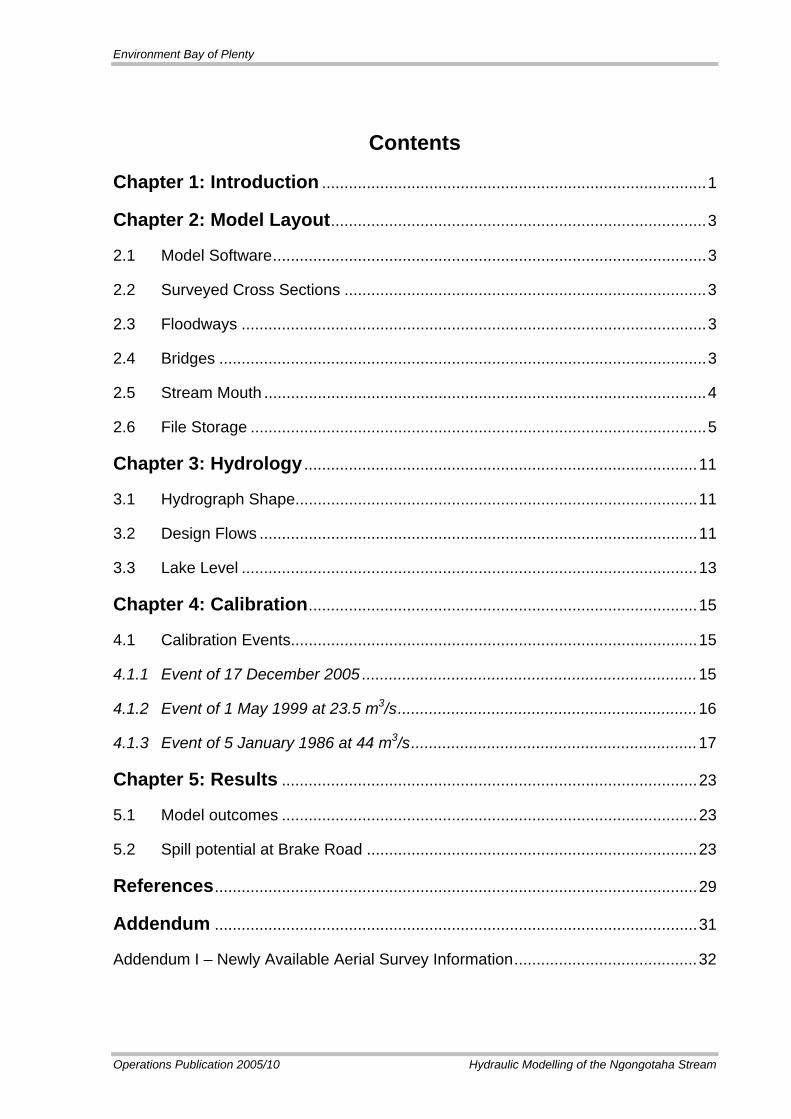
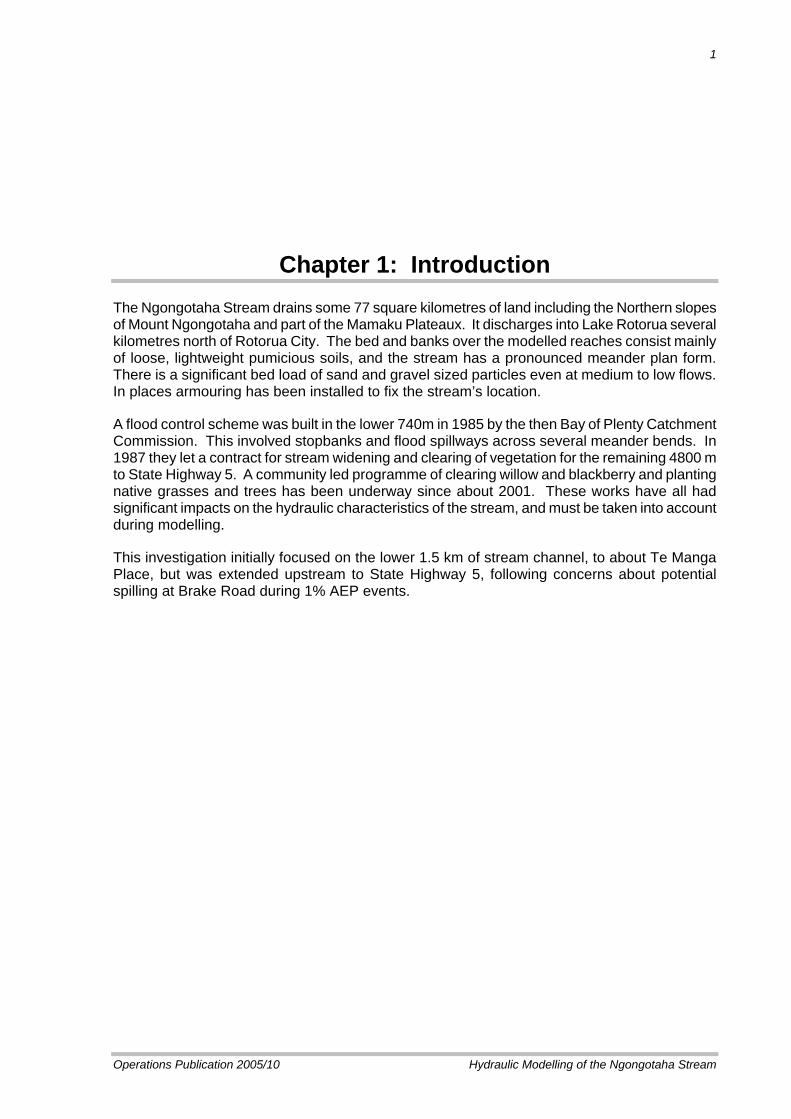
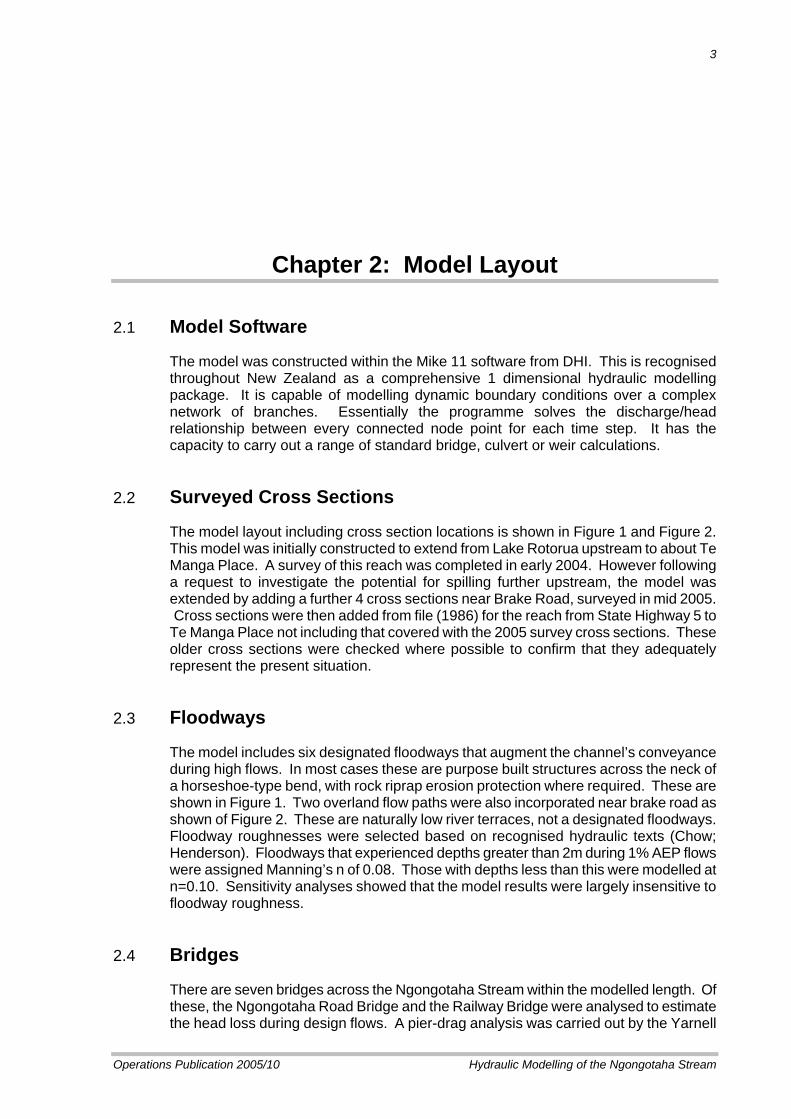
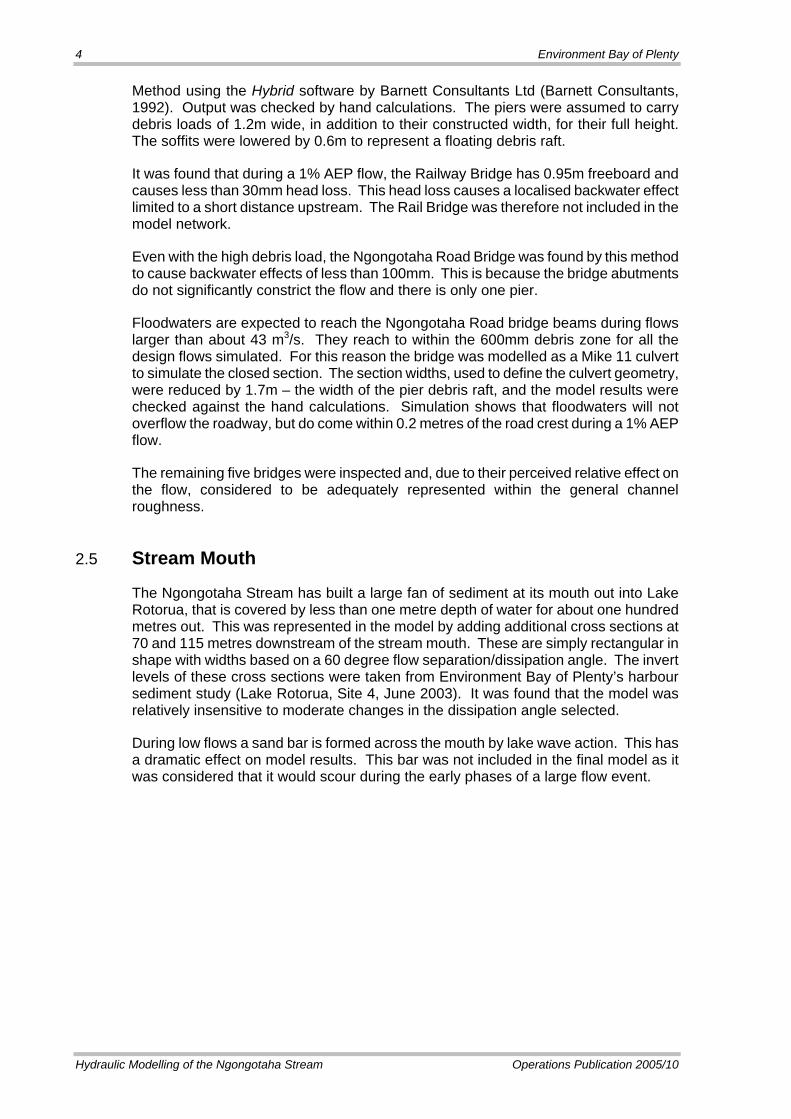
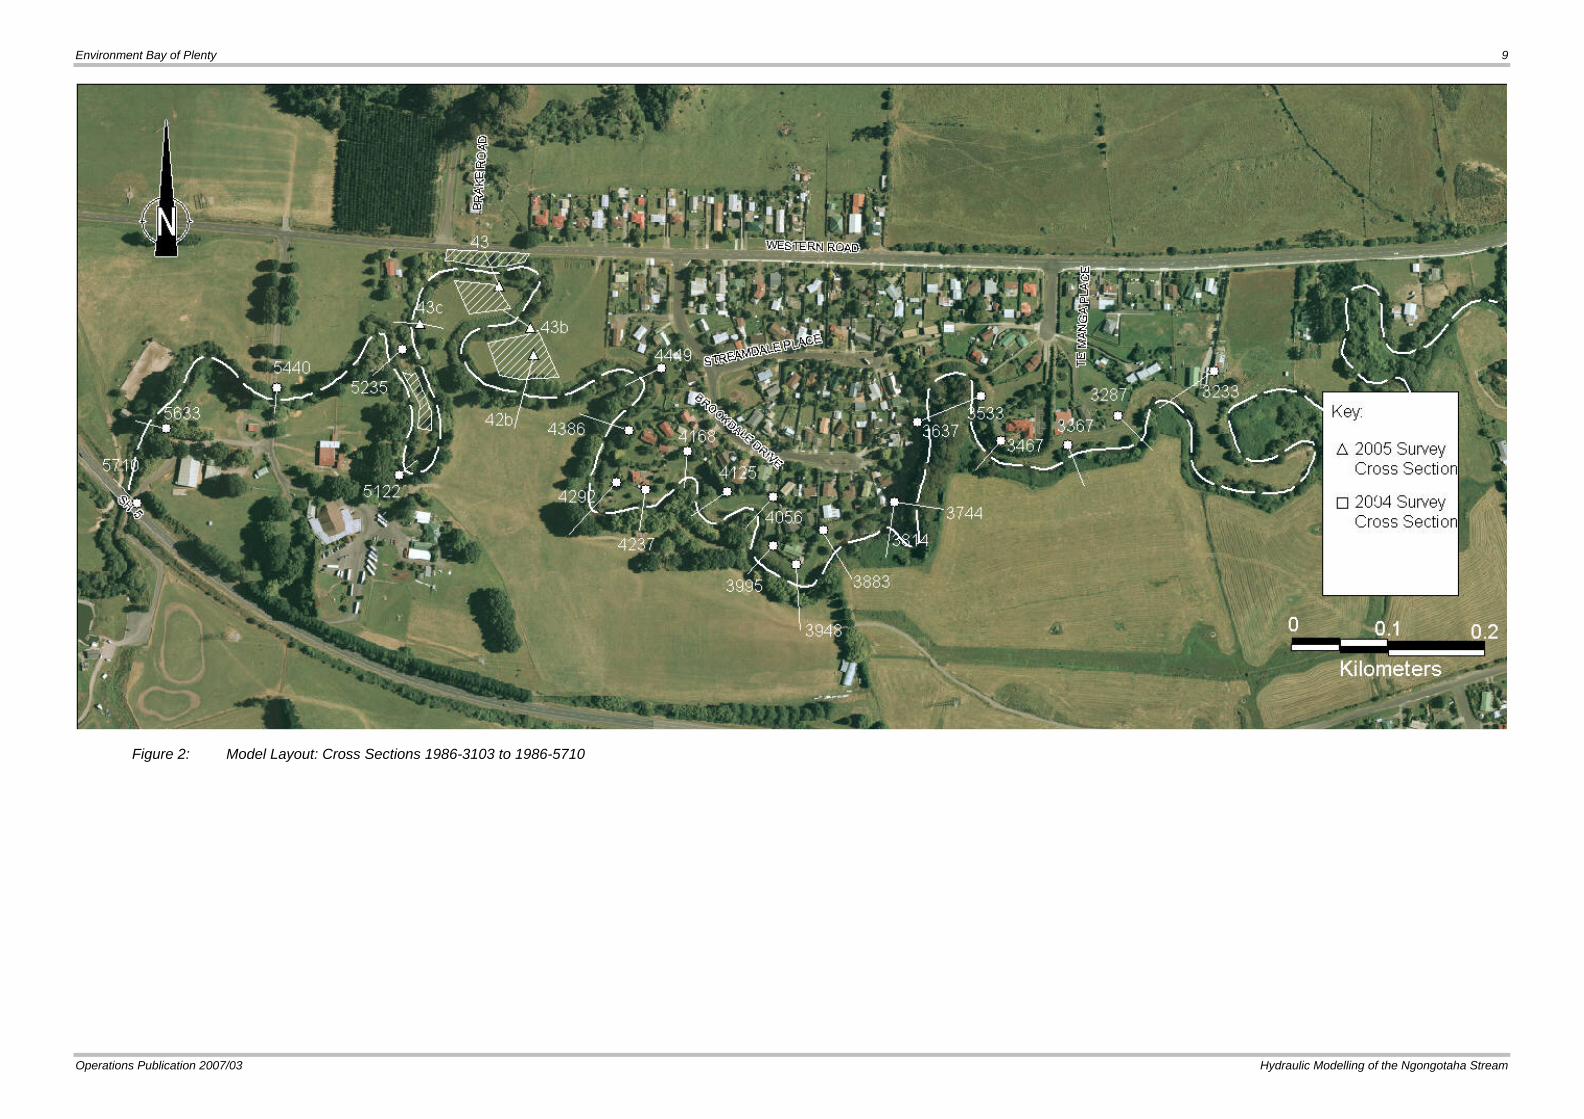
The model layout including cross section locations is shown in Figure 1 and Figure 2. This model was initially constructed to extend from Lake Rotorua upstream to about Te Manga Place. A survey of this reach was completed in early 2004. However following a request to investigate the potential for spilling further upstream, the model was extended by adding a further 4 cross sections near Brake Road, surveyed in mid 2005. Cross sections were then added from file (1986) for the reach from State Highway 5 to Te Manga Place not including that covered with the 2005 survey cross sections. These older cross sections were checked where possible to confirm that they adequately represent the present situation.
2.3 Floodways
The model includes six designated floodways that augment the channel’s conveyance during high flows. In most cases these are purpose built structures across the neck of a horseshoe-type bend, with rock riprap erosion protection where required. These are shown in Figure 1. Two overland flow paths were also incorporated near brake road as shown of Figure 2. These are naturally low river terraces, not a designated floodways. Floodway roughnesses were selected based on recognised hydraulic texts (Chow; Henderson). Floodways that experienced depths greater than 2m during 1% AEP flows were assigned Manning’s n of 0.08. Those with depths less than this were modelled at n=0.10. Sensitivity analyses showed that the model results were largely insensitive to floodway roughness.
2.4 Bridges
There are seven bridges across the Ngongotaha Stream within the modelled length. Of these, the Ngongotaha Road Bridge and the Railway Bridge were analysed to estimate the head loss during design flows. A pier-drag analysis was carried out by the Yarnell
4 Environment Bay of Plenty
Hydraulic Modelling of the Ngongotaha Stream Operations Publication 2005/10
Method using the Hybrid software by Barnett Consultants Ltd (Barnett Consultants, 1992). Output was checked by hand calculations. The piers were assumed to carry debris loads of 1.2m wide, in addition to their constructed width, for their full height. The soffits were lowered by 0.6m to represent a floating debris raft.
It was found that during a 1% AEP flow, the Railway Bridge has 0.95m freeboard and causes less than 30mm head loss. This head loss causes a localised backwater effect limited to a short distance upstream. The Rail Bridge was therefore not included in the model network.
Even with the high debris load, the Ngongotaha Road Bridge was found by this method to cause backwater effects of less than 100mm. This is because the bridge abutments do not significantly constrict the flow and there is only one pier.
Floodwaters are expected to reach the Ngongotaha Road bridge beams during flows larger than about 43 m3/s. They reach to within the 600mm debris zone for all the design flows simulated. For this reason the bridge was modelled as a Mike 11 culvert to simulate the closed section. The section widths, used to define the culvert geometry, were reduced by 1.7m – the width of the pier debris raft, and the model results were checked against the hand calculations. Simulation shows that floodwaters will not overflow the roadway, but do come within 0.2 metres of the road crest during a 1% AEP flow.
The remaining five bridges were inspected and, due to their perceived relative effect on the flow, considered to be adequately represented within the general channel roughness.
2.5 Stream Mouth
The Ngongotaha Stream has built a large fan of sediment at its mouth out into Lake Rotorua, that is covered by less than one metre depth of water for about one hundred metres out. This was represented in the model by adding additional cross sections at 70 and 115 metres downstream of the stream mouth. These are simply rectangular in shape with widths based on a 60 degree flow separation/dissipation angle. The invert levels of these cross sections were taken from Environment Bay of Plenty’s harbour sediment study (Lake Rotorua, Site 4, June 2003). It was found that the model was relatively insensitive to moderate changes in the dissipation angle selected.
During low flows a sand bar is formed across the mouth by lake wave action. This has a dramatic effect on model results. This bar was not included in the final model as it was considered that it would scour during the early phases of a large flow event.
Environment Bay of Plenty 5
Operations Publication 2005/10 Hydraulic Modelling of the Ngongotaha Stream
2.6 File Storage
The model is stored on the Environment Bay of Plenty network drives at: Jupiter\Designgroup\MikeZero\Upper_Kaituna\Ngongotaha\Ngongotaha05PMW. The files used are outlined in Table 1 below.
Table 1: Files Used in the Model
Simulation Sim File Network Cross sections
17/12/05 Calibration Calib051217 Net1.nwk11 XSec1.xns11 1% AEP Ngo1%AEP_L=280.3.sim11 Net1.nwk11 XSec1.xns11 2% AEP Ngo2%AEP_L=280.3.sim11 Net1.nwk11 XSec1.xns11 5% AEP Ngo5%AEP_L=280.1.sim11 Net1.nwk11 XSec1.xns11 10% AEP Ngo10%AEP_L=280.1.sim11 Net1.nwk11 XSec1.xns11
Simulation Boundary Conditions HD Parameters Results
17/12/05 Calibration Calib05.bnd11 HDPar1.HD11 Calib05.RES11 1% AEP 1%AEP_L280.3.bnd11 HDPar1.HD11 1%AEP_L280.3.RES11 2% AEP 2%AEP_L280.3.bnd11 HDPar1.HD11 2%AEP_L280.3.RES11 5% AEP 5%AEP_L280.1.bnd11 HDPar1.HD11 5%AEP_L280.1.RES11 10% AEP 10%AEP_L280.1.bnd11 HDPar1.HD11 10%AEP_L280.1.RES11
Environment Bay of Plenty 7
Operations Publication 2007/03 Hydraulic Modelling of the Ngongotaha Stream
Figure 1: Model Layout: Cross Sections 2004-1 to 1986-3103

Environment Bay of Plenty 9
Operations Publication 2007/03 Hydraulic Modelling of the Ngongotaha Stream
Figure 2: Model Layout: Cross Sections 1986-3103 to 1986-5710
Environment Bay of Plenty 9
Operations Publication 2005/10 Hydraulic Modelling of the Ngongotaha Stream
Figure 2: Model Layout: Cross Sections 1986-3103 to 1986-5710

11
Operations Publication 2005/10 Hydraulic Modelling of the Ngongotaha Stream
Chapter 3: Hydrology
3.1 Hydrograph Shape
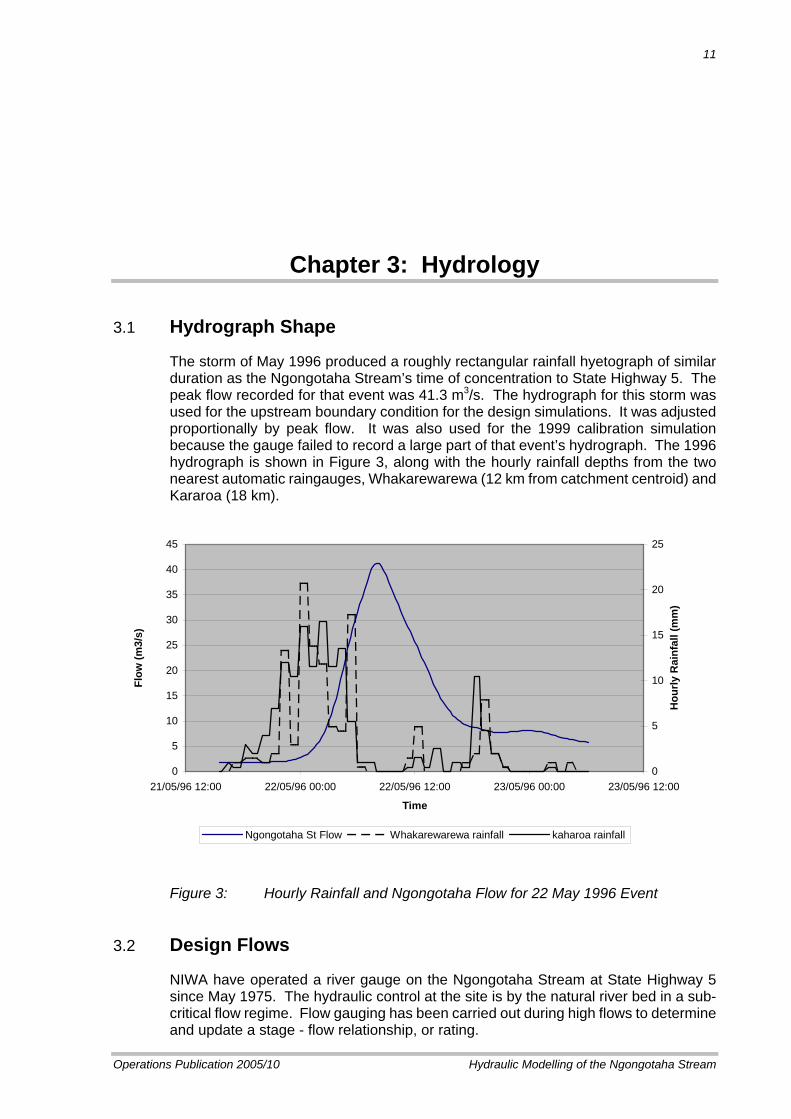
The storm of May 1996 produced a roughly rectangular rainfall hyetograph of similar duration as the Ngongotaha Stream’s time of concentration to State Highway 5. The peak flow recorded for that event was 41.3 m3/s. The hydrograph for this storm was used for the upstream boundary condition for the design simulations. It was adjusted proportionally by peak flow. It was also used for the 1999 calibration simulation because the gauge failed to record a large part of that event’s hydrograph. The 1996 hydrograph is shown in Figure 3, along with the hourly rainfall depths from the two nearest automatic raingauges, Whakarewarewa (12 km from catchment centroid) and Kararoa (18 km).
0
5
10
15
20
25
30
35
40
45
21/05/96 12:00 22/05/96 00:00 22/05/96 12:00 23/05/96 00:00 23/05/96 12:00
Time
Flow
(m3/
s)
0
5
10
15
20
25
Hou
rly R
ainf
all (
mm
)
Ngongotaha St Flow Whakarewarewa rainfall kaharoa rainfall
Figure 3: Hourly Rainfall and Ngongotaha Flow for 22 May 1996 Event
3.2 Design Flows
NIWA have operated a river gauge on the Ngongotaha Stream at State Highway 5 since May 1975. The hydraulic control at the site is by the natural river bed in a sub-critical flow regime. Flow gauging has been carried out during high flows to determine and update a stage - flow relationship, or rating.
12 Environment Bay of Plenty
Hydraulic Modelling of the Ngongotaha Stream Operations Publication 2005/10
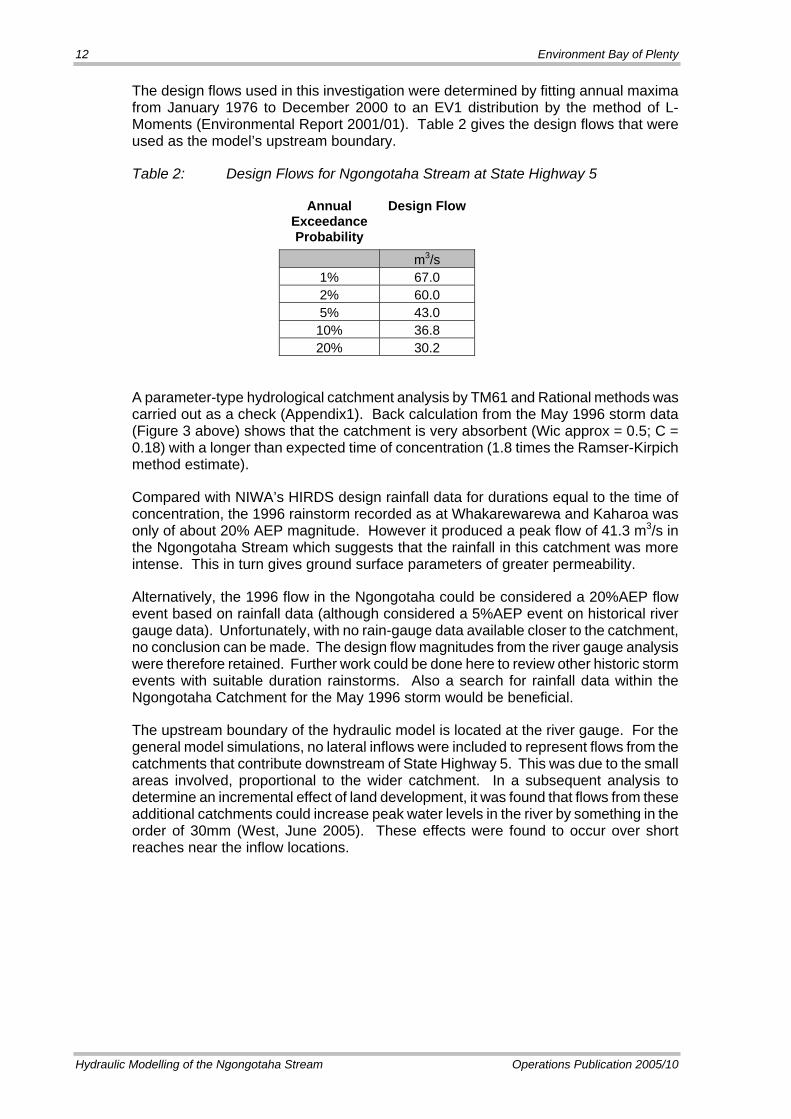
The design flows used in this investigation were determined by fitting annual maxima from January 1976 to December 2000 to an EV1 distribution by the method of L-Moments (Environmental Report 2001/01). Table 2 gives the design flows that were used as the model’s upstream boundary.
Table 2: Design Flows for Ngongotaha Stream at State Highway 5
Annual Exceedance Probability
Design Flow
m3/s 1% 67.0 2% 60.0 5% 43.0 10% 36.8 20% 30.2
A parameter-type hydrological catchment analysis by TM61 and Rational methods was carried out as a check (Appendix1). Back calculation from the May 1996 storm data (Figure 3 above) shows that the catchment is very absorbent (Wic approx = 0.5; C = 0.18) with a longer than expected time of concentration (1.8 times the Ramser-Kirpich method estimate).
Compared with NIWA’s HIRDS design rainfall data for durations equal to the time of concentration, the 1996 rainstorm recorded as at Whakarewarewa and Kaharoa was only of about 20% AEP magnitude. However it produced a peak flow of 41.3 m3/s in the Ngongotaha Stream which suggests that the rainfall in this catchment was more intense. This in turn gives ground surface parameters of greater permeability.
Alternatively, the 1996 flow in the Ngongotaha could be considered a 20%AEP flow event based on rainfall data (although considered a 5%AEP event on historical river gauge data). Unfortunately, with no rain-gauge data available closer to the catchment, no conclusion can be made. The design flow magnitudes from the river gauge analysis were therefore retained. Further work could be done here to review other historic storm events with suitable duration rainstorms. Also a search for rainfall data within the Ngongotaha Catchment for the May 1996 storm would be beneficial.
The upstream boundary of the hydraulic model is located at the river gauge. For the general model simulations, no lateral inflows were included to represent flows from the catchments that contribute downstream of State Highway 5. This was due to the small areas involved, proportional to the wider catchment. In a subsequent analysis to determine an incremental effect of land development, it was found that flows from these additional catchments could increase peak water levels in the river by something in the order of 30mm (West, June 2005). These effects were found to occur over short reaches near the inflow locations.
Environment Bay of Plenty 13
Operations Publication 2005/10 Hydraulic Modelling of the Ngongotaha Stream
3.3 Lake Level
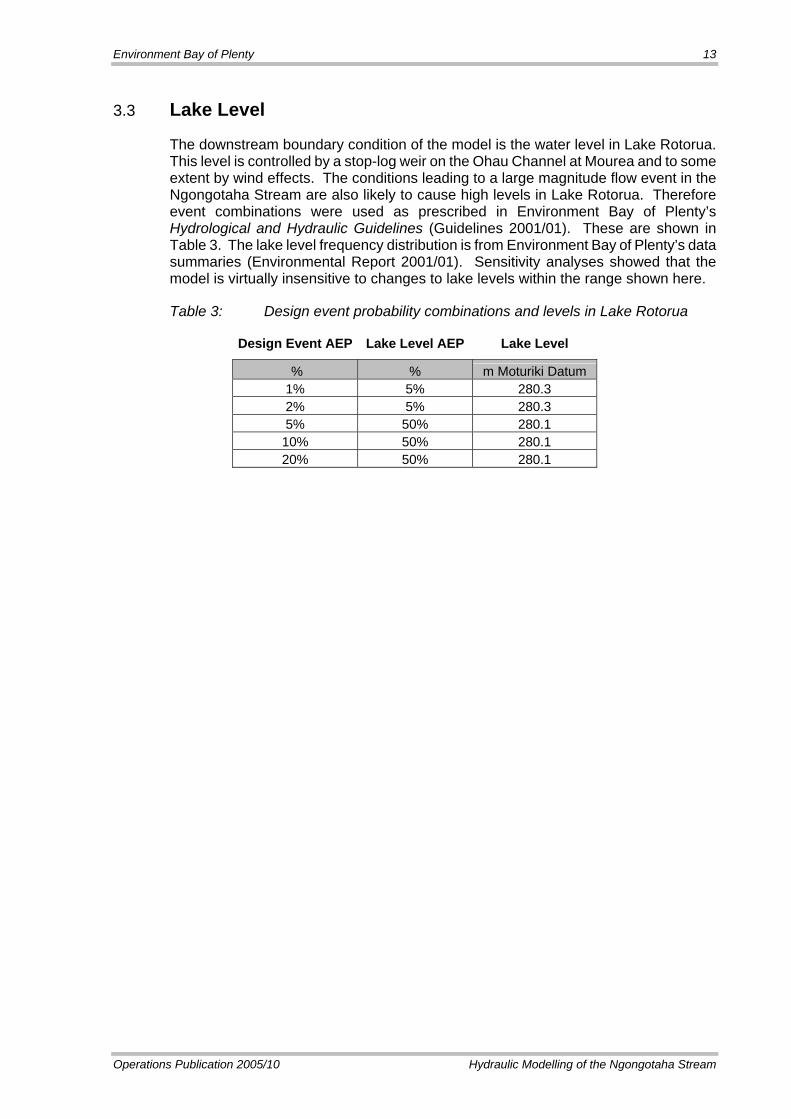
The downstream boundary condition of the model is the water level in Lake Rotorua. This level is controlled by a stop-log weir on the Ohau Channel at Mourea and to some extent by wind effects. The conditions leading to a large magnitude flow event in the Ngongotaha Stream are also likely to cause high levels in Lake Rotorua. Therefore event combinations were used as prescribed in Environment Bay of Plenty’s Hydrological and Hydraulic Guidelines (Guidelines 2001/01). These are shown in Table 3. The lake level frequency distribution is from Environment Bay of Plenty’s data summaries (Environmental Report 2001/01). Sensitivity analyses showed that the model is virtually insensitive to changes to lake levels within the range shown here.
Table 3: Design event probability combinations and levels in Lake Rotorua
Design Event AEP Lake Level AEP Lake Level
% % m Moturiki Datum 1% 5% 280.3 2% 5% 280.3 5% 50% 280.1 10% 50% 280.1 20% 50% 280.1

15
Operations Publication 2005/10 Hydraulic Modelling of the Ngongotaha Stream
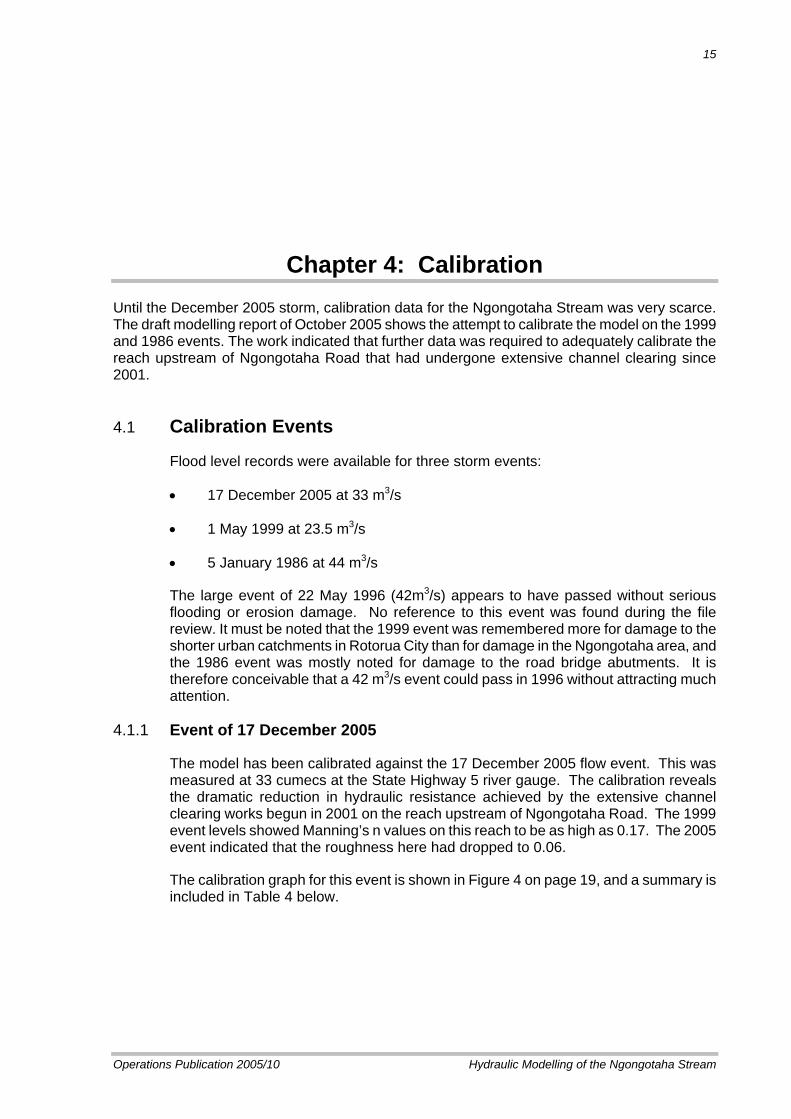
Chapter 4: Calibration Until the December 2005 storm, calibration data for the Ngongotaha Stream was very scarce. The draft modelling report of October 2005 shows the attempt to calibrate the model on the 1999 and 1986 events. The work indicated that further data was required to adequately calibrate the reach upstream of Ngongotaha Road that had undergone extensive channel clearing since 2001.
4.1 Calibration Events
Flood level records were available for three storm events:
• 17 December 2005 at 33 m3/s
• 1 May 1999 at 23.5 m3/s
• 5 January 1986 at 44 m3/s
The large event of 22 May 1996 (42m3/s) appears to have passed without serious flooding or erosion damage. No reference to this event was found during the file review. It must be noted that the 1999 event was remembered more for damage to the shorter urban catchments in Rotorua City than for damage in the Ngongotaha area, and the 1986 event was mostly noted for damage to the road bridge abutments. It is therefore conceivable that a 42 m3/s event could pass in 1996 without attracting much attention.
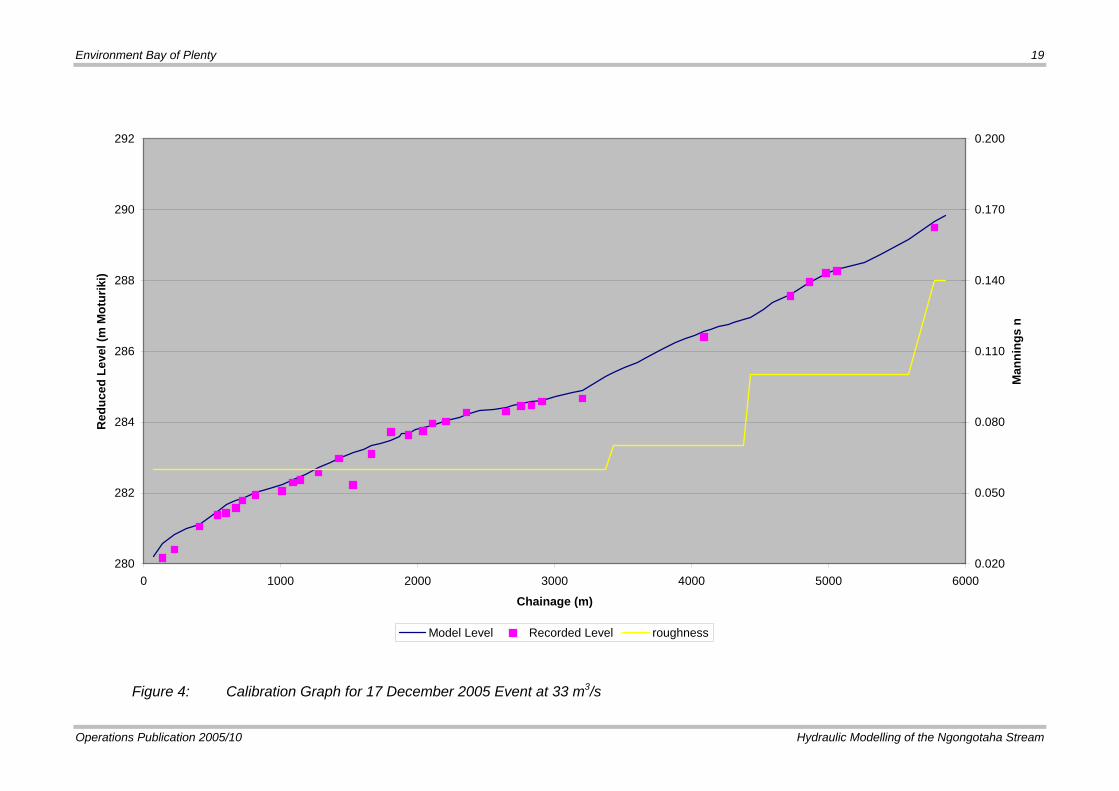
4.1.1 Event of 17 December 2005
The model has been calibrated against the 17 December 2005 flow event. This was measured at 33 cumecs at the State Highway 5 river gauge. The calibration reveals the dramatic reduction in hydraulic resistance achieved by the extensive channel clearing works begun in 2001 on the reach upstream of Ngongotaha Road. The 1999 event levels showed Manning’s n values on this reach to be as high as 0.17. The 2005 event indicated that the roughness here had dropped to 0.06.
The calibration graph for this event is shown in Figure 4 on page 19, and a summary is included in Table 4 below.
16 Environment Bay of Plenty
Hydraulic Modelling of the Ngongotaha Stream Operations Publication 2005/10
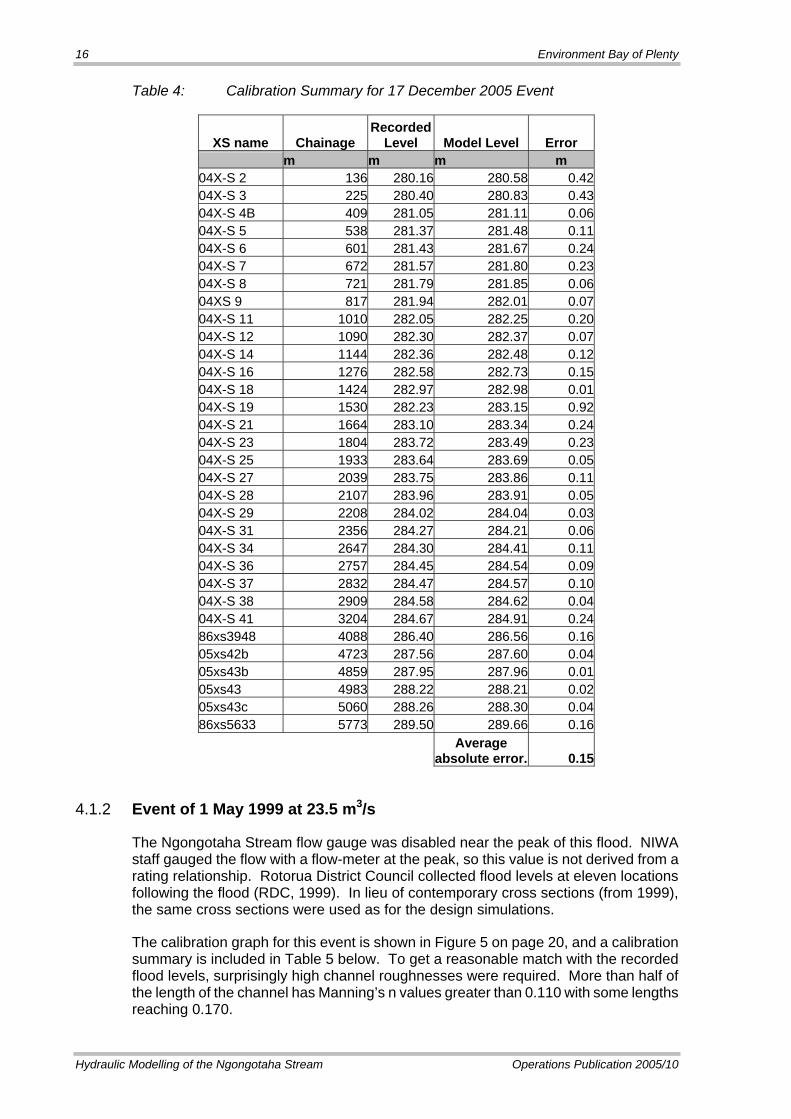
Table 4: Calibration Summary for 17 December 2005 Event
XS name Chainage Recorded
Level Model Level Error m m m m 04X-S 2 136 280.16 280.58 0.4204X-S 3 225 280.40 280.83 0.4304X-S 4B 409 281.05 281.11 0.0604X-S 5 538 281.37 281.48 0.1104X-S 6 601 281.43 281.67 0.2404X-S 7 672 281.57 281.80 0.2304X-S 8 721 281.79 281.85 0.0604XS 9 817 281.94 282.01 0.0704X-S 11 1010 282.05 282.25 0.2004X-S 12 1090 282.30 282.37 0.0704X-S 14 1144 282.36 282.48 0.1204X-S 16 1276 282.58 282.73 0.1504X-S 18 1424 282.97 282.98 0.0104X-S 19 1530 282.23 283.15 0.9204X-S 21 1664 283.10 283.34 0.2404X-S 23 1804 283.72 283.49 0.2304X-S 25 1933 283.64 283.69 0.0504X-S 27 2039 283.75 283.86 0.1104X-S 28 2107 283.96 283.91 0.0504X-S 29 2208 284.02 284.04 0.0304X-S 31 2356 284.27 284.21 0.0604X-S 34 2647 284.30 284.41 0.1104X-S 36 2757 284.45 284.54 0.0904X-S 37 2832 284.47 284.57 0.1004X-S 38 2909 284.58 284.62 0.0404X-S 41 3204 284.67 284.91 0.2486xs3948 4088 286.40 286.56 0.1605xs42b 4723 287.56 287.60 0.0405xs43b 4859 287.95 287.96 0.0105xs43 4983 288.22 288.21 0.0205xs43c 5060 288.26 288.30 0.0486xs5633 5773 289.50 289.66 0.16
Average
absolute error. 0.15
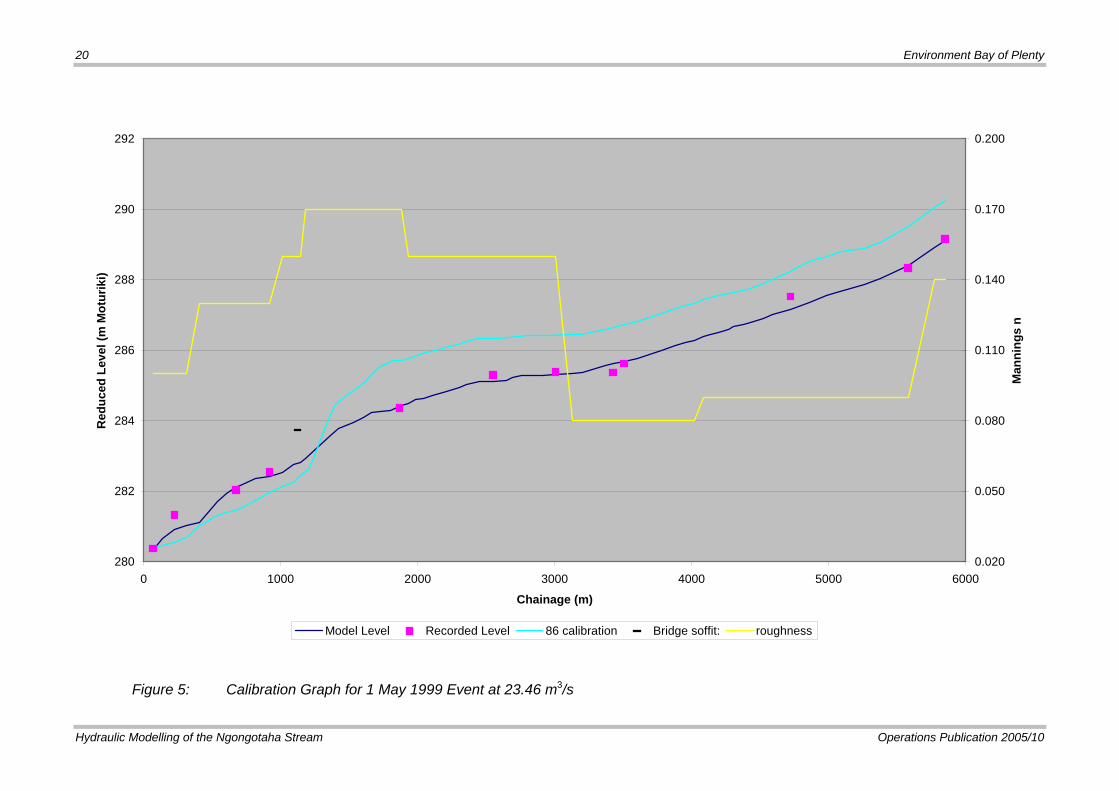
4.1.2 Event of 1 May 1999 at 23.5 m3/s
The Ngongotaha Stream flow gauge was disabled near the peak of this flood. NIWA staff gauged the flow with a flow-meter at the peak, so this value is not derived from a rating relationship. Rotorua District Council collected flood levels at eleven locations following the flood (RDC, 1999). In lieu of contemporary cross sections (from 1999), the same cross sections were used as for the design simulations.
The calibration graph for this event is shown in Figure 5 on page 20, and a calibration summary is included in Table 5 below. To get a reasonable match with the recorded flood levels, surprisingly high channel roughnesses were required. More than half of the length of the channel has Manning’s n values greater than 0.110 with some lengths reaching 0.170.
Environment Bay of Plenty 17
Operations Publication 2005/10 Hydraulic Modelling of the Ngongotaha Stream
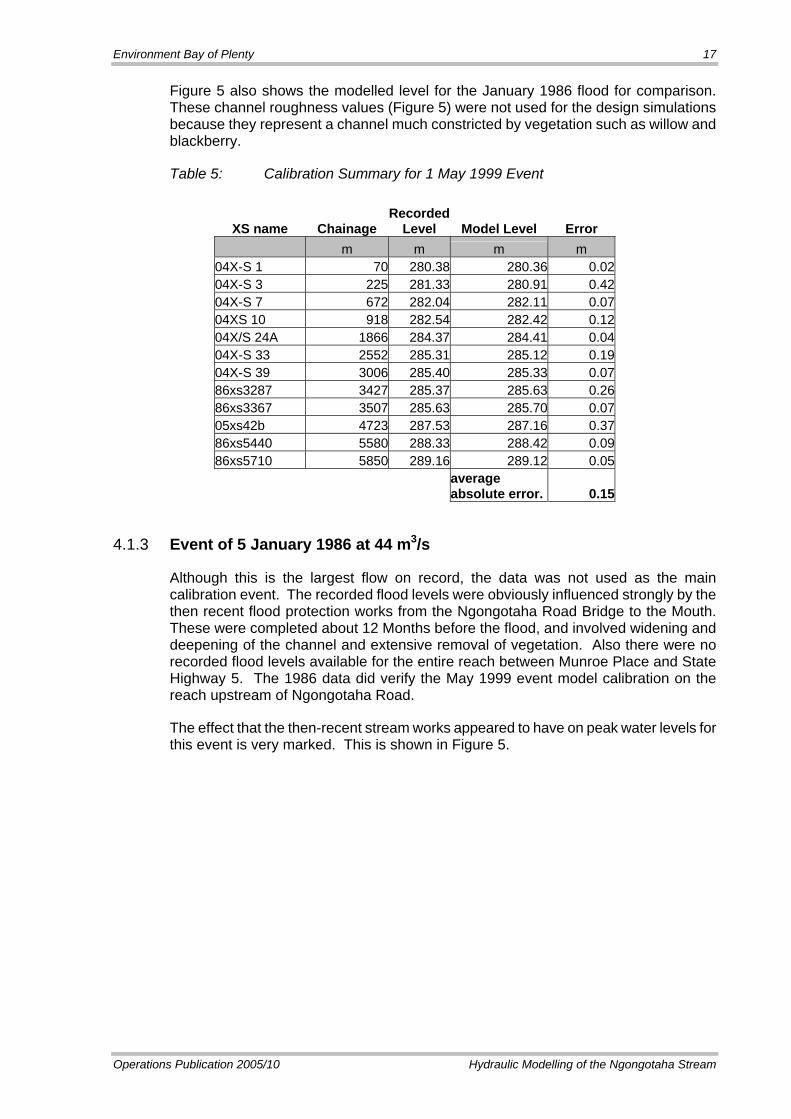
Figure 5 also shows the modelled level for the January 1986 flood for comparison. These channel roughness values (Figure 5) were not used for the design simulations because they represent a channel much constricted by vegetation such as willow and blackberry.
Table 5: Calibration Summary for 1 May 1999 Event
XS name Chainage Recorded
Level Model Level Error m m m m 04X-S 1 70 280.38 280.36 0.0204X-S 3 225 281.33 280.91 0.4204X-S 7 672 282.04 282.11 0.0704XS 10 918 282.54 282.42 0.1204X/S 24A 1866 284.37 284.41 0.0404X-S 33 2552 285.31 285.12 0.1904X-S 39 3006 285.40 285.33 0.0786xs3287 3427 285.37 285.63 0.2686xs3367 3507 285.63 285.70 0.0705xs42b 4723 287.53 287.16 0.3786xs5440 5580 288.33 288.42 0.0986xs5710 5850 289.16 289.12 0.05
average absolute error. 0.15
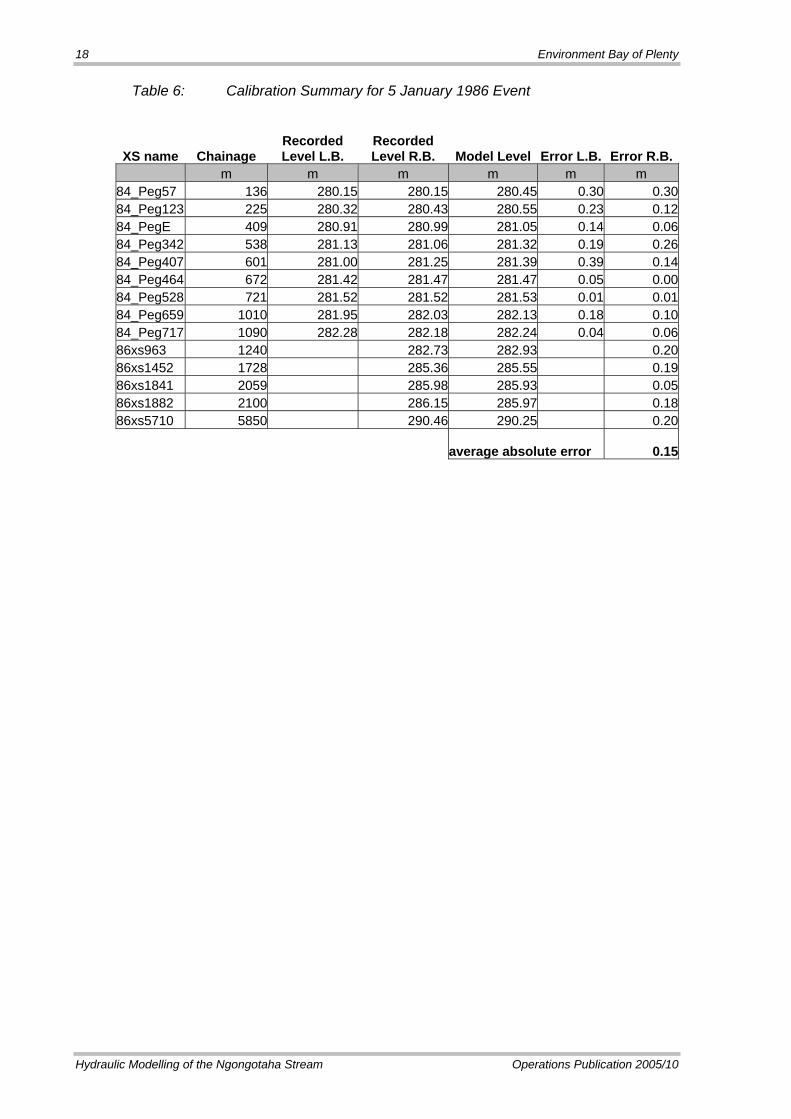
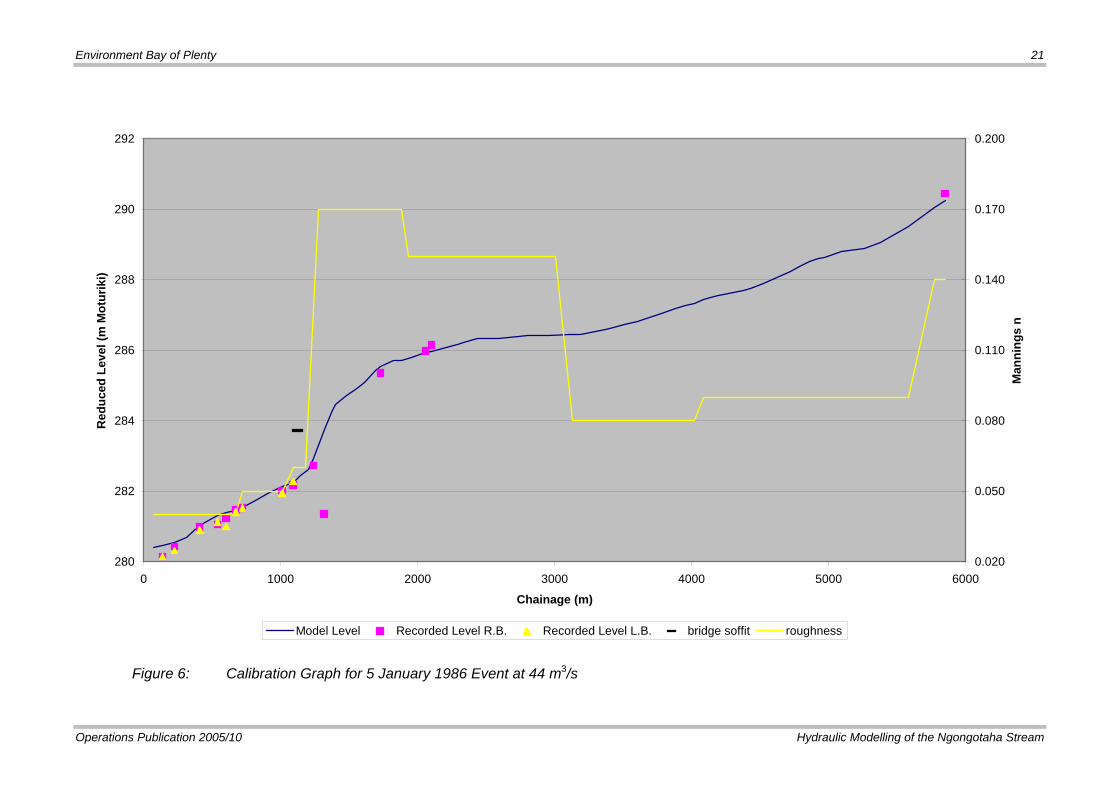
4.1.3 Event of 5 January 1986 at 44 m3/s
Although this is the largest flow on record, the data was not used as the main calibration event. The recorded flood levels were obviously influenced strongly by the then recent flood protection works from the Ngongotaha Road Bridge to the Mouth. These were completed about 12 Months before the flood, and involved widening and deepening of the channel and extensive removal of vegetation. Also there were no recorded flood levels available for the entire reach between Munroe Place and State Highway 5. The 1986 data did verify the May 1999 event model calibration on the reach upstream of Ngongotaha Road.
The effect that the then-recent stream works appeared to have on peak water levels for this event is very marked. This is shown in Figure 5.
18 Environment Bay of Plenty
Hydraulic Modelling of the Ngongotaha Stream Operations Publication 2005/10
Table 6: Calibration Summary for 5 January 1986 Event
XS name Chainage Recorded Level L.B.
Recorded Level R.B. Model Level Error L.B. Error R.B.
m m m m m m 84_Peg57 136 280.15 280.15 280.45 0.30 0.3084_Peg123 225 280.32 280.43 280.55 0.23 0.1284_PegE 409 280.91 280.99 281.05 0.14 0.0684_Peg342 538 281.13 281.06 281.32 0.19 0.2684_Peg407 601 281.00 281.25 281.39 0.39 0.1484_Peg464 672 281.42 281.47 281.47 0.05 0.0084_Peg528 721 281.52 281.52 281.53 0.01 0.0184_Peg659 1010 281.95 282.03 282.13 0.18 0.1084_Peg717 1090 282.28 282.18 282.24 0.04 0.0686xs963 1240 282.73 282.93 0.2086xs1452 1728 285.36 285.55 0.1986xs1841 2059 285.98 285.93 0.0586xs1882 2100 286.15 285.97 0.1886xs5710 5850 290.46 290.25 0.20
average absolute error 0.15
Environment Bay of Plenty 19
Operations Publication 2005/10 Hydraulic Modelling of the Ngongotaha Stream
280
282
284
286
288
290
292
0 1000 2000 3000 4000 5000 6000
Chainage (m)
Red
uced
Lev
el (m
Mot
urik
i)
0.020
0.050
0.080
0.110
0.140
0.170
0.200
Man
ning
s n
Model Level Recorded Level roughness
Figure 4: Calibration Graph for 17 December 2005 Event at 33 m3/s
20 Environment Bay of Plenty
Hydraulic Modelling of the Ngongotaha Stream Operations Publication 2005/10
280
282
284
286
288
290
292
0 1000 2000 3000 4000 5000 6000
Chainage (m)
Red
uced
Lev
el (m
Mot
urik
i)
0.020
0.050
0.080
0.110
0.140
0.170
0.200
Man
ning
s n
Model Level Recorded Level 86 calibration Bridge soffit: roughness
Figure 5: Calibration Graph for 1 May 1999 Event at 23.46 m3/s
Environment Bay of Plenty 21
Operations Publication 2005/10 Hydraulic Modelling of the Ngongotaha Stream
280
282
284
286
288
290
292
0 1000 2000 3000 4000 5000 6000
Chainage (m)
Red
uced
Lev
el (m
Mot
urik
i)
0.020
0.050
0.080
0.110
0.140
0.170
0.200
Man
ning
s n
Model Level Recorded Level R.B. Recorded Level L.B. bridge soffit roughness
Figure 6: Calibration Graph for 5 January 1986 Event at 44 m3/s

23
Operations Publication 2007/03 Hydraulic Modelling of the Ngongotaha Stream
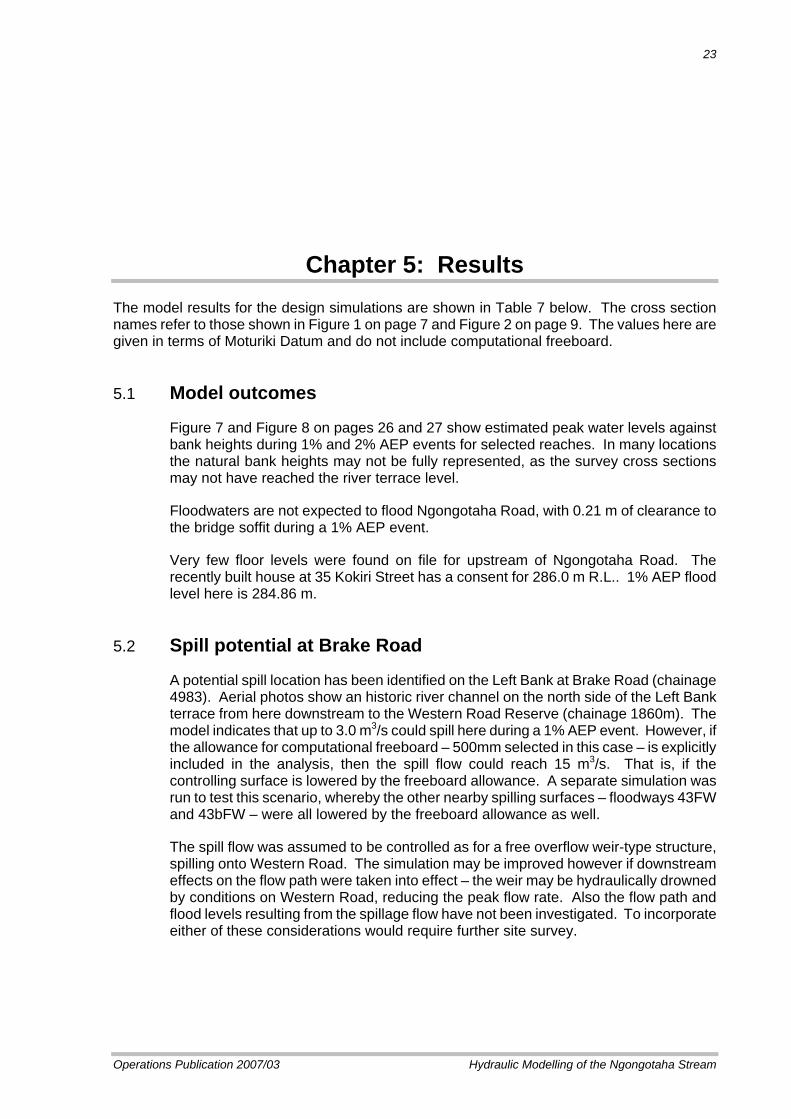
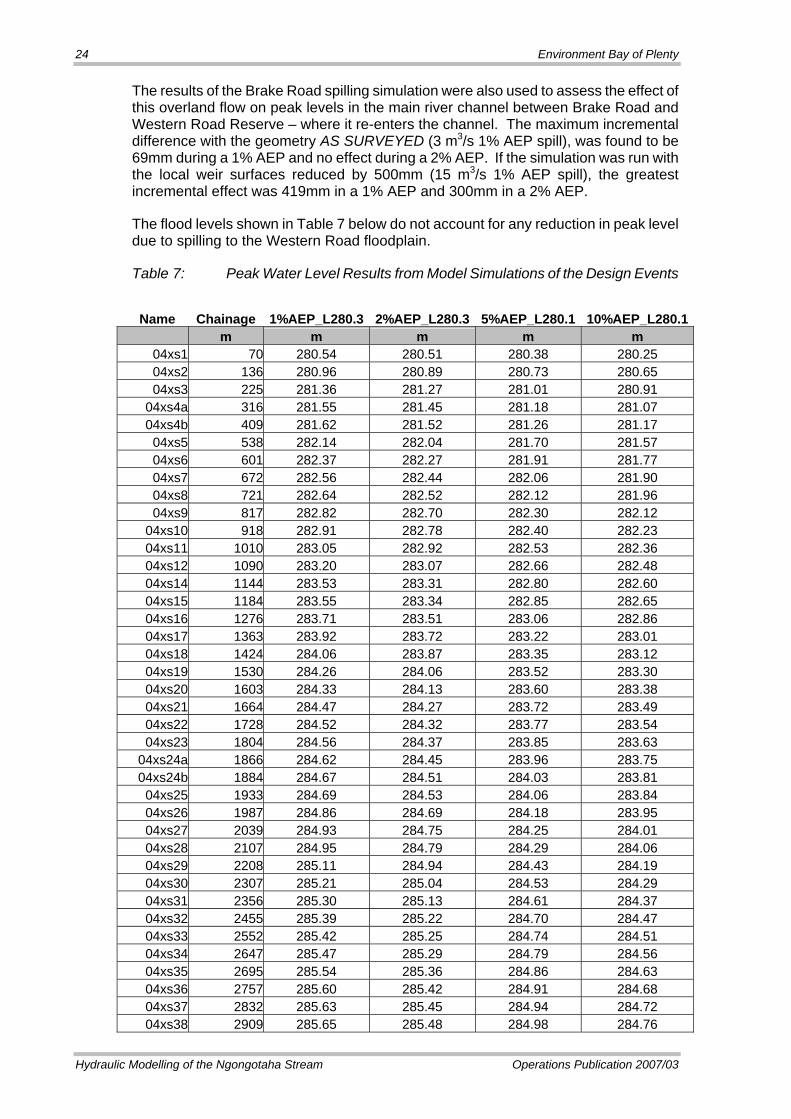
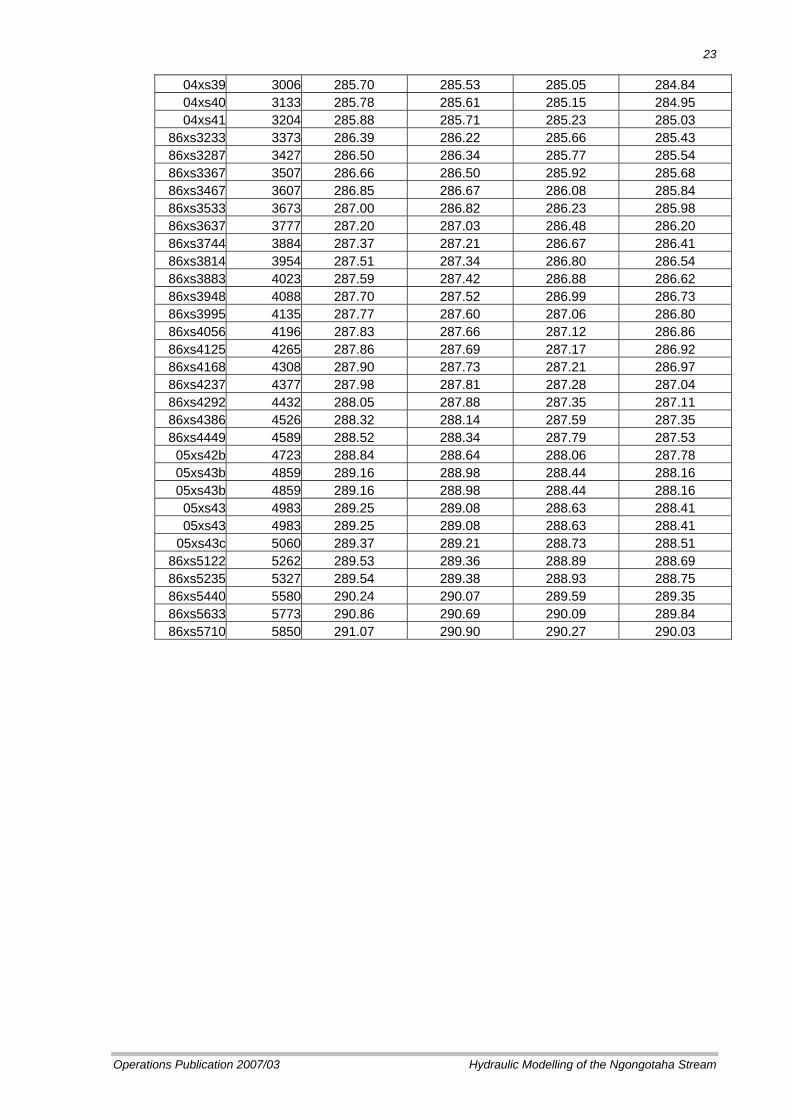
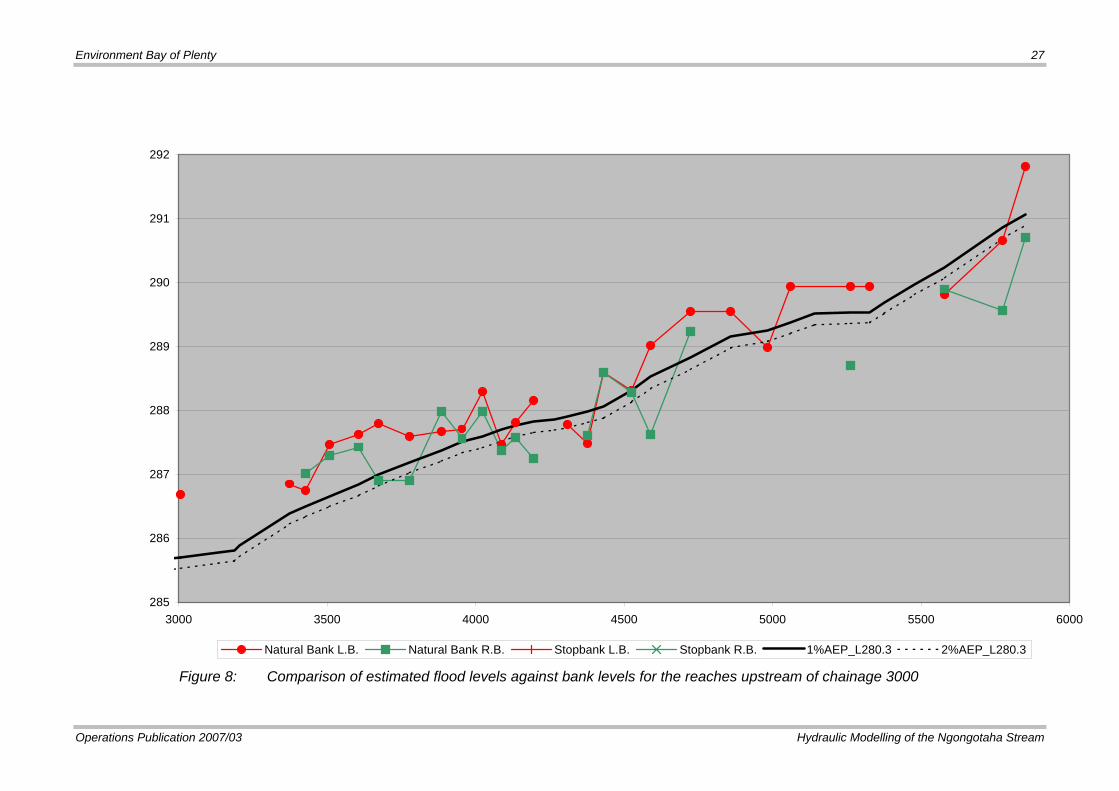
Chapter 5: Results The model results for the design simulations are shown in Table 7 below. The cross section names refer to those shown in Figure 1 on page 7 and Figure 2 on page 9. The values here are given in terms of Moturiki Datum and do not include computational freeboard.
5.1 Model outcomes
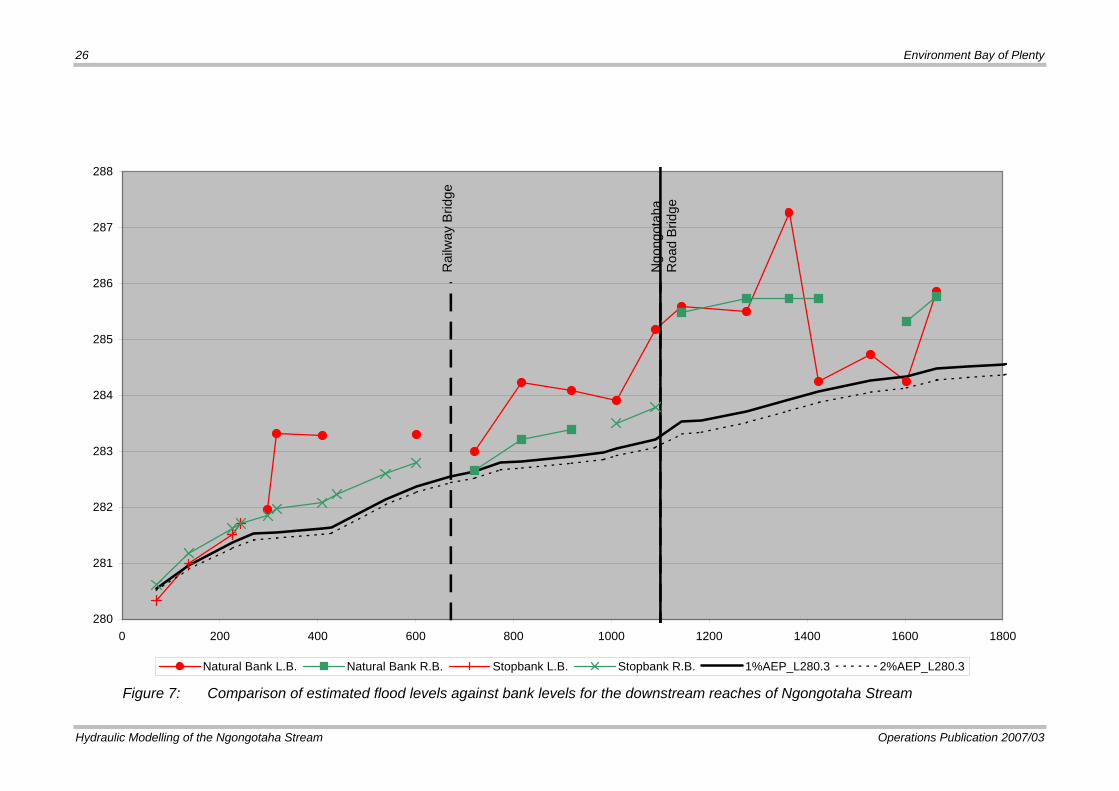
Figure 7 and Figure 8 on pages 26 and 27 show estimated peak water levels against bank heights during 1% and 2% AEP events for selected reaches. In many locations the natural bank heights may not be fully represented, as the survey cross sections may not have reached the river terrace level.
Floodwaters are not expected to flood Ngongotaha Road, with 0.21 m of clearance to the bridge soffit during a 1% AEP event.
Very few floor levels were found on file for upstream of Ngongotaha Road. The recently built house at 35 Kokiri Street has a consent for 286.0 m R.L.. 1% AEP flood level here is 284.86 m.
5.2 Spill potential at Brake Road
A potential spill location has been identified on the Left Bank at Brake Road (chainage 4983). Aerial photos show an historic river channel on the north side of the Left Bank terrace from here downstream to the Western Road Reserve (chainage 1860m). The model indicates that up to 3.0 m3/s could spill here during a 1% AEP event. However, if the allowance for computational freeboard – 500mm selected in this case – is explicitly included in the analysis, then the spill flow could reach 15 m3/s. That is, if the controlling surface is lowered by the freeboard allowance. A separate simulation was run to test this scenario, whereby the other nearby spilling surfaces – floodways 43FW and 43bFW – were all lowered by the freeboard allowance as well.
The spill flow was assumed to be controlled as for a free overflow weir-type structure, spilling onto Western Road. The simulation may be improved however if downstream effects on the flow path were taken into effect – the weir may be hydraulically drowned by conditions on Western Road, reducing the peak flow rate. Also the flow path and flood levels resulting from the spillage flow have not been investigated. To incorporate either of these considerations would require further site survey.
24 Environment Bay of Plenty
Hydraulic Modelling of the Ngongotaha Stream Operations Publication 2007/03
The results of the Brake Road spilling simulation were also used to assess the effect of this overland flow on peak levels in the main river channel between Brake Road and Western Road Reserve – where it re-enters the channel. The maximum incremental difference with the geometry AS SURVEYED (3 m3/s 1% AEP spill), was found to be 69mm during a 1% AEP and no effect during a 2% AEP. If the simulation was run with the local weir surfaces reduced by 500mm (15 m3/s 1% AEP spill), the greatest incremental effect was 419mm in a 1% AEP and 300mm in a 2% AEP.
The flood levels shown in Table 7 below do not account for any reduction in peak level due to spilling to the Western Road floodplain.
Table 7: Peak Water Level Results from Model Simulations of the Design Events
Name Chainage 1%AEP_L280.3 2%AEP_L280.3 5%AEP_L280.1 10%AEP_L280.1 m m m m m
04xs1 70 280.54 280.51 280.38 280.25 04xs2 136 280.96 280.89 280.73 280.65 04xs3 225 281.36 281.27 281.01 280.91
04xs4a 316 281.55 281.45 281.18 281.07 04xs4b 409 281.62 281.52 281.26 281.17 04xs5 538 282.14 282.04 281.70 281.57 04xs6 601 282.37 282.27 281.91 281.77 04xs7 672 282.56 282.44 282.06 281.90 04xs8 721 282.64 282.52 282.12 281.96 04xs9 817 282.82 282.70 282.30 282.12
04xs10 918 282.91 282.78 282.40 282.23 04xs11 1010 283.05 282.92 282.53 282.36 04xs12 1090 283.20 283.07 282.66 282.48 04xs14 1144 283.53 283.31 282.80 282.60 04xs15 1184 283.55 283.34 282.85 282.65 04xs16 1276 283.71 283.51 283.06 282.86 04xs17 1363 283.92 283.72 283.22 283.01 04xs18 1424 284.06 283.87 283.35 283.12 04xs19 1530 284.26 284.06 283.52 283.30 04xs20 1603 284.33 284.13 283.60 283.38 04xs21 1664 284.47 284.27 283.72 283.49 04xs22 1728 284.52 284.32 283.77 283.54 04xs23 1804 284.56 284.37 283.85 283.63
04xs24a 1866 284.62 284.45 283.96 283.75 04xs24b 1884 284.67 284.51 284.03 283.81 04xs25 1933 284.69 284.53 284.06 283.84 04xs26 1987 284.86 284.69 284.18 283.95 04xs27 2039 284.93 284.75 284.25 284.01 04xs28 2107 284.95 284.79 284.29 284.06 04xs29 2208 285.11 284.94 284.43 284.19 04xs30 2307 285.21 285.04 284.53 284.29 04xs31 2356 285.30 285.13 284.61 284.37 04xs32 2455 285.39 285.22 284.70 284.47 04xs33 2552 285.42 285.25 284.74 284.51 04xs34 2647 285.47 285.29 284.79 284.56 04xs35 2695 285.54 285.36 284.86 284.63 04xs36 2757 285.60 285.42 284.91 284.68 04xs37 2832 285.63 285.45 284.94 284.72 04xs38 2909 285.65 285.48 284.98 284.76
23
Operations Publication 2007/03 Hydraulic Modelling of the Ngongotaha Stream
04xs39 3006 285.70 285.53 285.05 284.84 04xs40 3133 285.78 285.61 285.15 284.95 04xs41 3204 285.88 285.71 285.23 285.03
86xs3233 3373 286.39 286.22 285.66 285.43 86xs3287 3427 286.50 286.34 285.77 285.54 86xs3367 3507 286.66 286.50 285.92 285.68 86xs3467 3607 286.85 286.67 286.08 285.84 86xs3533 3673 287.00 286.82 286.23 285.98 86xs3637 3777 287.20 287.03 286.48 286.20 86xs3744 3884 287.37 287.21 286.67 286.41 86xs3814 3954 287.51 287.34 286.80 286.54 86xs3883 4023 287.59 287.42 286.88 286.62 86xs3948 4088 287.70 287.52 286.99 286.73 86xs3995 4135 287.77 287.60 287.06 286.80 86xs4056 4196 287.83 287.66 287.12 286.86 86xs4125 4265 287.86 287.69 287.17 286.92 86xs4168 4308 287.90 287.73 287.21 286.97 86xs4237 4377 287.98 287.81 287.28 287.04 86xs4292 4432 288.05 287.88 287.35 287.11 86xs4386 4526 288.32 288.14 287.59 287.35 86xs4449 4589 288.52 288.34 287.79 287.53 05xs42b 4723 288.84 288.64 288.06 287.78 05xs43b 4859 289.16 288.98 288.44 288.16 05xs43b 4859 289.16 288.98 288.44 288.16 05xs43 4983 289.25 289.08 288.63 288.41 05xs43 4983 289.25 289.08 288.63 288.41
05xs43c 5060 289.37 289.21 288.73 288.51 86xs5122 5262 289.53 289.36 288.89 288.69 86xs5235 5327 289.54 289.38 288.93 288.75 86xs5440 5580 290.24 290.07 289.59 289.35 86xs5633 5773 290.86 290.69 290.09 289.84 86xs5710 5850 291.07 290.90 290.27 290.03
26 Environment Bay of Plenty
Hydraulic Modelling of the Ngongotaha Stream Operations Publication 2007/03
280
281
282
283
284
285
286
287
288
0 200 400 600 800 1000 1200 1400 1600 1800
Natural Bank L.B. Natural Bank R.B. Stopbank L.B. Stopbank R.B. 1%AEP_L280.3 2%AEP_L280.3
Figure 7: Comparison of estimated flood levels against bank levels for the downstream reaches of Ngongotaha Stream
Ngo
ngot
aha
R
oad
Brid
ge
Rai
lway
Brid
ge
Environment Bay of Plenty 27
Operations Publication 2007/03 Hydraulic Modelling of the Ngongotaha Stream
285
286
287
288
289
290
291
292
3000 3500 4000 4500 5000 5500 6000
Natural Bank L.B. Natural Bank R.B. Stopbank L.B. Stopbank R.B. 1%AEP_L280.3 2%AEP_L280.3
Figure 8: Comparison of estimated flood levels against bank levels for the reaches upstream of chainage 3000

29
Operations Publication 2007/03 Hydraulic Modelling of the Ngongotaha Stream
References Barnett Consultants Limited, 1992, Hybrid: Bridge Backwater Calculation Program Users Guide
and Documentation
Bay of Plenty Catchment Commission, Nov 1988, Ngongotaha Stream Works Contract UK9, File No. 146/7/6 (photos of 1986 flood, and contract dates)
Bay of Plenty Catchment Commission, Scheme Design Drawings, K4465; K4498; K4392;
Guidelines 2001/04, Hydrological and Hydraulic Guidelines, Environment Bay of Plenty, 2001
Henderson, F.M., 1966, Open Channel Flow, MacMillan Publishing Company
Ministry of Works and Development, 1975, Metric Version of Technical Memorandum No.61, National Water and Soil Conservation Organisation
National Institute of Water and Atmospheric Research Ltd, 1995, High Intensity Rainfall Design System, (Electronic Database)
Operations Publication 2005/07 2001/01, Environmental Data Summaries, Environment Bay of Plenty.
Rotorua District Council, file 88 00 014, Recorded Flood Levels from 1/5/99 event
Survey Level Books: 395, 405, 444, 1986 Cross Section Survey; 352, 1983/84 Cross Section Survey; 697, 696, 2004 Cross Section Survey; 395, 397, 1986 flood levels; Environment Bay of Plenty
Ven Te Chow, 1964, Handbook of Applied Hydrology, McGraw Hill Book Company
West, P.M., Ngongotaha Hydraulic Model; Preliminary Results, Internal Memorandum, Environment Bay of Plenty, 21 June 2005


31
Operations Publication 2007/03 Hydraulic Modelling of the Ngongotaha Stream
Addendum
Addendum I .................................................Newly Available Aerial Survey Information

Environment Bay of Plenty 33
Operations Publication 2007/03 Hydraulic Modelling of the Ngongotaha Stream
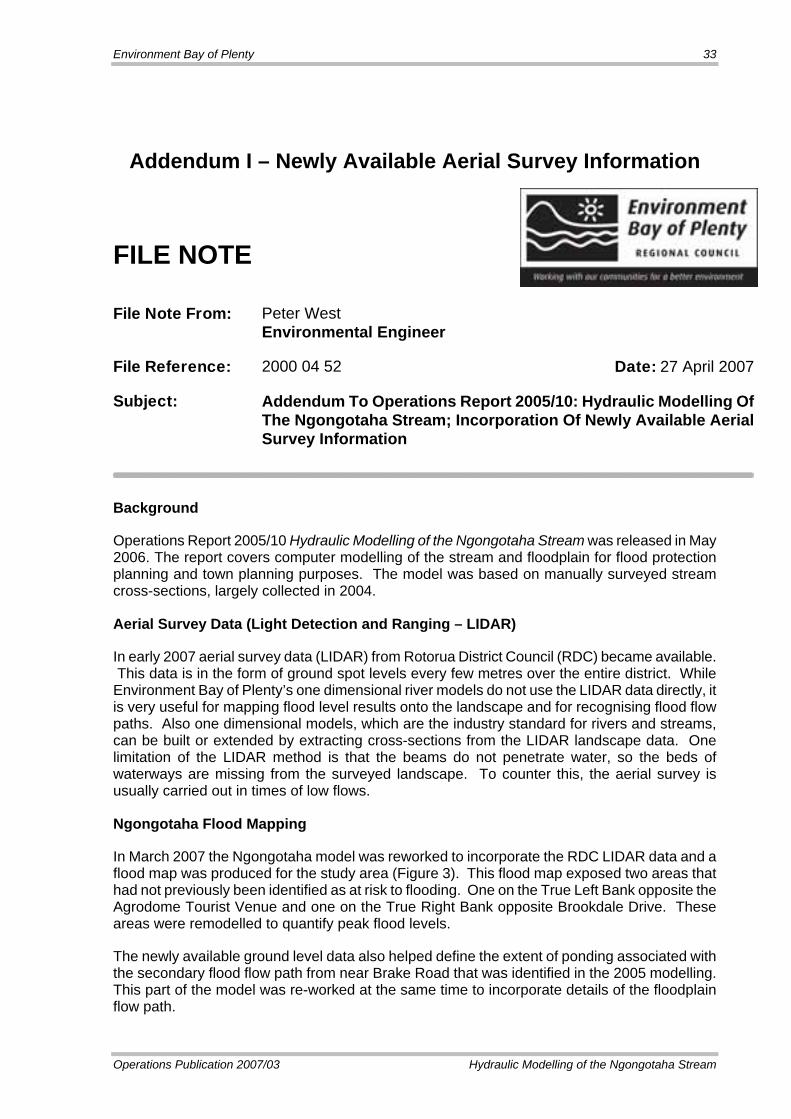
Addendum I – Newly Available Aerial Survey Information
FILE NOTE
Peter West File Note From: Environmental Engineer
File Reference: 2000 04 52 Date: 27 April 2007
Subject: Addendum To Operations Report 2005/10: Hydraulic Modelling Of The Ngongotaha Stream; Incorporation Of Newly Available Aerial Survey Information
Background
Operations Report 2005/10 Hydraulic Modelling of the Ngongotaha Stream was released in May 2006. The report covers computer modelling of the stream and floodplain for flood protection planning and town planning purposes. The model was based on manually surveyed stream cross-sections, largely collected in 2004.
Aerial Survey Data (Light Detection and Ranging – LIDAR)
In early 2007 aerial survey data (LIDAR) from Rotorua District Council (RDC) became available. This data is in the form of ground spot levels every few metres over the entire district. While Environment Bay of Plenty’s one dimensional river models do not use the LIDAR data directly, it is very useful for mapping flood level results onto the landscape and for recognising flood flow paths. Also one dimensional models, which are the industry standard for rivers and streams, can be built or extended by extracting cross-sections from the LIDAR landscape data. One limitation of the LIDAR method is that the beams do not penetrate water, so the beds of waterways are missing from the surveyed landscape. To counter this, the aerial survey is usually carried out in times of low flows.
Ngongotaha Flood Mapping
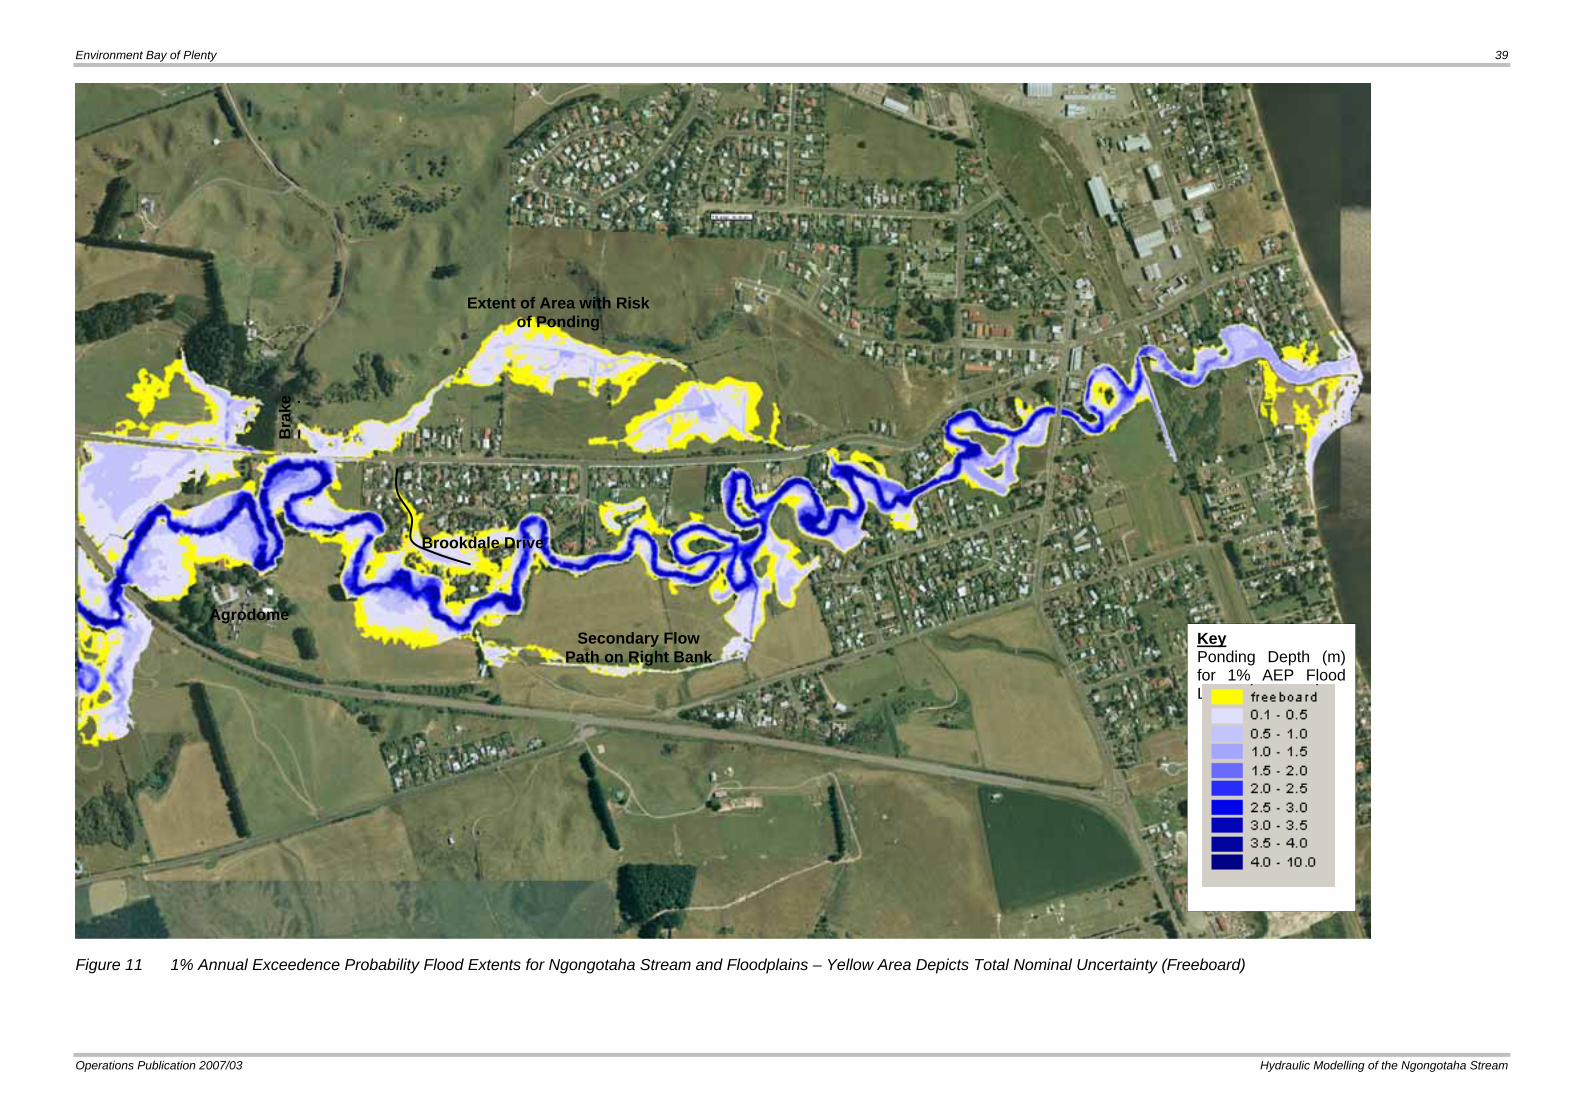
In March 2007 the Ngongotaha model was reworked to incorporate the RDC LIDAR data and a flood map was produced for the study area (Figure 3). This flood map exposed two areas that had not previously been identified as at risk to flooding. One on the True Left Bank opposite the Agrodome Tourist Venue and one on the True Right Bank opposite Brookdale Drive. These areas were remodelled to quantify peak flood levels.
The newly available ground level data also helped define the extent of ponding associated with the secondary flood flow path from near Brake Road that was identified in the 2005 modelling. This part of the model was re-worked at the same time to incorporate details of the floodplain flow path.
34 Environment Bay of Plenty
Hydraulic Modelling of the Ngongotaha Stream Operations Publication 2007/03
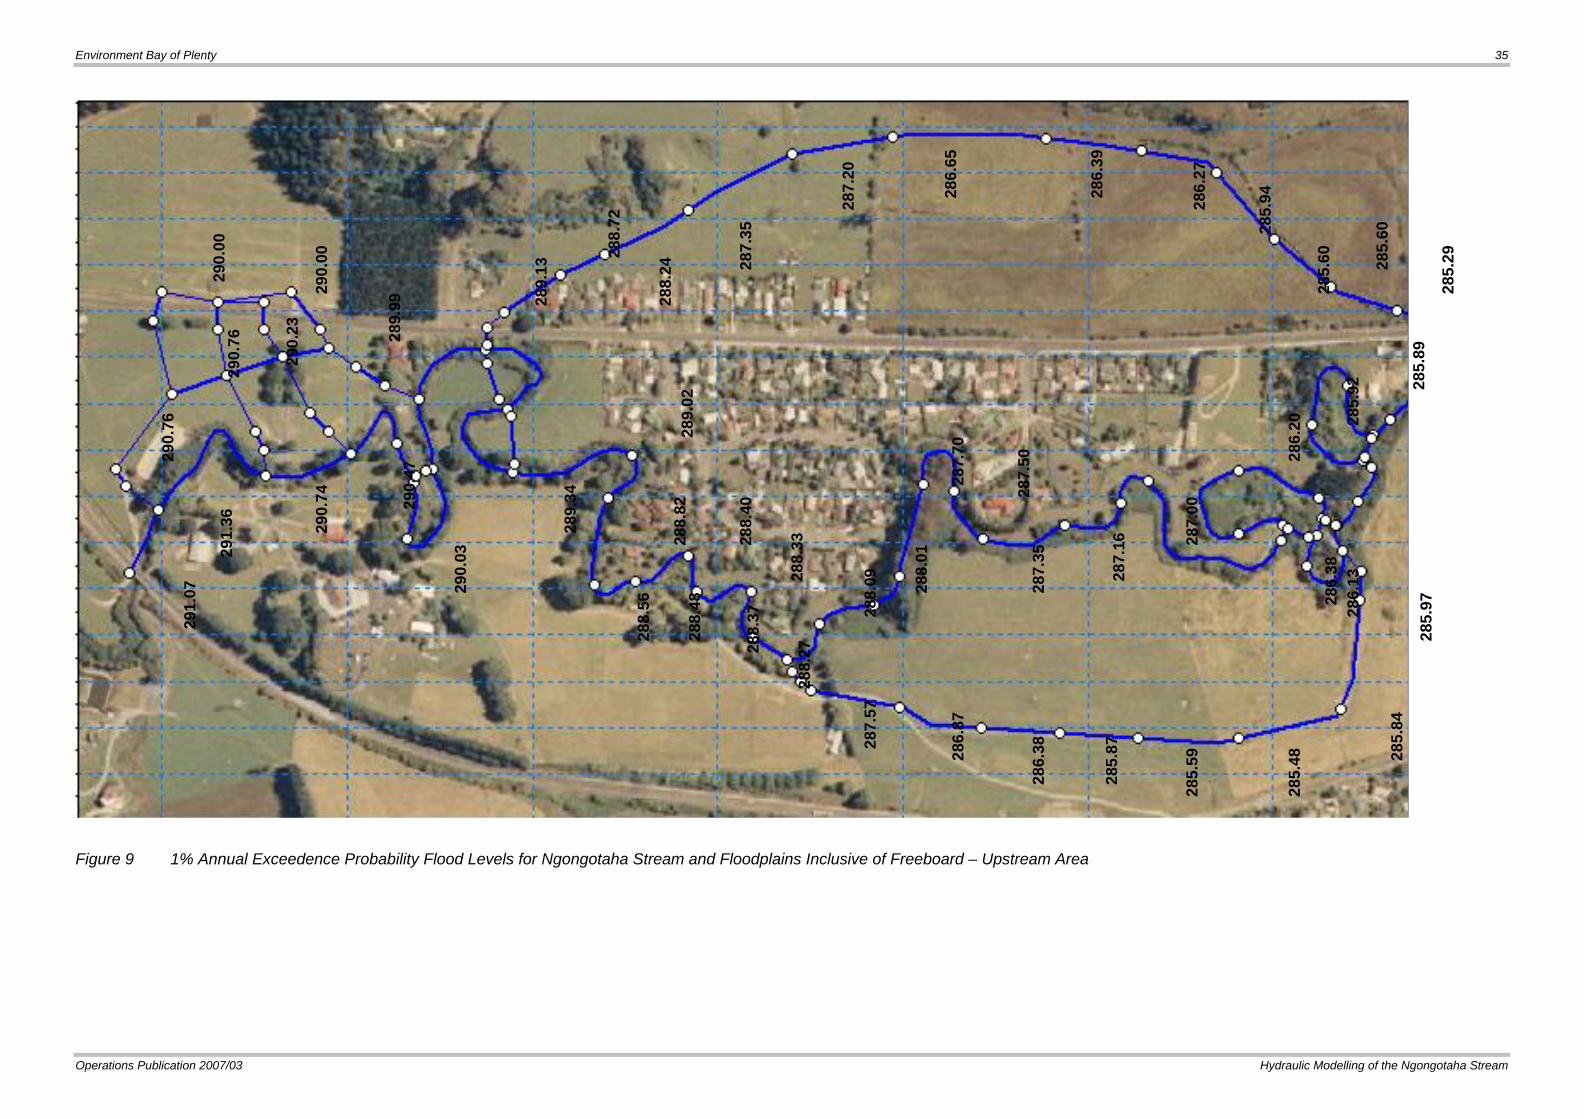
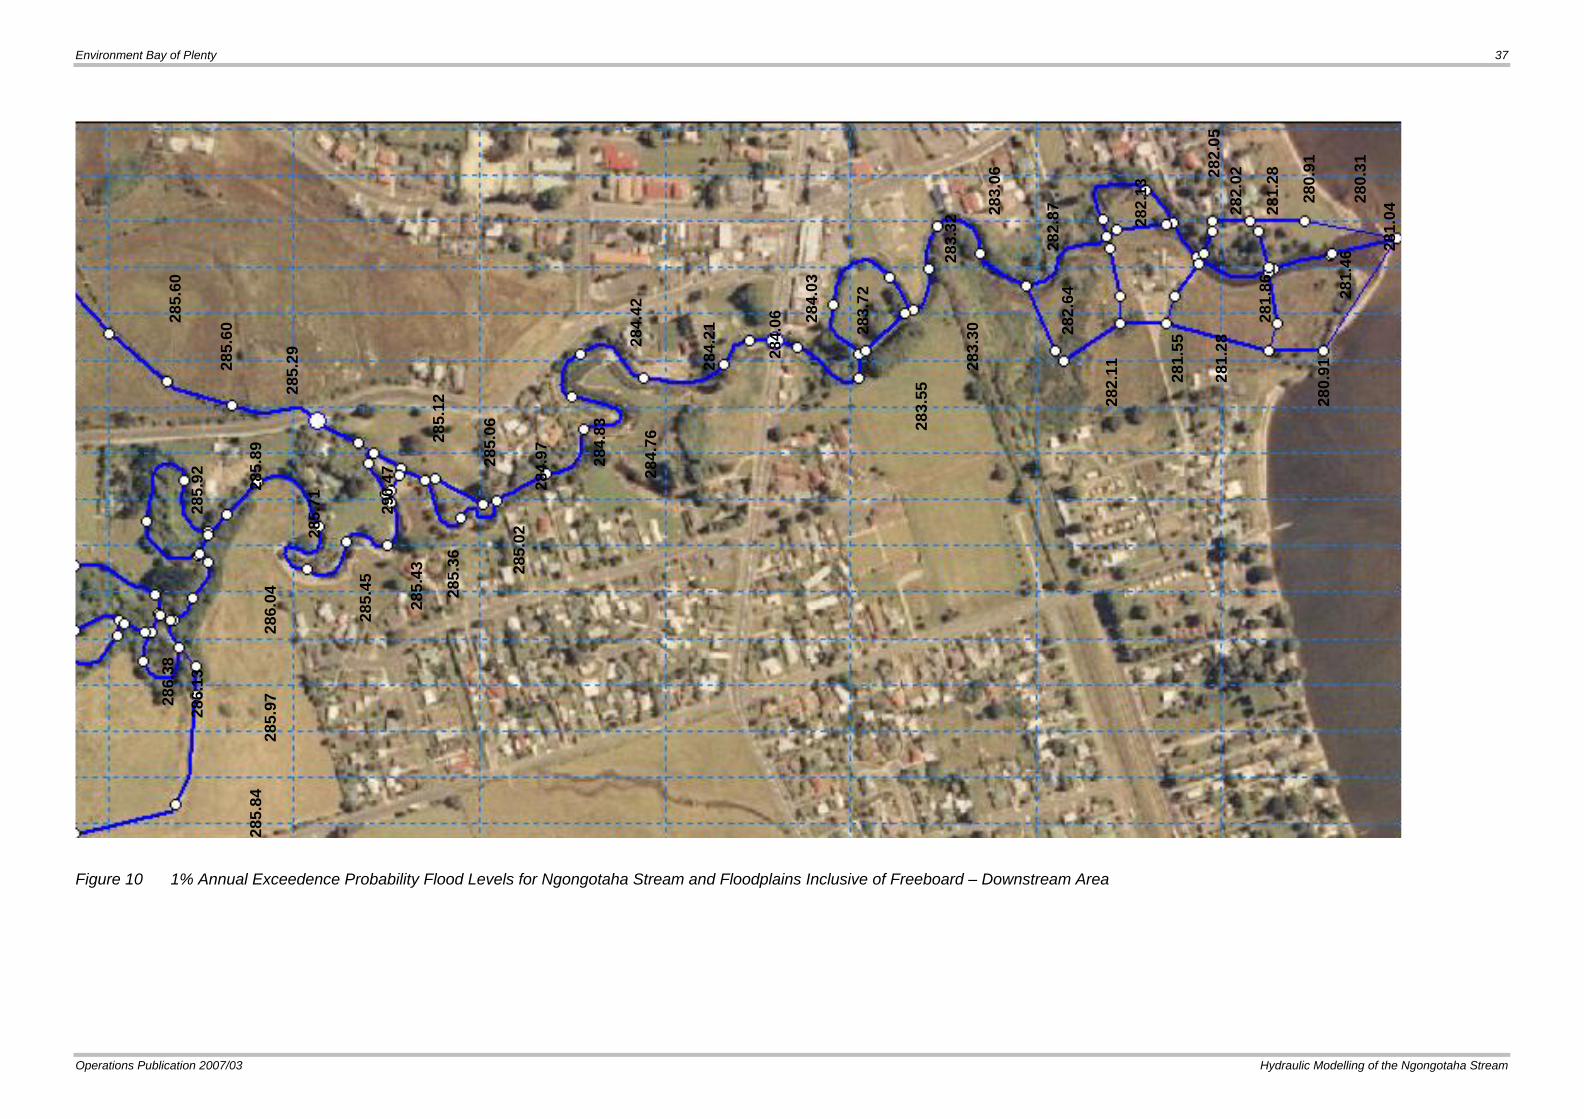
Figures 1 and 2 represent the peak water levels and Figure 3 shows flood extents of 1% Annual Exceedence Probability (AEP) flooding. These figures do not represent a single flood event but rather a combination of separate critical events for each of the stream and the floodplain systems. In this context “floodplain” is used to refer to areas that do not directly form part of the main river channel during normal flow, but rather are flooded when water spills from the main river channel over a constriction or weir-like bank to follow a “secondary flow path”.
These figures only show risk of flooding from the Ngongotaha Stream. It should be noted that additional flooding could occur due to high levels in Lake Rotorua or side tributaries. This fact must be considered when using these figures for planning purposes.
Flood Extents on Floodplains
To assess the extents of flooding on the Ngongotaha Floodplains, locations were identified where water would likely spill from the main channel. The ground surface at these locations has been carefully represented from either ground survey or aerial survey, and incorporated into the model. A separate model simulation was run that allowed floodwater to spill across the constriction into the secondary flow path that represents the downstream floodplain.
Dealing with Modelling Uncertainty
Environment Bay of Plenty has several methods of dealing with uncertainty relating to flood levels/extents. One such approach is the concept of “freeboard allowance”. Freeboard is used to represent computational uncertainties from all sources such as: uncertainties relating to the estimation of the Design Flow; potentially inaccurate depictions of the physical water flows; also wave action, super-elevation, sediment transport and accumulation, debris build-up and turbulence; which are all features that are not explicitly included in the modelling analysis.
Freeboard is usually applied as an additional vertical component added onto the estimated flood level; for example the Ngongotaha Stop banks are designed to “1% AEP plus 500mm freeboard”. The magnitude of freeboard applied is selected by the Design Engineer based on a partially qualitative approach. Freeboard often includes a component relating to the magnitude of risk; hence urban areas often have slightly higher freeboard allowances than rural areas.
Uncertainty is dealt with in a slightly different way on floodplains. Here, because the majority of uncertainty relates to the relationship between the river level and the level of the ground at the spill location, a method is used that assesses the sensitivity of the floodplain flood level to changes in the modelled river level.
Depicting Modelling Uncertainty on Flood maps
The flood extent in Figure 3 is colour coded. Each grid cell is coloured based on the estimated water depth during the critical 1% AEP flood event for that location. The flood extent relating to the nominal uncertainty is shown in yellow. For areas in or directly connected to the main river channel, this extent relates to the ground surface at 500mm above the estimated 1% AEP river level. Flood level results that incorporate this nominal allowance are said to be “inclusive of freeboard”. For floodplain areas, this yellow colour depicts land that becomes flooded when the modeller tests the sensitivity of the spill location to the nominal river level variation. In the case of the Ngongotaha Stream model, the river level variation tested was 500mm.
Environment Bay of Plenty 35
Operations Publication 2007/03 Hydraulic Modelling of the Ngongotaha Stream
Figure 9 1% Annual Exceedence Probability Flood Levels for Ngongotaha Stream and Floodplains Inclusive of Freeboard – Upstream Area
290.
00
290.
00
289.
99
290.
76
290.
76
290.
23
289.
13 28
8.72
290.
03
290.
47
290.
74
291.
36
291.
07
289.
34
289.
02
288.
82
288.
56
288.
40
288.
48
288.
37
288.
33
288.
27
287.
57
286.
87
286.
38
285.
87
285.
59
285.
48
285.
84
285.
97
288.
09
288.
01
287.
70
287.
50
287.
35
287.
16
287.
00
286.
20
285.
92
285.
89
286.
13
286.
38
288.
24
287.
35
287.
20
286.
65
286.
39
286.
27
285.
94
285.
60
285.
60
285.
29

Environment Bay of Plenty 37
Operations Publication 2007/03 Hydraulic Modelling of the Ngongotaha Stream
Figure 10 1% Annual Exceedence Probability Flood Levels for Ngongotaha Stream and Floodplains Inclusive of Freeboard – Downstream Area
285.
60
285.
06
285.
12
285.
60
285.
92
285.
29
284.
97
284.
83
285.
36
290.
47
285.
45
285.
71 28
5.89
284.
03
284.
06
283.
72
283.
55
285.
02
283.
30
283.
32
282.
87
283.
06
282.
64
286.
13
285.
84
286.
04
285.
43
284.
76
285.
97
286.
38
284.
42
284.
21
281.
28
281.
55
280.
91
281.
86
280.
31
282.
13 28
2.05
282.
11
281.
46
280.
91
281.
04
281.
28
282.
02

Environment Bay of Plenty 39
Operations Publication 2007/03 Hydraulic Modelling of the Ngongotaha Stream
Figure 11 1% Annual Exceedence Probability Flood Extents for Ngongotaha Stream and Floodplains – Yellow Area Depicts Total Nominal Uncertainty (Freeboard)
Key Ponding Depth (m) for 1% AEP Flood Levels
Bra
ke
Rd
Extent of Area with Risk of Ponding
Brookdale Drive
Secondary Flow Path on Right Bank
Agrodome