Embed Size (px)
Citation preview

Jørgen C. Arentz Rostrup, Executive Vice President and CFOSEB Enskilda Nordic Seminar, January 11, 2012
Hydro - a resource rich and fully integrated aluminium company

Fully integrated throughout the value chain
Bauxite Alumina Energy Primary Casting Products
Rolling
Extrusion
Recycling
Recycling

Aluminium is part of the solution
Source: CRU
5-7% annual
growth indemand
Capabilities
Global trends Capabilities
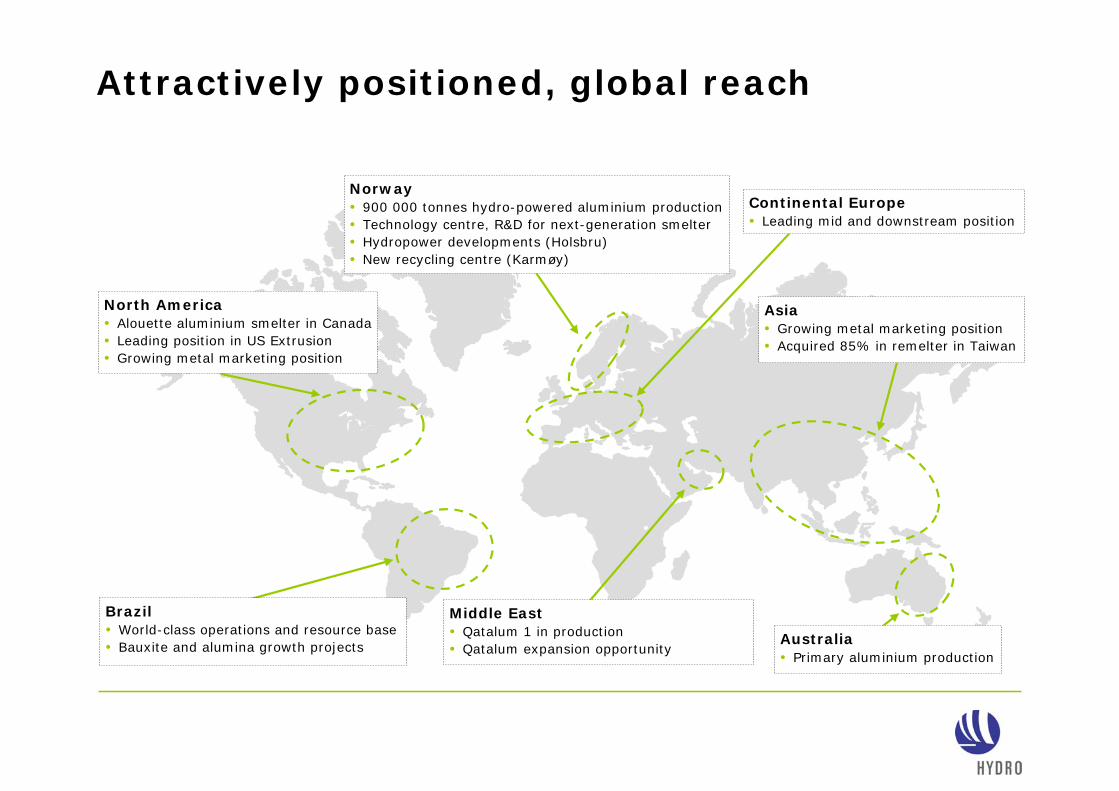
Attractively positioned, global reach
Continental Europe• Leading mid and downstream position
Asia• Growing metal marketing position• Acquired 85% in remelter in Taiwan
Norway• 900 000 tonnes hydro-powered aluminium production• Technology centre, R&D for next-generation smelter• Hydropower developments (Holsbru)• New recycling centre (Karmøy)
North America• Alouette aluminium smelter in Canada• Leading position in US Extrusion• Growing metal marketing position
Brazil• World-class operations and resource base• Bauxite and alumina growth projects
Middle East• Qatalum 1 in production• Qatalum expansion opportunity
Australia• Primary aluminium production

World-class bauxite and alumina assets
• Integrated through pipeline
• Technological frontrunner
•Competitive cost position
• Top quality alumina
•Successful integration
•Solid production improvement
Paragominas and Alunorte

0
1
2
3
4
5
6
7
8
9
10
Further improved bauxite and alumina productionAnnualized production million mt • Alunorte production up 16% from
Q1 to Q3 2011
• Paragominas production up 27% from Q1 to Q3 2011
• Continued focus on implementing Hydro production system
• Focus on stabilizing production in Q4
Q2Q1*ParagominasAlunorte
Q2Q1*Q3 Q3
* Pro-forma

Qatalum streamlining in 2012
•All cells in production•1350 MW power plant at full
capacity
• Focus on production optimization
• Target annual production of 600 000 mt

Qatalum –1st quartile cost position
• On track to exceed nameplate capacity first year of full production
• 1st quartile cost position established
• Cash cost around USD 1400-1500 per mt at 2010 market conditions
• Operational excellence and cost optimization focus going forward
• Project cost at USD 5.8 billion delivered 0
200
400
600
2010 2011 2012
Liquid production, thousand mt
Further creep potential beyond 2012
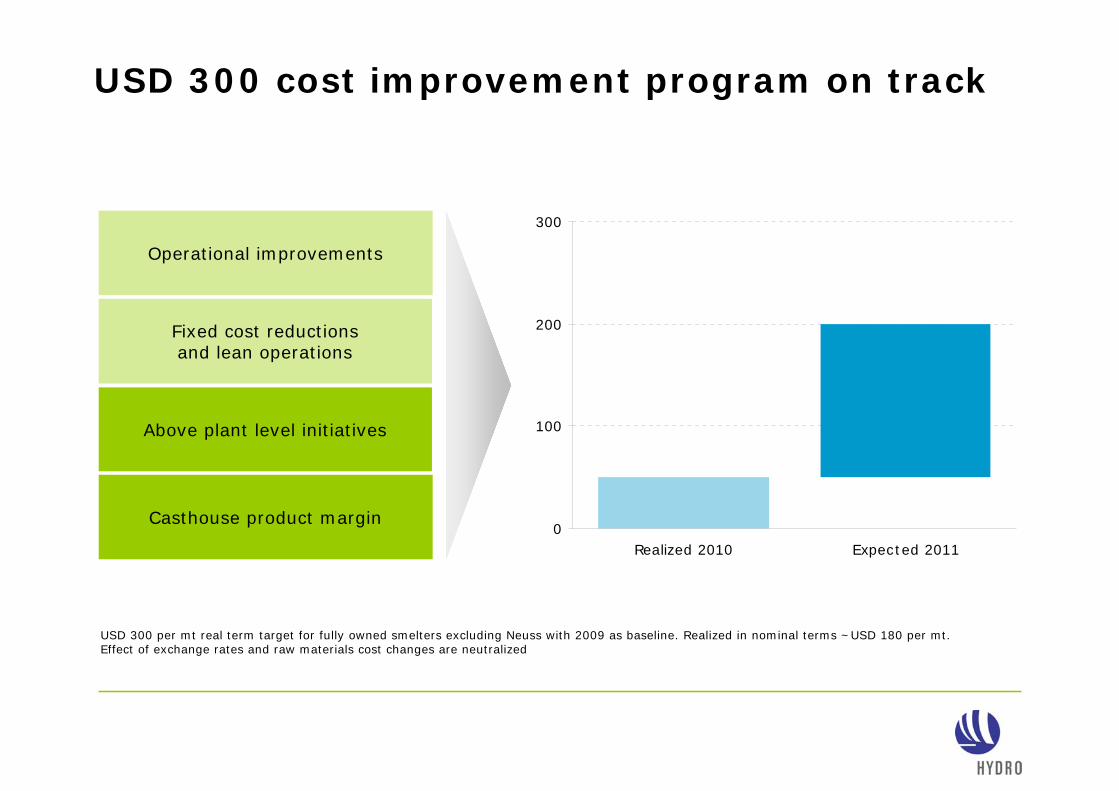
USD 300 cost improvement program on track
Casthouse product margin
Operational improvements
Fixed cost reductionsand lean operations
Above plant level initiatives
0
100
200
300
Realized 2010 Expected 2011
USD 300 per mt real term target for fully owned smelters excluding Neuss with 2009 as baseline. Realized in nominal terms ~USD 180 per mt. Effect of exchange rates and raw materials cost changes are neutralized

Aluminium industry facing cost pressure
• Increasing cost of input factors
• Fixed cost pressure from inflation
•Strong raw-material driven currencies14%
17%
36%
41%44%
58%
17%
RealizedLME price
Petroleumcoke
Causticsoda
Fuel oil Coal Alumina Bauxite
1) 1) PACE: Mid price USGC. 2) CMAI: Average acquisition price FOB USGC3) Reuters Ecowin: Crude oil - Brent
4) Reuters Ecowin: Coal – CIF ARA5) 13% of LME 3 month price with 2.5 months delay6) Average LME 3 month price with 3-12 months lag
Revenue and cost drivers Jan-Sep 2011 vs 2010
Aluminium smelting Alumina refining

• Increase value of energy business
• Develop current base• Global approach to
power sourcing
• Reposition• Keep solid cash flow in
current assets• Expand in first quartile
assets
• Excellence in operations
• Expand capacity• Commercialize
Strategy for further value creation
• Continue proven high-end product strategy
• Streamline European assets
• Expand selectively in emerging markets
Bauxite & Alumina Primary Metal Energy Mid- and downstream

Macro economic situation – global uncertainty
EuropeSovereign debt concern
United StatesDemand issue
ChinaReduced growth

Agenda 2010 and corrective actionssuccessfully executed
• Remelt production reduced by ~50%
• 450 000 tonnes annual primary capacity curtailed
• CAPEX 2009* reduced ~50%
• Net operating capital reduced by 5.8 BNOK
• Substantial cost cutting upstream and downstream
• Managing interface with customers successfully
• Restructuring and demanning in Corporate and BA staffs
Navigate the stormNavigate the storm
Stay focusedStay focused
Shape the futureShape the future
*Excluding Qatalum

Prepared for challenging period
• Strong balance sheet to face volatility
• Reduction in net operating capital days and sustaining capital expenditure
• Margin management and remelt flexibility
• No restart of idled capacity
• Cost improvement programs

500
1 000
1 500
2 000
2 500
3 000
0% 10% 20% 30% 40% 50% 60% 70% 80% 90% 100%
2011
Business operating cost aluminiumUSD per mt
Aluminium cost curve lifted by cost pressure
Source: CRU, LME USD 2 100 per mt, NOK/USD 5.56
Accumulated world capacity, %

18 000
19 000
20 000
21 000
22 000
23 000
24 000
25 000
26 000
27 000
28 000
2006 2007 2008 2009 2010 2011 2012
Supply Demand
Healthy demand growth expectedManageable supply/demand balance
Source: CRU/Hydro
World excluding China, thousand mt
Supply influences• New projects
• Potential restarts• Potential curtailments
• Supply disruptions
Base case3-5 % p.a.
Demand influences• Developing regions• European debt crisis
• Strength of US recovery

Third party sales ~20% of global bauxite production
ChinaRest of World
Bauxite production 2011: ~250 million mt
Source: Antaike/Hydro

China highly dependent on bauxite import
Annualized aluminium equivalents*, million mt • Share of imported bauxite in China in 2011: ~43%
• Quality of domestic bauxite resources is deteriorating
• Indonesia supplies 80% of imported bauxite, Australia the remaining 20%
Bauxite *Bauxite to aluminium conversion factor: 5.4
ChinaRest of World
Source: Antaike/Hydro
- 5
0
5
10
15
Importto China
Export from China
2006 2007 2008 2009 2010 2011

Alumina production 2011: ~90 million mt
Rest of WorldChina
Third party sales ~35% of global alumina production
Source: Antaike/Hydro

Rest of World
Chinese domestic alumina capacity increasing
China
Annualized aluminium equivalents*, million mt • ~65 % of smelter production in China is not integrated with alumina
• China has capacity to be balanced in alumina
Alumina *Alumina to aluminium conversion factor: 1.925Source: Antaike/Hydro
- 5
0
5
10
15
Importto China
Export from China
2006 2007 2008 2009 2010 2011

Chinese trade barriers for primary aluminium
SHFEVAT
TollingExport duties
Transport Premiums
LME
Annualized aluminium equivalents, million mt • Declared goal of self-sufficiency in primary aluminium
• Arbitrage opportunities between LME and SHFE in 2009
Primary AluminiumSource: Antaike/Hydro
- 5
0
5
10
15
Importto China
Export from China
2006 2007 2008 2009 2010 2011

China increasing exports of fabricated and semis
Rest of World
Fabricated Semis
China
Annualized aluminium equivalents, million mt • Majority of exports to Asian markets
• Challenged by antidumping measures in the US and Europe
• Declared goal of exporting higher value added products
Source: Antaike/Hydro
- 5
0
5
10
15
Importto China
Export from China
2006 2007 2008 2009 2010 2011

China – significant net importer of aluminium
Fabricated SemisScrapBauxiteAlumina Primary aluminium
Annualized aluminium equivalents*, million mt • Size of bauxite, alumina and scrap import reduces the influence of other products along the value chain
Source: Antaike/Hydro
Importto China
Export from China
2006 2007 2008 2009 2010 2011
- 5
0
5
10
15
*Bauxite/alumina to aluminiumconversion factor: 5.4/1.925

Demand will increase substantially…
Source: CRU/Antaike/Hydro
49
36
23
0
10
20
30
40
50
60
2010 2015 2020
China’s demand for semis expected to increase substantially going forward…
Demand for semis, China, million mt
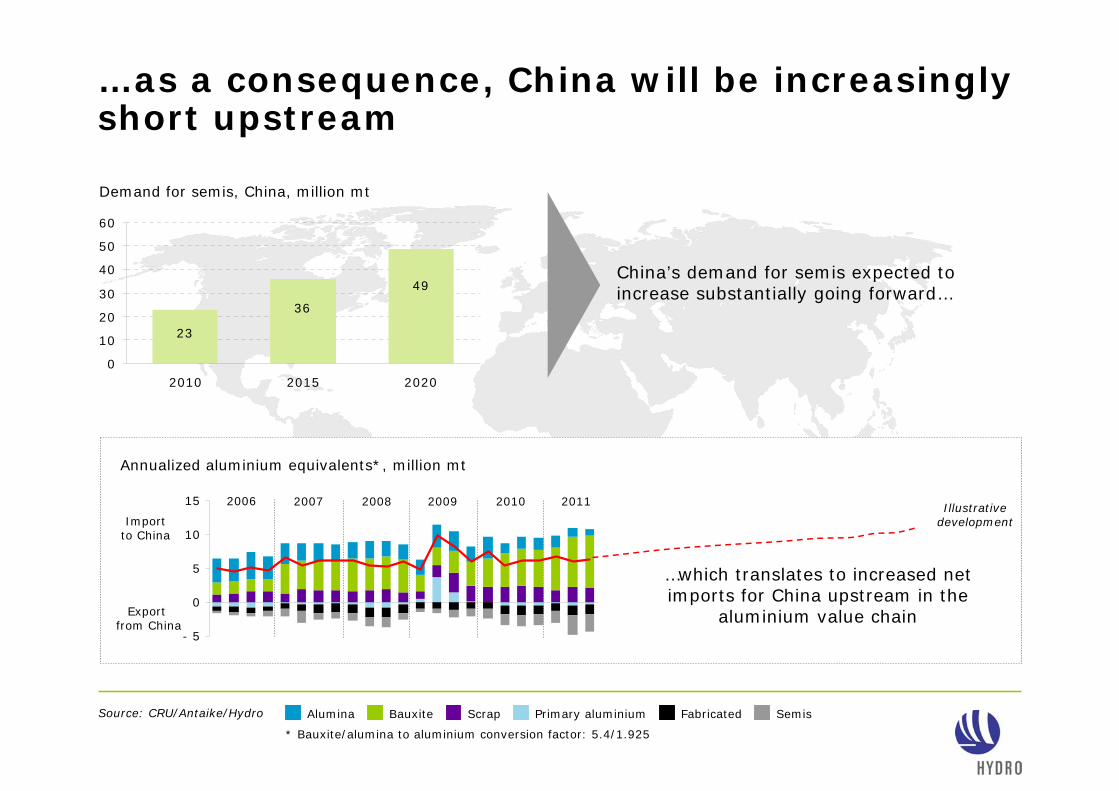
…as a consequence, China will be increasingly short upstream
49
36
23
0
10
20
30
40
50
60
2010 2015 2020
China’s demand for semis expected to increase substantially going forward…
Demand for semis, China, million mt
Fabricated SemisScrapBauxiteAlumina Primary aluminium
Annualized aluminium equivalents*, million mt
Source: CRU/Antaike/Hydro
Importto China
Export from China
2006 2007 2008 2009 2010 2011
- 5
0
5
10
15
…which translates to increased net imports for China upstream in the
aluminium value chain
Illustrative development
* Bauxite/alumina to aluminium conversion factor: 5.4/1.925

Long upstream positions give strategic flexibility
• Industry consolidation
• Long position creates flexibility • Growing smelter portfolio• Capturing commercial opportunities
• CAP and Paragominas projects will further strengthen alumina position
2,3
3,3
2,4
1,5
0,3
Bauxite Alumina Aluminium
Current annual consolidated capacity in metal equivalents
Million mt
MRN bauxite contract Rio Tinto alumina contract

Alumina pricing shifting from LME-link to market fundamentals
• Future pricing should reflect fundamentals of bauxite and alumina value chain
• Spot market activity is important
• New norm for the industry• Index pricing and shorter-term
contracts (3-4 years)• Getting wider acceptance in the market
<2000 2011
Contract durations
Long-term contracts (>6 years)
Medium-term contracts (3-5 years)
Spot (< 2 years)
45%
35%
20% 25%
55%
20%

Ideally positioned for future growth
HolsbruVasstølHydro power
Qatalum 2Metal
CAPAlumina
ParagominasBauxite
AlouetteMetal
AcroSuzhouExtrusion

• Improve relative position• Focus on operational excellence• Develop commercial opportunities• Manage portfolio actively
Future value creation

www.hydro.com