Embed Size (px)
Citation preview

hydroAMP: an equipment condition assessment framework
2012 Capital Investment Review Workshop
April 19, 2012
Portland, OR

2012 Capital Investment Review Workshop: April 19, 2012 2
The Need
• Equipment reliability significantly affects system generation availability and financial performance.
A significant amount of critical equipment in hydro facilities in North America is near or beyond its design life.
Substantial investment to repair, refurbish, or replace unreliable equipment is anticipated.
• The process for identifying and prioritizing investments needs strengthening – capital is a limited resource.
Equipment condition assessment tools used in the past have been complex
and costly to administer.
Establishing an objective, consistent and efficient assessment process is critical for informed decision making.

2012 Capital Investment Review Workshop: April 19, 2012 3
hydroAMP Partners
• In 2001, the Bureau of Reclamation (BOR), Hydro-Québec (HQ), the
Army Corps of Engineers’ Hydroelectric Design Center (HDC), and
Bonneville Power Administration (BPA) began collaborating on a
hydroelectric equipment condition assessment technique that was later
named “hydroAMP”, or hydro Asset Management Partnership.
• The hydroAMP Partners worked on the program for 5 years and in
2006, with the publication of a report describing the condition
assessment technique, its development and its potential applications,
officially rolled out hydroAMP during HydroVision.

hydroAMP Concept

2012 Capital Investment Review Workshop: April 19, 2012 5
Condition Assessment Principles
• Objective results
• Developed from routine tests and inspections
• Simplified process
• Easy interpretation
• Technically sufficient (valid though not necessarily perfect)
• Consistent and repeatable results
• Start small, expand with time
• Open to improvement

2012 Capital Investment Review Workshop: April 19, 2012 6
Framework
• A guidebook currently
outlines condition ratings
for 11 equipment types.
• The guidebook was
developed to facilitate
asset management
decisions using
equipment condition
assessments.
• The guidance is open and
flexible to fit into the
existing structure of each
utility’s maintenance,
planning, budgeting and
decision-making
processes.
Tier 1 StartTrack Trends in Equipment Performance and Condition Indicators through
Routine Periodic Maintenance (Appropriate Tests and Inspections)
Condition Assessment Index (CAI)Determine the Equipment’s Condition Assessment Index (good, fair, poor)
Is action required?Yes
No
Tier 2: Additional Tests and
Inspections,
if needed
Should the investment
be prioritize for action during
the next cycle?
Yes
No
Business CaseRisk of Failure Economic Consequences
Tier 2: Additional Tests
and Inspections,
if needed
Is the
investment justified?
Prioritize and Complete
Business Justification
and/or Record
Is the action
needed immediately?
Complete
Yes
No
Yes
Tie
r 1
Tie
r 1
No
Tie
r 2
Monitor
& adjust
CAI
Bu
sines
s
Anal
ysis
/Ris
k-B
ased
Dec
isio
n

2012 Capital Investment Review Workshop: April 19, 2012
Equipment Guides
• Surge Arrestors
• Transformers
• Turbines
• Generators – in revision - 2011
• Governors
• Exciters – revised 2011
• Cranes
• Batteries
• Compressed Air System
• Emergency Closure Gate and Valve
7

2012 Capital Investment Review Workshop: April 19, 2012 8
Condition Assessment: Two-Tier Approach
Tier 1
The rating is based on condition indicators derived from tests,
measurements, and inspections that are normally performed during
routine O&M activities.
The assessment results in a “Condition Index” with a rating scale of zero
to 10; higher CI means better condition.
Mid- to low-range values may trigger a Tier 2 evaluation.
Assessment results are easily entered into CMMS or other databases
for tracking and reporting.

2012 Capital Investment Review Workshop: April 19, 2012 9
Tier 2
Includes in-depth, non-routine tests or inspections that may be invasive and/or require specialized equipment and expertise not normally found at the hydro plant.
Results are used to adjust the Condition Index score (either up or down).
Adds confidence to the assessment results and conclusions.
Condition Assessment: Two-Tier Approach (cont.)

2012 Capital Investment Review Workshop: April 19, 2012 10
Data Quality Indicator
Is a stand-alone indicator used to reflect the quality of information available
for performing the condition assessment.
Recognizes that data may be missing, out of date, or of questionable
integrity.
Is important because poor data could affect the accuracy of individual
condition indicator scores as well as the validity of the overall Condition
Index.
Condition Assessment: Data Quality

Turbine Example

2012 Capital Investment Review Workshop: April 19, 2012 12
Tier 1 Condition Index and Data Quality Indicator
Tier 1 condition indicators:
Age
Physical Condition
Operational Limitations
Maintenance
Condition indicators are scored and weighted, then summed to calculate the Condition Index.
The Data Quality Indicator is scored separately.

2012 Capital Investment Review Workshop: April 19, 2012 13
Tier 1 Condition Indicator Scoring
Table 1 – Turbine Age Scoring
Age Age
New / Full Rehabilitation Partial Rehabilitation Condition Indicator Score
0 – 25 years 0 – 15 years 3
26 – 35 years 16 – 25 years 2
36 – 45 years 26 – 35 years 1
> 45 years > 35 years 0

2012 Capital Investment Review Workshop: April 19, 2012 14
Summary of Tier 1 Turbine Assessment
Tier 1 Turbine Condition Summary (For instructions on indicator scoring, please refer to condition assessment guide)
No. Condition Indicator Score X Weighting Factor = Total
1 Age (Score must be 0, 1, 2, or 3)
2 1.000 2
2 Physical Condition (Score must be 0, 1, 2, 3, or 4)
3 1.000 3
3 Operations (Score must be 0, 0.5, 1, or 1.5)
1.5 1.000 1.5
4 Maintenance (Score must be 0, 0.5, 1, or 1.5)
1.5 1.000 1.5
Tier 1 Turbine Condition Index
(Sum of individual Total Scores) (Condition Index should be between 0 and 10)
8
Turbine Data Quality Indicator (Value must be 0, 4, 7, or 10)
4

2012 Capital Investment Review Workshop: April 19, 2012 15
Tier 2 Tests
Tier 2 Toolbox:
Efficiency
Capacity
Off-Design
Paint Film Quality
Surface Roughness
Cracking
Other Specialized Tests
Tier 2 results are used to refine the Tier 1 score.
The Data Quality Indicator also may be adjusted.
Cavitation
Condition of Remaining Parts
Environmental
Operating Conditions
Maintenance

2012 Capital Investment Review Workshop: April 19, 2012 16
Tier 2 Tests and Condition Index Adjustments
Condition assessment guides also provide criteria for using Tier 2 test results.
Table 12 – Cavitation Damage of Runner and Discharge Ring Test Scoring
Adjustment to
Cavitation Damage Condition Index Score
Minimal:
Stainless – frosting only
Carbon – frosting only Add 0.5
Moderate: Depth Area
Stainless < 1/8” < 5%
Carbon < 3/8” < 5% No Change
Severe: Depth Area
Stainless > 1/8” > 5%
Carbon > 3/8” > 5% Subtract 0.5

2012 Capital Investment Review Workshop: April 19, 2012 17
Using hydroAMP
hydroAMP was intended to be used in conjunction with performing
annual maintenance.
• Turbines: As your filling out your performing your cavitation mapping, the hydroAMP turbine assessment should be filled in.
• If you have Tier 2 data, use it: Cavitation, Reliable On-line Efficiency Monitoring, etc.

2012 Capital Investment Review Workshop: April 19, 2012 18
hydroAMP Simplicity
The idea was to “KEEP IT SIMPLE.”
Minimal time to perform, if you’re doing it while you are performing maintenance.
You’re already thinking about the equipment and how it’s performing.
How not to use it:
• Not a paperwork exercise.
• Last minute reporting of condition because of performance measures.
Make it meaningful.

2012 Capital Investment Review Workshop: April 19, 2012 19
hydroAMP Data Management
Equipment guides and assessment data and are stored in a secure web-accessible database.
The database stores and reports Tier 1 condition assessments.
Adjustments for Tier 2 assessments have recently been added.
It is expandable to include new plants and equipment.
www.bpa.gov/secure/hydroAMP

2012 Capital Investment Review Workshop: April 19, 2012 20
hydroAMP Database: Main Page
2012 Capital Investment Review Workshop: April 19, 2012
hydroAMP Database: Tier 1 Turbine Assessment
21
2012 Capital Investment Review Workshop: April 19, 2012
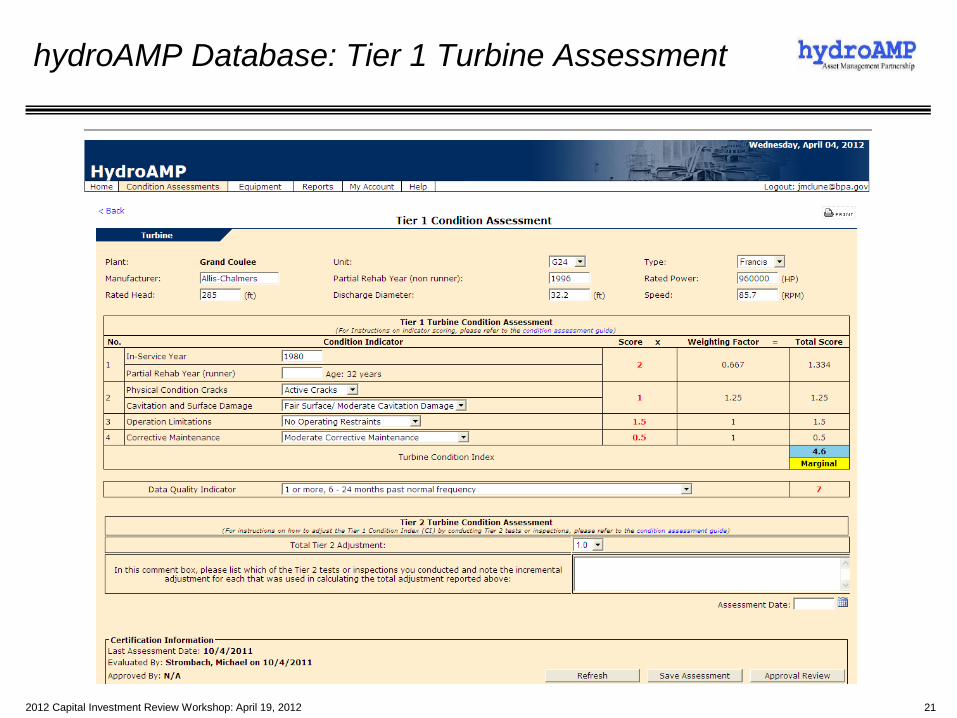
hydroAMP Database: Powertrain Summary Report
22

2012 Capital Investment Review Workshop: April 19, 2012 23
hydroAMP Database: User Accounts
• Access to the database and website is restricted and requires a user
account.
• Accounts may be requested by e-mail to [email protected], by
providing the user’s first and last name, company, job title, telephone
number, and e-mail address. The request should also identify the
hydro plants the user wishes to access.
• The hydroAMP administrator will assign a log-in and password, and
send this information via e-mail to the user.

Applying hydroAMP Results in Asset Planning

2012 Capital Investment Review Workshop: April 19, 2012
Current Condition by Plant: All Equipment
25 25
0%
20%
40%
60%
80%
100%
Bo
nn
evi
lle
Ch
ief J
ose
ph
Gra
nd
Co
ule
e
Joh
n D
ay
McN
ary
The
Dal
les
Dw
ors
hak
Hu
ngr
y H
ors
e
Ice
Har
bo
r
Lib
by
Litt
le G
oo
se
Low
er
Gra
nit
e
Low
er
Mo
nu
me
nta
l
Alb
en
i Fal
ls
Big
Clif
f
Co
uga
r
De
tro
it
De
xte
r
Fost
er
Gre
en
Pe
ter
Hill
s C
ree
k
Loo
kou
t Po
int
Lost
Cre
ek
Pal
isad
es
An
de
rso
n R
anch
Bla
ck C
anyo
n
Bo
ise
Div
ers
ion
Ch
and
ler
Gre
en
Sp
rin
gs
Min
ido
ka
Ro
za
Main Stem Columbia Headwater/Lower Snake Area Support Local Support
Good Fair Marginal Poor
25

2012 Capital Investment Review Workshop: April 19, 2012 26 26
Current Condition: Unit Reliability Equipment
26
0%
20%
40%
60%
80%
100%Be
arin
g G
uide
Bear
ing
Thru
st
Gen
erat
or C
oolin
g &
Mis
c.
Gen
erat
or C
ore
Gen
erat
or R
otor
Gen
erat
or W
indi
ng
Gov
erno
r Ele
ctri
cal
Gov
erno
r Mec
hani
cal
Tran
sfor
mer
Fir
e Pr
otec
tion
Tran
sfor
mer
Mai
n U
nit
Tran
sfor
mer
Pro
tect
ive
Rela
y Sy
stem
s
Brea
ker U
nit
Exci
ter
Fire
Pro
tect
ion
Uni
t
Pow
er B
us
Prot
ectiv
e Re
lay
Syst
ems
Turb
ine
Uni
t Con
trol
Boa
rds
Bearing Generator Governor Transformer .
Good Fair Marginal Poor

2012 Capital Investment Review Workshop: April 19, 2012
Risk: Condition Index vs. Likelihood of Failure
The hydro program correlates a condition rating with the likelihood of equipment failing to
perform as expected. An equipment component with a low condition rating has a higher
likelihood of failure than one with a higher rating. The correlation is shown below.
27 27

2012 Capital Investment Review Workshop: April 19, 2012
Current Financial Risk Map
28 28 28

2012 Capital Investment Review Workshop: April 19, 2012
The Total Cost is the present value sum of replacement and risk costs. The cost minimum of this curve is the point at which cost risk is forecasted to begin growing faster than the benefit of investment deferral.
This represents the optimum timing for equipment replacement.
Prioritizing Investments
Without intervention, condition degrades over time and the risk of equipment failing to perform as expected increases. Three factors influence the prioritization of investments:
• Replacement Cost, Lost Generation Risk, and Direct Cost Risk
Lost Generation Risk (LGR)
Direct Cost Risk (DCR)
Replacement Cost
Total Cost
PV C
ost
Time
Least cost time for refurbishment/replacement.
The point at which risk begins increasing faster
than the benef it of investment deferral.
29

2012 Capital Investment Review Workshop: April 19, 2012
Least Cost Case
• The least cost case represents all equipment being replaced at the cost minima.
0
100,000
200,000
300,000
400,000
500,000
600,000
FY2010 FY2012 FY2014 FY2016 FY2018 FY2020 FY2022 FY2024 FY2026 FY2028
in Thousands $
Large Capital Forecast
Committed - Reliability Committed - Opportunity Forecast - Safety/Environmental Forecast - Financial AFUDC
30

2012 Capital Investment Review Workshop: April 19, 2012
When funding constraints are applied, Total Cost for the system (system cost) increases because new investments are deferred past their cost minima.
Modeling Funding Constraints
0
50,000
100,000
150,000
200,000
250,000
300,000
350,000
400,000
450,000
500,000
FY2010 FY2012 FY2014 FY2016 FY2018 FY2020 FY2022 FY2024 FY2026 FY2028
in Thousands $
Large Capital Forecast
Committed - Reliability Committed - Opportunity Forecast - Safety/Environmental
Forecast - Financial AFUDC 2010 IPR Recommended Plan
31

2012 Capital Investment Review Workshop: April 19, 2012
System Cost Impacts of Funding Constraints
• System costs increase as funding is further constrained because more investments are deferred past the cost minimum.
-
100
200
300
400
500
600
700
Unconstrained Funding 2010 IPR Recommended Plan Funding Level
Reduce Funding 10 Percent Reduce Funding 20 Percent
20
12
Pre
sen
t V
alu
e (
$m
illio
ns)
System Cost Impact
Investment Cost Savings Increase in Risk
109m
164m
299m
32

2012 Capital Investment Review Workshop: April 19, 2012
Condition by Plant in 2022: Unit Reliability Equipment
33 33
3
4
5
6
7
8
9
10
3
4
5
6
7
8
9
10B
on
ne
ville
Ch
ief J
ose
ph
Gra
nd
Co
ule
e
Joh
n D
ay
McN
ary
The
Dal
les
Dw
ors
hak
Hu
ngr
y H
ors
e
Ice
Har
bo
r
Lib
by
Litt
le G
oo
se
Low
er
Gra
nit
e
Low
er
Mo
nu
me
nta
l
Alb
en
i Fal
ls
Big
Clif
f
Co
uga
r
De
tro
it
De
xte
r
Fost
er
Gre
en
Pe
ter
Hill
s C
ree
k
Loo
kou
t Po
int
Lost
Cre
ek
Pal
isad
es
An
de
rso
n R
anch
Bla
ck C
anyo
n
Bo
ise
Div
ers
ion
Ch
and
ler
Gre
en
Sp
rin
gs
Min
ido
ka
Ro
za
Main Stem Columbia Headwater/Lower Snake Area Support Local Support
Co
nd
itio
n I
nd
ex
Condition by Plant in 2022: Unit Reliability Equipment
Current Committed Only Plan Current Average Committed Only Avg Plan Avg
33

2012 Capital Investment Review Workshop: April 19, 2012
0
1
10
100
1,000
0
1
10
100
1,000B
on
ne
ville
Ch
ief J
ose
ph
Gra
nd
Co
ule
e
Joh
n D
ay
McN
ary
The
Dal
les
Dw
ors
hak
Hu
ngr
y H
ors
e
Ice
Har
bo
r
Lib
by
Litt
le G
oo
se
Low
er
Gra
nit
e
Low
er
Mo
nu
me
nta
l
Alb
en
i Fal
ls
Big
Clif
f
Co
uga
r
De
tro
it
De
xte
r
Fost
er
Gre
en
Pe
ter
Hill
s C
ree
k
Loo
kou
t Po
int
Lost
Cre
ek
Pal
isad
es
An
de
rso
n R
anch
Bla
ck C
anyo
n
Bo
ise
Div
ers
ion
Ch
and
ler
Gre
en
Sp
rin
gs
Min
ido
ka
Ro
za
Main Stem Columbia Headwater/Lower Snake Area Support Local Support
Lost
Ge
ne
rati
on
Ris
k (a
MW
)
Lost Generation Risk by Plant in 2022
Current Committed Only Plan Current Average Committed Only Avg Plan Avg
Lost Generation Risk by Plant in 2022
34 34
Total = 247 aMW
34