Embed Size (px)
Citation preview
Accepted Manuscript
Hydrocarbon source potential of Eocene-Miocene sequence of Western Sabah,Malaysia
Wan Hasiah Abdullah, Olayinka Serifat Togunwa, Yousif M. Makeen, Mohammed HailHakimi, Khairul Azlan Mustapha, Muhammad Hafiz Baharuddin, Say-Gee Sia, FelixTongkul
PII: S0264-8172(17)30077-6
DOI: 10.1016/j.marpetgeo.2017.02.031
Reference: JMPG 2838
To appear in: Marine and Petroleum Geology
Received Date: 2 October 2016
Revised Date: 25 February 2017
Accepted Date: 26 February 2017
Please cite this article as: Abdullah, W.H., Togunwa, O.S., Makeen, Y.M., Hakimi, M.H., Mustapha,K.A., Baharuddin, M.H., Sia, S.-G., Tongkul, F., Hydrocarbon source potential of Eocene-Miocenesequence of Western Sabah, Malaysia, Marine and Petroleum Geology (2017), doi: 10.1016/j.marpetgeo.2017.02.031.
This is a PDF file of an unedited manuscript that has been accepted for publication. As a service toour customers we are providing this early version of the manuscript. The manuscript will undergocopyediting, typesetting, and review of the resulting proof before it is published in its final form. Pleasenote that during the production process errors may be discovered which could affect the content, and alllegal disclaimers that apply to the journal pertain.
MANUSCRIP
T
ACCEPTED
ACCEPTED MANUSCRIPT
1
Hydrocarbon source potential of Eocene-Miocene sequence of Western Sabah, Malaysia
Wan Hasiah Abdullah1,*, Olayinka Serifat Togunwa1, Yousif M. Makeen1, Mohammed Hail
Hakimi2, Khairul Azlan Mustapha1, Muhammad Hafiz Baharuddin1, Say-Gee Sia3, Felix
Tongkul4
1 Department of Geology, University of Malaya, 50603, Kuala Lumpur, Malaysia 2 Geology Department, Taiz University, 6803 Taiz, Republic of Yemen
3Minerals and Geoscience Department Malaysia, 20th Floor, Tabung Haji Building, Jalan Tun Razak, 50658 Kuala Lumpur, Malaysia
4Geology Programme, Faculty of Science and Natural Resources, Universiti Malaysia Sabah, Malaysia E-mail: [email protected]; [email protected]
Abstract
An evaluation of the petroleum generating potential of onshore Eocene-Miocene sequences of
Western Sabah, Malaysia was performed based on organic petrological and geochemical
methods. The sequences analysed are the Belait, Meligan, Temburong and West Crocker
formations of western Sabah. The Belait Formation which is Stage IV equivalent in the
offshore represents one of the major source rock/reservoirs of the petroleum-bearing Sabah
Basin. The Eocene-Early Miocene West Crocker and Temburong formations are deepwater
turbidites whilst the Miocene Meligan and Belait formations are shallow marine fluvio-deltaic
deposits. The vitrinite reflectance and pyrolysis Tmax values show that the Belait samples are
generally immature for hydrocarbon generation, whereas the Meligan, Temburong and West
Crocker samples are in the mature to late maturity stage of hydrocarbon generation. The
overall bulk source rock properties of the Belait and Meligan show fair to good petroleum
source rock potential with TOC more than 1 wt. %, hydrocarbon yield in the range of 400-
1300 ppm and moderately high HI for many of the samples. Most of the samples representing
the Temburong and West Crocker formations have TOC less than 1 wt.% and have no to fair
hydrocarbon generating potential. Interestingly, the samples collected in the West Crocker
Formation characterized by slump deposits (MTD) have TOC >2 and possess good to
excellent hydrocarbon generating potential. The organic matter present in all of the studied
formations is mainly of terrigenous origin based on the abundance of woody plant materials
MANUSCRIP
T
ACCEPTED
ACCEPTED MANUSCRIPT
2
observed under the microscope. Consequently, the analysed sequences are predominantly gas
prone, dominated by Type III and Type III-IV kerogen except for minor occurrence of mixed
oil-gas prone Type II-III kerogen in the Belait Formation and in the slump mass transport
deposits (MTD) of the West Crocker Formation.
Keywords: hydrocarbon rock source potential; onshore Western Sabah, terrigenous organic
matter; deepwater slump mass transport deposit (MTD).
1. Introduction
Estimation of hydrocarbon source potential by characterisation of the dispersed
organic matter (phytoclasts) or kerogen using geochemical and petrological techniques has
become an integral part of hydrocarbon exploration in frontier basins (Tissot and Welte, 1984;
Hunt, 1996; Peters et al., 2005). This involves identifying the potential source rocks,
measuring the total amount of organic matter present, the type and quality of the organic
matter and the level of thermal maturity attained (Dow, 1977; Hunt, 1996; Peters et al., 2005).
The integration of organic petrological and organic geochemical analyses was performed in
this study. The study area is situated within the onshore Sabah Basin in the western part of
Sabah.
Western Sabah Basin, located in the northwestern part of the Borneo Island, in
particular the offshore region, is one of the most prolific oil-producing basins in Malaysia and
it has been explored for more than one hundred years since the first oil seeps were reported
from the Klias peninsula (Leong, 1999). The source of the hydrocarbons has been investigated
by a number of workers: Abdul Jalil and Mohd Jamaal (1992); Azlina Anuar and Abdul Jalil
(1997); Mazlan et al. (1999), Azlina Anuar et al. (2003); Algar (2012); and Abdullah et al.
(2014). The analysed samples have been grouped into the Eocene-Early Miocene deepwater
turbiditic sequences (West Crocker and Temburong formations) and the Miocene shallow
marine fluvio-deltaic sequences (Meligan and Belait formations). The sedimentary units

MANUSCRIP
T
ACCEPTED
ACCEPTED MANUSCRIPT
3
deposited during the Middle to Late Miocene are of primary importance as hydrocarbon
source and reservoir rocks in the western part of the Sabah Basin. The search for commercial
petroleum is focused in the clastic reservoirs of Middle to Late Miocene (Stage IVA-D) in the
offshore areas (Scherer, 1980; Abdul Jalil and Mohd Jamaal, 1992; Azlina Anuar, 1994;
Azlina Anuar and Abdul Jalil, 1997). Minor oil and gas accumulated in Early Miocene (Stage
III) sands (e.g. Pondu-1 well) and oil seeps occurs in the onshore Kudat Formation (Stephens,
1956). Based on geochemical evidence, the origin of the oils is terrigenous organic matter
(e.g. Azlina Anuar and Kinghorn, 1994, Algar, 2012). The occurrence of substantial
hydrogen-rich allochthonous organic matter within the deep water marine sequences in NW
Sabah as reported by Algar (2012) prompted the need to reevaluate the source rock
characteristics in the older sequences such as the deep water marine Temburong and West
Crocker formations and being amongst the main focus of this study.
In the eastern Borneo region such as in the deepwater Kutei Basin (Lin et al, 2005,
Saller et al., 2006) and also in Northwest Sabah (Algar and Waples , 2005; Abdullah et al.,
2014; Zakaria et al., 2013), organic matter is described to be entrained within the sands in the
turbidity currents transported from the shelf as MTDs (mass transport deposits) that also
contain oil-prone organic matter which may act as potential source rocks for liquid
hydrocarbons (Azlina Anuar et al., 2003; Algar and Waples, 2005; Algar, 2012; Abdullah et
al., 2014).
In this study, the petroleum source rock potential was evaluated using organic
geochemical and petrological techniques. The type and quantity of organic matter were
determined and their thermal maturity was assessed. The study area is located in the western
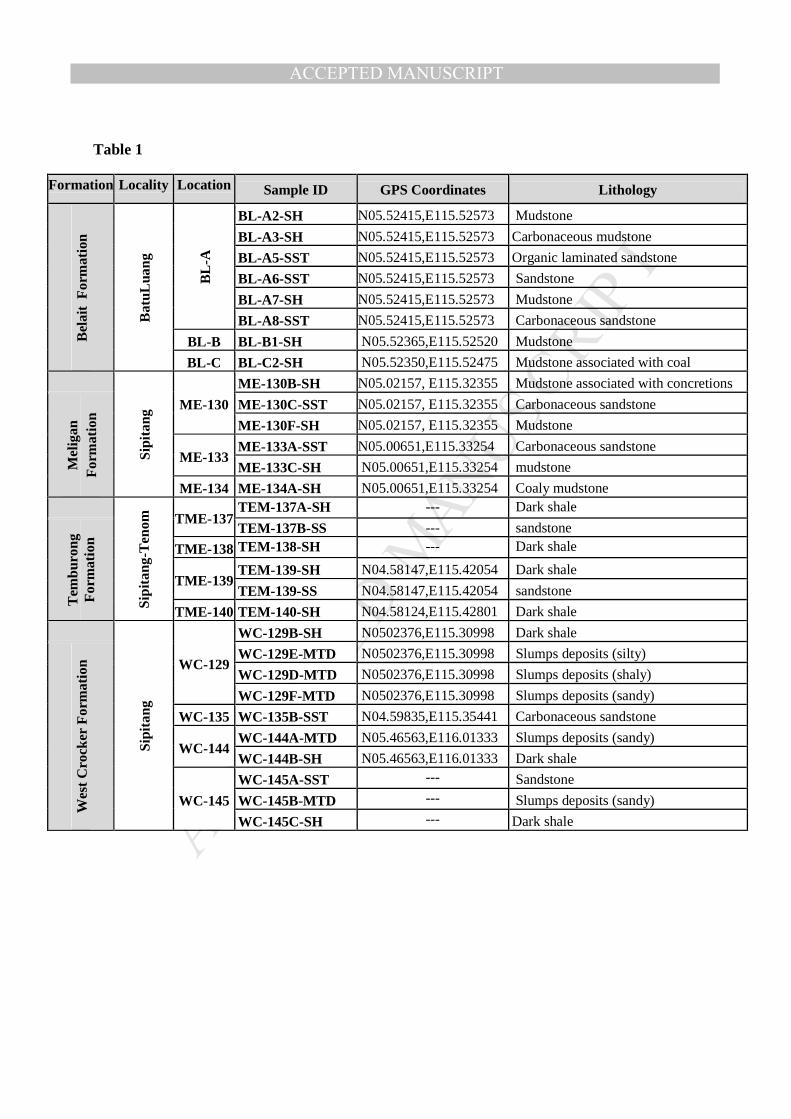
part of Sabah as shown in Fig. 1. The major outcrop locations (GPS coordinates shown in
Table 1) are in Klias Peninsula, Sipitang, and Kota Kinabalu (KK) areas. This region
developed as a Neogene foreland basin and the study of its modern coastline can be
MANUSCRIP
T
ACCEPTED
ACCEPTED MANUSCRIPT
4
considered as an analogue for clastic depositional systems of ancient foreland basins (Cullen,
2010).
2. Geological background
The geology of the western part of Sabah, especially its sedimentology, has been well
studied by previous researchers (e.g Tongkul, 1989; Crevello, 2006; Jackson et al., 2009; Tan,
2010; Lukie and Balaguru, 2012; Lambiase and Cullen, 2013). The tectonic evolution of
Sabah is complex. Extensive study on basin evolution has been performed by various authors,
namely Tongkul (1991; 1997), Tan and Lamy (1990), Hutchison (1996), Balaguru and
Nichols (2004), Balaguru and Hall (2009) and Hall (2013). A summary was presented by
Mazlan et al. (1999) in the Petroleum Geology and Resources of Malaysia book published by
PETRONAS. Fig. 2 shows a simplified stratigraphy of the offshore and onshore sequence of
West Sabah.
The Paleogene regional tectonic setting of Sabah region is very complex, with
southeasterly subduction of the proto-South China Sea in NW Borneo (Hall 1996) followed
by a period of continued deposition of deep marine turbidites of the Rajang Group. The
Rajang Group is a widespread association of Late Cretaceous to Eocene deep water
mudstones and turbiditic sandstones which include the Sapulut, Trusmadi and East Crocker
formations. All of them are thought to have been deposited in the large NE-SW trending
Crocker Basin and all are highly deformed with tight isoclinal folds and thrusts (Hutchison,
1996). The Palaeogene was therefore a period of continued deposition of deep marine
turbidites. The strongly deformed turbiditic Rajang Group was interpreted by Hutchison, 1996
as a part of an accretionary prism related to southeasterly subduction of the proto-South China
Sea in the NW Borneo. The Late Eocene tectonic deformation is characterized by folding,
thrusting and regional uplift related to the collision of the Luconia Continental Block with
NW Borneo (Sarawak Orogeny; Hutchison, 1996). An unconformity within the succession of

MANUSCRIP
T
ACCEPTED
ACCEPTED MANUSCRIPT
5
Palaeogene turbidites between the Middle and Upper Eocene (Fig. 2) is inferred by Rangin et
al. (1990) on the evidence of reworking of nannofossils, and Hutchison (1996) also argues
that the West Crocker Formation includes detritus from uplifted and eroded Rajang Group and
East Crocker Formation rocks (Fig. 2). Hutchison (1996) refer to this uplift as the ‘Sarawak
Orogeny’ and suggested it was probably driven by collision along the northern Borneo margin
at this time. The unconformity is generally difficult to recognize in outcrop in Sabah because
of similarities in lithologies either side of it, and because of the strong Neogene deformation.
Following the Late Eocene deformation, uplift and erosion of the Rajang Fold-Thrust
Belt provided a source of sediment for the Borneo trough to the NW and also the SE where
material was deposited in a deep water setting that formed the West Crocker and Temburong
formations in western Sabah (Fig. 2). The fold-thrust belt of the West Crocker Formation,
which is well exposed in western Sabah, represents the accretionary complex related to
continued southeasterly subduction of the proto-South China Sea in the NW Borneo
(Balaguru and Hall, 2009).
This Early Miocene (22-20 Ma) deformation, resulted by an arc-continent collision in
the northern Borneo between the Cagayan Arc and Palawan Continental Block (Hall, 2013), is
a major tectonic event. It deformed and elevated much of Sabah and produced a major
regional unconformity (Fig. 2), namely the Top Crocker Unconformity (TCU) (Hall, 2013).
Prior to this intense deformation, widespread carbonates (Burdigalian limestone) were
deposited (Leong, 1999).
This period was followed by a change in depositional environment from deep-water
clastics to a shallow-water deltaic setting of the Meligan Delta (Stage III) (Tongkul, 1994;
Leong, 1999; Hall, 2013; Gartrell et al., 2011). All of offshore Sabah was under slope- to
deep-marine conditions during Early Miocene to early Middle Miocene time.

MANUSCRIP
T
ACCEPTED
ACCEPTED MANUSCRIPT
6
The collision and cessation of South China Sea spreading gave rise to an
unconformity, the Middle Miocene (15.5 Ma) Deep Regional Unconformity (DRU) (Fig. 2),
which separates the Meligan Delta from the overlying middle to late Miocene Champion
Delta (Stage IV-ABC) (Tongkul, 1994; Leong, 1999; Gartrell et al., 2011; Hall, 2013). This
stage generally is characterized by coastal aggradation and progradation sequences
comprising the onshore outcrop equivalents of the Belait Formation of NW Sabah. The Belait
Formation is dominated by fluvio-deltaic sandstones with laterally equivalent coastal plain to
marine sandstone successions that comprise the topsets of the Champion Delta depositional
system with stacked sequences (from bottom to top) of fluvial sands, marginal marine
(estuarine and deltaic) and shoreface deposits (van Hattum et al., 2006; Hall et al., 2008).
2.1 A brief petroleum system overview
In this section we present a brief petroleum system overview of the Sabah Basin. A
detailed petroleum system analysis of the Sabah Basin has been presented by Mazlan et al.
(1999). Hydrocarbons in the offshore equivalent of the study area are found mainly in the
Stages IVA, IVC, and IVD (Tongkul, 1994; Leong, 1999; Gartrell et al., 2011; Hall, 2013).
The occurrence of onshore oil seepages in the NW Sabah Province is evidence for a viable
petroleum system in the vicinity of the study area, although the area is still relatively poorly
explored (Mazlan et al., 1999).
Source rocks
Hydrocarbons in various parts of the Sabah Basin are very similar in composition and
appear to have originated from source rocks rich in mainly terrigenous organic matter
(Scherer, 1980; Abdul Jalil and Mohd Jamaal, 1992; Azlina Anuar, 1994; Azlina Anuar and
Abdul Jalil, 1997). The source rocks are most likely within Stage IV sequences, as inferred
from the observation that the older deep marine shales are generally lean and thermally over-
mature (Mazlan et al., 1999). Widespread erosion of the NW Sabah margin during the early

MANUSCRIP
T
ACCEPTED
ACCEPTED MANUSCRIPT
7
Middle Miocene and the extensive accumulation of the stage IV siliciclastic wedge, resulted
in deposition of source beds that are rich in terrigenous organic matter, interbedded with sand
prone reservoir facies (Mazlan et al., 1999). Source rock preservation in the Sabah Basin is
the result of the high input of terrigenous organic matter and high sedimentation rates and
seemingly not due to anoxicity (Azlina Anuar, 1994; Azlina Anuar and Abdul Jalil, 1997).
Coaly and carbonaceous shales are the most prolific source rocks in the Sabah basin because
of their abundance in large volumes (>2000m thick in some areas).
Reservoirs, traps and seals
The hydrocarbon generic reservoirs in the Sabah Basin are predominantly siliciclastic.
Good quality reservoirs are formed by coastal to fluvio-marine and stacked shallow marine
sandstones. Moreover, the marine turbidites in stages IVC/IVD also form thick, high–quality
reservoirs (Mazlan et al. , 1999). Carbonate reservoirs, although a minor component, have fair
to excellent reservoir quality. These carbonate mounds and reefs occur on the Kudat Platform
in the Northern Sabah Province. Most of the hydrocarbons occur in complex wrench-induced
faulted anticlines, rollover anticlines associated with growth faults, and other fault-related
closures. The main structural traps in the western Sabah are fault propagation folds and fold
anticlines (Scherer, 1980). The hydrocarbons generally migrate through faults and within beds
(Nor Azidin et al., 2011). The seal in NW Sabah is mainly provided by intraformational shale
and mudstone with effective top and flank seals in many proven accumulations (e.g. Erb
West, Kinabalu, St Joseph fields). In some places, shale filled slump scars and shale diapirs
act as seal (Mazlan et al. , 1999).
3. Methodology
The methods adopted in this research include fieldwork and laboratory studies. The
laboratory studies can be grouped into organic petrological and geochemical analyses.
3.1. Fieldwork and sampling

MANUSCRIP
T
ACCEPTED
ACCEPTED MANUSCRIPT
8
Field study was carried out in Klias Peninsula, Kota Kinabalu, Beaufort and Sipitang
areas of West Sabah. The locations of representative outcrops were plotted on the map (Fig.
1B) with an aid of a Global Positioning System (GPS). The sample descriptions are shown in
Table 1. The assignment of the formations was done based on published information from
past researchers (e.g Tongkul, 1994, Tan, 2010). Sampling was limited to well preserved
exposures and much care was taken during sampling to avoid contamination and weathered
outcrops. Organic matter is known to be degraded and partly lost as a consequence of
weathering, however it was reported that large differences in OM composition do not develop
between weathered and unweathered shales (Petsch et al., 2000). Nevertheless any organic
geochemical data obtained from surface samples ought to be interpreted with caution as
earlier studies have reported on effects of weathering on organic matter in sedimentary rocks
(e.g. Leythaeuser, 1973; Clayton and Swetland, 1978; Littke et al., 1991).
3.2. Organic petrographic analyses
Organic petrographic analyses performed in this study involved the use of a LEICA
CTR 6000 photometry microscope. Prior to microscopic analysis, rock samples were crushed
into small pieces (2-3mm) using pestle and mortar. Samples were then embedded in 30 mm
latex moulds with liquid epoxy resin and hardened for 48 hours at 30°C. Samples were then
gradually ground with 350, 550, 800, 1200 silicon carbide papers and finally polished with
1µm alumina powder-deagglomerate, 0.3 µm alumina powder-deagglomerate, and 0.04 µm
OP-suspension solution.
Microscopic study was performed under reflected white light and UV light excitation.
Measurement of vitrinite reflectance was carried out using Diskus Fossil software under
reflected white light, with a x50 oil immersion objective using immersion oil with a refractive
index (ne) of 1.518 at 23°C. Reflectance measurements were determined in the random mode
on vitrinite maceral at a wavelength of 546 nm, and the values reported (%Ro) are arithmetic

MANUSCRIP
T
ACCEPTED
ACCEPTED MANUSCRIPT
9
means of at least 25 measurements per sample. Vitrinite reflectance values for main phase of
oil generation ranges from 0.6% to 1.3 % Ro and values greater than 2.0 %Ro indicate dry gas
generation (Tissot and Welte, 1984; Teichmüller et al., 1998; Killops and Killops, 2005).
3.3. Organic geochemical analyses
Source Rock Analyzer (SRA)
The rock samples were crushed to less than 200 mesh and analysed using (SRA-
Weatherford)-TOC/TPH instrument (equivalent to Rock Eval equipment) to assess organic
matter richness, kerogen type and maturation of the organic matter in the rocks. Pyrolysis
analysis was performed on approximately 100 mg crushed samples heated to 600oC in a
helium atmosphere. Several parameters were measured, including S1, S2, S3 and temperature
of maximum pyrolysis yield (Tmax). TOC was also determined using the SRA instrument.
Hydrogen index (HI), Oxygen index (OI), Production yield (PY), and Production index (PI)
were calculated as described by Espitalie et al. (1977) and Peters and Cassa (1994).
Bitumen extraction
Fine powdered rock samples were extracted in a Soxhlet apparatus for 72 hours using
an azeotropic mixture (93:7) of dichloromethane and methanol. Metallic copper was added to
the flask during the extraction process to remove the elemental sulphur and anti-bumping
granules was added. Once the extraction procedure was completed, the solvent was removed
using a rotary evaporator under low pressure. The recovered fractions were air dried and the
weight was measured and recorded as the extractable organic matter (EOM) or bitumen yield.
Subsequently, the extractable organic matter (EOM) was separated into saturated and
aromatic hydrocarbons and polar compounds (NSO) by column chromatography on neutral
alumina over silica gel. A chromatographic column (length/width ratio 50:1) was slurry
packed with activated silica gel and aluminum oxide using petroleum ether. Aliphatic,
aromatic and polar (NSO) fractions were eluted with petroleum ether (100 ml),

MANUSCRIP
T
ACCEPTED
ACCEPTED MANUSCRIPT
10
dichloromethane (100ml), and methanol (50 ml) respectively. The solvent was distilled off
using rotary evaporator to about 3 ml and thereafter transferred into a weighed clean vial. The
remaining solvent was removed under a flow of nitrogen gas at a temperature below 50°C.
the recovered yields (in ppm of whole rock) are as shown in Table 3.
Pyrolysis-GC
The Pyrolysis-gas chromatographic (Py-GC) method used is based on Larter (1984) quickly
heating of samples at 600 °C whereby the total evolved hydrocarbons can be monitored as a
function of temperature. The pyrolysis GC analysis is carried out on the isolated kerogen
using a Frontier Lab Pyrolyser System which performed thermal desorption from 40 to 300°C
and pyrolysis at 600°C. The system is coupled to an inert (quartz and Ultra ALLOY-5), 30 m,
0.25 mm internal diameter column fitted to an Agilent GC chromatography equipped with a
flame ionization detector. The identification of peaks is based on reference chromatograms
and was done manually by comparison to published data (e.g. Dembicki et al., 1983; Harry,
2008; Dembicki, 2009).
4. Results and discussion
The results of the analyses are presented in the following sections and their relevance
to petroleum source potential is discussed.
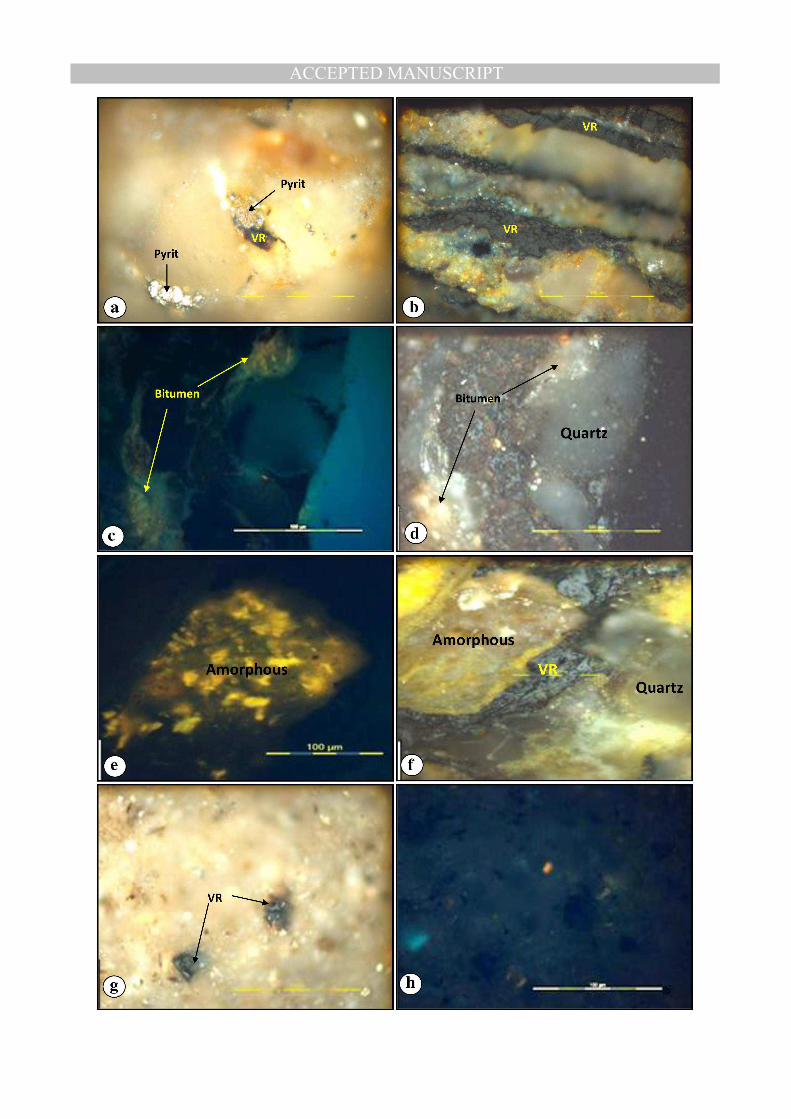
4.1. Petrographic description
A brief petrographic description of the analysed samples is given below and examples of
photomicrographs relevant to this study are shown in Figure 3 a-h. The organic matter content
of the Belait Formation samples is dominated by vitrinite phytoclasts (Fig. 3a-b). The
phytoclasts are often associated with bitumen staining, and pyrite occurrence is fairly
common (Fig. 3a).
The phytoclast content of the analysed Meligan Formation samples is also dominated by
vitrinite phytoclasts, but was relatively poorly preserved compared to that of the Belait

MANUSCRIP
T
ACCEPTED
ACCEPTED MANUSCRIPT
11
Formation samples. The vitrinite is mostly pitted in appearance and commonly rimmed with
bitumen staining (Fig. 3d). This pitted appearance is considered to be due to the past presence
of inclusions of mineral matter or soluble organic matter that have since been removed during
diagenesis. They are not regarded as a consequence of weathering as no oxidation rim was
observed to be present either microscopically or macroscopically. When observed under UV
light, yellow fluorescence was observed in the matrix associated with strong bitumen staining
(Fig. 3c). Vitrinite is also the dominant phytoclast in the West Crocker Formation samples,
including the slump MTD samples (Fig. 3e-f). Under UV light excitation, yellow to yellow-
orange fluorescing amorphous organic matter was commonly observed (Fig. 3e). The samples
with fluorescing amorphous organic matter imply a Type II kerogen and are expected to
generate oil (Hunt, 1996; Hakimi and Abdullah, 2013; Makeen et al., 2015).
On the other hand, vitrinite and other phytoclast occurrences are sparse in the Temburung
Formation samples (Fig. 3g-h). Although devoid of structured organic matter, an occasionally
dull fluorescing matrix indicative of high thermal maturity can be observed (Fig. 3h). This is
in agreement with the vitrinite reflectance data as discussed in the following section.
4.2. Organic matter richness and hydrocarbon generative potential
The organic richness of a rock is usually expressed as the total organic carbon (TOC)
content in wt%. The minimum acceptable TOC value for clastic type rocks indicating good
source potential is 1.0% (Peters and Cassa, 1994., Hunt, 1996). There is variation in TOC in
the shaly and sandy facies of the studied formations. However this was not attributed to
weathering effects (see methodology section), as supported by petrographic observation. Most
of the sandy facies in the studied formations have higher TOC than the shaly facies except in
the Temburong Formation, where the shaly facies have higher TOC content (Table 2). Belait
Formation samples have TOC values ranging from 1.05 - 7.87 wt. % with mean values of 2.5
wt. % and 4.38 wt. % in the shaly and sandy facies respectively. TOC values in the Meligan
MANUSCRIP
T
ACCEPTED
ACCEPTED MANUSCRIPT
12
Formation samples range from 0.98-3.03wt. % with mean values of 2.0 wt. % and 2.19 wt. %
in the shaly and sandy facies respectively. The shaly and sandy facies in the Temburong and
West Crocker formations have mean TOC values of 1.1wt. % and 0.55wt. %, 1.24 wt. % and
5.68 wt. % (Table 2) respectively. Overall, these values indicate that most of the analysed
samples have sufficient total organic carbon content to be source rocks. It ought to be noted
that samples of relatively higher thermal maturity would have originally possess higher TOC
values compared to its present day value as TOC content are known to decrease with increase
in thermal maturity (Dembicki, 2009).
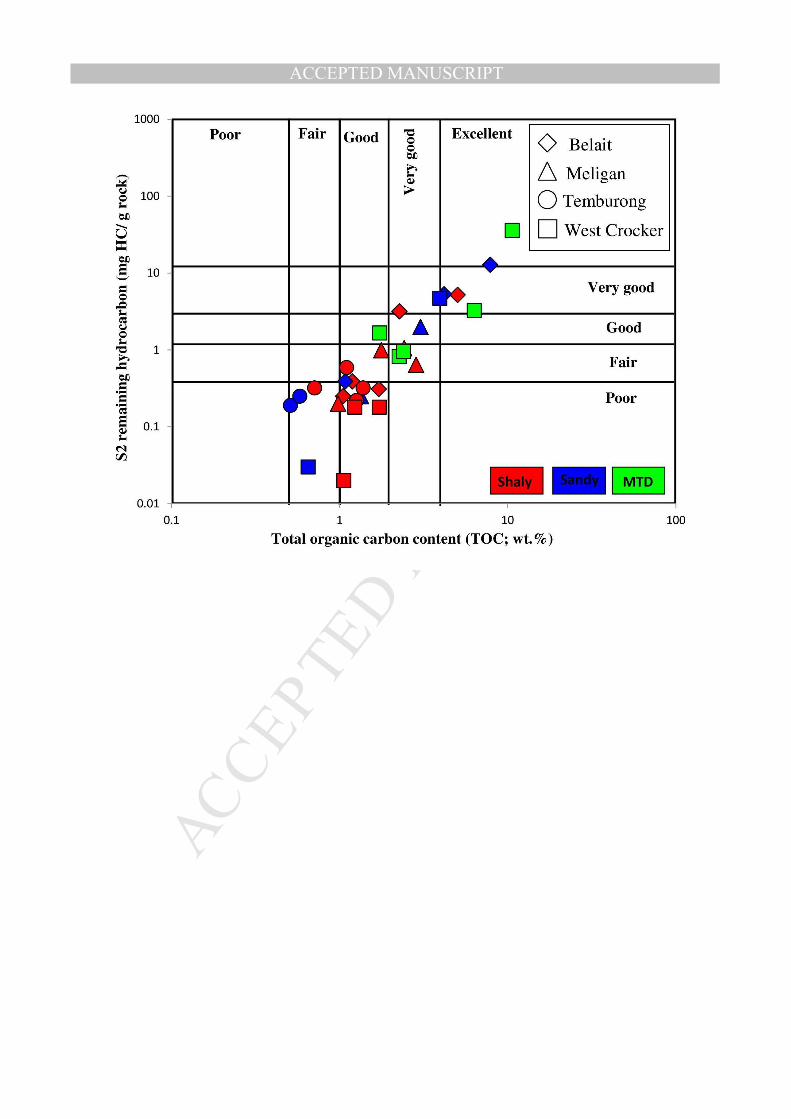
Moreover, the amount of the S2 pyrolytic hydrocarbon generated during pyrolysis is a useful
parameter to evaluate the hydrocarbon generation potential of source rocks (Peters, 1986;
Bordenave, 1993). A minimum of 5 mg HC/g S2 is required to have good hydrocarbon
generating potential (Peters, 1986; Bordenave, 1993). Generally, the hydrocarbon (S2) yields
range from 0.31-12.8 mg/g, 0.20-1.99 mg/g, 0.19-0.59 mg/g, and 0.02-35.83mg/g (Table 2) in
the Belait, Meligan, Temburong and West Crocker Formations respectively. From the cross
plot of total organic carbon (TOC) content and pyrolysis S2 yields shown in Figure 4, it can be
deduced that the Belait Formation samples have ‘poor to very good’ hydrocarbon generation
potential. The Meligan Formation samples have ‘poor to fair’ hydrocarbon generating
potential, with the majority of these samples being poor. The Temburong Formation shows no
to poor hydrocarbon generating potential. Most of the samples in the West Crocker Formation
possess poor hydrocarbon generating potential except some of the slump MTDs facies that
shows fair to excellent hydrocarbon generating potential.
Distinguishing between migrated hydrocarbons/contaminants and indigenous hydrocarbons
can be done using the migration index (S1/TOC) as suggested by Hunt (1996). According to
Hunt (1996), when S1 is high and the TOC is low, migrated hydrocarbons are indicated.
Figure 5 represents the plot of S1 versus TOC for the analysed samples in this study. It is clear
MANUSCRIP
T
ACCEPTED
ACCEPTED MANUSCRIPT
13
from this plot that the hydrocarbons in the studied Belait, Meligan, Temburong and West
Crocker formation samples are all indigenous (Fig. 5).
4.3. Organic matter quality (Kerogen Type)
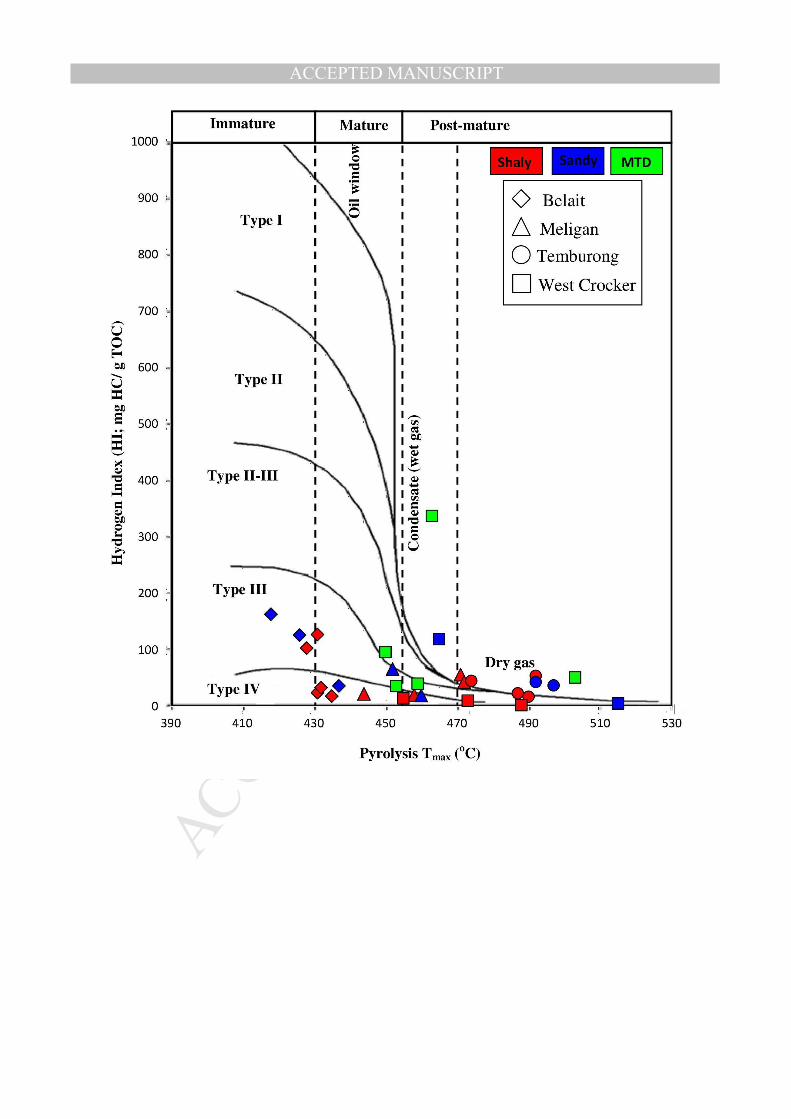
Kerogen types in the Belait, Meligan, Temburong and West Crocker formations were
evaluated based on their Hydrogen (HI) and Oxygen (OI) indices. The Hydrogen Index (HI)
value ranges are 18-163 mg HC/g TOC, 19-66 mg HC/g TOC, 17-54 mg HC/g TOC, and 2-
337 mg HC/g TOC (Table 2) in the Belait, Meligan, Temburong and West Crocker
formations samples respectively. Based on these pyrolysis data, kerogen classification
diagram were constructed using modified van Krevelen diagrams of HI versus OI, as well as
HI vs Tmax plots (Figs. 6 and 7). Type III and IV kerogens are the dominant kerogen types
within the studied formations except for a MTD sample in the West Crocker Formation with
HI value of 337 mg HC/g TOC indicative of Type II-III kerogen (Fig. 7). This is further
supported by the dominance of vitrinitic phytoclasts with common occurrence of fluorescing
amorphous organic matter in the MTD samples as can be observed in Figure 3e. The type of
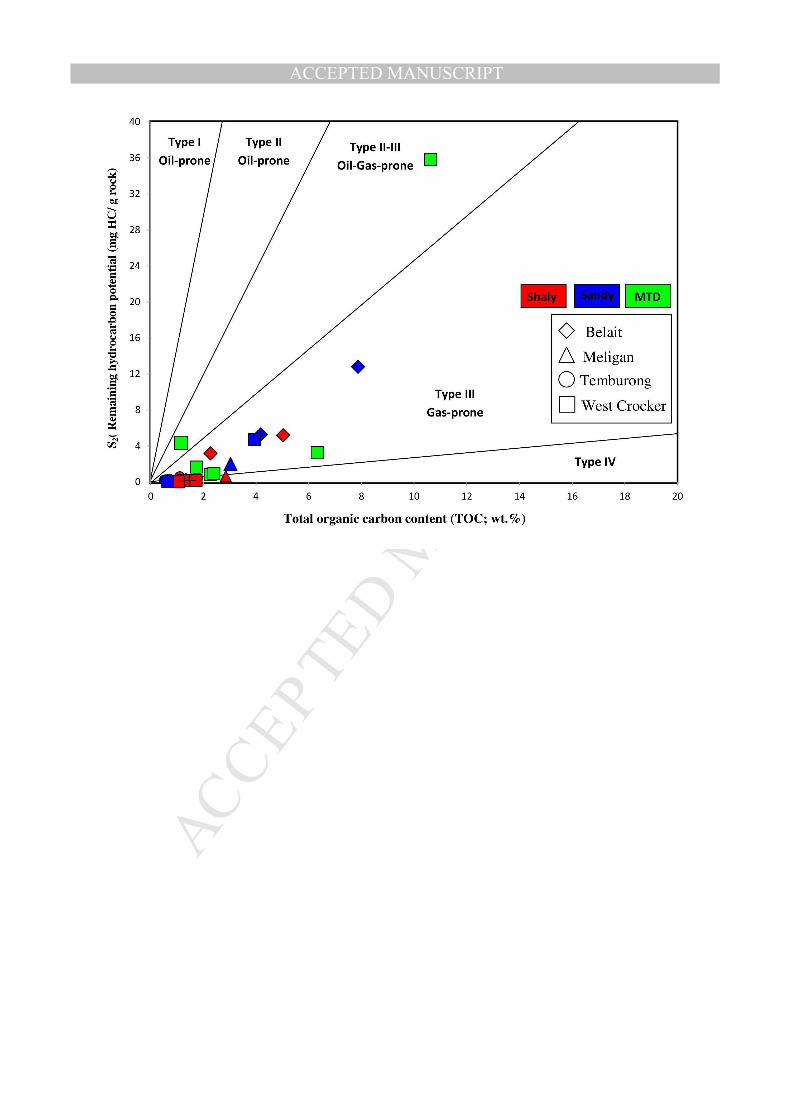
kerogen has also been classified using the S2 versus TOC plot as shown in Figure 8 and shown
to be in good agreement with the interpretation based on the van Krevelen diagram. Thus, the
MTD samples can be considered as oil-prone source rocks, although only one sample has
relatively high HI (> 300 mg HC/g TOC). Nevertheless, occurrence of fluorescing
amorphous organic matter is commonly observed (e.g. Figure 3a).
4.4. Thermal maturity of organic matter
Vitrinite reflectance values range from 0.43 to 0.46 %Ro for the Belait
Formation samples (Table 2) and indicate thermal maturity. The vitrinite reflectance values
for Meligan, Temburong and West Crocker formations samples ranges are 0.69-0.87% Ro,
0.99-1.14% Ro, 0.79-1.14% Ro respectively (Table 2), and this indicates they are thermally
mature.
MANUSCRIP
T
ACCEPTED
ACCEPTED MANUSCRIPT
14
The Belait Formation samples have pyrolysis Tmax values in the range of 418-437°C (Table 2)
indicating immature to very early maturity level for hydrocarbon generation. The pyrolysis
Tmax values in the Meligan Formation samples range from 444 to 472 °C (Table 2) indicating
peak of oil generation and late oil window level of maturity. The Temburong and West
Crocker formations samples have Tmax values in the range of 474-497°C and 450-515°C
(Table 2), respectively indicating over-maturity for the Temburong Formation and peak of oil
window to over-maturity for West Crocker Formation samples. This is supported by the plot
of present day HI versus pyrolysis Tmax as shown in Figure 7. There is also a good agreement
with the measured vitrinite reflectance data, as illustrated by a good correlation between Tmax
and VR data (R2=0.817) (Fig. 9).
The maturity of organic matter can also be expressed by its production index (PI),
which is defined as the ratio of the amount of hydrocarbons already generated to the total
amount of hydrocarbons that the organic matter is capable of generating (Tissot and Welte,
1984; Peters and Cassa, 1994). As reported by these authors, samples with PI values less than
0.05 indicate immature organic matter and have generated little or no petroleum. The value
reaches about 0.05-0.10 at the bottom of the oil-window (beginning of the wet gas zone) and
increases to 1.0 when the kerogen hydrocarbon generative capability has been depleted.
Among the analysed samples, lowest PI values (range from 0.02-0.17) were obtained from the
Belait Formation indicative of low maturity (Table 2) thus in agreement with the pyrolysis
Tmax and vitrinite reflectance data. On the other hand, the Meligan, Temburong and West
Crocker samples showed variable values (range from 0.0-0.49) that can be considered
anomalous. The reason for this inconsistency is unknown, however it may be due to the nature
of the kerogen type in association with variation in lithology in which it occurred as well as
the state of preservation of the organic matter. The four samples from Meligan, Temburong

MANUSCRIP
T
ACCEPTED
ACCEPTED MANUSCRIPT
15
and West Crocker formations with anomalous values (have low PI values with very high
Tmax) are as shown in Fig. 10.
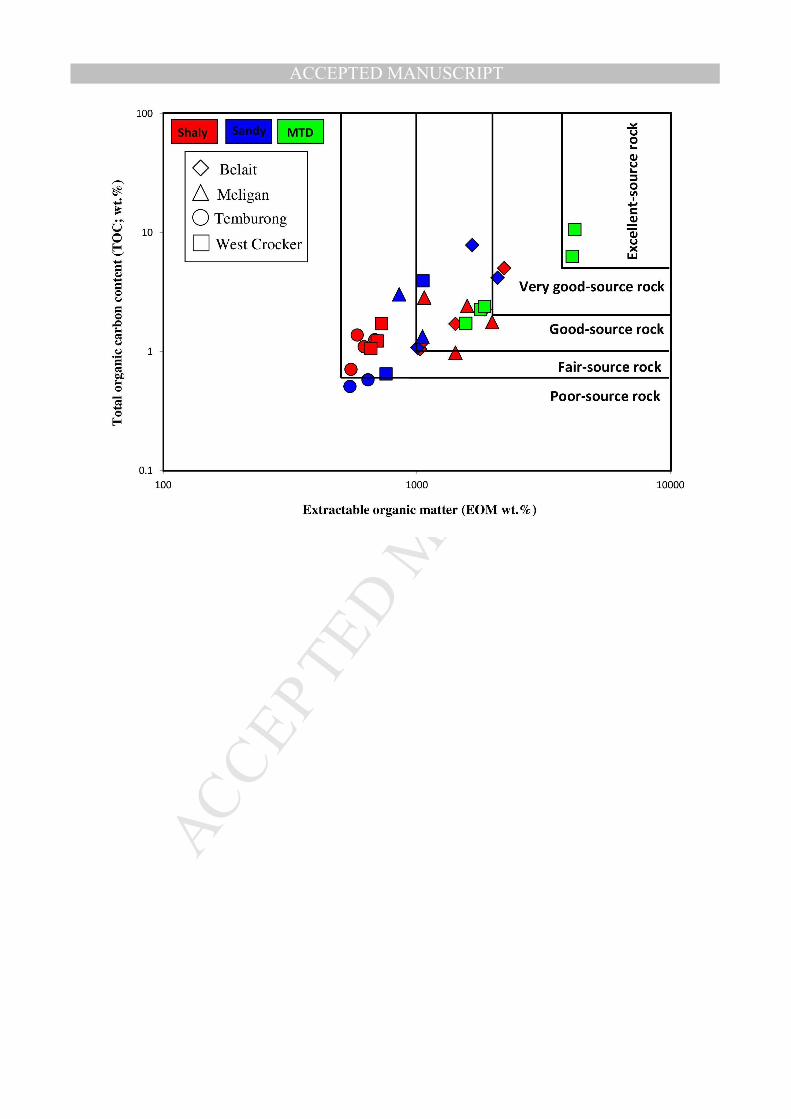
4.5. Extractable organic matter and hydrocarbon yield
Bitumen obtained by extraction of whole rocks (EOM) can provide organic matter
richness and maturity information (Tissot and Welte, 1984). The summary of the extractable
organic matter (EOM) together with the relative proportion of petroleum fractions is shown in
Table 3. The EOM contains a complex mixture of hydrocarbons and non-hydrocarbon
components (Figure 11). The saturated and aromatic fractions together make up the
petroleum-like hydrocarbon fraction; thus, the sum of these two fractions is referred to as
hydrocarbons (HCs), whereas the NSO (nitrogen sulphur oxygen) non-hydrocarbon
components (Table 3). Detailed compositional analysis of EOM in conjunction with bulk
kerogen types that generated from pyrolysis HI data yields the necessary information to make
at least semi-quantitative predictions about the amount of petroleum which has been or will be
generated by a given amount of source rock (Ahmed et al., 2004). Peters and Cassa (1994)
classified the potential of source rocks using their EOM (wt %) content as Poor, Fair, Good,
and very good when they contain < 0.05, 0.05-0.1, 0.1-0.2, and > 0.2 wt %, respectively. The
EOM yields range from 0.10-0.22 wt.%, 0.09-0.20 wt.%, 0.03-0.07 wt.%, and 0.07-0.41 wt.%
(Table 3) in the Belait, Meligan, Temburong and West Crocker formations, respectively. This
indicates that the hydrocarbon generation potential is fair to good in Belait and Meligan
formations, poor to fair in Temburong Formation and poor to very good in West Crocker
Formation samples. This is in good agreement with S2 and TOC relationship discussed earlier
and as shown in the cross plot of TOC (%) versus EOM (ppm) in Figure 12.
The hydrocarbon portion (Saturated + Aromatic) of the bitumen extracted from sediment is
the petroleum-like portion, and is also an important parameter in assessing the hydrocarbon
generating potential (Peters and Cassa, 1994). Based on classification by Peters and Cassa
MANUSCRIP
T
ACCEPTED
ACCEPTED MANUSCRIPT
16
(1994), the analysed Miocene Belait and Meligan samples possess fair to good hydrocarbon
generating potential, having hydrocarbon yields of about 400-1300 ppm. In general, lower
hydrocarbon yields were obtained from the analysed Eocene-Oligocene Temburong and West
Crocker samples, except for the slump mass transport (MTD) samples from West Crocker
Formation. These MTD samples yielded a relatively higher amount of aliphatic fraction
compared to the other analysed samples (Fig. 11). This is indicative of the oil-prone nature of
the analysed MTD samples which is also supported by the pyrograms that are dominated by
n-alkene/alkane doublets (Fig 13).
EOM fractions can also be used to determine the level of maturity. Polar compounds
(NSO) tends to be abundant in immature organic matter as recorded in Belait Formation
samples (Figure 11), and decrease with increasing maturity. On the other hand, the proportion
of aromatic increases with maturity (Fig. 11). Although aromatic hydrocarbons are known to
be influenced by kerogen type and were affected by weathering (Littke et al., 1991), they also
change with increasing thermal maturity as reviewed by Radke (1987). In this study, the
increase of aromatic hydrocarbons appears to be influenced by the level of thermal
maturation.
4.6. Kerogen pyrolysis (Py-GC)
Hydrogen and oxygen indices (HI and OI) based on pyrolysis using SRA equipment
do not always accurately represent the types of kerogen present and types of hydrocarbon that
may be generated by the source rocks (Dembicki, 2009; Abbassi et al., 2016).
The application of Rock-Eval and/or SRA techniques can provide more accurate
assessments of kerogen type when integrated with pyrolysis-gas chromatography (Py-GC)
method (Dembicki, 1993; 2009). The Py-GC analysis provides information regarding the
quantitative chemistry of the thermal decomposition products of the kerogen. This gives a
direct indication of the kerogen types and types of hydrocarbons that can be generated by the
MANUSCRIP
T
ACCEPTED
ACCEPTED MANUSCRIPT
17
kerogen during the maturation process (Giraud, 1970; Larter and Douglas, 1980; Horsfield,
1989; Eglinton et. al., 1990; Dembicki, 2009). Behar and Pelet (1985) and Dembicki (2009)
show clearly how the three main types of kerogen can be distinguished by the carbon number
distribution of n-alkanes. These authors stated that Type I kerogen pyrogram contain large
amounts of n-alkanes and n-alkenes in C20-C30 range, whereas a Type III pyrogram shows
most products in the <C10 fraction.
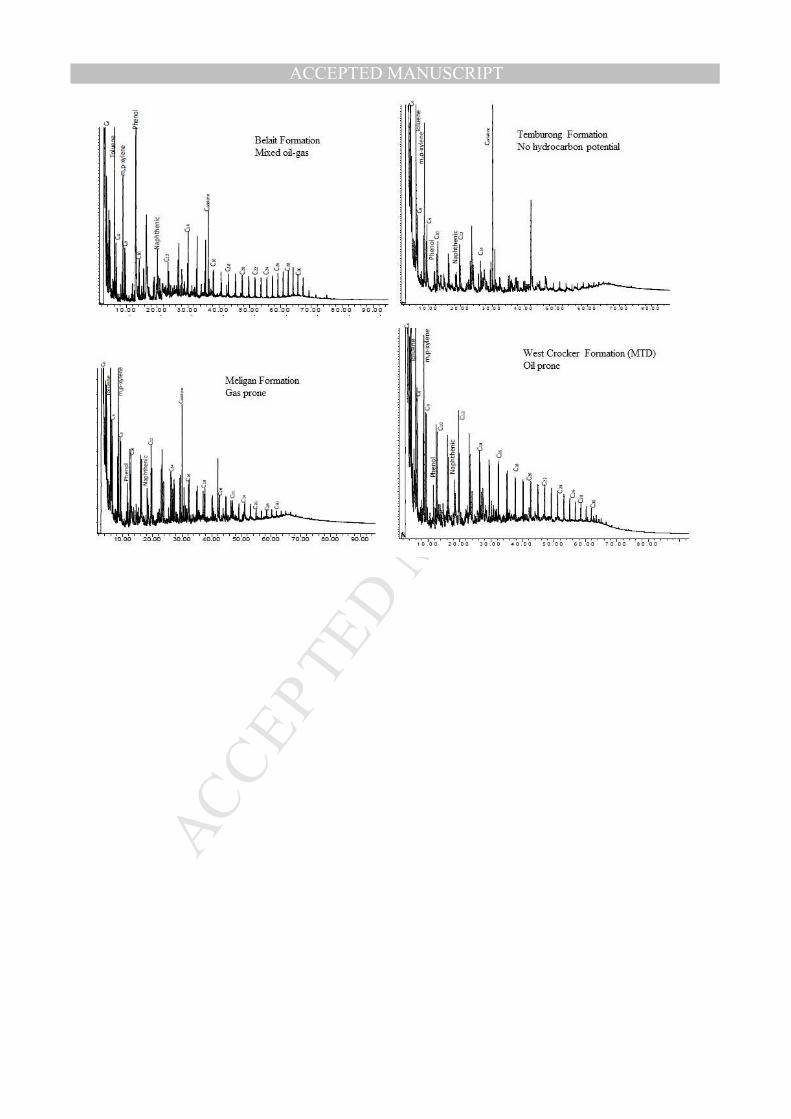
The fingerprints observed in the analysed kerogen samples from the studied
formations (Fig. 13) indicates the dominance of gas prone Type III kerogen characterized by a
dominance of aromatic compounds over n-alkene/alkane doublets whilst the Temburong
Formation, shows Type IV kerogen fingerprints which could be attributed to original source
input and/or condition of deposition. It is interesting to note that some of the MTD samples
from the West Crocker Formation display Type II kerogen with dominance of n-alkene/alkane
doublets over aromatic compounds. This is broadly further supported by the ternary diagram
as defined by Larter (1984) that has been applied to assess the kerogen characteristics by
using the relative percentage of three pyrolysates compounds (m-p-xylene, phenol, and n-
octene) (Fig. 145) whereby aliphatic been represented by n-octene, aromatic by m+p xylene
and phenolic represented by phenol components.
However, in this study, a boundary for the mixed Type II-III kerogen has been
introduced in the original ternary diagram of Larter (1984), as to take into account the
pyrograms of a number of the analysed samples from Belait Formation and the MTDs of the
Crocker Formation which suggest a mixed oil-gas prone characteristic based on pyrograms
shown by Dembicki (2009). Moreover the Py-GC data obtained in this study is in accordance
with the moderately high HI values in particular for the MTD samples and this supported by
the presence of intense amorphous organic matter as observed petrographically (Fig. 3e).
MANUSCRIP
T
ACCEPTED
ACCEPTED MANUSCRIPT
18
5. Concluding remarks
Based on organic petrological and geochemical analyses performed in this study to evaluate
petroleum source potential of the Belait, Meligan, Temburong and West Crocker formations
of western Sabah, the results are summarized as follows:
(1) The bulk geochemical results show that the Belait and Meligan samples have fair to
good source rock potential with TOC more than 1 wt. %. In contrast, the majority of
the Temburong and West Crocker formations samples have no to fair source rock
generation potential, consistent with low TOC values (<1 wt.%) except in the slump
mass transport deposits (MTD) in the West Crocker Formation where the shaly facies
has a relatively higher amount of organic matter (TOC >2 wt%). Broadly, the MTD
samples possess fair to excellent source rock generation potential.
(2) The organic matter present in all of the studied formations is mainly terrigenous
derived as indicated from the abundance of woody plant materials, as observed under
the microscope.
(3) The vitrinite reflectance and pyrolysis Tmax values indicate that the Belait Formation
samples are generally immature for hydrocarbon generation whereas the Meligan,
Temburong and West Crocker formations samples are in the mature to late mature-oil
window and oil-generation as expected.
(4) The analysed sequences are predominantly gas prone, being dominated by Type III
and Type III/IV kerogen except for minor occurrence of oil prone Type II/III kerogen
in the West Crocker Formation mass transport deposits (MTD).
(5) The results here suggest that MTD can possess good oil-generation potential, although
it appears to be localized, and thus may act as an oil (in addition to gas) source rock
within deep water settings of Sabah Basin.
MANUSCRIP
T
ACCEPTED
ACCEPTED MANUSCRIPT
19
(6) Further investigations are required to include samples of larger size and from other
localities within Sabah that are known to have potential source rocks, in particular the
MTDs, which are of greater interest owing to their apparent oil-prone nature. Other
aspects of analyses, which include biological distribution and palynofacies, would also
be of interest and these have been performed on the samples investigated in this study.
The results of which shall be published in the near future.
Acknowledgement
The authors gratefully acknowledge IPPP, University of Malaya for providing research grants
CG48-2013 and BK085-2016. The constructive comments by Dr J.A. Curiale and Dr. G.
Gambacorta have improved the revised manuscript and are gratefully acknowledged.
REFERENCES
Abbassi, S., Edwards, D.S., George, S.C., Volk, H., Mahlstedt, N., Primio, R., Horsfield, B.,
2016. Petroleum potential and kinetic models for hydrocarbon generation from the
Upper Cretaceous to Paleogene Latrobe Group coals and shales in the Gippsland Basin,
Australia. Organic Geochemistry 91, 54–67
Abdullah, W.H., Tongkul, F., Hassan, M.H., Togunwa, S.O., Mustapha, K.A., 2014.
Petroleum Source Rock Potential of Cenozoic Sandy Facies of NW Borneo: Deep water
Submarine Fan of Crocker Formation versus Shallow Marine Deposits of Meligan
Formation, Onshore Sabah, Malaysia, AAPG ICE.
Abdul Jalil, M., Mohd Jamaal, H., 1992. Possible source for the Tembungo Oils: Evidences
from Biomarker Fingerprints . GSM, 32, 213-232
Ahmed, M., Barclay, S.A., George, S.C., McDonald, B., Smith, J.W., 2004. The distribution
and isotopic composition of sulfur in solid bitumens from Papua New Guinea. In: Hill,
R.J. et al. (Eds.), Geochemical Investigation in Earth and Space Science. The
Geochemical Society, Special Publication 9, Elsevier, Amsterdam, pp. 51–58
MANUSCRIP
T
ACCEPTED
ACCEPTED MANUSCRIPT
20
Algar, S.C., 2012, Big Oil from “Gas Prone” Source Rocks and Leaking Traps: Northwest
Borneo. AAPG ICE , Singapore.
Algar, S., Waples, D., 2005. New source and seal types for Malaysia –the key to unlocking
the oil potential of deepwater NW Borneo. PGCE.
Azlina Anuar, Abdul Jalil Muhamad, 1997. A comparison of source rock facies and
hydrocarbon types of the Middle Miocene sequence, offshore NW Sabah Basin,
Malaysia. In Howes, J.V.C. and Noble, R.A. eds. Proceedings of the IPA Petroleum
Systems of SE Asia and Australasia, 21-23 May 1997, Indonesia Petroleum Association,
Jakarta, 773-786.
Azlina Anuar, Kinghorn, R.F.1994. Sterane and triterpane biomarker characteristics from oil
and sediments extracts of the Middle-Upper Miocene sequences , Northern Sabah Basin.
GSM Bulletin, 37.
Azlina Anuar, Peter Abolins, Paul Crevello and Wan Hasiah Abdullah, 2003. A geochemical
evaluation of the West Crocker Formation – Clues to deepwater source rock facies?
Petroleum Geology Conference & Exhibition 2003, 39-40.
Balaguru, A., and R. Hall, 2009, Tectonic Evolution and Sedimentation of Sabah, North
Borneo, Malaysia: AAPG Search and Discovery Article #30084, 15 p. Web accessed 6
November 2012.
http://www.searchanddiscovery.com/documents/2009/30084balaguru/images/balaguru.p
df
Balaguru, A., Nichols, G.J., 2004. Tertiary stratigraphy and basin evolution, southern Sabah
(Malaysian Borneo). Journal of Asian Earth Sciences 23, 537–5554.
Behar , F and Pelet, R, 1985. Pyrolysis-gas chromatography applied to organic geochemistry;
structural similarities between kerogens and asphaltenes from related source rock
extracts and oil. J. Anal. Appl. Pyrol., pp. 173–187 Elsevier, Amsterdam

MANUSCRIP
T
ACCEPTED
ACCEPTED MANUSCRIPT
21
Bordenave, M. L., Espitalie, J., Leplat, P., Oudin, J. L. and Vendenbroucke, M., 1993.
Screening techniques for source rock evaluation. In: Bordenave, M. L. (Ed.), Applied
Petroleum Geochemistry Editions Technip, Paris, pp. 237-255.
Clayton, J.L., Swetland, P.J., 1978. Subaerial weathering of sedimentary organic matter.
Geochimica et Cosmochimica Acta 42, 305-312.
Crevello, P.D., Johnson, H.D., Tongkul, F., Wells, M.R., 2008. Mixed braided and leveed-
channel turbidites, West Crocker Fan system, Northwest Borneo. In:Nielsen, T.H.,
Shew, R.D., Steffens, G.S., Studlick, J.R.J. (Eds.), Atlas of Deep-Water Outcrops, vol.
56. AAPG Studies in Geology.
Cullen, A.B., 2010. The Klias Peninsula and Padas River: NW Borneo, An Example of
Drainage Capture in an Active Tropical. Adapted from poster presentation at AAPG
Convention, New Orleans, Louisiana, April 11-14, 2010.
Dembicki, H.J. 2009. Three common source rock evaluation errors made by geologists during
prospect or play appraisals am. Assoc. Pet. Geol. Bull., 93 (3) pp. 341–35
Dembicki, H.J. 1993. Improved Determination of Source Quality and Kerogen Type by
Combining Rock Eval and Pyrolysis-Gas Chromatography Results (abs.) AAPG
1993. Annual Convention Program, vol. , p. 90.
Dembicki Jr., H., Horsfield, H.B., Ho, T.T.Y., 1983. Source rock evaluation by pyrolysis gas
chromatography. AAPG Bull. 67, 1094-1103.
DOW, W. G. 1977. Kerogen studies and geological interpretations. Journal of Geochemical
Exploration, 7, 79-99.
Eglinton, T.I, Sinninghe Damsté ,J.S, Kohnen, M.E.L., de Leeuw, J.W. 1990. Rapid
estimation of the organic sulphur content of kerogens, coals and asphaltenes by
pyrolysis-gas chromatography. Fuel, 69 , pp. 1394–1404
Espitalié, J.L., Laporte, M., Madec, F. Marquis, P. Leplat, J. Pauletand, et al. 1977. Methode
MANUSCRIP
T
ACCEPTED
ACCEPTED MANUSCRIPT
22
rapide de caracterisation des roches meres, de leur potential petrolier et de leur degre
d'evolution Rev. Inst. Fr. Pet., 32, pp. 23–42.
Fischer, C., Gaupp, R., 2005. Change of black shale organic material surface area during
oxidative weathering: Implications for rock-water surface evolution. Geochimica et
Cosmochimica Acta, 69 (5), 1213–1224.
Gartrell, A., Torres, J., Hoggmascall, N., 2011. A regional approach to understanding basin
evolution and play systematic in Brunei – unearthing new opportunities in a mature
basin. In: International Petroleum Technology Conference, Bangkok, Thailand, pp.
IPTC 1571, 1–5.
Giraud, A. 1970. Application of pyrolysis and gas chromatography to the geochemical
characterization of kerogen in sedimentary rocks. Bull. Am. Assoc. Pet. Geol., 54, pp.
439–455.
Jackson, C.A.L, Zakaria, A.A., Johnson, H.D., Tongkul, F., Crevello, P.D., 2009.
Sedimentology, stratigraphic occurrence and origin of linked debrites in the West
Crocker Formation (Oligocene-Miocene), Sabah, NW Borneo. Marine and Petroleum
Geology 26, p.1957-1973.
Hakimi, M.H., Abdullah, W.H., 2013. Organic geochemical characteristics and oil generating
potential of the upper Jurassic Safer shale sediments in the Marib-Shabowah Basin,
western Yemen. Org. Geochem. 54, 115–124.
Hall, R., 2013. Contraction and extension in northern Borneo driven by subduction rollback.
J. Asian Earth Sci. 76, 399-411
Hall, R., van Hattum, M.W.A., Spakman, W., 2008. Impact of India–Asia collision on SE
Asia: the record in Borneo. Tectonophysics 451, 366–389.
Hall, R., 1996. Reconstructing Cenozoic SE Asia. In: Hall, R. & Blundell, D. J., (eds.)
Tectonic Evolution of SE Asia. Geological Society, London, Special Publications 106,
MANUSCRIP
T
ACCEPTED
ACCEPTED MANUSCRIPT
23
153- 184.
Harry, D.J., 2008. Three common source rock evaluation errors made by geologists during
prospect or play appraisals. AAPG Bull. 93, 341-356.
Horsfield, B.1989. Practical criteria for classifiying kerogens: some observations from
pyrolysis–gas chromatography. Geochim. Cosmochim. Acta, 53
Hutchison, C.S., 1996. South-East Asian Oil, Gas, Coal and Mineral Deposits, Oxford
Monographs on Geology and Geophysics, 36, Clarendon Press, Oxford, 36 p 1-265 p
Hunt, J.M., 1996. Petroleum Geochemistry and Geology. W.H. Freeman and Company. New
York
Killops, S.D. and Killops, V.J., 2005. Introduction to organic geochemistry. Second edition.
U.K: Blackwell Publishing Limited.
Lambiase, J., Cullen A., 2013., Sediment Supply Systems of the Champion "Delta" of NW
Borneo: Implications for the Distribution and Reservoir Quality of Associated
Deepwater Sandstones, Journal of Asian Earth Sciences.
Larter, S.R.,1984. Application of analytical pyrolysis technique to kerogen characterization
and fossil fuel exploitation. In: K. Voorhees (Ed.), Analytical Pyrolysis,
Butterworths, London (1984), pp. 212–275
Larter, S.R., Douglas, A.G., 1980. A Pyrolysis –gas chromatographic method for kerogen
typing. In: A.G. Douglas, J.R. Maxwell (Eds.), Advances in Organic
Geochemistry. Pergamon Press, New York (1980), pp. 579–584
Leong, K.M., 1999. Geological Setting of Sabah. In: PETRONAS (Ed.), The Petroleum
Geology and Resources of Malaysia. Percetakan Mega,. Kuala Lumpur. 293-341.
Lin, R., Saller, A., Dunham, J., Teas, P., Kacewicz, M., Curiale, J., and Decker, J., 2005,
Source, Generation, Migration and Critical Controls on Oil versus Gas in the Deepwater
Kutei Petroleum System: Proceedings of the Indonesia Petroleum Association 30th

MANUSCRIP
T
ACCEPTED
ACCEPTED MANUSCRIPT
24
Annual Convention, p. 447-466.
Littke R., Klussmann U., Krooss B., Leythaeuser D., 1991. Quantification of loss of calcite,
pyrite and organic matter due to weathering of Toarcian black shales and effects on
kerogen and bitumen characteristics. Geochim. Cosmochim. Acta 55, 3369–3378.
Lukie, T., Balaguru, A., 2012, Sequence Stratigraphic, Sedimentologic and Petrographic
Insights of the Miocene (Stage IVA) Outcrops of the Klias Peninsula and Labuan
Island, Sabah, Malaysia, Borneo, AAPG ICE, September 16-19, Singapore.
Leythaeusar, D., 1973. Effects of weathering on organic matter in shales. Geochimica et
Cosmochimica Acta 37 (1), 113-120.
Makeen, Y.M., Abdullah, W.H., Hakimi, M.H., Mustapha, K.A., 2015. Source rock
characteristics of the lower Cretaceous Abu Gabra formation in the Muglad Basin,
Sudan, and its relevance to oil generation studies. Mar. Petrol. Geol. 59, 505-516.
Mazlan M., Leong, K.M. & Azlina Anuar, 1999. Sabah Basin. The Petroleum Geology and
Resources of Malaysia, Percetakan Mega, Kuala Lumpur, 501-538.
Mukhopadhyay, P.K., Wade, J.A., Kruge, M.A., 1995. Organic facies and maturation of
Cretaceous/ Jurassic rocks and possible oil-source rock correlation based on pyrolysis of
asphaltenes, Scotian basin, Canada. Org. Geochem. 22, 85–104.
Nor Farhana Nor Azidin, Balaguru, A., Nasaruddin Ahmad. 2011. Structural styles of the
North West Sabah and Sulawesi Fold Thrust Belt Regions and its implications to the
petroleum system-a comparison. PGCE.
Othman, R.S., 2003, Petroleum Geology of Gunnedah-Bowen-Surat Basins, Northern New
Wales (Stratigraphy, Organic Petrology and Organic Geochemistry), PhD Thesis
(unpublished), University of New South Wales, 312p.
Peters, K.E., 1986. Guidelines for evaluating petroleum source rock using programmed
pyrolysis. AAPG bulletin, 70, 318-329.

MANUSCRIP
T
ACCEPTED
ACCEPTED MANUSCRIPT
25
Peters, K.E., Cassa, M.R., (1994). Applied source rock geochemistry. In: Magoon , L.B.,
Dow, W.G.(Eds), The Petroleum System-From Source to Trap. American Association
of Petroleum Geologists Memoir60, pp.93-120.
Peters, K.E., Walters, C.C., & Moldowan, J.M., 2005. Biomarker guide: Volume 2.
Biomarkers and Isotopes in Petroleum Exploration and Earth History. 2nd Edition,
Cambridge: University Press, 476-971.
Petsch, S.T., Berner, R.A., Eglinton, T.I., 2000. A field study of the chemical weathering of
ancient sedimentary organic matter. Organic Geochemistry 31, 475-487.
Radke, M. 1987. Organic geochemistry of aromatic hydrocarbons. In Advances in Petroleum
Geochemistry 2, 141-207. Academic Press London.
Rangin, C., Bellon, H., Bernard, F., Letouzey, J., Muller,C., Sanudin , T., 1990. Neogene arc-
continent collision in Sabah, northern Borneo (Malaysia). Tectonophysics 183, 305-319.
Saller, A., Lin, R., and Dunham, J., 2006, Leaves in Turbidite Sands: the Main Source of Oil
and Gas in the Deep-Water Kutei Basin, Indonesia: American Association of Petroleum
Geologists Bulletin, v. 90, p. 1585-1608.
Scherer, F.C., 1980. Exploration in East Malaysia over the past decade. In: Halbouty, M.T.,
ED., Giant Oil and Gas Fields of the Decade 1968-1978. AAPG Memoir, 30, 423-440
Stephens , E.A., 1956. The geology and mineral resources of the Kota Belud and Kudat Area,
North Borneo. British Borneo Geol. Surv. Mem.5.
Sykes, R. Raine, J.I., 2008. Organofacies controls on the oil potential of coaly source rocks in
the Late Cretaceous North Cape Formation, Taranaki Basin. 219-224 In: Blevin, J.E.;
Bradshaw, B.E.; Uruski, C.I. (eds) Third Eastern Australasian Basins Symposium,
EABS III: energy security for the 21st century: symposium proceedings. Sydney, NSW:
Petroleum Exploration Society of Australia. Special publication / Petroleum Exploration
Society of Australia.

MANUSCRIP
T
ACCEPTED
ACCEPTED MANUSCRIPT
26
Tamamura, S., Ueno, A., Aramaki, N., Matsumoto, H., Uchida, K., Igarashi, T., Kaneko, K.,
2015. Effects of oxidative weathering on the composition of organic matter in coal and
sedimentary rock. Organic Geochemistry 81, 8–19
Tan, C.H., 2010, Facies Distribution and Stratigraphic Development on a Shale-Cored Ridge,
Klias Peninsula, Malaysia, Bulletin of Earth Sciences of Thailand, 3 (2), p.9- 11241–260.
Tan, D.N.K., Lamy, J.M., 1990. Tectonic evolution of the NW Sabah continental margin
since the Late Eocene. Bulletin of the Geological Society of Malaysia 27
Teichmüller, M., Littke R., & Robert, P., 1998. Coalification and maturation. In: Taylor,
G.H., Teichmüller, M., Davis, A., Diessel, C.F., Littke, R. and Robert, P. Editors,
Organic Petrology, Berlin: Gebrüder Borntraeger, pp. 86–174.
Tissot, B.T. and Welte, D.H., 1984. Petroleum Formation and Occurrences. Second Edition.
Berlin: Springer-Verlag.
Tongkul, F., 1997. Sedimentation and tectonics of Paleogene sediments in Central Sarawak.
Bulletin of the Geological Society of Malaysia, 40 . pp. 135-140. ISSN 0126-6187.
Tongkul, F., 1994. The geology of northern Sabah, Malaysia: its relationship to the opening of
the South China Sea Basin. Tectonophysics, 235, 131-137
Tongkul, F., 1991. Basin development and deposition of the Bongaya Formation in the Pitas
Area, Northern Sabah. Bull. Geol. Soc. Malaysia 29, 183-193.
Tongkul, F. 1989. “The sedimentology and structure of the Crocker Formation in the Kota
Kinabalu area,” GEOSEA VI Proceedings, Jakarta 1987, Indonesian Association of
Geologists, pp. 135-156.
Van Hattum, M.W.A., Hall, R., Pickard, A.L., Nicols, G., 2006. Southeast Asian sediments
not from Asia: Provenance and geochronology of north Borneo sandstones. Geology, 34
(7), 589-592.
Zakaria, A.A., Johnson, H.D., Jackson, C.A.-L, Tongkul, F. 2013. Sedimentary facies analysis
MANUSCRIP
T
ACCEPTED
ACCEPTED MANUSCRIPT
27
and depositional model of the Palaeogene West Crocker submarine fan system, NW
Borneo. Journal of Asian Earth Sciences 76, 283-300.
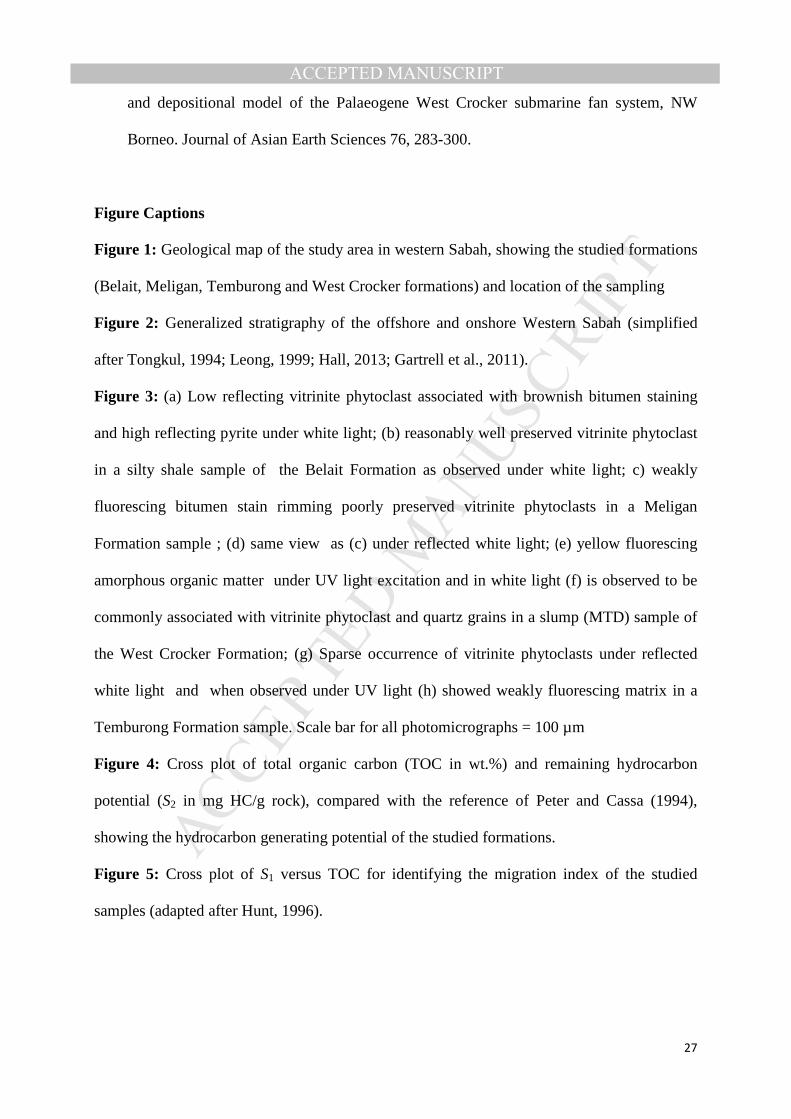
Figure Captions
Figure 1: Geological map of the study area in western Sabah, showing the studied formations
(Belait, Meligan, Temburong and West Crocker formations) and location of the sampling
Figure 2: Generalized stratigraphy of the offshore and onshore Western Sabah (simplified
after Tongkul, 1994; Leong, 1999; Hall, 2013; Gartrell et al., 2011).
Figure 3: (a) Low reflecting vitrinite phytoclast associated with brownish bitumen staining
and high reflecting pyrite under white light; (b) reasonably well preserved vitrinite phytoclast
in a silty shale sample of the Belait Formation as observed under white light; c) weakly
fluorescing bitumen stain rimming poorly preserved vitrinite phytoclasts in a Meligan
Formation sample ; (d) same view as (c) under reflected white light; (e) yellow fluorescing
amorphous organic matter under UV light excitation and in white light (f) is observed to be
commonly associated with vitrinite phytoclast and quartz grains in a slump (MTD) sample of
the West Crocker Formation; (g) Sparse occurrence of vitrinite phytoclasts under reflected
white light and when observed under UV light (h) showed weakly fluorescing matrix in a
Temburong Formation sample. Scale bar for all photomicrographs = 100 µm
Figure 4: Cross plot of total organic carbon (TOC in wt.%) and remaining hydrocarbon
potential (S2 in mg HC/g rock), compared with the reference of Peter and Cassa (1994),
showing the hydrocarbon generating potential of the studied formations.
Figure 5: Cross plot of S1 versus TOC for identifying the migration index of the studied
samples (adapted after Hunt, 1996).

MANUSCRIP
T
ACCEPTED
ACCEPTED MANUSCRIPT
28
Figure 6: Modified van Krevelen diagram of Hydrogen index (HI) versus Oxygen index (OI)
showing kerogen quality of the studied formations.
Figure 7: Plot of Hydrogen Index versus Tmax (Mukhopadhyay et al., 1995), showing the type
of kerogen and thermal maturity of the studied samples.
Figure 8: Cross plot of total organic carbon (TOC in wt. %) and remaining hydrocarbon
potential (S2 in mg HC/g rock showing the quality of kerogen in the studied formations.
Figure 9: Correlation plot between pyrolysis Tmax and vitrinite reflectance values of the
studied samples.
Figure 10: Cross-plot of pyrolysis Tmax versus production index (PI), showing the maturation
and nature of the hydrocarbon products of the analysed samples.
Figure 11: Distribution of EOM fractions in the studied samples.
Figure 12: The potential of hydrocarbon generation in a source rock as estimated from TOC
(%) versus EOM (ppm) data, The origin of the fields adapted after Othman (2003).
Figure 13: Pyrolysis GC pyrograms of selected samples showing n-alkene/alkane doublets
and labeled peaks used as kerogen type proxies.
Figure 14: Ternary diagram of the relative percentages m-p-xylene, phenol, and n-octene .
The type fields were modified after Larter (1984).
Tables Captions
Table 1: This table shows the outcrop locations using GPS coordinates and the lithology
description of the samples.
Table 2: Vitrinite reflectance and bulk geochemical characteristics (TOC content, Rock-Eval
pyrolysis) of the studied Belait (BL), Meligan (ME), Temburong (TEM) and West Crocker
(WC) formations. TOC: total organic carbon (wt %), S1: volatile hydrocarbon (HC) content,
mg HC/g rock; S2: remaining HC generative potential, mg HC/g rock; S3: carbon dioxide

MANUSCRIP
T
ACCEPTED
ACCEPTED MANUSCRIPT
29
yield, mgCO2/g rock; HI: Hydrogen Index = S2 X 100/TOC, mg HC/g TOC; OI: Oxygen
Index = S3 X 100/TOC, mg CO2/g TOC; PI: Production Index = S1/(S1 + S2); GP: Genetic
Potential=S1+S2 Tmax = Temperature at maximum generation, Ro= Vitrinite reflectance.
Table 3: Extractable organic matter and hydrocarbon yield from the studied samples.
EOM=Extractable organic matter (Bitumen extraction); Sat= Saturated hydrocarbon; Aro =
Aromatic hydrocarbon; HC–Hydrocarbon fractions (Saturated + Aromatic); Non HC– Non-
hydrocarbon fractions (NSO)
Table 4: Py-GC pyrogram quantitative data. C8: n-Octene, Xy: Xylene, Phe: Phenol.
MANUSCRIP
T
ACCEPTED
ACCEPTED MANUSCRIPT
Table 1
Formation Locality Location Sample ID GPS Coordinates Lithology
Bel
ait
For
mat
ion
Bat
uLua
ng
BL-
A
BL-A2-SH N05.52415,E115.52573 Mudstone
BL-A3-SH N05.52415,E115.52573 Carbonaceous mudstone
BL-A5-SST N05.52415,E115.52573 Organic laminated sandstone
BL-A6-SST N05.52415,E115.52573 Sandstone
BL-A7-SH N05.52415,E115.52573 Mudstone
BL-A8-SST N05.52415,E115.52573 Carbonaceous sandstone
BL-B BL-B1-SH N05.52365,E115.52520 Mudstone
BL-C BL-C2-SH N05.52350,E115.52475 Mudstone associated with coal
Sip
itang
ME-130
ME-130B-SH N05.02157, E115.32355 Mudstone associated with concretions
Mel
igan
F
orm
atio
n
ME-130C-SST N05.02157, E115.32355 Carbonaceous sandstone
ME-130F-SH N05.02157, E115.32355 Mudstone
ME-133 ME-133A-SST N05.00651,E115.33254 Carbonaceous sandstone
ME-133C-SH N05.00651,E115.33254 mudstone
ME-134 ME-134A-SH N05.00651,E115.33254 Coaly mudstone
Sip
itang
-Ten
om
TME-137 TEM-137A-SH --- Dark shale
Tem
buro
ng
For
mat
ion
TEM-137B-SS --- sandstone
TME-138 TEM -138-SH --- Dark shale
TME-139 TEM-139-SH N04.58147,E115.42054 Dark shale
TEM-139-SS N04.58147,E115.42054 sandstone
TME-140 TEM-140-SH N04.58124,E115.42801 Dark shale
Sip
itang
WC-129
WC-129B-SH N0502376,E115.30998 Dark shale
Wes
t Cro
cker
For
mat
ion WC-129E-MTD N0502376,E115.30998 Slumps deposits (silty)
WC-129D-MTD N0502376,E115.30998 Slumps deposits (shaly)
WC-129F-MTD N0502376,E115.30998 Slumps deposits (sandy)
WC-135 WC-135B-SST N04.59835,E115.35441 Carbonaceous sandstone
WC-144 WC-144A-MTD N05.46563,E116.01333 Slumps deposits (sandy)
WC-144B-SH N05.46563,E116.01333 Dark shale
WC-145
WC-145A-SST --- Sandstone
WC-145B-MTD --- Slumps deposits (sandy)
WC-145C-SH --- Dark shale

MANUSCRIP
T
ACCEPTED
ACCEPTED MANUSCRIPT
Table 2
Formation Sample ID VRo (%)
TOC Wt.%
S1 (mg/g)
S2 (mg/g)
S3 (mg/g)
Tmax (°C) HI OI GP PI S1/
TOC
Bel
ait
For
mat
ion
BL-A2-SH 0.46 1.71 0.03 0.31 0.76 435 18 45 0.34 0.08 0.02
BL-A3-SH 0.44 5.03 0.16 5.19 2.26 428 103 45 5.35 0.03 0.03
BL-A5-SST 0.45 4.18 0.09 5.29 1.07 426 126 26 5.38 0.02 0.02
BL-A6-SST 0.46 1.08 0.06 0.39 0.47 437 36 44 0.45 0.13 0.05
BL-A7-SH 0.43 1.05 0.02 0.25 0.55 431 24 53 0.27 0.08 0.02
BL-A8-SST nd 7.87 0.58 12.8 2.58 418 163 33 13.38 0.04 0.07
BL-B1-SH 0.44 2.27 0.27 3.18 0.59 431 127 23 3.45 0.08 0.12
BL-C2-SH 0.45 1.19 0.08 0.39 0.50 432 33 42 0.47 0.17 0.07
M
elig
an
For
mat
ion
ME-130B-SH 0.87 0.98 0.04 0.20 nd 458 20 nd 0.24 0.17 0.04
ME-130C-SS 0.74 1.34 0.03 0.25 0.42 460 19 32 0.28 0.11 0.02
ME-130F-SH 0.69 2.85 0.22 0.64 0.48 444 22 17 0.86 0.26 0.08
ME-133A-SS 0.72 3.03 0.07 1.99 0.49 452 66 16 2.06 0.03 0.02
ME-133C-SH nd 1.77 0.15 0.99 0.56 471 56 32 1.14 0.13 0.09
ME-134A-SH 0.71 2.42 0.19 1.05 nd 472 43 nd 1.24 0.15 0.08
T
embu
rong
F
orm
atio
n
TEM-137A-SH 1.08 1.1 0.07 0.59 0.17 492 54 15 0.66 0.11 0.06
TEM-137B-SS 1.14 0.51 0.17 0.19 nd 497 37 nd 0.36 0.47 0.33
TEM-138-SH nd 1.38 0.03 0.32 0.35 487 23 25 0.35 0.09 0.02
TEM-139-SH nd 1.26 0.02 0.22 nd 490 17 nd 0.24 0.08 0.02
TEM-139-SS nd 0.58 0.01 0.25 0.13 492 43 22 0.26 0.04 0.02
TEM-140-SH 0.99 0.71 0.05 0.32 0.17 474 45 24 0.37 0.14 0.07
Wes
t Cro
cker
For
mat
ion WC-129B-SH 0.79 1.23 0.03 0.18 0.28 455 14 23 0.21 0.15 0.03
WC-129D-MTD nd 1.73 0.44 1.66 0.31 450 96 18 2.10 0.21 0.25
WC-129E-MTD 0.82 2.26 0.08 0.82 0.47 453 36 21 0.90 0.09 0.04
WC-129F-MTD nd 2.4 0.11 0.95 0.24 459 40 10 1.06 0.10 0.05
WC-135B-SST 0.89 3.94 0.07 4.69 0.44 465 119 11 4.76 0.01 0.02
WC-144A-MTD 0.92 10.63 0.09 35.83 0.52 463 337 5 35.92 0.00 0.01
WC-144B-SH nd 1.72 0.01 0.18 0.79 473 10 46 0.19 0.08 0.01
WC-145A-SST nd 0.65 0.01 0.03 0.29 515 5 44 0.04 0.14 0.01
WC-145B-MTD 1.14 6.32 0.06 3.25 0.46 503 51 7 3.31 0.02 0.01
WC-145C-SH nd 1.06 0.01 0.02 0.29 488 2 27 0.03 0.20 0.01 TOC: total organic carbon (wt %), S1: volatile hydrocarbon (HC) content, mg HC/g rock; S2: remaining HC generative potential, mg HC/g rock; S3: carbon dioxide yield, mg CO2/g rock; HI: hydrogen index = S2 100/TOC, mg HC/g TOC; OI: oxygen index = S3 100/TOC, mg CO2/g TOC; PI: production index = S1/(S1 + S2); GP: genetic potential= S1+S2 Tmax = Temperature at maximum generation, VRo= vitrinite reflectance.

MANUSCRIP
T
ACCEPTED
ACCEPTED MANUSCRIPT
Table 3
Formations Sample ID TOC
(wt.%) EOM
(wt.%) EOM (ppm)
Sat. (%)
Aro (%)
Non-HC (%)
Sat. (ppm)
Aro. (ppm)
Non-HC
(ppm)
HC yield (ppm)
Bel
ait F
orm
atio
n
BL-A2-SH 1.71 0.14 1420 20 32 48 284 454 682 738
BL-A3-SH 5.03 0.22 2210 19 29 52 420 641 1149 1061
BL-A5-SS 4.18 0.21 2082 18 33 49 375 687 1020 1062
BL-A6-SS 1.08 0.10 1005 18 31 51 181 312 513 492
BL-A7-SH 1.05 0.10 1030 18 34 48 185 350 494 536
BL-A8-SS 7.87 0.17 1654 16 32 52 265 529 860 794
BL-B1-SH 2.27 0.19 1850 17 31 52 315 574 962 888
BL-C2-SH 1.19 0.11 1050 17 25 58 179 263 609 441
Mel
igan
F
orm
atio
n
ME-130B-SH 0.98 0.14 1420 18 39 43 256 554 611 809
ME-130C-SS 1.34 0.11 1053 15 45 40 158 474 421 632
ME-130F-SH 2.85 0.11 1070 17 43 40 182 460 428 642
ME-133A-SS 3.03 0.09 852 20 47 33 170 400 281 571
ME-133C-SH 1.77 0.20 1982 19 48 33 377 951 654 1328
ME-134A-SH 2.42 0.16 1580 16 46 38 253 727 600 980
Tem
buro
ng
For
mat
ion
TEM-137A-SH 1.10 0.03 620 16 56 28 99 347 174 447
TEM-137B-SS 0.51 0.04 545 14 57 29 76 311 158 387
TEM-138-SH 1.38 0.05 582 16 55 29 93 320 169 413
TEM-139-SH 1.26 0.03 683 14 53 33 96 362 225 458
TEM-139-SS 0.58 0.04 642 16 58 26 103 372 167 475
TEM-140-SH 0.71 0.03 550 13 55 32 72 303 176 374
Wes
t Cro
cker
For
mat
ion
WC-129B-SH 1.23 0.07 698 15 58 27 105 405 188 510 WC-129E-MTD 2.26 0.18 1784 37 48 15 660 856 268 1516
WC-129D-MTD 1.73 0.16 1560 36 45 19 562 702 296 1264
WC-129F-MTD 2.40 0.19 1850 37 43 20 685 796 370 1480
WC-135B-SS 3.94 0.18 1058 14 63 23 148 667 243 815 WC-144A-MTD 10.63 0.42 4200 36 42 22 1512 1764 924 3276
WC-144B-SH 1.72 0.07 726 19 63 18 138 457 131 595
WC-145A-SS 0.65 0.08 756 22 65 13 166 491 98 658 WC-145B-MTD 6.32 0.41 4098 41 39 20 1680 1598 820 3278
WC-145C-SH 1.06 0.07 659 17 61 22 112 402 145 514 EOM=Extractable organic matter (Bitumen extraction); Sat= Saturated hydrocarbon; Aro = Aromatic hydrocarbon; HC–Hydrocarbon fractions (Saturated + Aromatic); Non HC– Non-hydrocarbon fractions (NSO+ Asphaltene)

MANUSCRIP
T
ACCEPTED
ACCEPTED MANUSCRIPT
Table 4
Formation
Sample ID C8 (%)
Xy (%)
Phe (%)
Belait
BL-A3-SH 15 36 49 BL-A5-SS 16 37 46 BL-A6-SS 14 32 54 BL-B1-SH 16 35 49
Meligan
BL-C2-SH 18 55 27 ME-134A-SH 31 55 14 ME-130F-SH 20 47 33 ME-133A-SS 19 54 27
Temburong
TE-139-SH 23 70 7 TE-137A-SH 13 81 6 TE-140-SH 15 81 3
West Crocker
WC-129E-MTD 52 43 8 WC-144A-MTD 53 38 10 WC-145B-MTD 30 61 9 WC-129B-SH 29 63 8 WC-135B-SS 32 56 12
C8: n-Octene, Xy: Xylene, Phe: Phenol

MANUSCRIP
T
ACCEPTED
ACCEPTED MANUSCRIPT

MANUSCRIP
T
ACCEPTED
ACCEPTED MANUSCRIPT
MANUSCRIP
T
ACCEPTED
ACCEPTED MANUSCRIPT
MANUSCRIP
T
ACCEPTED
ACCEPTED MANUSCRIPT

MANUSCRIP
T
ACCEPTED
ACCEPTED MANUSCRIPT

MANUSCRIP
T
ACCEPTED
ACCEPTED MANUSCRIPT
MANUSCRIP
T
ACCEPTED
ACCEPTED MANUSCRIPT
MANUSCRIP
T
ACCEPTED
ACCEPTED MANUSCRIPT

MANUSCRIP
T
ACCEPTED
ACCEPTED MANUSCRIPT

MANUSCRIP
T
ACCEPTED
ACCEPTED MANUSCRIPT

MANUSCRIP
T
ACCEPTED
ACCEPTED MANUSCRIPT
MANUSCRIP
T
ACCEPTED
ACCEPTED MANUSCRIPT
MANUSCRIP
T
ACCEPTED
ACCEPTED MANUSCRIPT

MANUSCRIP
T
ACCEPTED
ACCEPTED MANUSCRIPT

MANUSCRIP
T
ACCEPTED
ACCEPTED MANUSCRIPT
Highlights:
1. The Belait and Meligan formations generally possess fair to good petroleum source rock
potential.
2. The Temburong and West Crocker formations mostly have none to fair petroleum source rock
potential.
3. The mass transport deposit (MTDs) sequence shows fair to excellent hydrocarbon generating
potential
4. The MTD samples are richer in aliphatic hydrocarbon supported with presence of fluorescing
amorphous organic matter.
5. The proportion of aromatic to aliphatic hydrocarbons of the analysed samples increases with
maturity