Embed Size (px)
Citation preview
HESSD7, 4371–4409, 2010
Hydrochemistry(major and trace
elements) of LakeMalawi (Nyasa)
P. Branchu et al.
Title Page
Abstract Introduction
Conclusions References
Tables Figures
J I
J I
Back Close
Full Screen / Esc
Printer-friendly Version
Interactive Discussion
Discussion
Paper
|D
iscussionP
aper|
Discussion
Paper
|D
iscussionP
aper|
Hydrol. Earth Syst. Sci. Discuss., 7, 4371–4409, 2010www.hydrol-earth-syst-sci-discuss.net/7/4371/2010/doi:10.5194/hessd-7-4371-2010© Author(s) 2010. CC Attribution 3.0 License.
Hydrology andEarth System
SciencesDiscussions
This discussion paper is/has been under review for the journal Hydrology and EarthSystem Sciences (HESS). Please refer to the corresponding final paper in HESSif available.
Hydrochemistry (major and traceelements) of Lake Malawi (Nyasa),Tanzanian Northern Basin: local versusglobal considerations
P. Branchu1, L. Bergonzini2, J.-P. Ambrosi3, D. Cardinal4, M. Delalande2,*,E. Pons-Branchu5, and M. Benedetti6
1Laboratoire Regional de l’Ouest Parisien, 12 rue Teisserenc de Bort, 78190 Trappes, France2UMR-CNRS 8148 IDES, Bat. 504, Universite Paris-Sud, 91405 Orsay Cedex, France3CEREGE – UMR 6635 – Europole Mediterraneen de l’Arbois, BP 80, 13545 Aix En Provencecedex 04, France4Royal Museum for Central Africa, Dept. of Geology and Mineralogy, 3080 Tervuren, Belgium5LSCE – UMR 1572, Orme des Merisiers Bat. 701, Centre CEA de Saclay, 91191 Gif surYvette Cedex, France6UMR 7154 – IPGP, Universite Paris 7, Case postale 7052, 75205 Paris Cedex 13, France
4371
HESSD7, 4371–4409, 2010
Hydrochemistry(major and trace
elements) of LakeMalawi (Nyasa)
P. Branchu et al.
Title Page
Abstract Introduction
Conclusions References
Tables Figures
J I
J I
Back Close
Full Screen / Esc
Printer-friendly Version
Interactive Discussion
Discussion
Paper
|D
iscussionP
aper|
Discussion
Paper
|D
iscussionP
aper|
*present address: UMR7517 Laboratoire d’Hydrologie et de Geochimie de Strasbourg, 1 rueBlessig – 67084 Strasbourg Cedex, France
Received: 8 June 2010 – Accepted: 14 June 2010 – Published: 7 July 2010
Correspondence to: P. Branchu ([email protected])
4372
HESSD7, 4371–4409, 2010
Hydrochemistry(major and trace
elements) of LakeMalawi (Nyasa)
P. Branchu et al.
Title Page
Abstract Introduction
Conclusions References
Tables Figures
J I
J I
Back Close
Full Screen / Esc
Printer-friendly Version
Interactive Discussion
Discussion
Paper
|D
iscussionP
aper|
Discussion
Paper
|D
iscussionP
aper|
Abstract
This paper presents the first inventory of dissolved minor and trace element (F, Al, Fe,Mn, Ba, Cd, Cr, Cu, Pb, Mo, Bi, Sr, Zn) concentrations in Lake Malawi, the secondlargest African lake. Sampling was carried out during 1993 dry season in the northernpart of the lake. Trace metal concentrations were measured, together with Ca, Mg,5
Na, K, Cl, SO4, Alkalinity and Si, along three profiles in the lake northern extremity, infive tributaries and two on-land hydrothermal springs. Water profiles show similar ele-mental distributions and concentrations that are influenced by lake physical-chemicalstratification. Stratification, assessed using temperature, conductivity, Si and Mn pro-files, is characterised by two boundaries: the thermocline (70–90 m) and the oxicline10
(150–190 m). Elemental water concentrations are discussed using simple covarianceanalyse. Epilimnetic concentrations and distribution are also influenced by atmosphericdeposition and river diving. Comparison of dissolved concentrations for potentially pol-luting elements with World Health Organisation Guidelines and those reported for otherEast African lakes shows that this reservoir is uncontaminated despite an increasing15
human stress. Major element behaviour is assessed through a 3 boxes model. In thismodel Cl and K are conservative elements whereas Si is removed from the solutionby diatom productivity and sedimentation. Ca, Na, Mg and alkalinity show low reac-tivity. Evaporation is one of the controlling factors of lake element concentration thatsuperimposes on the watershed control. Hydrothermal activity, not evidenced in the20
lake, controls the chemistry of one of the main northern tributary. Chemical compari-son between Northern rivers and other tributaries characterises the geographical andgeological specificity of studied northern watershed. Moreover the lake annual chem-ical budget shows that northern watershed generates the main elemental input to thelake, illustrating the dual importance of this area in terms of water and ionic recharge25
to the lake.
4373
HESSD7, 4371–4409, 2010
Hydrochemistry(major and trace
elements) of LakeMalawi (Nyasa)
P. Branchu et al.
Title Page
Abstract Introduction
Conclusions References
Tables Figures
J I
J I
Back Close
Full Screen / Esc
Printer-friendly Version
Interactive Discussion
Discussion
Paper
|D
iscussionP
aper|
Discussion
Paper
|D
iscussionP
aper|
1 Introduction
Tropical lakes are of fundamental importance for regional economies and biodiver-sity conservation, but they experience large limnological changes that greatly affecttheir productivity, ecology, physico-chemistry and their water level at the time scaleof human life. The mechanisms behind these fluctuations are not fully understood.5
For example, Tanganyika’s falling productivity over the past century has been recentlylinked to increased water temperature and then higher stratification (Verburg et al.,2003; O’Reilly et al., 2003). The unprecedented rates of sedimentation increase sincethe early 1960’s in the Lake Tanganyika basin suggests strong disturbances, whichinvolves a combination of climatic and anthropogenic causes (e.g. heavy rainfall and10
deforestation; Cohen et al., 2005). Lake Victoria eutrophication (Machiwa, 2003) andmetals-metalloids contamination of its waters and sediments (Ikingura et al., 2006;Kishe and Machiwa, 2003; Ramlal et al., 2003) have been linked to human threatsexpressed through fishing pressure, land use changes, urbanisation, industry, miningand new species introduction. Indeed, in the East African Great Lakes region, the high15
annual growth of population (about 2.5% according to the Population Reference Bu-reau, 2009) is responsible for large watershed pressure and for water stress that canlead to contamination and/or overexploitation of both water and fish resources (Co-hen et al., 1996). Consequences of such human activities could be drastic, as thesereservoirs constitute an important provider of freshwater and fish protein. Researches20
on anthropogenic disturbances in East African Great Lakes focus particularly on thepossible eutrophication that is a regional scale problem (UNEP/IETC, 2000) and onsedimentary inputs to lakes (Hecky et al., 2003; Machiwa, 2003). On Lake Malawi,studies were focused on organic-pollutants in water and sediments, trace elementsin sediments and mercury food web contamination (Karlson et al., 2000; Kidd et al.,25
1999, 2003). According to these characterisations and other reports on the pollutionof East African Great Lakes (Cohen et al., 1996), Lake Malawi appears to be relativelypreserved besides a water warming during last century (Branchu et al., 2005a; Vollmer
4374
HESSD7, 4371–4409, 2010
Hydrochemistry(major and trace
elements) of LakeMalawi (Nyasa)
P. Branchu et al.
Title Page
Abstract Introduction
Conclusions References
Tables Figures
J I
J I
Back Close
Full Screen / Esc
Printer-friendly Version
Interactive Discussion
Discussion
Paper
|D
iscussionP
aper|
Discussion
Paper
|D
iscussionP
aper|
et al., 2005) and increase of deforestation, along with runoff, since 1967 (Calder et al.,1995) changing the lake water balance; Furthermore it has been shown that potentialchanges in water compositions of the tributaries could induce important changes in theLake Malawi water quality (Branchu et al., 2005b). The goals of this study are 1) tocharacterise the inorganic water geochemistry of northern part of Lake Malawi, 2) to5
determine its origin 3) to discuss the specificity of the northern watershed.Lake Malawi (Fig. 1), 570 km long (9◦30′–14◦40′ S; 34◦ E), 700 m of maximum depth
and a volume of 7790 km3 (Vollmer et al., 2002), is the second largest surface wa-ter reservoir on the African continent and represents about 6% of the world surfacefree freshwaters. The lake presents at its south a surface outlet, the Shire River10
(Fig. 1). Overall, its catchment (126 500 km2) is affected by a tropical climate and ismainly located on the western coast drained by the Songwe, North and South Rukuru,Dwanga, Bua and Linthipe Rivers (Fig. 1). The eastern shore is mainly drained bythe Ruhuhu River and the northern one by the Kiwira, Mbaka, Lufirio and LumbilaRivers (Fig. 1). This northern basin is characterised by the Poroto-Rungwe and Liv-15
ingstone mountains, volcanic rocks and has the highest specific water flow comparedto the rest of the catchment (Bergonzini, 1998). The lake is meromictic with a per-manent thermo-haline stratification (Halfman, 1993), which limits mixing and oxygenpenetration at depths where biological degradation of settling organic matter is pre-dominant, leading to anoxia between 170 and 300 m (Halfman, 1993; Vollmer et al.,20
2002). This hydrodynamic scheme is somewhat simple since spatio-temporal varia-tions occur due to internal waves and upwelling (Eccles, 1974; Hamblin et al., 2003).According to classification based on nutrient budget concentration it would be consid-ered as oligotrophic but due to its high plankton production rates it is rather consideredas mesotrophic (Bootsma et al., 2003). Its water composition belongs to the “common”25
East African waters (Kilham and Hecky, 1973), resulting from a water-rock interactiondominance (Kilham, 1990; Gibbs, 1970), mostly controlled by the weathering of Pre-cambrian granitic and metamorphic rocks of its watershed with little influence of theRungwe volcanic rocks (Hecky and Bugenyi, 1992). The present study focuses on the
4375
HESSD7, 4371–4409, 2010
Hydrochemistry(major and trace
elements) of LakeMalawi (Nyasa)
P. Branchu et al.
Title Page
Abstract Introduction
Conclusions References
Tables Figures
J I
J I
Back Close
Full Screen / Esc
Printer-friendly Version
Interactive Discussion
Discussion
Paper
|D
iscussionP
aper|
Discussion
Paper
|D
iscussionP
aper|
northern part of the lake and its watershed (Fig. 1) that expresses singular features,with tectonic, seismic, volcanic and hydrothermal activities compared with the rest ofthe catchment and a relatively high heat flows at the lake’s bottom (Branchu et al.,2005a). It is based on major, minor and trace element (Alkalinity, Cl, F, SO4, K, Ca, Na,Mg, Si, Al, Fe, Cr, Mn, Co, Ni, Cu, Zn, Sr, Mo, Cd, Ba and Pb) analyses performed on5
water column and tributaries.
2 Material and methods
2.1 Sample collection and processing
During the framework of the CASIMIR (Comparative Analysis of Sedimentary InfillMechanisms in Rifts) Belgian project, and especially during the fieldwork of October10
1993, different types of waters from the north basin (Tanzanian part of Livingstonebasin) were sampled on land and on-board of the Nyanja vessel. Three lake water pro-files (P1, P2 and P3, Fig. 1), corresponding to epilimnetic (0–105 m) and metalimnetic(105–220 m) waters, were sampled using a 5 L PVC Hydro-Bios® bottle. On land, fiverivers and two hydrothermal springs were also sampled (Fig. 1). 500 mL polypropylene15
(PP) flasks were flushed and filled with sampled water, flask cap was then sealed usingParafilm® and stored at temperature <4 ◦C until processing. Water samples were thenprocessed in a closed place on a clean surface: 240 mL were filtered using a frontalfiltration unit (Sartorius®, 47 mm type) through 0.45 µm cellulose nitrate membranes(Sartorius® type). Two PP flasks were filled with this filtered sample, only one (200 mL)20
being acidified at pH∼1 (with Suprapur 65% HNO3). Non-acidified samples were de-voted to anion analyses and acidified ones to cation, Si and trace element analysis.For alkalinity determination, one PP flask (60 mL) was fully filled by non-filtered wa-ter. All PP flasks and filters were previously washed using acidified (Suprapur 65%HNO3) MilliQ water and rinsed with MilliQ water. All the reagents are analytical grade.25
The filtration unit was rinsed before each operation with MilliQ water and then sam-
4376
HESSD7, 4371–4409, 2010
Hydrochemistry(major and trace
elements) of LakeMalawi (Nyasa)
P. Branchu et al.
Title Page
Abstract Introduction
Conclusions References
Tables Figures
J I
J I
Back Close
Full Screen / Esc
Printer-friendly Version
Interactive Discussion
Discussion
Paper
|D
iscussionP
aper|
Discussion
Paper
|D
iscussionP
aper|
ple’s aliquot is flushed. All samples were stored at temperature <4 ◦C and sealed usingParafilm®. Non-refrigerated transport was restricted to a few days, water samples werestored at 4 ◦C at the CEREGE (Centre Europeen de Recherche et d’Enseignement enGeosciences de l’Environnement, Aix-en-Provence) prior to analysis.
2.2 Analytical methods5
Dissolved concentrations of major anions (Cl, F and SO4) and cations (K, Ca, Na andMg) were measured using capillary electrophoresis (CIA from Waters®). Calibrationsranged from 0.1 to 20 ppm for anions and 0.2 to 20 ppm for cations. Electrolyte wasChromate-OFM, pH 8, for anions and UV Cat2, pH 6, for cations. Alkalinity was deter-mined by potentiometric HCl titration with calculation of equivalent volume by the Gran10
method. Al and Fe concentrations were measured using Graphite Furnace Atomic Ab-sorption Spectrometry (GFAAS: Z8200 Hitachi®). Calibrations ranged from 2 to 40 ppbfor Al and 1 to 40 ppb for Fe. Si was measured with Inductively Coupled Plasma Opti-cal Emission Spectrometer (ICP-OES: JY 38 type III) in the 1–10 ppm range. All theseanalyses were performed at CEREGE. Concentrations of Cr (mass: 52), Mn (55), Ni15
(60), Cu (65), Zn (66), Sr (88), Mo (95), Cd (111), Ba (138) and Pb (208) were mea-sured in the 0.05–20 ppb range by Inductively Coupled Plasma-Mass Spectrometry(ICP-MS) on a Fisons Instrument® Plasma Quad PQ2+ at the Royal Museum for Cen-tral Africa (Tervuren, Belgium). An internal standard (In) was added to samples beforeanalysis to correct for sensitivity drift. Analytical standard deviations and, for ICP-MS,20
calculated detection limits and reproducibility (in the lower part of the calibration range)are reported in Table 1. To consider potential metal contamination during samplingand field processing, Hydrobios bottle blank analysis using MilliQ water has been per-formed at laboratory (Table 1). However, hydrobios bottle blank trace element analysesreveal potential contamination in Zn and Pb but in a lower range than measured con-25
centrations.
4377
HESSD7, 4371–4409, 2010
Hydrochemistry(major and trace
elements) of LakeMalawi (Nyasa)
P. Branchu et al.
Title Page
Abstract Introduction
Conclusions References
Tables Figures
J I
J I
Back Close
Full Screen / Esc
Printer-friendly Version
Interactive Discussion
Discussion
Paper
|D
iscussionP
aper|
Discussion
Paper
|D
iscussionP
aper|
CTD casts were performed in the north basin prior to sampling with a Sea-Bird SBE25 logger. Only temperature and electrical conductivity (expressed as reference con-ductivity, K25) are presented, dissolevd oxygen concentration was unfortunately notmeasured due to probe problems.
Thermodynamic computations discussed below were performed using MINTEQA25
equilibration speciation model and data set presented in Tables 2 and 3.
3 Results and interpretations
Water column and on land (rivers and hydrothermal springs) data are presented in Ta-bles 2 and 3 for major and trace elements, respectively. Lake Malawi major ions andgeneral physical-chemical features are presented with reference to previous limnolog-10
ical characterisations. To our knowledge this work provides the first minor and traceelements data set relative to Lake Malawi whereas previous contaminants studies weremainly focussed on organic pollutants in water and on metals in fish and sediments(Karlson et al., 2000; Kidd et al., 1999, 2003).
3.1 Lake water column data15
Temperature decreases from surface (25.4 ◦C) to 240 m (22.8 ◦C) with a main gradientbetween 70 and 90 m (Fig. 2a), whereas conductivity increases from 256.7 µS cm−1 atthe surface to 263.5 µS cm−1 at 240 m with three main gradients at about 50–60 m, 70–90 m and 190–210 m (Fig. 2b). Cl, Ca, Na, K, Mg and alkalinity concentrations (Table 2)are similar for the three profiles and display no significant changes with depth accord-20
ing to standard deviations SO4 values are highly variable without clear depth-relatedtrend. Si concentrations exhibit the same behaviour in the three profiles and increasesharply below 70 m (Table 2, Fig. 2c). Ionic budget indicates that no significant ion ismissing as the imbalance percentage is in the range of analytical standard deviation(Table 2). From these data an average weight salinity of 0.203±0.003‰ is calculated;25
4378
HESSD7, 4371–4409, 2010
Hydrochemistry(major and trace
elements) of LakeMalawi (Nyasa)
P. Branchu et al.
Title Page
Abstract Introduction
Conclusions References
Tables Figures
J I
J I
Back Close
Full Screen / Esc
Printer-friendly Version
Interactive Discussion
Discussion
Paper
|D
iscussionP
aper|
Discussion
Paper
|D
iscussionP
aper|
main contributors being carbonates (72%), Na (10%) followed by Mg (6%), Ca (6%), K(3%) and Cl (2%).
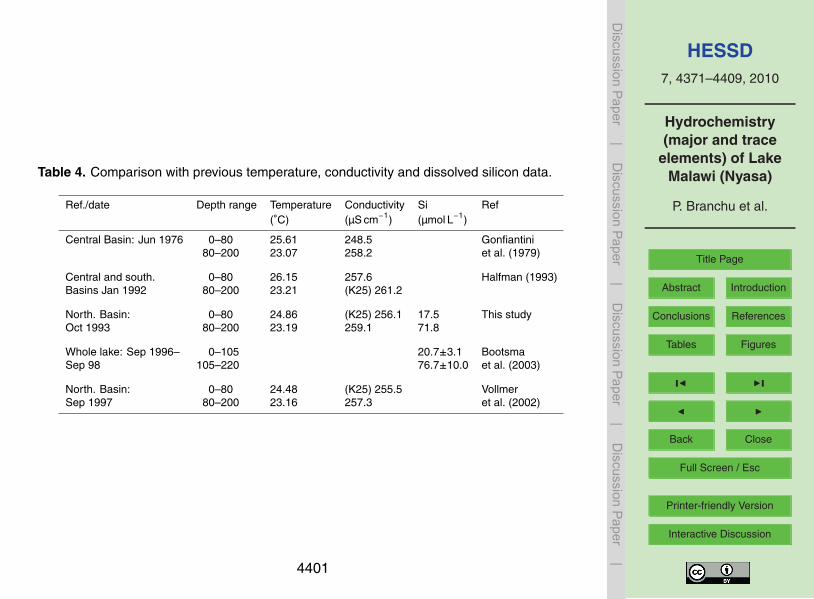
Presented temperature and conductivity data match well with seasonal pattern de-fined by Eccles (1974) and Gonfiantini et al. (1979) (Table 4) and, except for SO4; ma-jor ion concentrations are comparable for the same depth range with the ones reported5
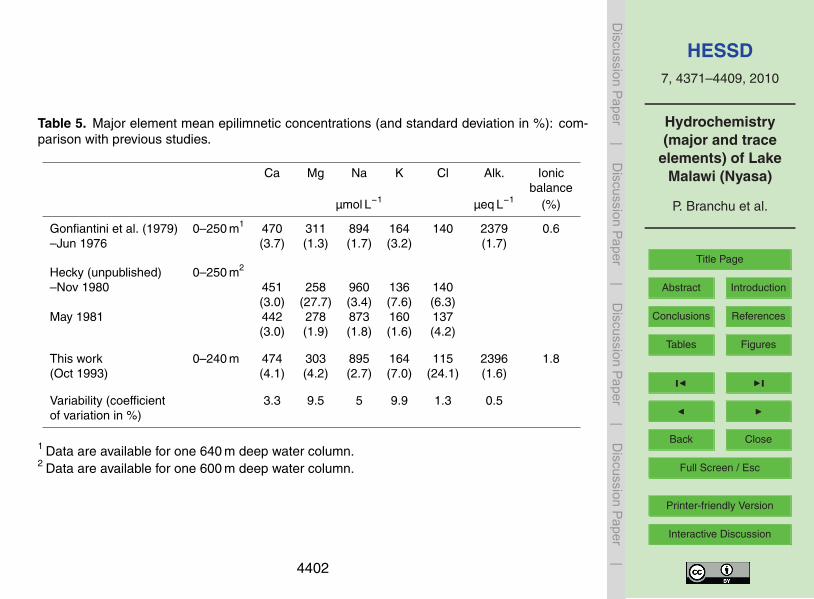
previously (Tables 4 and 5). Decrease in chloride concentrations between 1976 (Gon-fiantini et al., 1979), 1980–81 (Hecky, unpublished) are discussed elsewhere (Branchuet al., 2010). Surface temperature is colder at the end of the dry season (September–October) than at its beginning (June) and warmer during the raining one (January).Metalimnetic waters express also seasonality but mixing processes play an important10
role, mainly at the end of the dry season. The present salinity value for surface waterscomputed from major ion concentration (0–25 m) 0.203‰ matches well the 0.208‰,computed from Gonfiantini et al. data (1979). Similarity between 1976 and 1993 ioniccharacterisations can illustrate a relative steady state for major elements. Other pub-lished data (e.g., Talling and Talling, 1965) are not included in our comparison as they15
concern mainly surface waters and do not allow ionic balance computation.At the three stations several trace elements as Mn, Fe, Al, Ni, Pb, Cd, Ba and Sr
are enriched in surface water (0–10 m; Fig. 2d–f, Table 3). Deeper, Mn concentrations(Fig. 2d) are homogeneous, and then increase below 150–190 m whereas Fe (Fig. 2e),Ni and Pb profiles are homogeneous in the first 200 m and only increase for deepest20
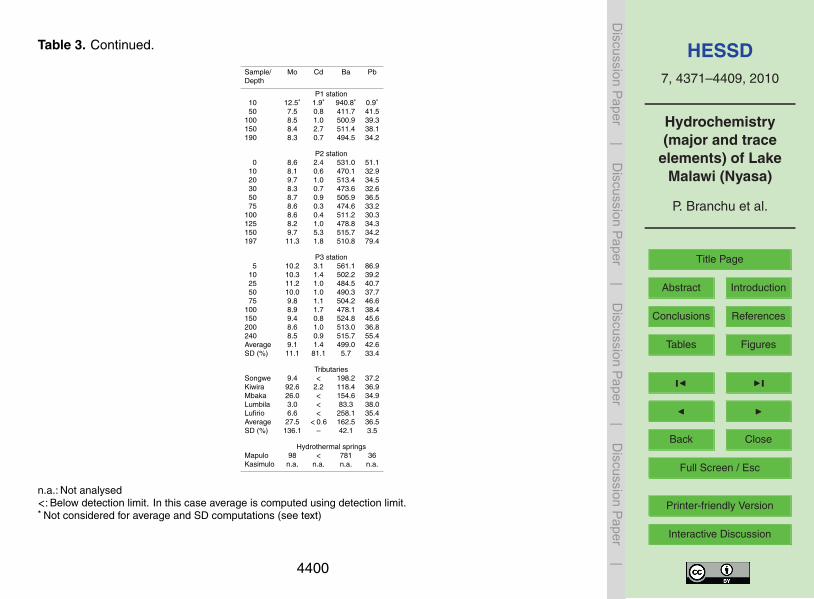
samples (197 and 240 m, for P2 and P3, respectively). Other elements as F, Cr, Cuand Mo are characterised by relatively homogeneous profiles. Data relative to minorand trace elements of surface point (10 m) in P1 station and relative to F at 5 m depthin P3 station are outliers that are not considered in average and standard deviationcomputations (Table 3).25
3.2 River water and hydrothermal spring data
There is no previous published data on the chemistry of Lake Malawi tributaries exceptfor Si (Bootsma et al., 2003).
4379
HESSD7, 4371–4409, 2010
Hydrochemistry(major and trace
elements) of LakeMalawi (Nyasa)
P. Branchu et al.
Title Page
Abstract Introduction
Conclusions References
Tables Figures
J I
J I
Back Close
Full Screen / Esc
Printer-friendly Version
Interactive Discussion
Discussion
Paper
|D
iscussionP
aper|
Discussion
Paper
|D
iscussionP
aper|
Lumbila River that drains the Livingstone fault top is much colder (19.5 ◦C) than otherrivers (27<T ◦C< 30) and also than epilimnetic waters. Rivers are diluted compared tolake waters except for Kiwira River. Their chemistry (Table 2) is dominated by carbon-ates and by Na (Kiwira and Mbaka Rivers), Na and Ca (Lufirio and Songwe Rivers)and Na, Ca and K (Lumbila River). Dissolved concentrations are scattered (i.e. stan-5
dard deviation >30%, largely above the analytical variability) for all major components,whereas dissolved Cr, Ni, Cu and Pb concentrations are similar (i.e. standard deviation<15%, Tables 2 and 3). The high K, Na, Si, Cl, SO4, F, Mo and Cd concentrations inthe Kiwira River explain most of this scattering. Highest Sr concentration occurs in theLufirio River. Cd and F concentrations are below the detection limit except for Kiwira10
River.Both hydrothermal spring waters have neutral pH, temperatures of about 60 ◦C and
homogenous major element concentrations (Tables 2 and 3) with high Na and HCO3contents. Ni and Cd concentrations are below the detection limit. In Giggenbach (1991)triangular diagrams, these waters lie in the carbonate corner and are considered im-15
mature (no chemical equilibrium). Major element chemistry matches well with previouscharacterisations (Harkin, 1960; Makundi and Kifua, 1985) whereas no data on traceelements were previously published.
Kiwira River singularity is associated to a hydrothermal influence (see hot springschemistry in Tables 2 and 3). Hydrothermal springs are indeed present in its water-20
shed with a flow that could reach about 1 m3 s−1 (James, 1959). Their contribution tothe lake chemistry is significant as the Kiwira River represents about 5% of the totalriver contributio to the lake (Bergonzini, 1998). Thermodynamic computation predictsa Ca, Mg, Sr and Ba carbonate precipitation from the spring that accounts for theirlow contribution to the Kiwira River. Such prediction is confirmed by occurrence of25
carbonate crusts in some hydrothermal fields (Pisarskii et al., 1998; Branchu et al.,2005b). Moreover Kiwira waters are in equilibrium with dolomite according to compu-tations. The rich Na-HCO3 hot springs (Table 2) could be associated to the presenceof a magma chamber at depth (Pisarskii et al., 1998; Branchu et al., 2005b).
4380
HESSD7, 4371–4409, 2010
Hydrochemistry(major and trace
elements) of LakeMalawi (Nyasa)
P. Branchu et al.
Title Page
Abstract Introduction
Conclusions References
Tables Figures
J I
J I
Back Close
Full Screen / Esc
Printer-friendly Version
Interactive Discussion
Discussion
Paper
|D
iscussionP
aper|
Discussion
Paper
|D
iscussionP
aper|
3.3 Indirect evidences of redox gradients
In absence of dissolved oxygen (DO) concentration measurements, serveral indirectevidences were used to propose a qualitative redox profile:
– an empirical mid column (150–250 m) relation, between the occurrence of a con-ductivity increase just at the zero DO concentration is defined using data from5
Gonfiantini et al. (1979), Halfman (1993) and Vollmer et al. (2002). Such a relationis common in meromictic systems (Taillefert et al., 2000). From this considerationP3 waters should be anoxic below 190 m depth (Fig 2b).
– In such meromictic lakes, redox disturbance during sampling and processingshould also be raised as they were performed under oxic conditions. Indeed10
for redox sensitive elements (such as Mn), with solubility depending of the oxi-dation state important artefacts may occur. At Lake Malawi pH (7.5–8.5), Mn(II)oxidation reaction and rate are complex and variable leading to half-life valuesspanning a large range (Wehrli, 1990; Davison, 1993). Due to rapid sample pro-cessing (few hours after sampling) Mn profiles may be used as qualitative data15
for the deeper, reductive layer. Then, the increase of dissolved Mn, below 190 m(Fig. 2d) illustrates the occurrence of a redox decrease.
Both indirect evidences, are in aggreement and allow to locate oxicline between 150and 190 m where waters become anoxic. This is depth is similar to the DO depthmeasuerd by Vollmer et al. (2002): 190 m.20
3.4 Water column physico-chemical structure
From the above results, a schematic view of bio-physico-chemical distribution withdepth corresponding to the end of the dry season is proposed using temperature,conductivity, dissolved Si and Mn concentration profiles (Fig. 3). Correlated Si andconductivity profiles (r=0.97 in the whole water column, Fig. 3) partly result from the25
4381
HESSD7, 4371–4409, 2010
Hydrochemistry(major and trace
elements) of LakeMalawi (Nyasa)
P. Branchu et al.
Title Page
Abstract Introduction
Conclusions References
Tables Figures
J I
J I
Back Close
Full Screen / Esc
Printer-friendly Version
Interactive Discussion
Discussion
Paper
|D
iscussionP
aper|
Discussion
Paper
|D
iscussionP
aper|
interaction between mixing (or stratification), biological (photosynthesis, remineralisa-tion) processes (Bootsma et al., 2003). Others processes such as sinking of dilutedriver waters (Hecky et al., 2003) or record of past evaporative conditions in deep wa-ters (Gonfiantini et al., 1979; Branchu et al., 2010) influence also Si and conductivityprofiles (cf. latter). As diatom primary production removes Si from the water in the eu-5
photic zone, the mixing seems effective above 75 m. Below this limit, correspondingto the thermocline and to a conductivity and density shift, slow mixing processes andbiological degradation predominate, releasing Si and others nutrients and increasingconductivity. In a relative poor ventilated system these processes theoretically leadto anoxia in depth. From qualitative considerations reported above oxycline coulb be10
located between 150 m and 190 m where anoxy occure.In Lake Malawi, the sequence of oxidants used during organic matter degradation
was previously reported, for O2 and NO3, (Bootsma and Hecky, 1993), the aboveschematic view complete this sequence with Mn. This sequence may be related toa Eh decrease with increasing depth from the top of the oxicline.15
In this physico-chemical structure, the dissolved concentrations of Ca and Mg arecorrelated (r=0.73) illustrating a solubility control by a carbonate phase as epilim-netic waters are slightly oversaturated with respect to calcite, dolomite and aragonite,whereas metalimnetic ones become undersaturated.
3.5 Trace element covariance20
All these biological-physical-chemical and hydrodynamical processes control water col-umn trace element profiles. Element similarity matrixes are usually used to identifytrace element carrier-phases and their reactivity (e.g., Balistrieri et al., 1994). Appliedto the whole water column of Lake Malawi (using Pearson’s correlation coefficient,n=23), dissolved Al concentrations are correlated with Ni, Cd and Pb (r=0.72; 0.79;25
0.74, respectively), suggesting their association in a particulate (or colloidal) phase sol-ubility control in the lake and/or in the watershed. Al is also correlated with Fe (r=0.64).Dissolved Al/Fe ratio in the water column, except for P2 and P3 deepest points, is the
4382
HESSD7, 4371–4409, 2010
Hydrochemistry(major and trace
elements) of LakeMalawi (Nyasa)
P. Branchu et al.
Title Page
Abstract Introduction
Conclusions References
Tables Figures
J I
J I
Back Close
Full Screen / Esc
Printer-friendly Version
Interactive Discussion
Discussion
Paper
|D
iscussionP
aper|
Discussion
Paper
|D
iscussionP
aper|
same than suspended matter (SM) Al/Fe measured in river Kiwira, Songwe, Mbaka andLumbila (Branchu, 2001) seems to be controlled by a particulate (or colloidal) Al-Fephase. Consistent with a Al/Fe>=1, the SM from tributaries are mainly clay minerals:kaolinite, illite and vermiculite types (Branchu et al., 2005a) that have high adsorptioncapacity (Drever, 1988). Submicron size clay minerals can be found in water samples5
even after filtration and are natural carrier of trace elements (Allard et al., 2002). Fe oxi-hydroxides should be associated as coatings with these clay minerals. The release ofFe under reducing conditions corresponds to an increase of Pb and Ni suggesting theirassociation with Fe oxi-hydroxides as previously observed in aquatic systems (Benoitet al., 1994; Balistrieri et al., 1994).10
Several elements show correlation but without depth related gradient. Sr and Baare well correlated (r=0.92) suggesting their control by a same phase. Cu, Cr andNi covary (r=1 and 0.75, between Cr and Cu and Cr and Ni, respectively) and theiraveraged relative ratio is the same in the water column (0–200 m) and in the tributaries,suggesting a direct watershed control. Due to redox This implies for metals having15
affinity with Mn and mainly Fe oxi-hydroxides a possible scavenging by these freshlyreactive surfaces (Sigg et al., 1987; Trivedi and Axe, 2001).
From this covariance analyse some phase associations are proposed but trace metalbehaviour is not assessed through the present data set. In future works a particularattention should be paid to suspensed matter characterization and to deeper water20
column sampling followed by sample processing in anoxic conditions.
3.6 Local processes
Local processes are superimposed over this general pattern. At P3, temperature andconductivity show indeed gradients within surface water (0–70 m): the upper layer(0–20 m) is warmer and with higher conductivity than the thermocline bound layer25
(Fig. 2a,b). Relative to the surface water the higher density (lower conductivity andtemperature) of Lumbila River enables it to sink in the water column down to the ther-mocline (Branchu et al., 2005b). A similar layer was identified during 1992 rainy sea-
4383
HESSD7, 4371–4409, 2010
Hydrochemistry(major and trace
elements) of LakeMalawi (Nyasa)
P. Branchu et al.
Title Page
Abstract Introduction
Conclusions References
Tables Figures
J I
J I
Back Close
Full Screen / Esc
Printer-friendly Version
Interactive Discussion
Discussion
Paper
|D
iscussionP
aper|
Discussion
Paper
|D
iscussionP
aper|
son in the southern part of Livingstone Basin near the Ruhuhu River mouth (Halfmanand Scholz, 1993). Lake surface waters (0–10 m) are also characterised by a metalenrichment (Mn, Fe, Al, Ni, Pb, Cd, Ba and Sr) at all stations. As tributaries waterconcetrations are lower for these elements than surface lake water one’s, they cannotcontribute significantly to this level except by interaction with their particulate load (clay5
minerals and other particles). Such enrichment can be associated, as for oceanic orother lakes, to atmospheric deposition and then to the elemental scavenging by set-tling particles (Stumm and Morgan, 1996). In tropical regions potential sources of suchdepositions are denuded soils and biomass burning from local or long-range area. Inlakes Malawi and Tanganyika watersheds, biomass burning mainly occurs during the10
dry season and has been proposed to partly explain N, S and P rain concentrations(Bootsma et al., 1996; Langenberg et al., 2003). However soil and wind influence alsoCa, Mg rain contents (Bootsma et al., 1996). In addition to this rainy influence, it islikely that biomass burning and wind over eroded soils should also influence dry depo-sitions, which is probably responsible of the lake surface enrichment. The homogeneity15
between and along the three profiles indicates comparable effects of the predominantprocesses that occur in North Lake Malawi.
3.7 Water quality assessment
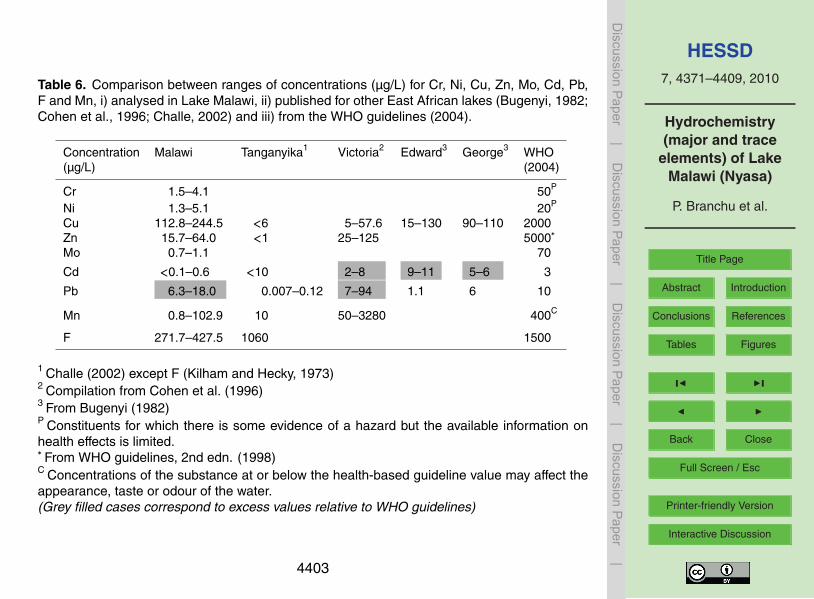
Finally, our data (lake and rivers) allow, for elements of health significance in drinkingwater (Cr, Ni, Cu, Mo, Cd, Pb, F and Mn) a water quality evaluation based on com-20
parison with World Health Organisation guidelines (WHO, 2004) and comparison withother East African lake data (Kilham and Hecky, 1973; Bugenyi, 1982; Cohen et al.,1996; Challe, 2002; Table 6). Globally, Lake Malawi and northern river concentra-tions are below WHO guidelines and the ones measured in regional lakes classifiedas contaminated (Cohen et al., 1996). However, Cu concentrations are high, in the25
same range than those measured in Lakes Edward and George contaminated by cop-per mines (Bugenyi, 1982). Lead in Lake Malawi is the only exception with extremevalues exceeding the guidelines (Table 6). Kiwira river fluoride concentration is higher
4384
HESSD7, 4371–4409, 2010
Hydrochemistry(major and trace
elements) of LakeMalawi (Nyasa)
P. Branchu et al.
Title Page
Abstract Introduction
Conclusions References
Tables Figures
J I
J I
Back Close
Full Screen / Esc
Printer-friendly Version
Interactive Discussion
Discussion
Paper
|D
iscussionP
aper|
Discussion
Paper
|D
iscussionP
aper|
than the WHO guideline resulting from the influence of hydrothermal springs in itswatershed (Branchu et al., 2005a). Presented data characterise an uncontaminatedsystem (lake and northern rivers) but enriched compared to the World Average River(Martin and Windom, 1991). In accordance with previously published data on heavymetals in aquatic food web and sediments (Kidd et al., 1999, 2003), Lake Malawi is an5
uncontaminated system from dissolved trace metal consideration whereas potentiallypolluting human activities are present in Malawi watershed. The sole anthropogenicprocess with visible impact evidenced from this study is the atmospheric inputs partlydue to biomass burning and to soil erosion.
4 Lake Malawi water and chemical budgets10
Lake Malawi chemical budget was firstly published by Hecky and Bugenyi (1992).Northern tributaries that have specific features (geological, hydrological, relief, . . . )have however been understimated in this budget. Recently we published an originalwater budget for Lake Malawi based on monthly data (recorded over several years) oftributary and outlet flows, evaporation and precipitation over water surface and on lake-15
level records (Branchu et al., 2010; Table 7). This northern area, including Songwe,Kiwira, Mbaka, Lumbila and Lufirio watersheds, covers about 9% of the total catch-ment area and drains the Rungwe volcanoes that culminate at about 3000 m a.s.l.. Thehigh relief, responsible of the highest precipitation rates of the whole catchment (morethan 2000 mm y−1 in the northern area compared to 1350 mm y−1 for mean lake water-20
shed), generates about 20% of total river inflow. In this budget, computed for steadystate conditions, inputs to the lake are equally distributed between direct precipitationand river inputs whereas outputs are dominated, at 83%, by direct evaporation. Waterresidence time is 99 years for the whole lake and 5 years for the epilimnion illustratingthe relative isolation of deep waters.25
Hydrochemical budget is computed using this water budget and chemical data fromBootsma et al. (1996, 2003) for rain and our water column data set completed for depth
4385
HESSD7, 4371–4409, 2010
Hydrochemistry(major and trace
elements) of LakeMalawi (Nyasa)
P. Branchu et al.
Title Page
Abstract Introduction
Conclusions References
Tables Figures
J I
J I
Back Close
Full Screen / Esc
Printer-friendly Version
Interactive Discussion
Discussion
Paper
|D
iscussionP
aper|
Discussion
Paper
|D
iscussionP
aper|
>250 m by Gonfiantini et al. (1976). Global River inflow to the Lake is computed us-ing present chemical data set completed with Hecky and Bugenyi (1992) river data set(additional 15% of lake global runoff and about 35% of the whole catchment) includ-ing rivers Linthipie, Bua, Dwangwa, Luweya, N. Rukuru, N. Rumphi and S. Rukuru.The 65% remaining river inflow, corresponding to about 35% of the catchment, that5
are not characterised from a physico-chemical consideration are globally associated tosteep area. An average composition, computed from similar characterised area, hasthen been attributed to this remaining catchment. Chemical steady state assumptionis required to compute this budget and constant chemical composition of waters arerequired. From Table 5, we can estimate a temporal (seasonal and interannual) vari-10
ability (expressed as coefficient of variation) of water column (0–250 m) compositionlower than 10% with higest variability for potassium and magnesium.
Seasonal and inter annual variations of river chemistry have also been consideredas Hecky and Bugenyi data correspond to the end of the rainy season whereas thepresent data characterise the end of the dry season. The importance of chemical and15
flow variability has been demonstrated in such environments but affects differently ma-jor elements (Vandelannoote et al., 1999; Hecky et al., 2003; Langenberg et al., 2003).For major elements (Ca, Na, Mg, K, Cl) the seasonal to interannual variability was as-sessed for Mbaka and Kiwira rivers by comparing data from October 1993, November2001 and March 2005 (Delalande, 2008). A mean temporal coefficient of variation of20
22% is computed. For Si (in its soluble reactive phase) it has been shown that concen-trations are stable throughout the year, a mean temporal coefficient of variation of 19%was computed (Bootsma et al., 2003).
For all elements the main input to the lake is from rivers (>75%). For all elements,except Si and Cl, the lake residence time (average ca. 520 years) about 5 times higher25
than for water, illustrates the relatively slow vertical excanges between surface anddeep waters. The long Cl residence time (ca. 1000 years) is linked to the high hypolim-netic Cl content of deep waters that was associated to record of past different climaticconditions (Gonfiantini et al., 1979). The whole lake higher residence time of alkalinity
4386
HESSD7, 4371–4409, 2010
Hydrochemistry(major and trace
elements) of LakeMalawi (Nyasa)
P. Branchu et al.
Title Page
Abstract Introduction
Conclusions References
Tables Figures
J I
J I
Back Close
Full Screen / Esc
Printer-friendly Version
Interactive Discussion
Discussion
Paper
|D
iscussionP
aper|
Discussion
Paper
|D
iscussionP
aper|
(Table 8) can be related to photosynthesic activity in epilimnetic waters and degrada-tion in deep waters. Moreover, the hypolimnetic alkalinity increase (Gonfiantini et al.,1979) is partly due to nutrient remineralisation associated with anaerobic degradationof organic matter. Other contribution for example for Si can be associated to sinking ofriver waters (Bootsma et al., 2003)5
5 Lake Malawi mean tributary concentration
In order to determine the mean tributary concentration two approaches are followed. Inthe first one, this concentration is directly computed from data used in the dydrochem-ical budget, using following Eq. (1)
[R]i =1/Q ·∑
(Qj · [Rj ]i ) (1)10
with: element i concentration (mol L−1) in: global catchment average tributary [R], indi-vidual tributaries [Rj ], water fluxes (L y−1): from tributaries Q, from individual tributariesQj (Q=
∑Qj ). [R]i concentrations are presented for Ca, Na, Mg, Cl, Alk, K and Si in
Table 8.The second approach for assessing global tributray concentration is based on an15
epilimnetic hydrochemical budget in steady state conditions (Eq. 2).
d[Ep]i/dt=0. (2)
This allows computing the dissolved chemistry of the global Catchment Average Tribu-tary (CAT), following Eq. (3) and assuming that for each element Lake chemical inputsare equal to Lake chemical outputs and that epilimnetic concentration is equal to out-20
flow concentration.
[CAT]i =1/Q× (Qem · ([Ep]i − [Met]i )+Qex× [Ep]i −P × [P ]i ) (3)
with: element i concentration (mol L−1) in: global catchment average tributary [CAT]i ,epilimnion [Ep]i , metalimnion [Met]i and precipitations [P]i , water fluxes (L y−1): from
4387
HESSD7, 4371–4409, 2010
Hydrochemistry(major and trace
elements) of LakeMalawi (Nyasa)
P. Branchu et al.
Title Page
Abstract Introduction
Conclusions References
Tables Figures
J I
J I
Back Close
Full Screen / Esc
Printer-friendly Version
Interactive Discussion
Discussion
Paper
|D
iscussionP
aper|
Discussion
Paper
|D
iscussionP
aper|
tributaries Q, from precipitations P , exchanged between epi- and metalimnion Qem andto outlet Qex.
Data used (in Eq. 2) are from i) Lake water budget and Lake vertical water fluxes(Table 7, from Bergonzini, 1998; Vollmer et al., 2002), ii) rain chemistry (Bootsma et al.,1996, 2003) and iii) present water column chemistry. This equation only considers5
dissolved fluxes but dissolved element fluxes induced by precipitation/dissolution ofparticulate phases (in the water column and in sediments) are also included in thiscomputation. Groundwater fluxes are not identified in this equation but are expressedthrough Q and [CAT]. Evaporative process that concentrates ions in the surface is alsointegrated in this computation. Then comparison between R and CAT can be used10
to illustrate elemental behaviour (reactive or conservative) in eplimnetic water. Onlysiking of river water from steep catchments is not taken into account. Differences arethen interprated in terms of reactivity of a disolevd element in epilimnetic waters.R and CAT values plotted in a Gibb’s diagram (Gibbs, 1970; Kilham, 1990) fall in
the central part of the boomerang shape (not shown) illustrating their control by rock15
weathering. Comparison between R and CAT is presented for major elements (Fig. 4).For Cl and K, similitude between computed concentrations (Eqs. 1 and 2) reinforcesthe steady state assumption and demonstrate the boxes model accuracy and data setvalidity. For Ca, Na and Mg CAT slightly underestimates (about 19%) the concentra-tion whereas for alkalinity it overestimates it slightly (21%). This variability is likely due20
to variability in data (flow and chemistry, see above). However Ca, Na and Mg havebeen previously involved in diagenetic processes (Hecky and Bugenyi, 1992) that couldremove then from the lake and store them in the sedimentary pool. Moreover a ther-modynamic computation suggests occurrence of a Ca, Mg carbonate controlling phase(cf. above). Occurrence of such phase in the water column is also consistent with the25
modern sediments of the lake where authigenic and biological calcites are present evenif they have a low contribution to the total particle fluxes (Pilskaln, 2004). As expected,Si is particular as R (Eq. 1) is 123 times higher than CAT (Eq. 2). Differences betweenboth computations are explained by the biological cycle. Si is largely removed from
4388
HESSD7, 4371–4409, 2010
Hydrochemistry(major and trace
elements) of LakeMalawi (Nyasa)
P. Branchu et al.
Title Page
Abstract Introduction
Conclusions References
Tables Figures
J I
J I
Back Close
Full Screen / Esc
Printer-friendly Version
Interactive Discussion
Discussion
Paper
|D
iscussionP
aper|
Discussion
Paper
|D
iscussionP
aper|
the euphotic zone in the epilimnion during diatom productivity and then from the lakeby sedimentation, whereas dissolution occurs in the meta- and hypo-limnion (Bootsmaet al., 2003; Pilskaln, 2004).
Major element (Si excepted) epilimnetic residence time is similar to the water one(about 4 years). Ca, Na, Mg, Cl, K and alkalinity epilimnetic waters are about 3.05
more concentrated than average input (R and CAT) which can be explained mainly byevaporation that concentrates inputs. Si is a nutrient with a high recycling rate, a shortresidence time and an input concentration 5.7 times more concentrated than eplimneticone.
Computation of a trace metal annual budget is unrealistic as inputs are only partly10
known for the northern tributaries and therefore remain poorly constrained. Steadystate computation (Eq. 2) of the CAT gives for all elements (except Mn) a concentrationabout 3 times higher than the epilimnetic measured one. The computation neglectsthe uncharacterised atmospheric input even if for some elements such fluxes may beimportant (see above). Mn is the only trace element showing a concentration gradient15
between epi- and meta-limnion. Input of dissolved Mn from the metalimnion, wheresinking particulate Mn is dissolved trough reduction, can explain the negative Mn con-centration computed for the average tributary (Eq. 2).
6 Lake chemistry control: the northern area specificity
The northern area is responsible of 57% of the total Na input by runoff to the lake and20
at least of 48% for Cl, 35% for alkalinity and from 28 to 31% for other major elementsillustrating the importance of this zone.
Northern tributary composition (Table 2) is compared to R. Specificity of the KiwiraRiver presented above is illustrated here with high Cl and Na contents and low Caand Mg contents. For major elements, except Cl that is in low concentration in sam-25
pled rivers, average concentration of northern river, Kiwira River excluded, exceeds bya factor 2 R i . General accordance between major element CAT and R (Fig. 4) allow to
4389
HESSD7, 4371–4409, 2010
Hydrochemistry(major and trace
elements) of LakeMalawi (Nyasa)
P. Branchu et al.
Title Page
Abstract Introduction
Conclusions References
Tables Figures
J I
J I
Back Close
Full Screen / Esc
Printer-friendly Version
Interactive Discussion
Discussion
Paper
|D
iscussionP
aper|
Discussion
Paper
|D
iscussionP
aper|
be confident on CAT computations to assess trace element tributary input to the Lake.Trace elements, except Al and Fe that are about 10 times more concentrated, are inaverage 2 more concentrated in the average northern river than in CAT.
Both approaches (Eqs. 1 and 2) are consistent and allow to characterise the globalriver concentration that is globally lower, particularly for K, alkalinity, Al, Fe, Cu, Pb,5
Cr and Ni, than in the northern rivers. The most likely explanation for this enrichmentfactor is the peculiarity of the northern watershed (Branchu et al., 2005b). All thefeatures (high relief, high precipitation rates) of this northern area, including a highermineral charge of northern rivers, characterise high weathering rates. The enrich-ments of local rocks relative to the “average” watershed (Precambrian granitic and10
metamorphic rocks) is assessed by comparing their major element composition (e.g.,Harkin, 1960) to the upper continental crust composition (UCC; Wedepohl, 1995) andfor trace elements a basaltic composition (Drever, 1988) has been compared to theUCC. Weathering of basic rocks could explain the relatively high alkalinity: rocks of thetrachyte-phonolite series accounting for the high K concentrations and the basalts for15
the enrichment in Cu, Cr, and Ni. The chemistry of the northern tributaries is then con-trolled by the high weathering rates of rocks of the Rungwe volcanic center; in additionfor the Kiwira River the hydrothermal signal superimposes on this bedrock signature.
7 Summary and conclusions
This is the first published report on minor and trace element water chemistry in Lake20
Malawi and one of the rare dealing with major element chemistry. Regional geol-ogy, weathering processes, evaporation, biological processes and hydrothermal ac-tivity mainly control Lake Malawi major, minor and trace element concentrations. Inthis context, the Rungwe volcanic rocks are an important source of element to the lake.Whereas sub-lacustrine hydrothermal input has not been observed, the influence of25
on-land spring is noticeable through the Kiwira River. We found no evidence of an-thropogenic contamination except some dry atmospheric deposition, probably linked
4390
HESSD7, 4371–4409, 2010
Hydrochemistry(major and trace
elements) of LakeMalawi (Nyasa)
P. Branchu et al.
Title Page
Abstract Introduction
Conclusions References
Tables Figures
J I
J I
Back Close
Full Screen / Esc
Printer-friendly Version
Interactive Discussion
Discussion
Paper
|D
iscussionP
aper|
Discussion
Paper
|D
iscussionP
aper|
to biomass burning and soil erosion, that influences the surface layer concentrationsfor several trace metals (Mn, Fe, Al, Ni, Zn, Pb, Cd, Ba, Sr). The water column physico-chemistry presents the usual features reported for stratified lakes: a Si and conductivityincrease below the thermocline and a Mn enrichment in the suboxic-anoxic waters. Bi-ological scheme of organic matter production-degradation and slow mixing processes5
dominate these features. At local scale temperature and conductivity in surface layerare also influenced by river inputs. Behaviour of trace metal is not discussed but co-variance between elements could be indicative of phase association. Carbonates couldindeed control Ca and Mg concentrations. Some trace elements (Zn, Pb, Ni) could beassociated to Fe and Mn hydroxides whereas most of them do not show particular trend10
with depth. This study is a new contribution to the knowledge of this unique ecosystemand large reservoir of freshwater and food. Nevertheless the complete comprehensionand modelling of such aquatic system require more data.
A detailed investigation of the water column around thermocline will permit to precisespatial extension of sinking river layer; in the same way a detailed investigation around15
oxicline would allow to precise i) oxidant sequence linked to organic matter degradation,ii) nature of the “turbid layer” occurring at or just above the depth of DO disappearance.
Future work should include the effect of spatial and temporal variability on the geo-chemical parameters, an exhaustive characterisation of the inputs into the lake system(rivers, wet and dry depositions), a characterisation of the dissolved and particulate20
phases. While Lake Malawi in regard to analysed elements, is a non contaminatedwater body, this status is relative as it was recently shown that due to inertia of thehydrochemical system, the present-day non-contamination of lake waters does notimply a systematic non-pollution of tributaries (Bootsma and Hecky, 1993; Branchuet al., 2005a). Computations of chronic contamination response, using simple 3-boxes25
model, indicate that once pollution is detected, it will be persistent for a long timedepending on the element reactivity. This reactivity linked to liquid-solid reactions isassociated to biological and physico-chemical processes described here. A globalwatershed monitoring program should then be organised in the near future. Mon-
4391
HESSD7, 4371–4409, 2010
Hydrochemistry(major and trace
elements) of LakeMalawi (Nyasa)
P. Branchu et al.
Title Page
Abstract Introduction
Conclusions References
Tables Figures
J I
J I
Back Close
Full Screen / Esc
Printer-friendly Version
Interactive Discussion
Discussion
Paper
|D
iscussionP
aper|
Discussion
Paper
|D
iscussionP
aper|
itored parameters should be relevant with metallic and organic pollutants and alsoeuthrophication.
References
Allard, T., Ponthieu, M., Weber, T., Filizola, N., Guyot, J.-L., and Benedetti, M. F.: Nature andproperties of suspended solids in the Amazon Basin, B. Soc. Geol. Fr., 173, 67–75, 2002.5
Balistrieri, L. S., Murray, J. W., and Paul, B.: The geochemical cycling of trace metals in a bio-genic meromictic lake, Geochim. Cosmochim. Ac., 58, 3993–4008, 1994.
Benoit, G., Oktay-Marshall, S. D., Cantu, A., Hood, E. M., Coleman, C. H., Corapcioglu, M. O.,and Santschi, P. H.: Partitioning of Cu, Pb, Ag, Zn, Fe, Al, and Mn between filter-retainedparticles, colloids, and solution in six Texas estuaries, Mar. Chem., 45, 307–336, 1994.10
Bergonzini, L.: Bilans hydriques de lacs (Kivu, Tanganyika, Rukwa and Nyassa) du Rift Est-Africain, Annales-sciences geologiques. Publ. no. 103. Mus. Roy. Afr. Centr., Tervuren, Bel-gique, 183 pp., 1998.
Bootsma, H. A. and Hecky, R. E.: Conservation of the African Great Lakes: a limnologicalperspective, Conserv. Biol., 7, 644–656, 1993.15
Bootsma, H. A., Bootsma, M. J., and Hecky, R. E.: The chemical composition of precipitationand its significance to the nutrient budget of Lake Malawi, in: The Limnology, Climatologyand Palaeoclimatology of the East African Lakes, edited by: Johnson, T. C. and Odada, E. O.,Gordon and Breach Publ., Amsterdam, The Netherland, 241–250, 1996.
Bootsma, H. A., Hecky, R. E., Johnson, T. C., Kling, H. J., and Mwita, A. J.: Inputs, outputs and20
internal cycling of silica in a large, tropical lake, J. Great Lakes Res., 29 (sup. 2), 121–138,2003.
Branchu, P.: Cycle des elements majeurs et traces dans les grands lacs de rift tropicaux (LacsTanganyika et Malawi), Processus et enregistrements biogochimiques, Annales-sciencesgeologiques, Publ. no. 106, Mus. Roy. Afr. Centr., Tervuren, Belgique, 374 pp., 2001.25
Branchu, P., Bergonzini, L., Benedetti, M. F., Ambrosi, J. P., and Klerkx, J.: Sensibilite a la pol-lution metallique de deux grands lacs africains (Tanganyika et Malawi), Revue des Sciencesde l’Eau, 18 (Hors-serie), 161–180, 2005a.
Branchu, P., Bergonzini, L., Delvaux, De Batist, D. M., Golubev, V., Benedetti, M., and Klerkx, J.:
4392
HESSD7, 4371–4409, 2010
Hydrochemistry(major and trace
elements) of LakeMalawi (Nyasa)
P. Branchu et al.
Title Page
Abstract Introduction
Conclusions References
Tables Figures
J I
J I
Back Close
Full Screen / Esc
Printer-friendly Version
Interactive Discussion
Discussion
Paper
|D
iscussionP
aper|
Discussion
Paper
|D
iscussionP
aper|
Tectonic, climatic and hydrothermal control on sedimentation and water chemistry of North-ern Lake Malawi (Nyasa), Tanzania, J. Afr. Earth Sci., 43(4), 433–446, 2005b.
Branchu, P., Bergonzini, L., Pons-Branchu, E., Violier, E., Dittrich, M., Massault, M., andGhaleb, B.: Intensification of Lake Malawi stratification since the end of the Little Ice Age:evidence from sediment and pore-water chemistry, Global Planet. Change, in press, 2010.5
Bugenyi, F. W. B.: Copper pollution studies in lakes George and Edward, Uganda: the distribu-tion of Cu, Cd and Fe in the water and sediments, Environ. Pollut. B, 3, 129–138, 1982.
Calder, I. R., Hall, R. L., Bastable, H. G., et al.: The impact of land use change on waterresources in Sub-Saharan Africa: a modelling study of Lake Malawi, J. Hydrol., 170, 123–135, 1995.10
Challe, F. M. M.: Trace metal concentrations in water, sediments and fish tissue from LakeTanganyika, Sci. Total Environ., 299, 115–121, 2002.
Cohen, A. S., Kaufman, L., and Ogutu-Ohwayo, R.: Anthropogenic threats, impacts and con-servation strategies in the African great lakes: a review, in: The Limnology, Climatology andPalaeoclimatology of the East African Lakes, edited by: Johnson, T. C. and Odada, E. O.,15
Gordon and Breach Publ., 575–624, Amsterdam, 1996.Cohen, A. S., Palacios-Fest, M., McGill, J., et al.: Paleolimnological investigations of anthro-
pogenic environmental change in Lake Tanganyika: I. An introduction to the project, J. Pale-olimnol., 34, 1–18, 2005.
Davison, W.: Iron and manganese in lakes, Earth-Sci. Rev., 34, 119–163, 1993.20
Delalande, M.: Hydrologie et geochimie isotopique du Lac Masoko et des lacs volcaniques dela province active du Rungwe (Sud-Ouest Tanzanie), Ph. D. thesis, Universite d’Orsay-ParisXI, France, 2008.
Drever, J. I.: The Geochemistry of Natural Waters, 2nd edn., Prentice-Hall, Englewood Cliffs,437 pp., 1988.25
Eccles, D. H.: An outline of the physical limnology of Lake Malawi (Lake Nyassa), Limnol.Oceanogr., 19, 730–742, 1974.
Gibbs, R. J.: Mechanisms controlling world water chemistry, Science, 170, 1088–l090, 1970.Giggenbach, W. F.: Chemical techniques in geothermal exploration, in: Applications of Geo-
chemistry in Geothermal Reservoir Development, edited by: D’Amore, F. (coordinator), UNI-30
TAR/UNDP publication, Rome, 1991.Gonfiantini, R., Zuppi, G. M., Eccles, D. H., and Ferro, W.: Isotope investigation of Lake Malawi,
in: Isotopes in Lake Studies, IAEA, Vienna, 195–207, 1979.
4393
HESSD7, 4371–4409, 2010
Hydrochemistry(major and trace
elements) of LakeMalawi (Nyasa)
P. Branchu et al.
Title Page
Abstract Introduction
Conclusions References
Tables Figures
J I
J I
Back Close
Full Screen / Esc
Printer-friendly Version
Interactive Discussion
Discussion
Paper
|D
iscussionP
aper|
Discussion
Paper
|D
iscussionP
aper|
Halfman, J. D.: Water column characteristics from modern CTD data, Lake Malawi, Africa,J. Great Lakes Res., 19, 512–520, 1993.
Halfman, J. D. and Schloz, C. A.: Suspended sediments in Lake Malawi, Africa: a reconnais-sance study, J. Great Lakes Res., 19, 499–511, 1993.
Hamblin, P. F., Bootsma, H. A., and Hecky, R. E.: Modeling nutrient upwelling in Lake5
Malawi/Nyasa, J. Great Lakes Res., 29 (sup. 2), 34–47, 2003.Harkin, D. A.: The Rungwe Volcanics at the northern end of Lake Nyasa, Geological Survey of
Tanganyika, Memoir, 2, 1–172, 1960.Hecky, R. E. and Bugenyi, F. W. B.: Hydrology and chemistry of the African Great Lakes and
water quality issues: problems and solutions, Mitteilung Internationale Vereinigung fur The-10
oretische und Angewandte Limnologie, 23, 45-54, 1992.Hecky, R. E., Bootsma, H. A., and Kingdon, M. L.: Impact of land use on sediment and nutriment
yields to Lake Malawi/Nyasa (Africa), J. Great Lakes Res., 29 (sup. 2), 139–158, 2003.Ikingura, J. R., Akagi, H., Mujumba, J., et al.: Environmental assessment of mercury disper-
sion, transformation and bioavailability in the Lake Victoria goldfields, Tanzania, J. Environ.15
Manage., 81, 167–173, 2006.James, T. C.: Carbon dioxide-bearing hot springs in the Songwe River Valley, Mbeya district,
Records of the Geological Survey of Tanganyika, 3, 73–77, 1959.Karlson, H., Muir, D. C. G., Teixiera, C. F., Burniston, D. A., Strachan, W. M. J., Hecky, R. E.,
Mwita, J., Bootsma, H. A., Grift, N. P., Kidd, K. A. and Rosenberg, B.: Persistent chlori-20
nated pesticides in air, water, and precipitation from the Lake Malawi area, Southern Africa,Environ. Sci. Technol., 34, 4490–4495, 2000.
Kidd, K. A., Lockhart, L., Wilkinson, P., and Muir, D. C. G.: Metals, pesticides and other persis-tent contaminants in water, sediments and biota from Lake Malawi/Nyasa, in: Water QualityReport, edited by: Bootsma, H. A. and Hecky, R. E., Lake Malawi/Nyasa Biodiversity Con-25
servation Project, Senga Bay, Malawi, 243–286, 1999.Kidd, K. A., Bootsma, H. A., Hesslein, R. H., Lockhart, W. L., and Hecky, R. E.: Mercury
concentrations in the food web of Lake Malawi, East Africa, J. Great Lakes Res., 29 (sup. 2),258–266, 2003.
Kilham, P. and Hecky, R. E.: Fluoride. Geochemical and ecological significance in East African30
waters and sediments, Limnol. Oceanogr., 18, 932–945, 1973.Kilham, P.: Mechanisms controlling the chemical composition of lakes and rivers: data from
Africa, Limnol. Oceanogr., 35, 80–83, 1990.
4394
HESSD7, 4371–4409, 2010
Hydrochemistry(major and trace
elements) of LakeMalawi (Nyasa)
P. Branchu et al.
Title Page
Abstract Introduction
Conclusions References
Tables Figures
J I
J I
Back Close
Full Screen / Esc
Printer-friendly Version
Interactive Discussion
Discussion
Paper
|D
iscussionP
aper|
Discussion
Paper
|D
iscussionP
aper|
Kishe, M. A. and Machiwa, J. F.: Distribution of heavy metals in sediments of Mwanza Gulf ofLake Victoria, Tanzania, Environ. Int., 28, 619–625, 2003.
Langenberg, V. T., Nyamushahu, S., Roijackers, R., and Koelmans, A. A.: External nutrientsources for Lake Tanganyika, J. Great Lakes Res., 29 (sup. 2), 169–180, 2003.
Machiwa, P. K.: Water quality management and sustainability: the experience of Lake Victoria5
Environmental Management Project (LVEMP)-Tanzania, Phys. Chem. Earth, 28, 1111–1115,2003.
Makundi, J. S. and Kifua, G. M.: Geothermal features of the Mbeya prospect in Tanzania,Geoth. Res. T., 9, 451–454, 1985.
Martin, J. M. and Windom, H. L.: Present and future roles of ocean margins in regulating10
marine biogeochemical cycles of trace elements, in: Ocean Margin Processes in GlobalChange, edited by: Mantoura, R. F. C., Martin, J. M., and Wollast, R., John Wiley & Sons,Chichester, 45–67, 1991.
O’Reilly, C. M., Alin, S., Plisner, P.-D., Cohen, A., and McKee, B. A.: Climate change decreasesaquatic ecosystem productivity of Lake Tanganyika, Africa, Nature, 424, 766–768, 2003.15
Pilskaln, C. H.: Seasonal and interannual particle export in an African Rift Valley lake: a 5-yearrecord from Lake Malawi, Southern East Africa, Limnol. Oceanogr., 49, 964–977, 2004.
Pisarskii, B. A., Konev, A. A., Levi, K. G., et al.: Carbon dioxide-bearing alkaline hydrothermsand strontium-bearing travertines in the Songwe River Valley (Tanzania), Russ. Geol. Geo-phys.+, 39, 7, 941–948, 1998.20
Population Reference Bureau: World population, Datasheet of the Population Reference Bu-reau, http://www.prb.org/DataFinder.aspx, 2009.
Ramlal, P. S., Bugenyi, F. W. B., Kling, G. W., Nriagu, J. O., Rudd, J. W. M., and Campbell, L. M.:Mercury concentrations in water, sediment, and biota from Lake Victoria, East Africa, J. GreatLakes Res., 29 (sup. 2), 283–291, 2003.25
Sigg, L., Sturm, M., and Kistler, D.: Vertical transport of heavy metals by settling particles inLake Zurich, Limnol. Oceanogr., 32, 112–130, 1987.
Stumm, W. and Morgan, J. J. (Eds.): Aquatic Chemistry. An Introduction Emphasizing ChemicalEquilibria in Natural Waters, 2nd edn., John Willey & Sons, New York, 1022 pp., 1996.
Taillefert, M., Lienemann, C. P., Gaillard, J. F., and Perret, D.: Speciation, reactivity, and cycling30
of Fe and Pb in a meromictic lake, Geochim. Cosmochim. Ac., 64, 169–183, 2000.Talling, J. F. and Talling, I. B.: The chemical composition of African Lake waters, Internationale
Revue der gesamten. Hydrobiologie, 50, 421–463, 1965.
4395
HESSD7, 4371–4409, 2010
Hydrochemistry(major and trace
elements) of LakeMalawi (Nyasa)
P. Branchu et al.
Title Page
Abstract Introduction
Conclusions References
Tables Figures
J I
J I
Back Close
Full Screen / Esc
Printer-friendly Version
Interactive Discussion
Discussion
Paper
|D
iscussionP
aper|
Discussion
Paper
|D
iscussionP
aper|
Trivedi, P. and Axe, L.: Predicting metal sorption to hydrous Al, Fe and Mn oxides, Environ. Sci.Technol., 35, 1779–1784, 2001.
UNEP/IETC: Planning and management of lakes and reservoirs: an integrated approach to eu-trophication, 12, http://www.unep.or.jp/ietc/publications/techpublications/techpub-11/index,last access: 30 June 2010, 2000.5
Vandelannoote, A., Deelstra, H., and Ollevier, F.: The inflow of the Rusizi River to Lake Tan-ganyika, Hydrobiologia, 407, 65–73, 1999.
Verburg, P., Hecky, R. E., and Kling, H.: Ecological consequences of a century of warming inLake Tanganyika, Science, 301, 505–507, 2003.
Vollmer, M. K., Weiss, R. F., and Bootsma, H. A.: Ventilation of Lake Malawi/Nyasa, in: The10
East African Great Lakes: Limnology, Paleolimnology and Biodiversity, Advances in GlobalChange Research, edited by: Odada, E. O. and Ollago, D. O., Kluwer Publishers, 209–233,2002.
Vollmer, M. K., Bootsma, H. A., Hecky, R. E., et al.: Deep-water warming trend in Lake Malawi,East Africa, Limnol. Oceanogr., 50(2), 727–732, 2005.15
Wedepohl, K. H.: The composition of the continental crust, Geochim. Cosmochim. Ac., 59,1217–1232, 1995.
Wehrli, B.: Redox reactions of metal ions at mineral surfaces, in: Offprints from Aquatic Chem-ical Kinetics, edited by: Stumm, W., John Wiley & Sons, New York, USA, 311–336, 1990.
WHO: Guidelines for drinking-water quality, vol. 1: recommendations, 3rd edn., World Health20
Organization, http://www.who.int/watersanitationhealth/dwq/gdwq3/en, last acess: 30 June2010, 2004.
25
4396
HESSD7, 4371–4409, 2010
Hydrochemistry(major and trace
elements) of LakeMalawi (Nyasa)
P. Branchu et al.
Title Page
Abstract Introduction
Conclusions References
Tables Figures
J I
J I
Back Close
Full Screen / Esc
Printer-friendly Version
Interactive Discussion
Discussion
Paper
|D
iscussionP
aper|
Discussion
Paper
|D
iscussionP
aper|
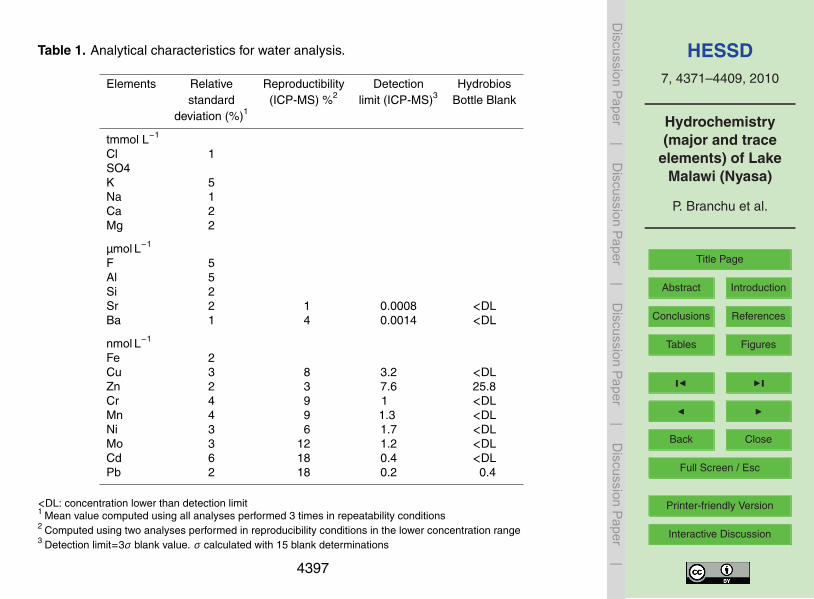
Table 1. Analytical characteristics for water analysis.
Elements Relative Reproductibility Detection Hydrobiosstandard (ICP-MS) %2 limit (ICP-MS)3 Bottle Blank
deviation (%)1
tmmol L−1
Cl 1SO4K 5Na 1Ca 2Mg 2
µmol L−1
F 5Al 5Si 2Sr 2 1 0.0008 <DLBa 1 4 0.0014 <DL
nmol L−1
Fe 2Cu 3 8 3.2 <DLZn 2 3 7.6 25.8Cr 4 9 1 <DLMn 4 9 1.3 <DLNi 3 6 1.7 <DLMo 3 12 1.2 <DLCd 6 18 0.4 <DLPb 2 18 0.2 0.4
<DL: concentration lower than detection limit1 Mean value computed using all analyses performed 3 times in repeatability conditions2 Computed using two analyses performed in reproducibility conditions in the lower concentration range3 Detection limit=3σ blank value. σ calculated with 15 blank determinations
4397
HESSD7, 4371–4409, 2010
Hydrochemistry(major and trace
elements) of LakeMalawi (Nyasa)
P. Branchu et al.
Title Page
Abstract Introduction
Conclusions References
Tables Figures
J I
J I
Back Close
Full Screen / Esc
Printer-friendly Version
Interactive Discussion
Discussion
Paper
|D
iscussionP
aper|
Discussion
Paper
|D
iscussionP
aper|
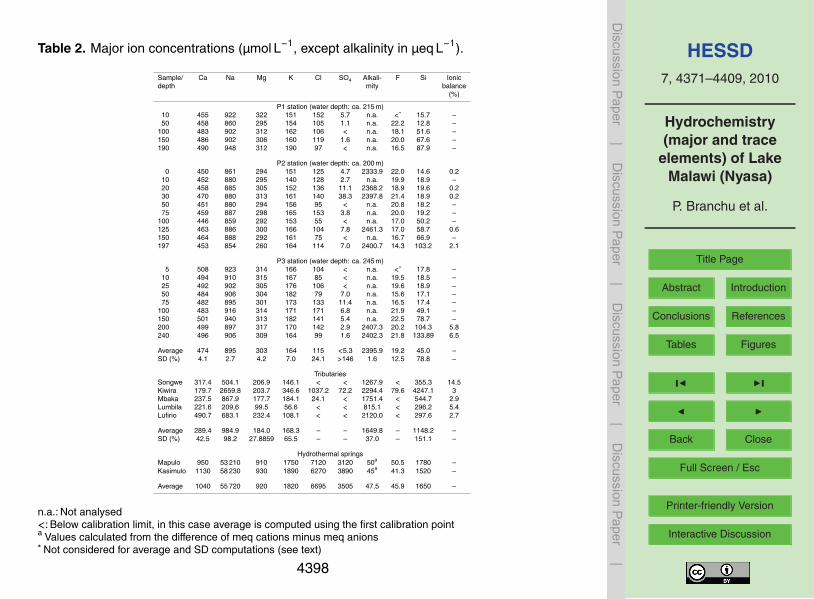
Table 2. Major ion concentrations (µmol L−1, except alkalinity in µeq L−1).
Sample/ Ca Na Mg K Cl SO4 Alkali- F Si Ionicdepth mity balance
(%)
P1 station (water depth: ca. 215 m)10 455 922 322 151 152 5.7 n.a. <∗ 15.7 –50 458 860 295 154 105 1.1 n.a. 22.2 12.8 –
100 483 902 312 162 106 < n.a. 18.1 51.6 –150 486 902 306 160 119 1.6 n.a. 20.0 67.6 –190 490 948 312 190 97 < n.a. 16.5 87.9 –
P2 station (water depth: ca. 200 m)0 450 861 294 151 125 4.7 2333.9 22.0 14.6 0.2
10 452 880 295 140 128 2.7 n.a. 19.9 18.9 –20 458 885 305 152 136 11.1 2368.2 18.9 19.6 0.230 470 880 313 161 140 38.3 2397.8 21.4 18.9 0.250 451 880 294 156 95 < n.a. 20.8 18.2 –75 459 887 298 165 153 3.8 n.a. 20.0 19.2 –
100 446 859 292 153 55 < n.a. 17.0 50.2 –125 463 886 300 166 104 7.8 2461.3 17.0 58.7 0.6150 464 888 292 161 75 < n.a. 16.7 66.9 –197 453 854 260 164 114 7.0 2400.7 14.3 103.2 2.1
P3 station (water depth: ca. 245 m)5 508 923 314 166 104 < n.a. <∗ 17.8 –
10 494 910 315 167 85 < n.a. 19.5 18.5 –25 492 902 305 176 106 < n.a. 19.6 18.9 –50 484 906 304 182 79 7.0 n.a. 15.6 17.1 –75 482 895 301 173 133 11.4 n.a. 16.5 17.4 –
100 483 916 314 171 171 6.8 n.a. 21.9 49.1 –150 501 940 313 182 141 5.4 n.a. 22.5 78.7 –200 499 897 317 170 142 2.9 2407.3 20.2 104.3 5.8240 496 906 309 164 99 1.6 2402.3 21.8 133.89 6.5
Average 474 895 303 164 115 <5.3 2395.9 19.2 45.0 –SD (%) 4.1 2.7 4.2 7.0 24.1 >146 1.6 12.5 78.8 –
TributariesSongwe 317.4 504.1 206.9 146.1 < < 1267.9 < 355.3 14.5Kiwira 179.7 2659.8 203.7 346.6 1037.2 72.2 2294.4 79.6 4247.1 3Mbaka 237.5 867.9 177.7 184.1 24.1 < 1751.4 < 544.7 2.9Lumbila 221.6 209.6 99.5 56.6 < < 815.1 < 296.2 5.4Lufirio 490.7 683.1 232.4 108.1 < < 2120.0 < 297.6 2.7
Average 289.4 984.9 184.0 168.3 – – 1649.8 – 1148.2 –SD (%) 42.5 98.2 27.8859 65.5 – – 37.0 – 151.1 –
Hydrothermal springsMapulo 950 53 210 910 1750 7120 3120 50a 50.5 1780 –Kasimulo 1130 58 230 930 1890 6270 3890 45a 41.3 1520 –
Average 1040 55 720 920 1820 6695 3505 47.5 45.9 1650 –
n.a.: Not analysed<: Below calibration limit, in this case average is computed using the first calibration pointa Values calculated from the difference of meq cations minus meq anions∗ Not considered for average and SD computations (see text)
4398
HESSD7, 4371–4409, 2010
Hydrochemistry(major and trace
elements) of LakeMalawi (Nyasa)
P. Branchu et al.
Title Page
Abstract Introduction
Conclusions References
Tables Figures
J I
J I
Back Close
Full Screen / Esc
Printer-friendly Version
Interactive Discussion
Discussion
Paper
|D
iscussionP
aper|
Discussion
Paper
|D
iscussionP
aper|
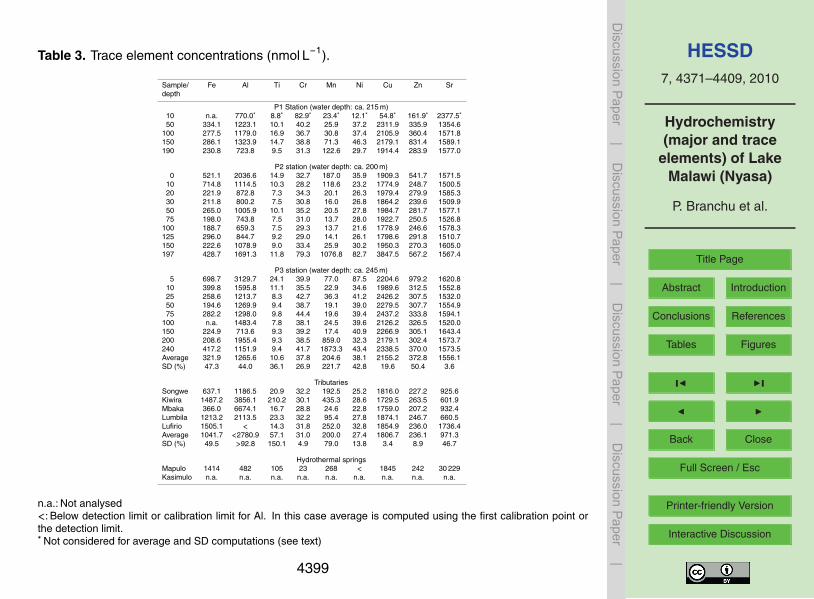
Table 3. Trace element concentrations (nmol L−1).
Sample/ Fe Al Ti Cr Mn Ni Cu Zn Srdepth
P1 Station (water depth: ca. 215 m)10 n.a. 770.0∗ 8.8∗ 82.9∗ 23.4∗ 12.1∗ 54.8∗ 161.9∗ 2377.5∗
50 334.1 1223.1 10.1 40.2 25.9 37.2 2311.9 335.9 1354.6100 277.5 1179.0 16.9 36.7 30.8 37.4 2105.9 360.4 1571.8150 286.1 1323.9 14.7 38.8 71.3 46.3 2179.1 831.4 1589.1190 230.8 723.8 9.5 31.3 122.6 29.7 1914.4 283.9 1577.0
P2 station (water depth: ca. 200 m)0 521.1 2036.6 14.9 32.7 187.0 35.9 1909.3 541.7 1571.5
10 714.8 1114.5 10.3 28.2 118.6 23.2 1774.9 248.7 1500.520 221.9 872.8 7.3 34.3 20.1 26.3 1979.4 279.9 1585.330 211.8 800.2 7.5 30.8 16.0 26.8 1864.2 239.6 1509.950 265.0 1005.9 10.1 35.2 20.5 27.8 1984.7 281.7 1577.175 198.0 743.8 7.5 31.0 13.7 28.0 1922.7 250.5 1526.8
100 188.7 659.3 7.5 29.3 13.7 21.6 1778.9 246.6 1578.3125 296.0 844.7 9.2 29.0 14.1 26.1 1798.6 291.8 1510.7150 222.6 1078.9 9.0 33.4 25.9 30.2 1950.3 270.3 1605.0197 428.7 1691.3 11.8 79.3 1076.8 82.7 3847.5 567.2 1567.4
P3 station (water depth: ca. 245 m)5 698.7 3129.7 24.1 39.9 77.0 87.5 2204.6 979.2 1620.8
10 399.8 1595.8 11.1 35.5 22.9 34.6 1989.6 312.5 1552.825 258.6 1213.7 8.3 42.7 36.3 41.2 2426.2 307.5 1532.050 194.6 1269.9 9.4 38.7 19.1 39.0 2279.5 307.7 1554.975 282.2 1298.0 9.8 44.4 19.6 39.4 2437.2 333.8 1594.1
100 n.a. 1483.4 7.8 38.1 24.5 39.6 2126.2 326.5 1520.0150 224.9 713.6 9.3 39.2 17.4 40.9 2266.9 305.1 1643.4200 208.6 1955.4 9.3 38.5 859.0 32.3 2179.1 302.4 1573.7240 417.2 1151.9 9.4 41.7 1873.3 43.4 2338.5 370.0 1573.5Average 321.9 1265.6 10.6 37.8 204.6 38.1 2155.2 372.8 1556.1SD (%) 47.3 44.0 36.1 26.9 221.7 42.8 19.6 50.4 3.6
TributariesSongwe 637.1 1186.5 20.9 32.2 192.5 25.2 1816.0 227.2 925.6Kiwira 1487.2 3856.1 210.2 30.1 435.3 28.6 1729.5 263.5 601.9Mbaka 366.0 6674.1 16.7 28.8 24.6 22.8 1759.0 207.2 932.4Lumbila 1213.2 2113.5 23.3 32.2 95.4 27.8 1874.1 246.7 660.5Lufirio 1505.1 < 14.3 31.8 252.0 32.8 1854.9 236.0 1736.4Average 1041.7 <2780.9 57.1 31.0 200.0 27.4 1806.7 236.1 971.3SD (%) 49.5 >92.8 150.1 4.9 79.0 13.8 3.4 8.9 46.7
Hydrothermal springsMapulo 1414 482 105 23 268 < 1845 242 30 229Kasimulo n.a. n.a. n.a. n.a. n.a. n.a. n.a. n.a. n.a.
n.a.: Not analysed<: Below detection limit or calibration limit for Al. In this case average is computed using the first calibration point orthe detection limit.∗ Not considered for average and SD computations (see text)
4399
HESSD7, 4371–4409, 2010
Hydrochemistry(major and trace
elements) of LakeMalawi (Nyasa)
P. Branchu et al.
Title Page
Abstract Introduction
Conclusions References
Tables Figures
J I
J I
Back Close
Full Screen / Esc
Printer-friendly Version
Interactive Discussion
Discussion
Paper
|D
iscussionP
aper|
Discussion
Paper
|D
iscussionP
aper|
Table 3. Continued.
Sample/ Mo Cd Ba PbDepth
P1 station10 12.5∗ 1.9∗ 940.8∗ 0.9∗
50 7.5 0.8 411.7 41.5100 8.5 1.0 500.9 39.3150 8.4 2.7 511.4 38.1190 8.3 0.7 494.5 34.2
P2 station0 8.6 2.4 531.0 51.1
10 8.1 0.6 470.1 32.920 9.7 1.0 513.4 34.530 8.3 0.7 473.6 32.650 8.7 0.9 505.9 36.575 8.6 0.3 474.6 33.2
100 8.6 0.4 511.2 30.3125 8.2 1.0 478.8 34.3150 9.7 5.3 515.7 34.2197 11.3 1.8 510.8 79.4
P3 station5 10.2 3.1 561.1 86.9
10 10.3 1.4 502.2 39.225 11.2 1.0 484.5 40.750 10.0 1.0 490.3 37.775 9.8 1.1 504.2 46.6
100 8.9 1.7 478.1 38.4150 9.4 0.8 524.8 45.6200 8.6 1.0 513.0 36.8240 8.5 0.9 515.7 55.4Average 9.1 1.4 499.0 42.6SD (%) 11.1 81.1 5.7 33.4
TributariesSongwe 9.4 < 198.2 37.2Kiwira 92.6 2.2 118.4 36.9Mbaka 26.0 < 154.6 34.9Lumbila 3.0 < 83.3 38.0Lufirio 6.6 < 258.1 35.4Average 27.5 <0.6 162.5 36.5SD (%) 136.1 – 42.1 3.5
Hydrothermal springsMapulo 98 < 781 36Kasimulo n.a. n.a. n.a. n.a.
n.a.: Not analysed<: Below detection limit. In this case average is computed using detection limit.∗ Not considered for average and SD computations (see text)
4400
HESSD7, 4371–4409, 2010
Hydrochemistry(major and trace
elements) of LakeMalawi (Nyasa)
P. Branchu et al.
Title Page
Abstract Introduction
Conclusions References
Tables Figures
J I
J I
Back Close
Full Screen / Esc
Printer-friendly Version
Interactive Discussion
Discussion
Paper
|D
iscussionP
aper|
Discussion
Paper
|D
iscussionP
aper|
Table 4. Comparison with previous temperature, conductivity and dissolved silicon data.
Ref./date Depth range Temperature Conductivity Si Ref(◦C) (µS cm−1) (µmol L−1)
Central Basin: Jun 1976 0–80 25.61 248.5 Gonfiantini80–200 23.07 258.2 et al. (1979)
Central and south. 0–80 26.15 257.6 Halfman (1993)Basins Jan 1992 80–200 23.21 (K25) 261.2
North. Basin: 0–80 24.86 (K25) 256.1 17.5 This studyOct 1993 80–200 23.19 259.1 71.8
Whole lake: Sep 1996– 0–105 20.7±3.1 BootsmaSep 98 105–220 76.7±10.0 et al. (2003)
North. Basin: 0–80 24.48 (K25) 255.5 VollmerSep 1997 80–200 23.16 257.3 et al. (2002)
4401
HESSD7, 4371–4409, 2010
Hydrochemistry(major and trace
elements) of LakeMalawi (Nyasa)
P. Branchu et al.
Title Page
Abstract Introduction
Conclusions References
Tables Figures
J I
J I
Back Close
Full Screen / Esc
Printer-friendly Version
Interactive Discussion
Discussion
Paper
|D
iscussionP
aper|
Discussion
Paper
|D
iscussionP
aper|
Table 5. Major element mean epilimnetic concentrations (and standard deviation in %): com-parison with previous studies.
Ca Mg Na K Cl Alk. Ionicbalance
µmol L−1 µeq L−1 (%)
Gonfiantini et al. (1979) 0–250 m1 470 311 894 164 140 2379 0.6–Jun 1976 (3.7) (1.3) (1.7) (3.2) (1.7)
Hecky (unpublished) 0–250 m2
–Nov 1980 451 258 960 136 140(3.0) (27.7) (3.4) (7.6) (6.3)
May 1981 442 278 873 160 137(3.0) (1.9) (1.8) (1.6) (4.2)
This work 0–240 m 474 303 895 164 115 2396 1.8(Oct 1993) (4.1) (4.2) (2.7) (7.0) (24.1) (1.6)
Variability (coefficient 3.3 9.5 5 9.9 1.3 0.5of variation in %)
1 Data are available for one 640 m deep water column.2 Data are available for one 600 m deep water column.
4402
HESSD7, 4371–4409, 2010
Hydrochemistry(major and trace
elements) of LakeMalawi (Nyasa)
P. Branchu et al.
Title Page
Abstract Introduction
Conclusions References
Tables Figures
J I
J I
Back Close
Full Screen / Esc
Printer-friendly Version
Interactive Discussion
Discussion
Paper
|D
iscussionP
aper|
Discussion
Paper
|D
iscussionP
aper|
Table 6. Comparison between ranges of concentrations (µg/L) for Cr, Ni, Cu, Zn, Mo, Cd, Pb,F and Mn, i) analysed in Lake Malawi, ii) published for other East African lakes (Bugenyi, 1982;Cohen et al., 1996; Challe, 2002) and iii) from the WHO guidelines (2004).
Concentration Malawi Tanganyika1 Victoria2 Edward3 George3 WHO(µg/L) (2004)
Cr 1.5–4.1 50P
Ni 1.3–5.1 20P
Cu 112.8–244.5 <6 5–57.6 15–130 90–110 2000Zn 15.7–64.0 <1 25–125 5000∗
Mo 0.7–1.1 70
Cd <0.1–0.6 <10 2–8 9–11 5–6 3
Pb 6.3–18.0 0.007–0.12 7–94 1.1 6 10
Mn 0.8–102.9 10 50–3280 400C
F 271.7–427.5 1060 1500
1 Challe (2002) except F (Kilham and Hecky, 1973)2 Compilation from Cohen et al. (1996)3 From Bugenyi (1982)P Constituents for which there is some evidence of a hazard but the available information onhealth effects is limited.∗ From WHO guidelines, 2nd edn. (1998)C Concentrations of the substance at or below the health-based guideline value may affect theappearance, taste or odour of the water.(Grey filled cases correspond to excess values relative to WHO guidelines)
4403
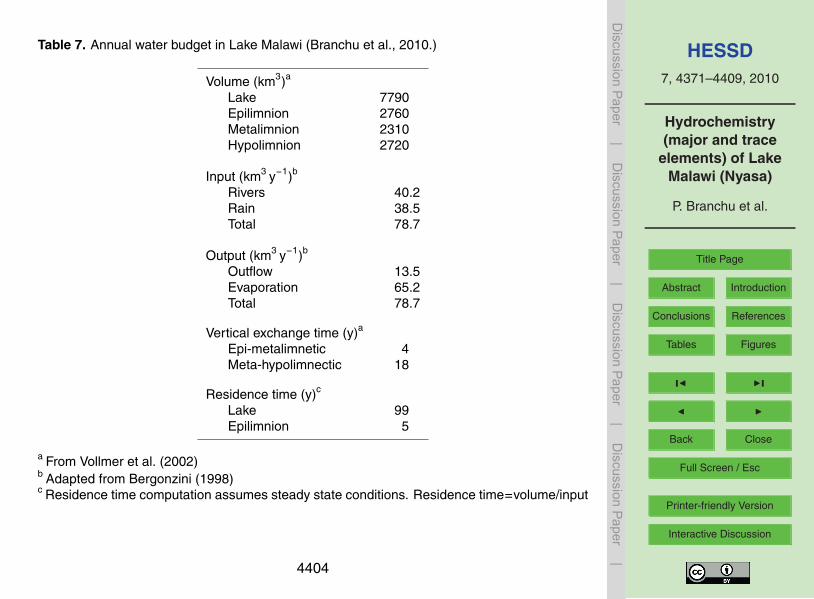
HESSD7, 4371–4409, 2010
Hydrochemistry(major and trace
elements) of LakeMalawi (Nyasa)
P. Branchu et al.
Title Page
Abstract Introduction
Conclusions References
Tables Figures
J I
J I
Back Close
Full Screen / Esc
Printer-friendly Version
Interactive Discussion
Discussion
Paper
|D
iscussionP
aper|
Discussion
Paper
|D
iscussionP
aper|
Table 7. Annual water budget in Lake Malawi (Branchu et al., 2010.)
Volume (km3)a
Lake 7790Epilimnion 2760Metalimnion 2310Hypolimnion 2720
Input (km3 y−1)b
Rivers 40.2Rain 38.5Total 78.7
Output (km3 y−1)b
Outflow 13.5Evaporation 65.2Total 78.7
Vertical exchange time (y)a
Epi-metalimnetic 4Meta-hypolimnectic 18
Residence time (y)c
Lake 99Epilimnion 5
a From Vollmer et al. (2002)b Adapted from Bergonzini (1998)c Residence time computation assumes steady state conditions. Residence time=volume/input
4404
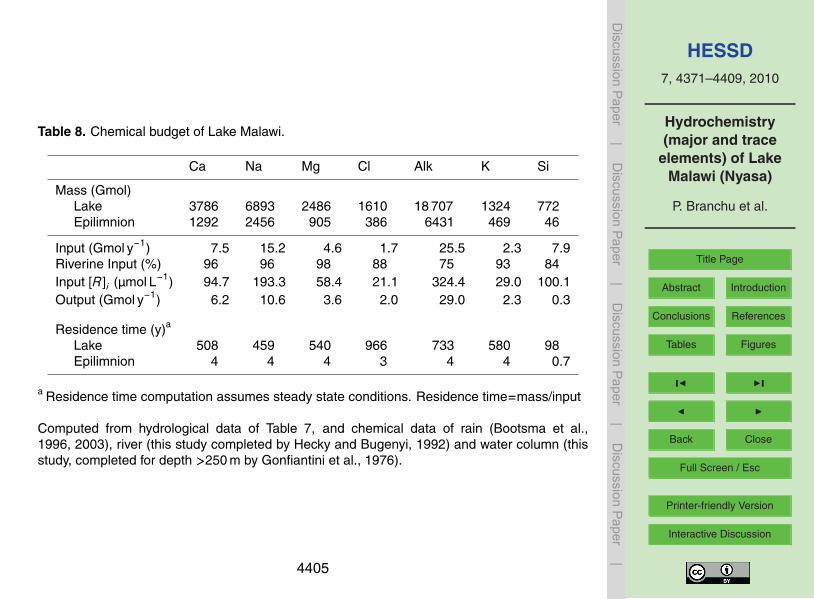
HESSD7, 4371–4409, 2010
Hydrochemistry(major and trace
elements) of LakeMalawi (Nyasa)
P. Branchu et al.
Title Page
Abstract Introduction
Conclusions References
Tables Figures
J I
J I
Back Close
Full Screen / Esc
Printer-friendly Version
Interactive Discussion
Discussion
Paper
|D
iscussionP
aper|
Discussion
Paper
|D
iscussionP
aper|
Table 8. Chemical budget of Lake Malawi.
Ca Na Mg Cl Alk K Si
Mass (Gmol)Lake 3786 6893 2486 1610 18 707 1324 772Epilimnion 1292 2456 905 386 6431 469 46
Input (Gmol y−1) 7.5 15.2 4.6 1.7 25.5 2.3 7.9Riverine Input (%) 96 96 98 88 75 93 84Input [R]i (µmol L−1) 94.7 193.3 58.4 21.1 324.4 29.0 100.1Output (Gmol y−1) 6.2 10.6 3.6 2.0 29.0 2.3 0.3
Residence time (y)a
Lake 508 459 540 966 733 580 98Epilimnion 4 4 4 3 4 4 0.7
a Residence time computation assumes steady state conditions. Residence time=mass/input
Computed from hydrological data of Table 7, and chemical data of rain (Bootsma et al.,1996, 2003), river (this study completed by Hecky and Bugenyi, 1992) and water column (thisstudy, completed for depth >250 m by Gonfiantini et al., 1976).
4405
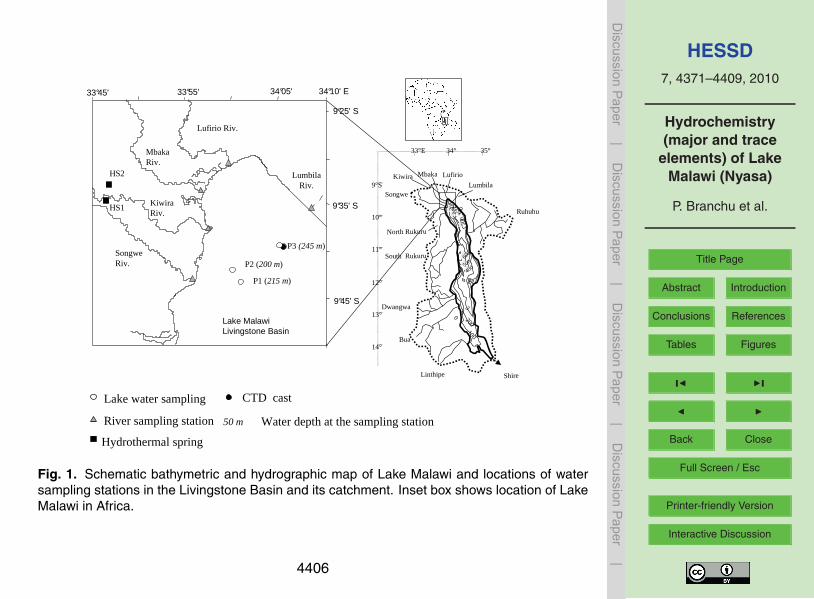
HESSD7, 4371–4409, 2010
Hydrochemistry(major and trace
elements) of LakeMalawi (Nyasa)
P. Branchu et al.
Title Page
Abstract Introduction
Conclusions References
Tables Figures
J I
J I
Back Close
Full Screen / Esc
Printer-friendly Version
Interactive Discussion
Discussion
Paper
|D
iscussionP
aper|
Discussion
Paper
|D
iscussionP
aper|
31
Figure 1: Schematic bathymetric and hydrographic map of Lake Malawi and locations of
water sampling stations in the Livingstone basin and its catchment. Inset box shows location
of Lake Malawi in Africa.
9°25' S
33°55' 34°05'
9°35' S
9°45' S
Lake MalawiLivingstone Basin
34°10' E
SongweRiv.
MbakaRiv.
KiwiraRiv.
LumbilaRiv.
33°45'
Lufirio Riv.
P1 (215 m)
P2 (200 m)
P3 (245 m)
HS2
HS1
Shire
Ruhuhu
Lumbila
LufirioMbakaKiwira
Songwe
North Rukuru
South Rukuru
Dwangwa
Bua
Linthipe
100200
30
0
400
300
500
600
500
400
200
9°S
33°E 34° 35°
10°
11°
12°
13°
14°
River sampling station
Lake water sampling
Hydrothermal spring
CTD cast
50 m Water depth at the sampling station
Fig. 1. Schematic bathymetric and hydrographic map of Lake Malawi and locations of watersampling stations in the Livingstone Basin and its catchment. Inset box shows location of LakeMalawi in Africa.
4406
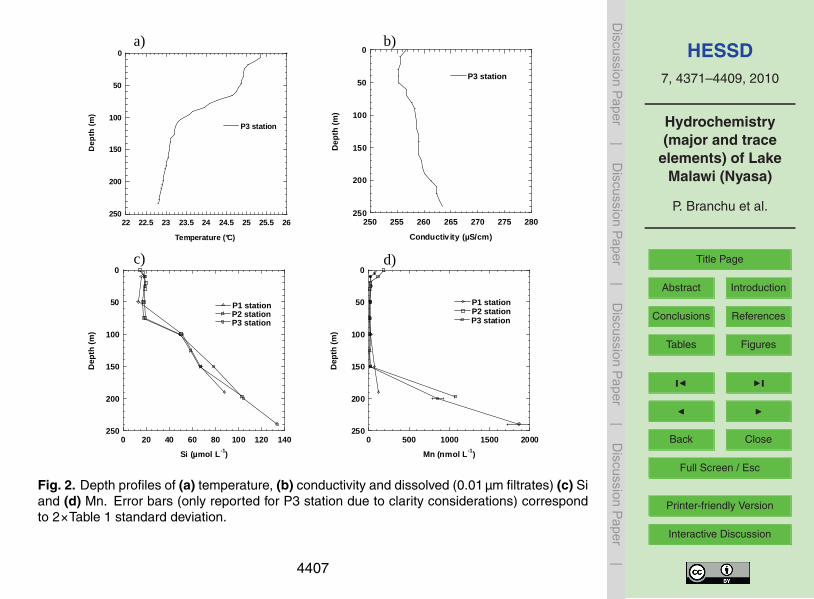
HESSD7, 4371–4409, 2010
Hydrochemistry(major and trace
elements) of LakeMalawi (Nyasa)
P. Branchu et al.
Title Page
Abstract Introduction
Conclusions References
Tables Figures
J I
J I
Back Close
Full Screen / Esc
Printer-friendly Version
Interactive Discussion
Discussion
Paper
|D
iscussionP
aper|
Discussion
Paper
|D
iscussionP
aper|
32
Figure 2: Depth profiles of (a) temperature, (b) conductivity and dissolved (0.01 µm filtrates)
(c) Si and (d) Mn concentration. Error bars (only reported for P3 station due to clarity
considerations), correspond to 2 x table 1 standard deviation.
22 22.5 23 23.5 24 24.5 25 25.5 26
0
50
100
150
200
250
P3 station
Temperature (°C)
Dep
th (
m)
250 255 260 265 270 275 280
0
50
100
150
200
250
P3 station
Conductiv ity (µS/cm)
Dep
th (
m)
0 20 40 60 80 100 120 140
0
50
100
150
200
250
P2 stationP3 station
P1 station
Si (µmol L -1)
Dep
th (
m)
0 500 1000 1500 2000
0
50
100
150
200
250
P2 stationP3 station
P1 station
Mn (nmol L -1)
Dep
th (
m)
a) b)
c) d)
Fig. 2. Depth profiles of (a) temperature, (b) conductivity and dissolved (0.01 µm filtrates) (c) Siand (d) Mn. Error bars (only reported for P3 station due to clarity considerations) correspondto 2×Table 1 standard deviation.
4407
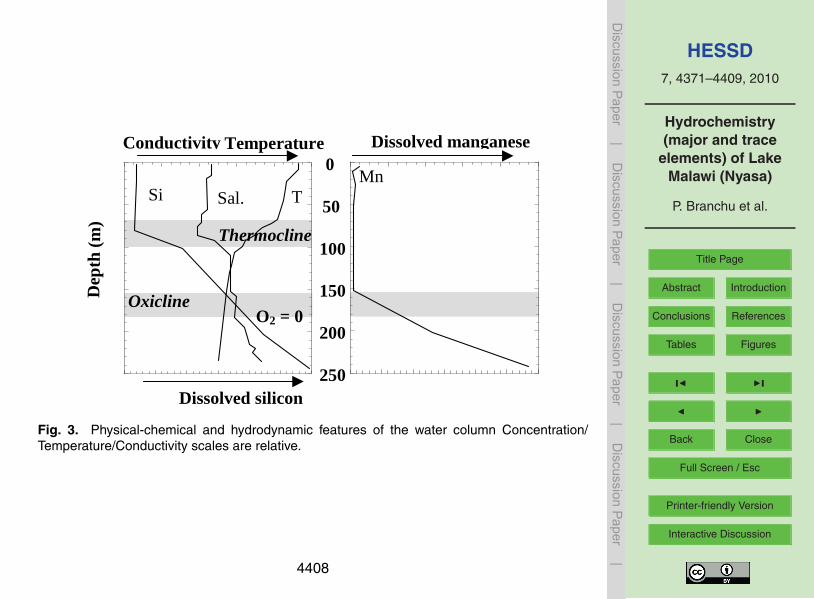
HESSD7, 4371–4409, 2010
Hydrochemistry(major and trace
elements) of LakeMalawi (Nyasa)
P. Branchu et al.
Title Page
Abstract Introduction
Conclusions References
Tables Figures
J I
J I
Back Close
Full Screen / Esc
Printer-friendly Version
Interactive Discussion
Discussion
Paper
|D
iscussionP
aper|
Discussion
Paper
|D
iscussionP
aper|
33
Figure 3: Physical-chemical and hydrodynamic features of the water column
Concentration/Temperature/Conductivity scales are relative.
0
50
100
150
200
250
Temperature Conductivity
Dissolved silicon
Dissolved manganese
T Sal . Si Mn
Thermocline
Oxicline Dep
th (
m)
O2 = 0
Fig. 3. Physical-chemical and hydrodynamic features of the water column Concentration/Temperature/Conductivity scales are relative.
4408
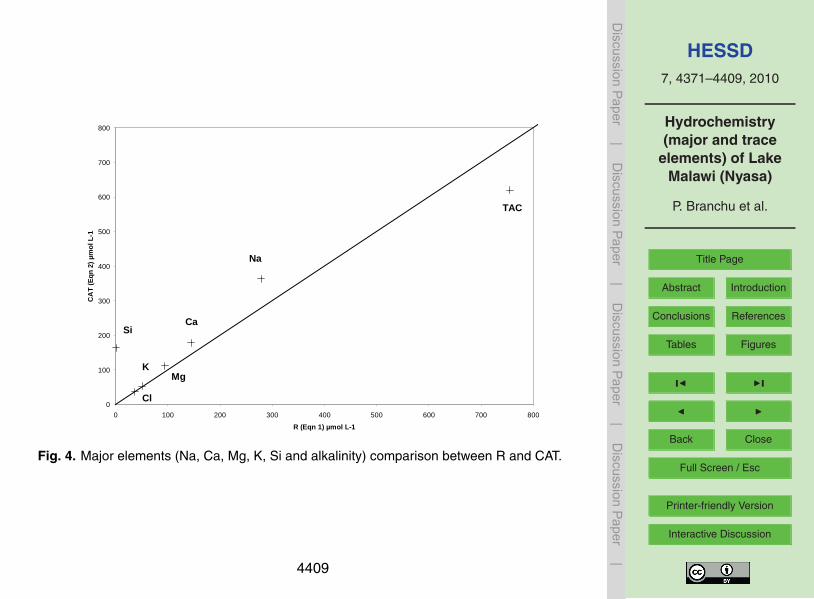
HESSD7, 4371–4409, 2010
Hydrochemistry(major and trace
elements) of LakeMalawi (Nyasa)
P. Branchu et al.
Title Page
Abstract Introduction
Conclusions References
Tables Figures
J I
J I
Back Close
Full Screen / Esc
Printer-friendly Version
Interactive Discussion
Discussion
Paper
|D
iscussionP
aper|
Discussion
Paper
|D
iscussionP
aper|
34
Figure 4: Major elements (Na, Ca, Mg, K, Si and alkalinity) comparison between R and CAT.
0
100
200
300
400
500
600
700
800
0 100 200 300 400 500 600 700 800
R (Eqn 1) µmol L-1
CA
T (
Eqn
2)
µmol
L-1
TAC
Na
Ca
Mg
Si
K
Cl
Fig. 4. Major elements (Na, Ca, Mg, K, Si and alkalinity) comparison between R and CAT.
4409