Embed Size (px)
Citation preview
HYDROCLIMATIC EXTREMES AS CHALLENGES FOR THE WATER MANAGEMENT COMMUNITY:
LESSONS FROM OROVILLE DAM AND HURRICANE HARVEY
Julie A. VAno, MichAel D. Dettinger, rob cifelli, DAViD curtis, Alexis Dufour, KAthleen Miller, J. rolf olsen, AnD AnnA M. Wilson
AFFILIATIONS: VAno AnD Miller—NCAR, Boulder, Colorado; Dettinger—U.S. Geological Survey, Water Cycle Branch, Carson City, Nevada; cifelli—NOAA/ESRL/Physical Sciences Division, Boulder, Colorado; curtis—WEST Consultants, Folsom, California; Dufour—San Francisco Public Utilities Commission, Water Enterprise, San Francisco, California; olsen—Institute for Water Resources, U.S. Army Corps of Engineers, Alexandria, Virginia; Wilson—Center for Western Weather and Water Extremes, Scripps Institution of Oceanography, University of California, San Diego, La Jolla, CaliforniaCORRESPONDING AUTHOR: Julie A. Vano, [email protected]
DOI:10.1175/BAMS-D-18-0219.1
© 2018 American Meteorological SocietyFor information regarding reuse of this content and general copyright information, consult the AMS Copyright Policy.
PROBLEM STATEMENT. Record-breaking ex-treme storms were a hallmark of 2017 in the United States. An extremely wet winter on the West Coast and brutally damaging hurricane season in the U.S. Southeast and the Caribbean challenged communities and power-, water- and flood-management systems in ways that raised climate change concerns. Among the most severe were two periods of heavy precipitation and high runoff that exposed dangerous weaknesses in water management infrastructure and land use practices in California and Texas. In California, a record-breaking string of atmospheric river landfalls and remarkably wet winter conditions came close to causing a catastrophic failure of the emergency spillway at Oroville Dam (France et al. 2018; Abbott 2018; White et al. 2019) and less publicized concerns elsewhere (Holland et al. 2018; CNRFC 2017). In Texas, near record-doubling rainfall accumulations from Hurricane Harvey led to massive f looding (Blake and Zelinsky 2018) and dam safety challenges in Houston (Wax-Thibodeaux et al. 2017). We use these events as examples to ground the concept that attribution studies, with careful management-focused framing, can help water management better navigate such unprecedented extremes.
As members of the AMS Water Resources Com-mittee, we and our contacts include government and academic researchers, and consulting and municipal engineers. We approached this topic by leveraging our collective experiences and expertise regarding the hydroclimatology, meteorology, and hydrology of these events and others like them. We reviewed post-assessment and media reports and had conversa-tions with managers who worked to reduce risks and damages during these events. In this essay, we briefly describe each event, highlighting concerns water managers confronted, and then list some lessons those experiences offered about framing attribution studies to serve management needs.
CASE STUDY: OROVILLE DAM AND NEW DON PEDRO INCIDENTS. On 12 February 2017, the structural integrity of the main and emer-gency spillways at the Oroville Dam (the tallest dam in the United States) was compromised, prompting an evacuation of nearly 200,000 people in northern California. Although not headlining national news, other California reservoirs were facing similar chal-lenges, including controlled flooding downstream of New Don Pedro Reservoir on the Tuolumne River. Events that led to these incidents involved both hydro-climatic extremes and water management decisions (CNRFC 2017; White et al. 2019), the details of which provide insights into how attribution studies can help water managers.
The series of events that led to Oroville’s evacuation began with unusual warmth in October–December 2016, which resulted in high snowlines where larger than normal areas of the upstream catchment received rainfall rather than snowfall. For water managers, this early season snow drought (snowpack in the Sierra Nevada was well below normal by 1 January) was particularly concerning following the extremely dry and snow-poor conditions of the previous five years. Snow droughts confront water managers with a tension between maintaining empty space for f lood-man-agement purposes and desire to capture early-season
S1DECEMBER 2018AMERICAN METEOROLOGICAL SOCIETY |
streamflows since limited snow-fed runoff is less likely to meet warm-season water demands.
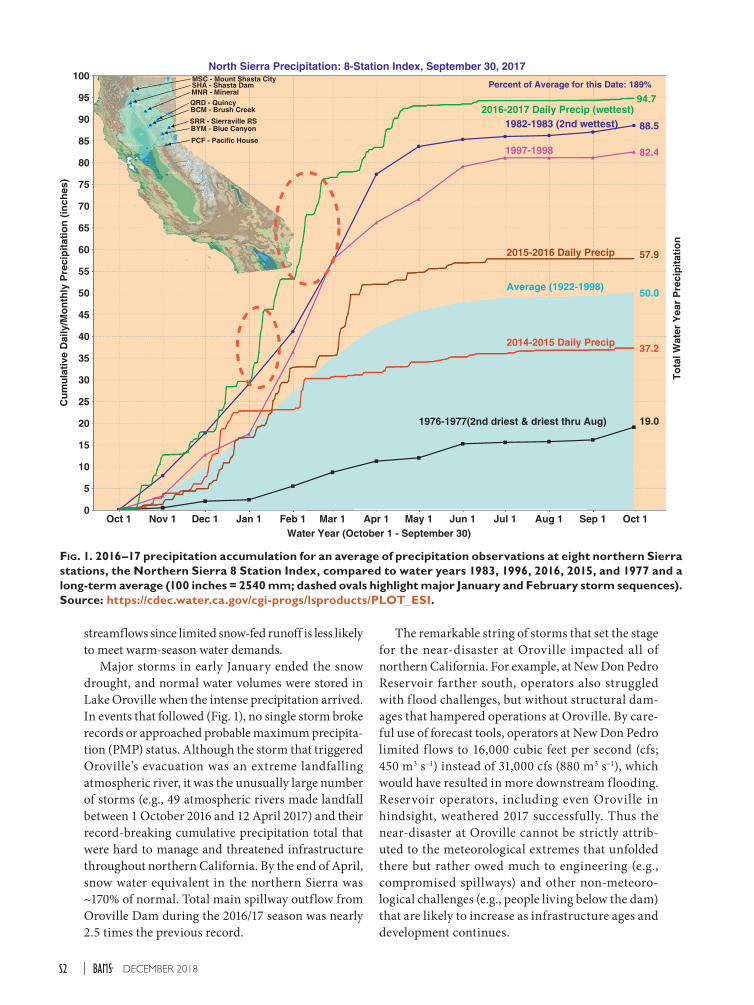
Major storms in early January ended the snow drought, and normal water volumes were stored in Lake Oroville when the intense precipitation arrived. In events that followed (Fig. 1), no single storm broke records or approached probable maximum precipita-tion (PMP) status. Although the storm that triggered Oroville’s evacuation was an extreme landfalling atmospheric river, it was the unusually large number of storms (e.g., 49 atmospheric rivers made landfall between 1 October 2016 and 12 April 2017) and their record-breaking cumulative precipitation total that were hard to manage and threatened infrastructure throughout northern California. By the end of April, snow water equivalent in the northern Sierra was ~170% of normal. Total main spillway outflow from Oroville Dam during the 2016/17 season was nearly 2.5 times the previous record.
The remarkable string of storms that set the stage for the near-disaster at Oroville impacted all of northern California. For example, at New Don Pedro Reservoir farther south, operators also struggled with f lood challenges, but without structural dam-ages that hampered operations at Oroville. By care-ful use of forecast tools, operators at New Don Pedro limited f lows to 16,000 cubic feet per second (cfs; 450 m3 s–1) instead of 31,000 cfs (880 m3 s–1), which would have resulted in more downstream flooding. Reservoir operators, including even Oroville in hindsight, weathered 2017 successfully. Thus the near-disaster at Oroville cannot be strictly attrib-uted to the meteorological extremes that unfolded there but rather owed much to engineering (e.g., compromised spillways) and other non-meteoro-logical challenges (e.g., people living below the dam) that are likely to increase as infrastructure ages and development continues.
Fig. 1. 2016–17 precipitation accumulation for an average of precipitation observations at eight northern Sierra stations, the Northern Sierra 8 Station Index, compared to water years 1983, 1996, 2016, 2015, and 1977 and a long-term average (100 inches = 2540 mm; dashed ovals highlight major January and February storm sequences). Source: https://cdec.water.ca.gov/cgi-progs/lsproducts/PLOT_ESI.
S2 DECEMBER 2018|

Lessons for attribution studies. On the basis of chal-lenges water managers across northern California faced during winter 2017, we suggest that climate-change attribution studies address whether manage-ment should expect future changes in 1) seasons with unusually large numbers of atmospheric-river storms, 2) unusually warm storm conditions with unusually high attendant snowlines (e.g., Hatchett and McEvoy 2018), 3) preceding-year(s) and early-season snow-drought conditions, and 4) the nexus of storm precipitation totals and storm temperatures.
Additionally, the current validity of design storms and return intervals, which were estimated half a century ago when dams were built and operating rule curves were developed, is increasingly being questioned by water managers, and thoroughly vetted guidance in the form of studies that describe how much out of date current curves already are would be helpful.
CASE STUDY: FLOODING FROM HURRI-CANE HARVEY. In August 2017, a landfalling/
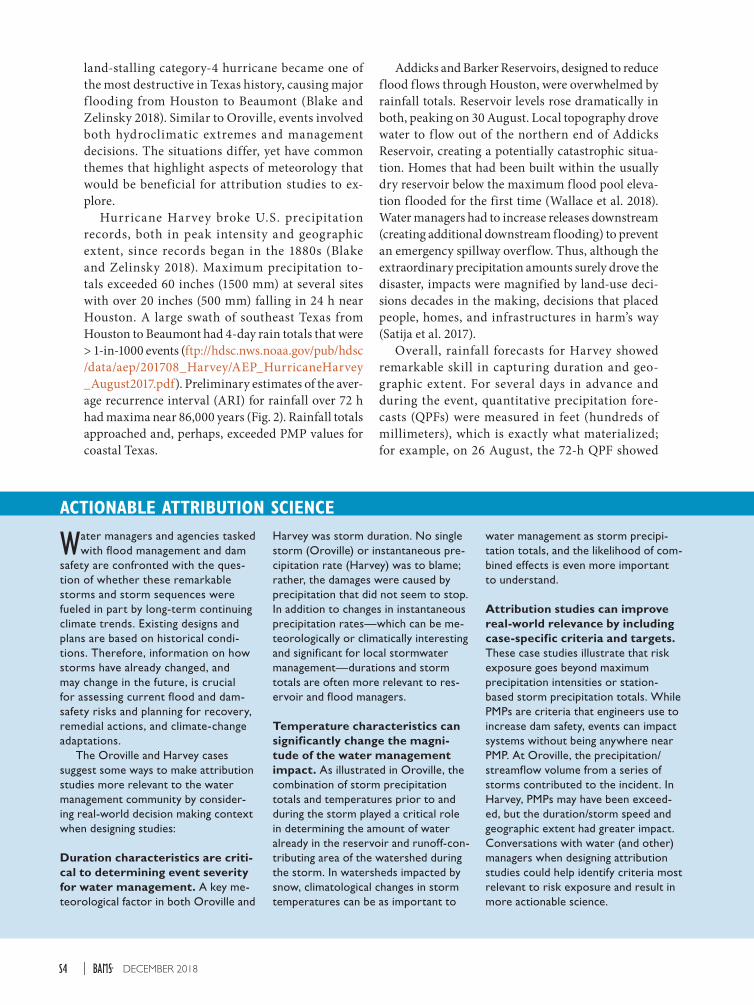
Fig. 2. Estimated average recurrence interval (ARI) of maximum (worst case) 72-h precipitation associated with Hurricane Harvey. Underlying precipitation from MetStorm, a storm precipitation analysis system operated by MetStat, Inc. that integrates radar, satellite, and precipitation gauge data into seamless, high-resolution GIS grids. The underlying precipitation frequency information is from a detailed regional precipi-tation frequency study conducted for the U.S. Army Corps of Engineers by MetStat, Inc. in 2017–18. Source: MetStat, Inc.
S3DECEMBER 2018AMERICAN METEOROLOGICAL SOCIETY |
land-stalling category-4 hurricane became one of the most destructive in Texas history, causing major f looding from Houston to Beaumont (Blake and Zelinsky 2018). Similar to Oroville, events involved both hydroclimatic extremes and management decisions. The situations differ, yet have common themes that highlight aspects of meteorology that would be beneficial for attribution studies to ex-plore.
Hurricane Harvey broke U.S. precipitation records, both in peak intensity and geographic extent, since records began in the 1880s (Blake and Zelinsky 2018). Maximum precipitation to-tals exceeded 60 inches (1500 mm) at several sites with over 20 inches (500 mm) falling in 24 h near Houston. A large swath of southeast Texas from Houston to Beaumont had 4-day rain totals that were > 1-in-1000 events (ftp://hdsc.nws.noaa.gov/pub/hdsc /data/aep/201708_Harvey/AEP_HurricaneHarvey _August2017.pdf). Preliminary estimates of the aver-age recurrence interval (ARI) for rainfall over 72 h had maxima near 86,000 years (Fig. 2). Rainfall totals approached and, perhaps, exceeded PMP values for coastal Texas.
Addicks and Barker Reservoirs, designed to reduce flood flows through Houston, were overwhelmed by rainfall totals. Reservoir levels rose dramatically in both, peaking on 30 August. Local topography drove water to f low out of the northern end of Addicks Reservoir, creating a potentially catastrophic situa-tion. Homes that had been built within the usually dry reservoir below the maximum flood pool eleva-tion flooded for the first time (Wallace et al. 2018). Water managers had to increase releases downstream (creating additional downstream flooding) to prevent an emergency spillway overflow. Thus, although the extraordinary precipitation amounts surely drove the disaster, impacts were magnified by land-use deci-sions decades in the making, decisions that placed people, homes, and infrastructures in harm’s way (Satija et al. 2017).
Overall, rainfall forecasts for Harvey showed remarkable skill in capturing duration and geo-graphic extent. For several days in advance and during the event, quantitative precipitation fore-casts (QPFs) were measured in feet (hundreds of millimeters), which is exactly what materialized; for example, on 26 August, the 72-h QPF showed
ACTIONABLE ATTRIBUTION SCIENCE
Water managers and agencies tasked with flood management and dam
safety are confronted with the ques-tion of whether these remarkable storms and storm sequences were fueled in part by long-term continuing climate trends. Existing designs and plans are based on historical condi-tions. Therefore, information on how storms have already changed, and may change in the future, is crucial for assessing current flood and dam-safety risks and planning for recovery, remedial actions, and climate-change adaptations.
The Oroville and Harvey cases suggest some ways to make attribution studies more relevant to the water management community by consider-ing real-world decision making context when designing studies:
Duration characteristics are criti-cal to determining event severity for water management. A key me-teorological factor in both Oroville and
water management as storm precipi-tation totals, and the likelihood of com-bined effects is even more important to understand.
Attribution studies can improve real-world relevance by including case-specific criteria and targets. These case studies illustrate that risk exposure goes beyond maximum precipitation intensities or station-based storm precipitation totals. While PMPs are criteria that engineers use to increase dam safety, events can impact systems without being anywhere near PMP. At Oroville, the precipitation/streamflow volume from a series of storms contributed to the incident. In Harvey, PMPs may have been exceed-ed, but the duration/storm speed and geographic extent had greater impact. Conversations with water (and other) managers when designing attribution studies could help identify criteria most relevant to risk exposure and result in more actionable science.
Harvey was storm duration. No single storm (Oroville) or instantaneous pre-cipitation rate (Harvey) was to blame; rather, the damages were caused by precipitation that did not seem to stop. In addition to changes in instantaneous precipitation rates—which can be me-teorologically or climatically interesting and significant for local stormwater management—durations and storm totals are often more relevant to res-ervoir and flood managers.
Temperature characteristics can significantly change the magni-tude of the water management impact. As illustrated in Oroville, the combination of storm precipitation totals and temperatures prior to and during the storm played a critical role in determining the amount of water already in the reservoir and runoff-con-tributing area of the watershed during the storm. In watersheds impacted by snow, climatological changes in storm temperatures can be as important to
S4 DECEMBER 2018|
up to 28 inches (715 mm) (NOAA 2018). Station records across the United States rarely show a single station 3-day total above 20 inches (500 mm) (Ralph and Dettinger 2012), let alone an entire region, yet Harvey’s 72-h QPF’s had >20 inches (508 mm) over a 100-km-wide area. In addition, models were stubbornly consistent day to day in forecasting this large rainfall event.
The first-order challenge for water managers was whether to believe these extraordinary QPFs, which were without precedent even for a region with a re-cent history of major floods. The resulting rainfall produced flooding beyond anyone’s experience lo-cally and well beyond standard floodplain mapping. Emergency managers were challenged both by the magnitude of the event and the difficulty of convey-ing the severity of what was happening.
Lessons for attribution studies. All attribution stud-ies to date, by Emanuel (2017), Risser and Wehner (2017), van Oldenborgh et al. (2017), and Wang et al. (2018), indicate increased precipitation in-tensity caused by anthropogenic warming. For ex-ample, Emanuel (2017) found likelihoods of storm
occurrences with area-averaged precipitation totals of 20 inches (500 mm), like Harvey, have already increased by 6% compared to likelihoods in the late twentieth century. This quantification (or others that are even more to the point) can provide man-agers with a better context for deciding what con-fidence to place in the most extreme forecasts and how much to rely on existing flood-management in-frastructures. In the case of Harvey, unprecedented precipitation intensities and totals “made” the haz-ard, but the meteorological events and hydrological catastrophe were exacerbated by its arrival onshore, its speed and duration as an intact severe storm, and its geographic extent. These “other” factors are beginning to be explored (e.g., Gutmann et al. 2018; Kossin 2018) and suggest that, for f lood and water managers, climate-change attribution studies could also address whether and how much climate change contributes to 1) numbers of landfalling hurricanes per year, 2) speed and duration of hurricanes both offshore and on, 3) rates of intensification, 4) geo-graphic extent of (landfalling) hurricanes, and 5) relationships between Saffir category status and maximum precipitation.
Attribution studies should be careful about how results are expressed, because both meteo-rological and operational factors are important in many extreme events. Damages from extreme events are usually not just functions of climato-logical extremity (Klotzbach et al. 2018). Non-climatological factors such as loca-tions and integrity of infrastructure and communities, reservoir operations, and land-use patterns are also important. When water systems perform well, they can operate safely in the midst of extremes. For example, the Oroville event would have garnered little notice if a purely structural problem with the emergency spillway had not developed early in the storm sequence. Also, planning and management decisions can elevate vulnerabilities, such as allowing homes to be built below the maximum flood pool elevation in reservoirs in Houston. Thus, results of attribution studies need to be communicated with realistic humility regarding the mix of
meteorological and human contribu-tions to disasters resulting from meteo-rologically extreme events.
Attribution studies can help man-agement navigate an important paradigm shift. Water planners and engineers build and operate to specific safety standards, including PMPs and design storms with various likelihoods of recurrence. Most projects were planned in an era where optimality and economic efficiency were accepted objectives based on the assumption that probabilities of extreme events could be estimated reasonably by extrapolation of the historical record (Brown 2010). Events like Oroville and Harvey natu-rally raise questions whether historical records and their derived statistics still provide reliable estimates of risks, and whether some design criteria and reservoir operations guidelines should be revised. Unprecedented magnitudes of forecasted rainfall can leave opera-tors doubting the validity of forecasts:
Can the atmosphere hold that much rainfall? Are this many extreme storms really likely in a single year? These are questions attribution studies can be designed to address, leading, with care-ful consideration and collaboration, to information that managers can use to guide their interpretations of forecasts and their estimates of long-term prob-abilities that they use in their operations and planning processes.
From our collective experience, we see potential for attribution studies to better inform water management decisions and enhance public safety to reduce impacts of extreme hazards. However, for studies to be actionable for water management, attention to those aspects of extremes that make them most challenging to management will be needed, requiring improved understanding and engagement with the water management community. We encourage future Explaining Extreme Events studies to take on this challenge.
S5DECEMBER 2018AMERICAN METEOROLOGICAL SOCIETY |

REFERENCES
Abbott, J., 2018, Impacts, lessons from Oroville spillway crisis. Appeal-Democrat (Marysville, CA), accessed 12 Feb 2018, www.govtech.com/em/disaster/Impacts -Lessons-from-Oroville-Spillway-Crisis.html.
Blake, E. S., and D. A. Zelinsky, 2018. National Hur-ricane Center Tropical Cyclone Report: Hurricane Harvey (AL092017). NHC, 77 pp., www.nhc.noaa .gov/data/tcr/AL092017_Harvey.pdf.
Brown, C., 2010: The end of reliability. J. Water Resour. Plann. Manage., 136 (2), https://doi.org/10.1061 /(ASCE)WR.1943-5452.65.
CNRFC, 2017: Heavy precipitation events California and northern Nevada: January and February 2017. California Nevada River Forecast Center, accessed 12 February 2018, www.cnrfc.noaa.gov/storm _summaries/janfeb2017storms.php.
Emanuel, K., 2017: Assessing the present and future probability of Hurricane Harvey’s rainfall. Proc. Natl. Acad. Sci. USA, 114, 12 681–12 684, https://doi .org/10.1073/pnas.1716222114.
France, J. W., I. A. Alvi, P. A. Dickson, H. T. Falvey, S. J. Rigbey, and J. Trojanowski, 2018: Oroville Dam spill-way incident independent forensic team final report (5 January 2018). 584 pp., www.ussdams.org/our -news/oroville-dam-spillway-incident-independent -forensic-team-final-report.
Gutmann, E., and Coauthors, 2018: Changes in hurricanes from a 13-yr convection-permitting pseudo–global warming simulation. J. Climate, 31, 3643–3657, https://doi.org/10.1175/JCLI-D-17 -0391.1.
Hatchett, B. J., and D. J. McEvoy, 2018: Exploring the origins of snow drought in the northern Sierra Nevada, California. Earth Interact., 22, https://doi .org/10.1175/EI-D-17-0027.1.
Holland J., R. Ahumada and D. Farrow, 2018. Last year, all eyes were on the Don Pedro spillway as a ner-vous Modesto waited. The Modesto Bee (Modesto, CA), 17 February 2018, www.modbee.com/news /article199926454.html.
Klotzbach, P., S. Bowen, R. Pielke, and M. Bell, 2018: Continental U.S. hurricane landfall frequency and associated damage: Observations and future risks. Bull. Amer. Meteor. Soc., 99, 1359–1376, https://doi .org/10.1175/BAMS-D-17-0184.1.
Kossin, J. P., 2018: A global slowdown of tropical-cyclone translation speed. Nature, 558, 104–107, https://doi .org/10.1038/s41586-018-0158-3.
NOAA, 2018: Quantitative precipitation forecasts. Accessed 2 July 2018, www.wpc.ncep.noaa.gov/qpf /qpf2.shtml.
Ralph, F. M., and M. D. Dettinger, 2012: Historical and national perspectives on extreme West Coast precipi-tation associated with atmospheric rivers during De-cember 2010. Bull. Amer. Meteor. Soc., 93, 783–790, https://doi.org/10.1175/BAMS-D-11-00188.1.
Risser, M. D., and M. F. Wehner, 2017: Attributable human-induced changes in the likelihood and mag-nitude of the observed extreme precipitation during Hurricane Harvey. Geophys. Res. Lett., 44, 12 457–12 464, https://doi.org/10.1002/2017GL075888.
Satija, N., K. Collier, and A. Shaw, 2017: Houston officials let developers build homes inside reservoirs. But no one warned buyers. The Texas Tribune, 12 October 2017, https://apps.texastribune.org/harvey-reservoirs.
van Oldenborgh, G. J., and Coauthors, 2017: Attribution of extreme rainfall from Hurricane Harvey, August 2017. Environ. Res. Lett., 12, 124009, https://doi.org/10 .1088/1748-9326/aa9ef2.
Wallace, T., D. Watkins, H. Park, A. Singhvi, and J. Williams, 2018. How one Houston suburb ended up in a reservoir. The New York Times, 22 March 2018, www.nytimes.com/interactive/2018/03/22/us /houston-harvey-flooding-reservoir.html.
Wang, S.-Y. S., L. Zhao, J.-H. Yoon, P. Klotzbach, and R. Gillies, 2018: Quantitative attribution of climate effects on Hurricane Harvey’s extreme rainfall in Texas. Environ. Res. Lett., 13, 054014, https://doi.org /10.1088/1748-9326/aabb85.
Wax-Thibodeaux, E., A. Horton, and A. B. Wang, 2017. Houston dam spills over for the first time in history, overwhelmed by Harvey rainfall. The Washington Post, 29 August 2017, www.washingtonpost.com /news/post-nation/wp/2017/08/28/houston-releases -water-from-two-dams-in-attempt-to-prevent -uncontrolled-overflow.
White, A., B. Moore, D. Gottas, and P. Neiman, 2019: Winter storm conditions leading to excessive runoff above California’s Oroville Dam during January and February 2017. Bull. Amer. Meteor. Soc., https://doi .org/10.1175/BAMS-D-18-0091.1, in press.
S6 DECEMBER 2018|