Embed Size (px)
Citation preview

American Journal of Water Resources, 2016, Vol. 4, No. 4, 91-101 Available online at http://pubs.sciepub.com/ajwr/4/4/3 ©Science and Education Publishing DOI:10.12691/ajwr-4-4-3
Hydrodynamic and Hydro-geochemical Processes in the Catchment Area of Lake Retba and Their Implications in Relationship between Groundwater, Lake and Ocean
Mansour GUEYE*, Abdoul Aziz GNING, Fatou NGOM DIOP, Raymond MALOU
Département de Géologie, Faculté des Sciences et Techniques/Université Cheikh Anta Diop, Dakar, Sénégal *Corresponding author: [email protected]
Abstract The drought that began in the Sahel in the late 70s has led to a drying up of most surface water bodies and a decrease of ground water level. In the north coast of Cap-Verde, the Retba lake is one of the few depressions that have preserved its water and experienced all the same, a very important salinization. This saline ecosystem plays an important role in the economy of the area due to the exploitation of salt deposits. However, it is now threatened by a significant reduction of the water surface. Its backup requires a good knowledge of the environment and the interactions between the different reservoirs, namely the lake, groundwater and ponds. To study the relationship between different parts of the hydro system, a network, monitoring the groundwater table including 41 village wells across the watershed, has been established. All observation points and the level of the lake were leveled with the reference 0 IGN. Water samples were taken at the wells, lake and ponds and source for chemical analysis. The results of the altimetric study indicated that the lake is below sea level, at odds of -5.26 m and a good part of the watershed is under the level of the sea. Hence its vulnerability of being invaded by the ocean water due to the difference in altitude. Water table monitoring shows different movements from one point to another due to the interference of several factors in the process of charging and discharging of the water table. Thus, some wells are only under the influence of climate parameters (rain and evaporation), while others are fed or drained by lateral flow. Water chemistry is dominated by two chemical facies: calcic and chloride facies (Ca-cl) and sodium chloride-facies (Na-Cl). Na and Cl ions control mainly the mineralization water and cationic exchange is the main factor controlling water chemistry even if other processes such as anthropic pollution could occur. These cationic exchanges reflect the intrusion of seawater into the sand aquifers. These results also show that in the late dry season, water ponds have a chemical signature very close to seawater. This shows that the ponds that are in the north of the lake is an outcrop of the Sea that feeds the lake permanently. The lake water is a mixture of seawater and groundwater whose evaporation causes sedimentation of salt exploited by local people. Monitoring of the groundwater level, the lake level and the chemical analysis shows a connection between the lake, the groundwater, the ocean and ponds.
Keywords: lake retba, ponds, water chemistry, fluctuation, water table, mineralization, seawater intrusion, chemical facies, altimetry
Cite This Article: Mansour GUEYE, Abdoul Aziz GNING, Fatou NGOM DIOP, and Raymond MALOU, “Hydrodynamic and Hydro-geochemical Processes in the Catchment Area of Lake Retba and Their Implications in Relationship between Groundwater, Lake and Ocean.” American Journal of Water Resources, vol. 4, no. 4 (2016): 91-101. doi: 10.12691/ajwr-4-4-3.
1. Introduction Saline systems are very widespread in arid and semi-arid
areas. Their existence requires primarily an evaporation higher than the precipitation [1,2]. Following cultures, the names of these systems vary from one region to another, sabkha (coastal or continental) for Arab; salinas, saladas, salares, playas, for Spanish; and pans, salt lake, alkali, dry lake for English. For hydrogeologists, these systems come from the same process with fluctuations of water table compared to the ground surface. They can be active or represent past hydrogeological conditions [3].
Pink Lake or Lake Retba is a saline system of Cap-Verde peninsula located at 35 Km east of the capital, Dakar. Its
watershed covers an area of 160 km2 [4] is endorheic; it is formed of sand leading on a waterproof marly substratum. The lake was implemented after the post-nouakchottienne marine regression, by isolation of the previous lagoon, to the newly created coastal dune [5,6]. Water is over salted and leave down to lake a salt crust [7], exploited by the people since the 70s. This mining activity produces yearly 110,000 tons of salt and generates profits varying between 1 billion 500 000 and three billion CFA franc [8]. In addition to this core business, the watershed has others activities such as tourism, market gardening and arboriculture. Thus, it plays a significant socio-economic role. It is the only lake in the north coast that maintains water permanently. However, in recent years its level is falling and falling to worrying proportions, threatening all socio-economic activities.
92 American Journal of Water Resources
Being aware of the importance of this ecosystem, the Senegalese Government of has included this component "scientific study of Lake Retba" in the support program for the mining sector (PASMI) financed by the European Union. In fact, the backup of Lake Retba will only be achieved through a deep understanding of the interactions between the various hydro-systems that are the lake, the groundwater, sea and ponds. If the lake still withstands drying up despite the reduction of its water, it is because it has a special hydro-geological structure that establishes in one hand, an hydro-dynamic relationship with the sea and with the groundwater in another.
The early researches specifically devoted to Retba lake went back to those performed by [9,10]. This author has highlighted and dated the various transgressions and regressions observed in the watershed by dating of the dune shells. Recent work by [5,6] show the paleo-geographic evolution of the lake by including biomarkers such as mollusks, foraminifera, diatoms and ostracods. According to this author the lake went through five stages before its current configuration; it is a stage slightly open lagoon, a stadium of small marine gulf, a closed lagoon stage running dry, a low stage lagoon open and a closed lagoon stage (lake). [11,12] show the seasonal evolution of the salinity of ponds located in the old channel using diatoms including Paralia sulcata. They highlight the isolation of the Retba lagoon resulting to a period of low sea level between 1200 and 250 PB. [11] mapping the old supplying paths from the lake by the ocean. In addition to the channel, this supply was made by another route located in the North East of the lake. [8] studies highlight
the diachronic evolution of the water table characterized by a continued reduction of its area. Only former researches [4,7,13,14] highlighted the hydro-chemistry of the lake water in relation to that of the groundwater. However, authors consider the hydro-system of the lake as frozen, fossil and non-dynamic. They do not address the ocean-lake relationship. They consider the hydro-system of the lake as a relic of the salt wedge, without any hydrodynamic relationship with the ocean and evolving in an evaporation pan. This does not explain the resistance of the lake to the drought of 70s and does not help to know the origin of the exploited salt. This study is important because it highlights the hydro-system through a dynamic perspective of and updates its existing knowledge already acquired by the original authors. This helps to a better understand of the current functioning of the ecosystem, in order to identify strategies for managing and conserving the resource that is the salt exploited at the lake by local inhabitants. It is in this context that an experimental device helping to monitor water table and lake level for two hydrological seasons has been established as part of the project named "scientific diagnosis Lake Retba. Chemical analyzes were made in the various samples taken from the lake, groundwater and ponds.
This article shows some results obtained under this program. Its aim is to study the origin of the lake water and the mechanisms responsible for the mineralization of the water table and that of the lake with the help of a hydro-geochemical and hydrodynamic characterization of these waters. In addition to highlight the lake-ocean-water table relationship.
Figure 1. Location of the study are

American Journal of Water Resources 93
2. Geological and Hydrogeological Context
2.1. Geological Contexte Geology of Cape Verde peninsula is part of the
Senegalo-Mauritanian sedimentary basin. Here we just include formations that are concern by our studying area, namely the lower Eocene and quaternary formations. The detailed geology is presented in Figure 2. It is represented by the sands of the red dunes that extend to the east and south of the lake. These are the continental red dunes.
Figure 2. Geological Map of the Cape Verde peninsula
2.1.1. The lower Eocene It is made of clay and marl forming the impermeable
bedrock of lake Retba watershed. Above these formations are located the sand and clay dating back to the Quaternary.
2.1.2. The Inchirian It is represented by shell sands interspersed with buried
beach-rock. This beach-rock is present in dune sands of the basin where it is flush with the old channel where ponds are located. [15].
2.1.3. The Ogolien (25 000 to 18 000 years B.P It is represented by the sands of the red dunes that
extend to the east and south of the lake. These are the continental red dunes.
2.1.4. The Tchadian (11 000 to 7 000 years B.P.) It corresponds to the settling of peat along the coast in
depressions called Niaye, which are areas where the groundwater is flush.
2.1.5. The Nouakchottian (6800 to 4200 years B.P.) It is characterized by a marine terrace whose maximum
deposits height is about 3.5 m. The usual facies of this transgressive episode is a fine white sand corresponding to the resumption of a previously deposited sand dune. There, are located many Anadara sinilis shells.
2.1.6. The Tafolian (4200 to 2000 years B.P.) It was during this period that yellow dunes set up; that
separate the sea from the old lagoons inherited from the Nouakchottian [10].
2.1.7. The Dakarian (3000 years B.P.) The sea has deposited the sub-current to current white
dunes of the coast.
2.1.8. The Saint Louisian (2000 to 680 years B.P.) It corresponds to a small sea incursion in lands and
shells deposit around lake Retba. The Figure 2, about the different horizons observed in
the basin, shows that the Quaternary formations that overhang clays and marls of the Eocene are composed of consist of alternating sand, clay and shell sand.
2.2. Hydrogeological Context Quaternary sands dominate the hydrogeology of this
area. These formations, whether they are marine or continental, behave from a hydrogeological perspective as a unique reservoir. They are directly contact with the ocean to the west [16] and its permeability varies and depends on the nature of aquifers [14]. The groundwater of the coastal cord goes to the ocean on the one hand and to the lakes on the other hand, with a piezometric head above the sea level that equals 2m [7].
The permeability is highly variable and evolves horizontally and vertically. Transmissivity too varies between 5.2 10-4 and 5.6 10-3 m2 / s. At Niakoul Rap and Bambilor located on the southern part of the basin (Figure 1), it is respectively 2.3 10-3 m2 / s and 1.8 10-3 m2 / s. The storage coefficient is close to 1%, but may vary due to the presence of some more clay horizons found in the sands. In some places, the water table acquires a semi-captive behavior due to those clay horizons.
In a hydrological perspective, the lake is fed by streams that are not sustainable and operate only during the rainy season. However, we must note the existence of two ponds (etg1 and etg2) located in the north of the lake below the dune. These ponds form together a stream that feeds the lake throughout the year. These ponds could have an important role in hydrodynamics of the lake and its relationship with the sea.
3. Materials and Methods A monitoring network of the water table (Figure 4)
consisting of rural wells was set up. Throughout the study period, the same operator and the same piezometric probe, which minimizes reading errors and provides an acceptable reliability and accuracy to data, performed the piezometric groundwater monitoring. The lake level has also been the subject of a monthly statement manual using a water-level scale.
94 American Journal of Water Resources
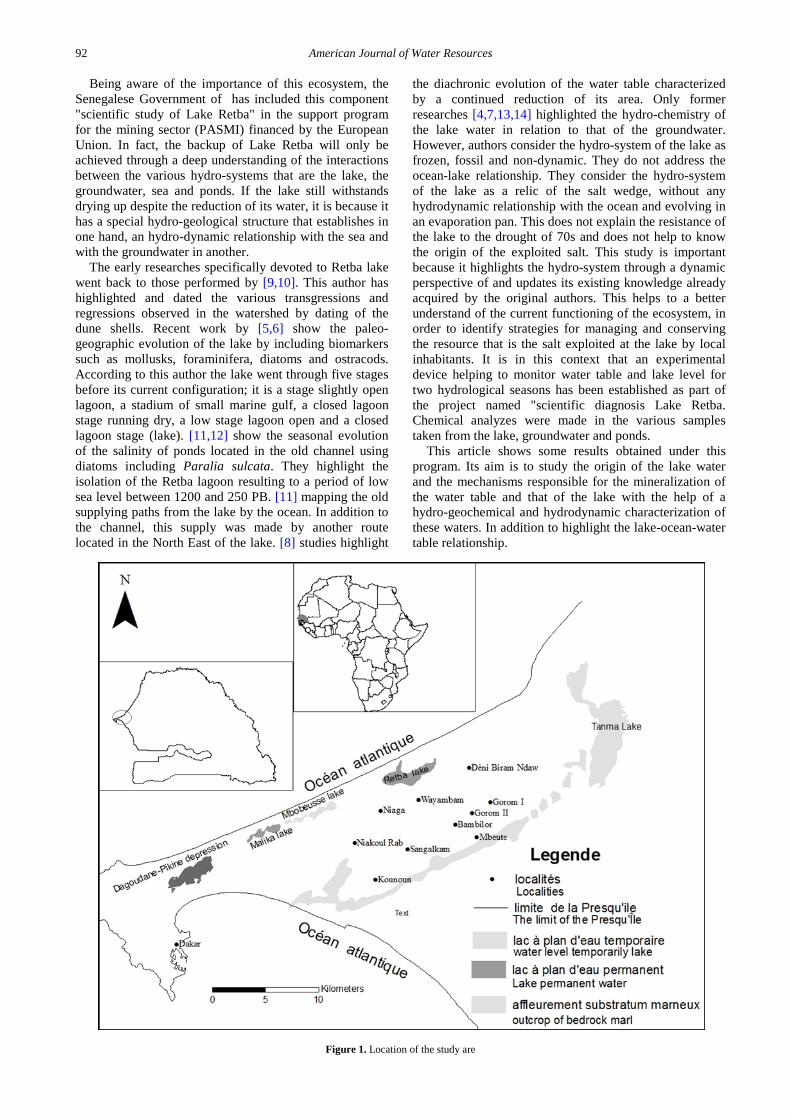
The various observation points were leveled using a differential GPS. This helped to calculate the piezometric loads and monitor the advancement of the water table. A water sampling campaign was conducted in late dry season in June 2012. A total of 41 samples were collected: divided, between the waters of the sand table, of the coastal dune and the waters of the mainland dune sands, the lake water, pond waters (etg1 and etg2) and waters of the source located at the west side of the lake near the well 5 (P5) (Figure 3). These samples were analyzed at the hydrochemistry laboratory at the Department of Geology of the Faculty of Science of the University of Dakar. Analyses focused on the major cations (Na+, Ca2+, K+, Mg2+) and major anions (HCO3-, CO32-, OH-, Cl-, NO3-, SO42-). Carbonates / bicarbonates were analyzed by titration with a solution of sulfuric acid and Silver Nitrate chloride. Sodium and potassium were analyzed by flame emission photometry. Nitrates and sulfates were analyzed
respectively by spectrophotometry, by cadmium reduction and by barium chloride spectrophotometry. Calcium and magnesium analysis was performed by complexometric mean with EDTA solution and that of iron by phenanthroline spectrophotometry. Ionic balances are between 0.05% and 3% for all samples, except one who was rejected with a balance of 30%.
The electrical conductivity of well and lake waters and PH were measured in situ with a HACH type miltiparametric probe. Chemical data processing was performed with Diagramme software developed by R. Simler (Hydrogeology Laboratory of the University of Avignon). This software allowed determining the different chemical facies of waters. Correlations were made between the conservative chloride ion and other major ions to determine the origin and mechanisms of mineralization of waters [17].
Figure 3. Monitoring network of the groundwater
4. Results and Discussion
4.1 Altimetry of the Watershed The leveling campaign allowed seeing that the lake is
below sea level at an altitude of -5.26 m asl (above sea level) (in February 2013). This rating shows the importance of the regression undergone by the lake of which altitude was -2.4 m in 1956 [4] and -3,5 m in 1978 [7]. This recession is due to the rainfall deficit experienced
by the region in recent decades. Since the late sixties dry tropical Africa is experiencing a climatic deterioration marked by a regression of the annual rainfall [18] and weather conditions that exacerbate the evaporation of lakes and shallower sources. Among the 80 points, 33 are located under the sea level, in the immediate environment of the lake and on the dune, which separates the lake from the ocean. The negative rate of the lake level would foster the provision of water from the ocean. Indeed in systems where the water level is below the sea level, the intrusion of seawater is evident due to the difference in altitude [3].

American Journal of Water Resources 95
4.2. Inter-annual Fluctuations of the Groundwater Table
Fluctuations in the groundwater table were followed on 49 wells across the watershed (Figure 3) between 27 January 2009 and 3 July 2011. The evolution of the groundwater table varies from one point to another due to the interference of several factors in the process of charging and discharging of the water table. Thus, some wells are only under the influence of climate parameters (rain and evaporation) according to [19], while others are fed or drained by lateral flow. Furthermore, the impact of climate parameters on the fluctuations of the groundwater table is inversely in proportion to the depth of the piezometric surface [20]. Piezometric data show that the level of the coastal water table is generally below that of the sea. This reflects a sharp decrease compared to the level given by [7].
Depending on the shape of the fluctuations in their static level, the followed works have been classified into four groups:
4.2.1. Fluctuation of Type 1 A cushioned, low-level fluctuation is observed in wells
like the P34, (Figure 4). This could be due to the presence of clay in the unsaturated zone. Geological logs show significant proportions of clay in the location of the well namely in Sangalkam. But the high percentage of clay components in the unsaturated zone delays the vertical infiltration of water [21], which would result in low fluctuations, that will be amortized up completely with the increase of the clay fraction in the ZNS. Thus, water can be taken up by evaporation before reaching the groundwater. This may justify the low-level rise observed in these wells after the rainy season.
Figure 4. Fluctuation of type 1 groundwater level observed in the well P34
Figure 5. Fluctuation of type 2 groundwater level observed in the well P31
4.2.2. Fluctuation of Type 2 The level increases gradually, even during the dry
season (Figure 5). This fluctuation is peculiar and is only observed at the well 31 (P31). At this level, there exists
another charging mechanism of the groundwater, which is added to that caused by vertical infiltration of rainwater, especially a side feed. However, also by a weak evaporation, limited by the thickness of the unsaturated zone which is 13 m at the P31. Refill at this well is

96 American Journal of Water Resources
delayed. This phenomenon was observed by [20] in the watershed of Nema in central Senegal. Given the delineation of the watershed that well could belong to another hydrogeological pond different from that of the lake Retba.
4.2.3. Fluctuation of Type 3 The level increases, and then undergoes small
fluctuations (Figure 6). This type of fluctuation was observed in wells like the P23 and P22. These wells are located on the axis Gorom 1-Déni Biram Ndao where the hydraulic load decreases between P21 (25.74 m), P22
(12.61 m), P23 (7.12 m) and P24 (5 m) located on this same axis (Figure 3). On this axis, the groundwater is thus drained by the lake. Thus, the wells located on this axis are always under load, since powered by the dome at the P22. Their groundwater level undergoes small changes. In this part of the basin, the groundwater is substantially recharged by the rainwater as shown in Figure 6 (P22). The relative stability of the level could be justified by a side feed from a piezometric dome located in Gorom 1 where the well P21 is located. This could also be justified by the transmissivity values, which differ in the basin.
Figure 6. Fluctuation of type 3 groundwater level observed in the well P22
4.2.4. Fluctuation of Type 4 The level is characterized by an increase during the
rainy season and a decrease after (September) and during all the length of the dry season (Figure 7). The majority of
the monitored wells present this type of fluctuation with amplitudes that differ depending on whether one is on the mainland dune or the coastal dune. Wells located on the coastal dune have higher fluctuation amplitude than the others.
Figure 7. Fluctuation of type 4 groundwater level observed in the well P14

American Journal of Water Resources 97
Such fluctuations mainly reflected recharge by the rain and discharge by evaporation and drainage by the lake Retba. In these wells, the groundwater reacts strongly to rains due to the shallow depth of the water table in such areas, but also to the good permeability of dune sands. These wells are also in areas where the soil is not clayey or have low clay percentages facilitating the infiltration of water into the groundwater. Their discharge is done by evaporation and drain into the lake. Indeed all around the periphery of the lake are observed water table resurgence under small sources feeding the lake.
This hydrodynamic diagnosis shows that in the basin, the flow of the water table so does not happen at the same speed in the different areas, which has a strong influence on the chemical evolution of its waters, since their residence time will differ. Indeed hydrodynamics adjusts the speed of dissolution, attack phenomena and modifying phenomena of chemical compositions of water. An easy movement enables leaching, while a difficult or nearly absent movement produces more fully the action of modifying phenomena in a given volume of water. [22]. In areas where the wells behave like the P13, the water table
is quickly discharged, resulting in a short residence time of water in the aquifer in other wells like the P22 where discharge is low.
4.3. Hydrodynamic Relationship between Groundwater and the Lake
To highlight the hydrodynamic relationship between the lake and the groundwater, two wells were selected, the P12 which is on the dune between the lake and the ocean and the P18 which is on the mainland dune. The evolution of the water body of the lake and the piezometric surface of P12 and P18 wells shows that the level of the water table as well on the coastal side as of the continental side is above the level of the lake (Figure 8). Consequently, the flow is converging towards the lake depression. Thus, a gap of almost 3 months is noted between the beginning of the rising flood of the groundwater and that of the lake. The groundwater level began rising at the wells level in July (04/07/2009) while the level of the lake continues to drop and starts to rise only in October (04/10/3009). A gap is also observed in declining levels.
Figure 8. Hydrodynamic relationship between the lake and the water table
This reflects the hydrodynamic relationship and the hydraulic connection that exist between the level of groundwater and the lake level. This shows that the water table maintains the base level of the lake during the dry season. This fact is reflected in a set of small resurgence as sources observed along the lakeshores. Therefore, the lake is hydraulically connected to the water table. This lake feeding by the groundwater helps maintain the water level of the lake in this situation of drying undergone by the other coastal lakes.
4.4. Hydrochemical Characterization of Waters of the Drainage Basin
4.4.1. Statistics of Major Ions The statistical analysis (Table 1) shows that the average
value of TDS is 956 mg / l. 37% of the wells have a TDS
between 1000 and 4350 mg/l and for the rest between 98 and 1000 mg/l. Thus, the water tends to be brackish and even salty in some wells. The dominant anion is the ion Cl- which has the highest average value (6.51) with a median value of 4.91 and a standard deviation of 1.57. The dominant cation is sodium, which has the highest average value (7.51) with a median value of 4.70 and a standard deviation of 2.70. These standard deviations indicate that the contents of chloride and sodium are highly variable in the basin since the values of standard deviations are high.
The correlation matrix shows a strong positive correlation between the ions Na+, K+ and Cl- and of these ones with the TDS, the correlation coefficient of each of these ions with the TDS exceeding 0.9. The correlation between Na+ and Cl- is positive and very strong (r = 0.97). This allows saying that the ions Cl-, Na+ and K+ monitor

98 American Journal of Water Resources
mainly the mineralization of waters. This strong correlation between Na+, K+, and Cl- suggests that the TDS derives mainly of these ions and that these ions also depend on a common source [23] which could be in this case the sea water. There is an average correlation between the ions Ca++, Mg++, HCO3
-, SO4-- and the TDS,
with correlation coefficients around 0.6. The pH varies between 5.6 to 9.2 with an average of 7.9 and a median of 8.0. The statistical analysis shows that 56.7% of the
samples have a pH between 8.0 and 9.2, indicating that water from the water table is generally alkaline
The electrical conductivity (EC) varies between 138 and 6780 µS/cm. Its mean value is 1453.3 µS/cm and its median is 1377 µS/cm. The standard deviation, which is 76.3 µS/cm, shows a strong dispersion of conductivity values around the mean value. 67.5% of the samples have a conductivity superior to 1000 µS/cm. This shows that the groundwater tends to be brackish to salty.
Table 1. Statistics of major ions (in meq / L) and physicochemical parameters
Ca++ Mg Na K HCO3 Cl SO4 NO3 T°C PH EC TDS
minima 0,3 0,1 0,7 0,04 0,1 0,5 0,26 0,01 25,7 5,6 138 98
maxima 9,4 6,3 54,2 0,9 16 44,2 8,1 13,2 29 9,2 6780 434
moyennes 4,3 2 7,4 0,2 2,7 6,5 2,6 2,2 27,4 7,9 1453,3 956,9
medianes 4,2 1,6 4,7 0,1 2,7 4,9 2,2 0,4 27,3 8 1377 831
écart-types 0,1 0,4 2,7 0,04 0,05 1,5 0,4 1,8 0,1 -0,1 76,3 125,9
4.4.2. Chemical Facies or Type of Waters Two chemical facies overmaster the waters from the
water table during the end of the dry season. They are: The calcium chloride facies (Ca-Cl2) which represents
45.9% of the observed wells, namely: P12, P41, P40, P15, P30, P8, P38, P20 P29, P7, P17, P18, P36, P43, P45, P4, P39.
The chloride sodium-potassium facies (Cl-Na-K) representing 43.2% Na-Cl-K of the observed wells namely: P2, P6, P28, P37, P23, P24, P22, P21, P33, P14, P25, P26, PZ1, P5, P46, P48.
However, a calcium bicarbonate facies, representing 8.1% of the observed wells, is also noted at the wells P50,
P44, and P31, and a magnesium bicarbonate facies at the single well P27.
The groundwater is divided into calcium bicarbonate and calcium sulfate facies for low concentrations. It becomes sodium chloride when nearing the lake where it merges with the latter [7]. The results of the 2012 campaign show that the water chemistry of the groundwater has evolved greatly since the 1970s, as the calcium bicarbonate facies is now observed solely at three wells (Figure 9) and the calcium sulfate facies is no longer observed. The sodium chloride facies, which was observed when nearing the lake, has now a significant extension in the groundwater, where it is observed in 15 works distributed throughout the basin.
Figure 9. Spatial distribution of chemical facies

American Journal of Water Resources 99
4.5. Origin of the Mineralization of the Waters in the Lake Retba Watershed
The chemical composition of the groundwater in coastal areas and associated geochemical processes can be determined by the ion ratios of the various ions. Indeed, ions characteristic ratios are usually the best tracers of salt springs [17]. The characteristic ratios allow to compare the types of water but also to follow their chemical evolution.
4.5.1. Dissolution of Halite (NaCl) Waters deriving from the dissolution of halite have a
Na+/ (Na++Cl-) report roughly equal to 0.5 [23]. For our waters, the report shows an average value of 0.52 with a median of 0.50 and a standard deviation of 0.08. This means that the salinity of the basin waters derives partly from the dissolution of halite contained in sedimentary formations. This hypothesis is confirmed by the graph Na-Cl, (Figure 10) showing that the majority of the points are aligned on the line of NaCl dissolution. However, there are samples, which waters tend towards an impoverishment in Na+ (Cl- enrichment) for these waters the mechanisms involved in the mineralization are the inverse ion exchanges. However, others tend to sodium enrichment, for these waters the mechanisms involved are basic ionic exchanges [23].
Figure 10. Relationship of the Na-Cl report with the halite dissolution line4
4.5.2. Dissolution of Gypsum (CaSO4, 2 H2O) The dissolution of gypsum can be demonstrated by the
SO42-/HCO3
- and SO4/Cl ratios. Indeed the predominance of sulphate on the chlorides and bicarbonate reflects the effects of the dissolution of gypsum [24]. In our samples, that fact is observed only in 3 wells: P12 where the SO4
2-
/HCO3- ratio is 1.94 and that of SO4
2-/Cl- is 1.62, the P15 which displays a SO4
2-/HCO3- ratio of 2.1 and a SO4
2-/Cl- ratio of 1.10 and finally the P43 where there is a SO4
2-
/HCO3- ratio of 1.59 and that of SO4
2-/Cl- equal to 1.2. In other wells, the SO4
2-/HCO3- ratio is superior to one and
that of the SO42-/Cl- inferior to one or vice versa. This
means that even if the dissolution of gypsum exists in the aquifer, it is not the main origin of the mineralization of waters. Similarly, in surface waters (ponds, lake, source), no dissolution of gypsum is noted since the SO4
2-/HCO3-
ratio is superior to 1 and that of SO42-/Cl- inferior to 1.
Therefore, sulfate would come from seawater.
4.6. Mechanisms of Mineralization of Waters The graph [Na-cl] vs [Ca+Mg-SO4-HCO3] (Figure 11)
[23] helps to divide the water from the groundwater into two groups.
For the first group (Group 1) composed of the majority of the wells (27), water align on a regression line with a regression coefficient of 0.96 and a slope noticeably equal to -1. For the second group composed of 10 wells (P39, P40, P37, P36, P32, P24, P14, P21, P33, P23), waters show a wide dispersion around a linear regression line of -0.40 slope.
The alignment of the samples of the first group on a line with a slope of -1 proves the existence of ionic exchanges at these points [23,25,26].
Figure 11. Relationship between [Na+ -Cl-] and [HCO3
--SO42-]
This means that in this part of the groundwater ion exchanges are the main factor controlling the variation of the chemical composition of water. These ion exchanges can be direct or inverse.
In the second group, the emplacement of the points indicates that the ion exchange is not the main factor controlling the water chemistry of these wells. Other processes can then interfere such as anthropogenic pollution [27].
Surface water is also aligned on a line of -1 slope with seawater. It is noted that on this line samples collected from the ponds get into a group with seawater, and the sample collected from the lake separates from them. This shows that the water of the ponds is closer to the seawater by the end of the dry season. And that the lake contains seawater concentrated by evaporation. Specialization of different groups shows that the wells belonging to Group 1 are located on the coastal dune and the continental dune. However, those belonging to group 2 are located only on the continental dune (Figure 12).
Figure 12. Location of the different groups

100 American Journal of Water Resources
4.6.1. Na/Cl Relationship The Na-Cl relationship is often used to identify the
mechanisms causing the salinization of water in arid and semi-arid zone [28]. The Na vs Cl diagram (Figure 13) shows that the points are located below the soft water-salt water mixing line.
Figure 13. Na/Cl relationship with the freshwater seawater mixing line
This reflects sodium depletion in waters. These waters are controlled mainly by cation exchange reactions [29].This cation exchange is here a reverse exchange [23] which is represented by sodium adsorption by clayey lenses and a calcium release. This phenomenon is one of the most remarkable processes that accompanying seawater intrusion [30,31]. These reverse exchanges may be the cause of the calcium chloride facies observed in P17 and P37, sampled wells.
The low values of the Mg++/Ca++ ratio of water from the water table are due to the existence of reverse cation exchanges [32]. Indeed, for the majority of the sampled wells, the Mg++/Ca++ ratio varies between 0.48 and 0.83 except the wells, P25, P26, P27 and P48 where it is superior to 1, which would indicate a dolomitisation in these wells [33]. These four wells have a sodium chloride facies except the P27, which has a calcium bicarbonate facies. The high Mg++/Ca++ ratio therefore show an enrichment of sodium compared to the calcium.
In the two ponds, these inverse exchanges are strongly highlighted because it is also noted a Na depletion in water in Na and Ca enrichment. This confirms the hypothesis that, at the end of the dry season, pond water particularly the pound 2 is seawater diluted with water from the dune groundwater, the pond 2 is outcrop of salt water that flows into the lake. Indeed, its TDS is 33 547 mg/l close to that of water which is 35 000 mg/l and its conductivity which is 58 400 µS/cm.
However, the lake water and some samples from the water table show a sodium enrichment. This results in direct cationic exchanges [34] and sodium release by clayey matrix and the adsorption of calcium and/or magnesium ions. This explains the presence of the sodium chloride facies in some wells.
4.6.2. Ca / Cl Relationship The graph Ca / Cl (Figure 14) shows an enrichment of
calcium over chloride on the majority of the samples, confirming the existence of these reverse exchanges.
However, in some wells, a mixture of water from the table sands and water from the underlying marl slick limestone can explain calcium enrichment over chloride.
Figure 14. Ca / Cl relationship in the groundwater
5. Conclusion This work showed that the waters of the watershed
table have a brackish, salt tendency in some wells. However, surface water (ponds, lakes) are salty, except from the source, which is a resurgence of the dune aquifer. The fluctuations in the groundwater table differ from one point to another. Some fluctuations are the charging conditions of the groundwater by rain and discharge. However, others bring to light other mechanisms such as side feed and the influence of clays of unsaturated zone thickness.
Mineralization of water is mainly controlled by the Na+ and Cl- ions. However, the ions Ca++, Mg++ and SO4
2- have a significant role. One of the sources of this water mineralization is still the dissolution of halite contained in sedimentary formations. However, being in coastal zone the influence of the sea is also involved in mineralization.
Water chemistry is dominated by two chemical facies: calcium chloride facies and sodium chloride facies. The cationic exchanges are the main factor controlling water chemistry even if other processes such as anthropogenic pollution could occur. These cationic exchanges can be direct or inverse. Inverse exchanges provoke calcium chloride facies, which is dominant and direct cationic exchanges justify the existence of sodium chloride facies.
At the end of the dry season, ponds (especially the pond 2) have a strong signature of seawater. We can even say that at this pond, it is the salt water supplied by the ocean that outcrops and flows into the lake. The pond is therefore a link through which the sea supplies the lake through its salt water. Lake water is therefore comprised of water from the groundwater and seawater, which concentrates, by evaporation thereby causing salt deposit. These results can be used by future works to quantify the flow of water from the sea, which feed the lake through the pond. Thus, the salt which is deposited in the lake can be quantified The quantification of this sedimentation could help to manage better the resource since it will set in exploitation rates that will allow proper management of the resource.
References [1] Hardie, L. A., Smoot, J. P., and Eugster, H. P., "Saline lakes and
their deposits: a sedimentological approach.," in Modern and Ancient Lake Sediments. vol. Special Publication, A. Matter and
10-1
100
101
102
103
104
10-1
100
101
102
103
104
Cl-(meq/l)
Na+
(meq
/l)
eau de la nappeeau de surface pôles eau douce-eau salée
droite de mélange eau douceeau salée
10-1
100
101
102
103
104
10-1
100
101
102
Cl-(meq/l)
Ca+
+(m
eq/l)
eau de la nappeeau de surface Pôles eau douce eau salée
droite de mélange eau douce eau de mer

American Journal of Water Resources 101
M.E. Tucker, Eds., International Association of Sedimentologists. 1978, 7-41.
[2] Langbein, W. S., "Salinity and hydrology of closed lakes," Geological Survey Professional paper 412 20 pp.1961.
[3] Yechieli, Y. and Wood, W. W, "Hydrogeologic processes in saline systems: playas, sabkhas, ans saline lakes," Earth-Science Reviews, vol. 58. 343-365. 2002.
[4] Carn, J., Garnier, J.M., and Maglione, G.F., Données préliminaires sur les possibilités d’installation d’une saline à l’emplacement du lac Retba, Cap-Vert, Sénégal. Rapport ORSTOM, Dakar, 1976.
[5] Sarr, R. Debenay, J. P. and Sow, E. "Sea level changes recorded by foraminiferal assemblages in the Upper Holocene of the Retba Lake (Senegal)." Revue de micropaléontologie, vol. 52. 31-41. 2009.
[6] Sarr, R. Sow, E. and Bodergat, A. M. "Holocene marine incursions in Lac Retba (Cap Vert, Senegal) evidenced by ostracod faunas," Geobios, vol. 42. 381-395. May-Jun 2009.
[7] Garnier, J.M., "Evolution géochimique d'un milieu confiné: le lac Retba (Cap-Vert) Sénégal," Revue de Géographie Physique et de Géologie Dynamique, vol. XX(2). 13-58. 1978.
[8] Sarr, F. O. "Apports de la télédétection et des systémes d'information géographique (S.I.G) au suivi des zones côtières: Exemple du Lac Retba.," Mémoire d'Ingénieur Géologue, Institut des Sciences de la Terre, Université Cheikh Anta Diop, Dakar, 1997.
[9] Elouard, P. Evin, J. and Hébrard, L. "Observations et résultats de mesures au radiocarbone sur les cordons littoraux coquilliers du lac Retba - Sénégal," Bulletin de Liaison de l’ASEQUA, vol. 46. 15-19. 1975.
[10] Elouard, P. Faure, H. and Hébrard, L. "Variations du niveau de la mer au cours des 15 000 dernières années autour de la presqu’île du Cap-Vert, Dakar - Sénégal," Bulletin de Liaison de l’ASEQUA, vol. 50. 29-49. 1977.
[11] Sow, E. Compère, P. and Sarr, R. "Diatomées fossiles du lac Retba (Sénégal, Afrique de l’Ouest). Aperçu paléo-écologique.," Algological Studies, vol. 120. 65-82. 2006.
[12] Sow, E. Fofana, C. A. K. AW, C. and Sarr, R. "Mise en evidence d'une période d'isolement du lac Retba (Sénégal) entre 1200 et 250 B.P. par l'abondance de Paralia sulcata (EHRENBERG) Cleve," Journal des sciences, vol. 8. 52-58. 2008.
[13] Martin, A. "Etude géochimique des eaux souterraines de l’Afrique de l’Ouest Presqu’ile du Cap-Vert (Sénégal)," BRGM DAK 67, 1967.
[14] Martin, A. "Les nappes de la presqu’île du Cap-Vert (République du Sénégal): Leur utilisation pour l’alimentation en eau de Dakar, Notice et cartes hydrogéologiques 1/50 000," BRGM, France.1970.
[15] Diouf, M.B. Contribution à l'étude des beach-rock sénégalais: Révision et nouvelles données. Département de Géologie, Université de dakar, rmémoire de D.E.A, 1984, 11-12.
[16] Vallet, P., Approvisionnement en eau et assainissement de Dakar et ses environs: Etude des eaux souterraines, Tome II: Etude hydrogéologique de la nappe des sables Quaternaires. Rapport OMS projet Sénégal 3201 1972.
[17] Richter B.C., and Kreitler, C.W. Geochemical techniques for identifying sources of grounwater salinization. United States of
America: Library of Congress Cataloging-in-publication Data, 1993.
[18] Bricquet, J.P., Bamba, F., Mahe, G., Toure, M., and Olivry, J.C, " Evolution récente des ressources en eau de l’Afrique atlantique.," Revue des sciences de l’eau, vol. 10(3). 321-337. 1997.
[19] Malou, R. Ngom. F.D. and Dacosta, H. "Impact du changement climatique sur les ressources en eau au Sénégal," in 5ème Conférence Inter-Régionale sur l'Environnement et l'Eau Valorisation et Gestion Durable des Systèmes Hydriques pour une Santé et une Productivité Améliorée dans les Régions Chaudes, Ouagadougou, EIER-ETSHER-CIGR. 56-65.
[20] Ngom, F.D., Caractérisation des transferts hydriques dans le bassin de la Néma au Sine Saloum. Doctorat de 3ème Cycle, Département de Géologie, Université Cheikh Anta Diop, Dakar, 2000.
[21] Moon, S., Woo, N.C., and Lee, K.S, "Statistical analysis of hydrographs and water-table fluctuation to estimate groundwater recharge," Journal of Hydrology, vol. 292. 198-209. 2004.
[22] Schoeller, H., Les eaux souterraines. Paris: Eds. Masson, 1962. [23] Kortatsi, B.K. "Hydrochemical characterization of groundwater in
the Accra plains of Ghana," Environ Geol vol. 50. 299-311. 2006. [24] Kattan, Z., "Characterization of surface water and groundwater in
the Damascus Ghotta basin: hydrochemical and environmental isotopes approaches," Environ Geol, vol. 51. 173-201. 2006.
[25] Garcia, M.G., Hidalgo, M.V., and Blesa, M.A, "Geochemistry of groundwater in the alluvial plain of Tucumàan province, Argentina," Hydrogeology Journal, vol. 9. 597-610. 2001.
[26] Demetriades, A., "General ground water geochemistry of Hellas using bottled water samples," Journal of Geochemical Exploration vol. 107. 283-298. 2010.
[27] Diédhiou, M., Approche multitraceur géochimique et isotopique à l'identification des sources de la pollution nitratée et des processus de nitrification/dénitrification dans la nappe de Thiaroye. Doctorat Hydrogéologie, Univ Cheikh Anta Diop, Dakar. 2011.
[28] Magaritz, M., Nadler, A., Koyumdjiski, H., and Dan, J., "The Use of Na/Cl Ratios to Trace Solute Sources in a Semiarid Zone," Water Resources Research, vol. 17( 3). 602-608. 1981.
[29] Trabelsi, R., Zairi, M., Smida, H., and Ben Dhia, H., "Salinisation des nappes côtières : cas de la nappe nord du Sahel de Sfax, Tunisie," C. R. Geoscience vol. 337. 515-524. 2005.
[30] Appelo C.A.J., and Postma, D., Geochemistry, Groundwater and Pollution, 2nd eds. Rotterdam: A.A. Balkema, 2005.
[31] Kouzana, L., Mammou, B.A., and Felfoul, S. M., "Seawater intrusion and associated processes: Case of the Korba aquifer (Cap-Bon, Tunisia)," C.R. Geoscience, vol. 341. 21-25. 2009.
[32] Pulido-Leboeuf, P., Pulido-Bosch, A., Calvache, M.L., Vallejos, A., and Andreu, J.M, "Strontium, SO4
2-/Cl- and Mg2+/Ca2+ ratios as
tracers for the evolution of seawater into coastal aquifers: The example of Castell de Ferro aquifer (SE Spain)," C.R. Geoscience, vol. 335. 1039-1048. 2003.
[33] Kouzana, L., Mammou, B.A., and Gaaloul, N., "Intrusion marine et salinisation des eaux d'une nappe phréatique côtière (Korba, Cap-Bon, Tunisie)," Geo-Eco-Trop, vol. 31. 57-70. 2007.
[34] Trabelsi, R., Zairi, M., Smida, H., and Dhia, B.H., "Salinisation des nappes côtières : cas de la nappe Nord du Sahel de Sfax, Tunisie.," C.R. Geoscience, vol. 337. 515-524. 2004.