Embed Size (px)
Citation preview
1
Hydrodynamics and Local Turbulent Mixing of Submerged,
Parallel Liquid Jets - Experiments and CFD simulations
Shuxian Jiang,† Jiajun Wang,*,† Lian-Fang Feng,† Marc-Olivier Coppens*,‡
†State Key Laboratory of Chemical Engineering, College of Chemical and Biological Engineering, Zhejiang
University, Hangzhou 310027, PR China
‡Department of Chemical Engineering, University College London, Torrington Place, WC1E 7JE London, UK

2
ABSTRACT: The hydrodynamics and local turbulent mixing of parallel multiple liquid jets, submerged in liquid,
were investigated by means of experiments and computational fluid dynamics (CFD). A renormalization group
(RNG) k-e turbulence model was used to simulate the flow field. The model was validated experimentally by
particle image velocimetry (PIV) measurements. In the converging region adjacent to the nozzle exits, the
recirculation region disappears, and there is only ambient fluid entrainment. Different jet arrays were compared
to evaluate the effects of jet spatial arrangement on the hydrodynamics and mixing performance. A shorter mixing
length in the merging region suggests that mixing is more efficient in the triple jet system than in other jet systems.
Compared with the jet Reynolds number, the jet spacing plays a more significant role in determining the critical
mixing regions, while the linear relationship between them is more sensitive than that for multiple parallel plane
jets.
Keywords: submerged multiple jets, hydrodynamics, CFD, PIV, turbulent mixing
1. INTRODUCTION
Multiple jets of liquids or gases appear in a variety of engineering and industrial applications, e.g. fluid mixing,
combustion burners,1 fuel injection systems and air suppliers of ventilation systems2, 3. In the production of
difluoromethane through a liquid-phase method, due to the strongly corrosive nature of the reactant hydrofluoric
acid, the mixing of reactants is achieved by liquid phase injection instead of mechanical mixing.4 As for
aeronautics and astronautics engineering, when the aircraft takes off vertically, it is necessary to consider the
impact of take-off and landing jets on the fuselage and the ground.5 Parallel multiple jets can provide shear flows
in nuclear reactors as well; thus, the mixing of parallel jets with different temperature plays an important role in
the design and operation of fast breeder nuclear reactors.6
A parallel, plane twin-jet system usually consists of two identical plane slots with the same width and jet
spacing.7 Miller and Comings were probably the first to systematically study the basic flow structure and
interaction mechanism of parallel, plane twin jets with a side wall.8 Subsequently, Tanaka investigated the
influence of jet spacing on the flow structure of the parallel plane twin jets.9, 10 The flow field of parallel plane

3
twin jets consists of three parts: converging, merging and combined regions (Figure 1). The potential core is the
region in the jet in which the centerline velocity remains essentially constant and equal to the injection velocity.
The region from the nozzle exits to the point where the inner shear layers of the jets start to merge is called the
converging region. The characteristic for this region is the mutual entrainment between the twin jets, which
induces a pair of stable vortices with opposite direction and negative velocity in the area between the twin jets.
The sub-atmospheric static pressure causes the axis of each jet to bend, and the twin jets eventually merge into
one. The merge point (MP) is the intersection of the twin jets’ centerlines, where the pressure increases suddenly,
due to the expulsion of flow in different directions. The combine point (CP) is the point where the jets’ central
streamlines begin to coincide, and it is characterized by the maximum value of the velocity. The region between
MP and CP is called the merging region and is characterized by a steep increase in velocity. The combined region
refers to the region downstream of CP, and the velocity profile of the twin jets begins to resemble that of a single
jet.
Figure 1. General flow field of parallel plane twin-jet system. Lin and Sheu obtained an empirical correlation between jet spacing and merge point (MP) location by regression
analysis. It should be noted that only when the jet spacing is large enough, the jet inlet conditions can be ignored,
and the formula can achieve a prediction accuracy of ±12%.11 The interaction mechanism of parallel plane twin
uj
uj
d
d
s CPMP
Combined Region
Merging Region
Converging Region
y
O z
Umax Umax_center
Combined jet
Outer mixing region
Potential core region
Inner mixing region
Inner shear layer
Outer shear layer

4
jets with different inlet velocities was studied by direct flow visualization and particle image velocimetry (PIV)
measurements at a small spacing ratio, s/d = 3 (where s is the spacing between the jets, and d is the inner diameter
of the jet tube), and a low jet Reynolds number, 1200.12 The results indicate that with decreasing velocity ratio of
the jets, the interaction between the jets is weakened. The mixing phenomenon of the twin underexpanded gas jet
systems was investigated using computational fluid dynamics (CFD) simulations.13 It showed that the jet
deflection degree is determined by the jet spacing, pressure ratio, and turbulent intensity, and the merge point
location of the twin jet flows is affected by both the jet spacing and the jet exit pressure ratio. Compared with
twin jets, there is much less research on triple jet flow systems, and the current research focus is to evaluate the
thermal mixing effect by numerical simulation. Durve et al. compared the mixing efficiency of parallel plane
single jet, twin jets and triple jets by CFD simulations; they found that a triple jet system can provide more
efficient mixing than the other ones.14 They also investigated the influence of jet spacing and injection velocity
ratio on the positions of characteristic points. Unlike the relationship proposed by Lin and Sheu11, they took the
effect of the injection condition into consideration, so that the positions of merge point (MP) and combine point
(CP) could be predicted for the case of small jet spacing (s/d < 30). For cases with more than three jet points,
Svensson et al. found that both jet spacing and jet array size have a significant influence on the jet-to-jet
interactions and the development of the confluent jet arrays flow field.15
For the experimental research of multiple parallel jets, the main measurement techniques currently used are
hot-wire anemometry (HWA), laser Doppler velocimetry (LDV) and PIV. A hot-wire anemometer could interfere
with the results due to the probe intervening in the flow field, while PIV and LDV are non-intrusive measuring
techniques. The mean velocity field measured by PIV and LDV agree very well with one another.16 The flow
field of multiple parallel jets has also been studied numerically, using CFD simulations, which have been validated
experimentally. The k–e�model was shown to lead to acceptable predictions of the velocity field. Anderson and
Spall have investigated the two-dimensional parallel twin jet flow field. They compared the results obtained by
the standard k–e (SKE) and RSM turbulent model with HWA experimental results; simulations could accurately
predict the locations of the MP and CP, when the normalized jet spacing was s/d = 9, 13 or 18.25, and the jet
Reynolds number was 6000.17 Faghani and Rogak introduced the bending model to predict the combination of

5
twin parallel plane jets for a wide range of jet spacing and injection angles; the model could predict the locations
of the MP and CP appropriately, when compared with experimental results.18
In the literature, the triple jets were generally arranged in a single row.19, 20 For parallel multiple jets with
different spatial arrangements, only the jet array size has been discussed, but the jet interaction under different
spatial arrangements of jets remains to be explored.15, 21, 22 Due to three-dimensional effects, submerged circular
jets are different from a parallel plane twin jets. The former is more widely used in industry. Therefore, CFD
simulations and PIV experiments are used in this work to explore the hydrodynamics of twin jets, triple jets and
quad jets for submerged, three-dimensional circular jets. The current investigation focuses on demonstrating the
characteristic features of the submerged multiple jet flow field and revealing the influence of the spatial
arrangement of multiple jets on characteristic flow regions. The effects of other significant parameters, such as
jet spacing, jet Reynolds number and tube diameter, are also studied to predict the characteristic regions and
correlate them with jet spacing.
2. EXPERIMENTAL PROCEDURE
2.1. Experimental setup. A diagram of the experimental setup with submerged multiple circular jets is shown
in Figure 2a. It consists of a flat bottom Perspex cylindrical tank with internal diameter D = 0.32 m and height H
= 0.32 m. The cylindrical tank was placed inside a 0.35 m × 0.35 m × 0.35 m cubic tank filled with water, in order
to reduce distortion of the optical measurements that is induced by the curved cylindrical surface when conducting
PIV measurements. The jet tubes were fabricated by 3D printing, using polylactic acid (PLA), with inner diameter
d = 3 mm. The clearance between each jet and the geometric center of the multiple jets was maintained at c/d =
2.5. Three kinds of jet tube arrangements were investigated, as shown in Figure 2b, c and d. The tubes were axi-
symmetrically distributed. The submerged tube length, l = 0.08 m. The Cartesian coordinate system has its origin
at the center of the plane in which the nozzles are located.
Tap water at a temperature of 20oC, as the working fluid, enters the tank via multiple jets, overflows from the
tank and re-enters the tank via the jets. The flowmeter was used to control the flow rate of each inlet to 25 L/h,
while the corresponding jet velocity, uj = 1.0 m/s, and jet Reynolds number, Rej = 3000.

6
Figure 2. (a) Experimental setup of the submerged multiple jet system; top view of multiple jets array for (b)
twin jets, (c) triple jets, (d) quad jets.
2.2. PIV measurements. The 2D particle image velocimetry (PIV) system (Dantec Dynamics A/S) used in this
work consists of a dual Nd:YAG 532 nm pulsed laser (New Wave Research Solo, 200 mJ), a frame-straddling
CCD camera with 1600×1200 pixels resolution and a synchronizer. The flow was seeded with polystyrene
particles (about 10 μm diameter) with a density of 1050 kg/m3. The measurement area was 100 × 160 mm2 in the
x and z directions. A cross-correlation algorithm was applied to the 64 × 128 pixels interrogation windows with
50% and 75% overlap for the x direction and z direction, respectively. This setting gives a spatial resolution of
3.2 mm. The DynamicStudio software (Dantec Dynamics A/S) was used to obtain the instantaneous velocity
distribution. The time difference between laser pulses was set at 1500 µs. The statistical reliability of the selection
of the number of image pairs was tested, by comparing the mean velocity profiles between 300, 400, 500 and 600
image pairs. The difference between the latter two was less than 1%, so that a total of 500 image pairs was
captured in the various configurations.
3. SIMULATIONS
3.1. Governing equations. The mass conservation equation is as follows:
(1)
Pressure outlet
Wall
Velocity inlet
x
yz
O
c
c
c
(b)
(c)
(d)l
(a)
( ) 0utr r¶+Ñ× =
¶
!

7
The Reynolds-Averaged Navier-Stokes Equations for three-dimensional flows is given by:
(2)
where t is the flow time, is the velocity vector and p is the pressure.
3.2. Turbulence model. The k and e equations of renormalization group k-e (RNG) model23 are the same as
for the standard k-ε model (SKE); the only difference is that the coefficients are not based on experimental results,
but derived from theoretical analysis. The RNG model can handle flows with higher strain rate and a larger degree
of streamline bending than the SKE model. The turbulence kinetic energy, k, and turbulence dissipation rate, e,
are given by eq 3 and eq 4, respectively:
(3)
(4)
with:
(5)
where μt is the turbulent viscosity. The modified coefficients of the RNG model are defined as follows:
(6)
where η = Sk/ε and S is the modulus of the mean rate-of-strain tensor, S = (2SijSij)1/2. The values for the closure
coefficients used in the RNG model are: Cμ = 0.0845, sk = 0.7194, se = 0.7194, Cε1 =1.42, Cε2 = 1.68, η0 = 4.38,
and β = 0.012.
3.3. Simulation method. Gambit 2.4.6 (ANSYS Inc.) was used to create the geometry and grids. The
computational domain was discretized into unstructured grid cells, while the mesh near each nozzle was refined,
and a boundary layer was added to the tank wall (Figure 3a). Three different average mesh sizes were tested to
confirm grid independence. From Figure 3b, the case with average mesh size 7.5 mm (734,007 cells) showed a
ρ(∂u!
∂t+ u!⋅∇u!) = −∇p +∇⋅ µ(∇u
!+∇T u!)⎡
⎣⎤⎦
u!
( ) ( ) [( ) ]tk
k
k ku k Pt
µr r µ res
¶+Ñ × = Ñ × + Ñ + -
¶
!
2*12( ) ( ) [( ) ]t
kCu P C
t k ke
ee
µ e ere re µ e rs
¶+Ñ× =Ñ× + Ñ - -
¶
!
2k tP Sµ=
3* 02 2 3
(1 )1
CC C µ
e e
h h hbh-
= ++

8
very close velocity profile to the result with average mesh size 5 mm (2,106,904 cells). The average mesh size
7.5 mm was, therefore, adopted.
Figure 3. (a) A cross-section of the computational grid at y = 0; (b) axial velocity profile for grid-independence
check (z = 0.02 m, y = 0 m).
The numerical simulations were conducted using the commercial software package ANSYS Fluent 15.0. For
this analysis, a pressure-based solver was used. The tank walls, bottom and tube walls were treated as no-slip
boundaries with a standard wall function. A velocity inlet boundary condition was defined for the outlets of the
jet tubes, and the pressure outlet boundary condition was set for the top of the tank. The second-order upwind
method was adopted for the spatial discretization of momentum, pressure and turbulence kinetic energy equations.
The SIMPLEC method was used as the method to couple the continuity and momentum equations. The flow field
was simulated at steady state. The working fluid was water (density r = 998.2 kg/m3, viscosity µ = 0.001 Pa×s, at
a temperature of 20 oC).
After obtaining the steady-state flow field results, unsteady simulations were conducted to solve the species
transport equation for predicting the mixing process. At t = 0 s, the dye was injected into the tank. The time step
of the unsteady simulation was fixed at 0.005 s. The solution was considered to have converged when the residual
was less than 10-6. The calculation was stopped when the physical flow time reached 2.0 s. The dye was given the
same physical properties of water, except for the diffusion coefficient of the dye in water, which was set at 1.0 x
10-10 m2/s, according to the experimental results reported by Lee et al.24
0.000 0.005 0.010 0.015 0.020 0.025-1.0
-0.8
-0.6
-0.4
-0.2
0.0
Mesh size 5 mm 7.5 mm 10 mm
u z (m
/s)
x (m)
(a) (b)

9
4. RESULTS AND DISCUSSION
4.1. Validation of the CFD simulation method. To validate the CFD simulation results, the axial velocity
profiles computed by the RNG turbulent model were compared to the PIV experimental data for twin, triple and
quad jet flow. Launder and Sharma’s low Reynolds turbulence model (LRM-LS)25 and the Reynolds stress model
(RSM) were also examined in this study. This comparison is shown in Figure 4.
Figure 4. Axial velocity profiles: comparison of CFD results with PIV data for twin (a), triple (b) and quad (c)
jet flow along the center line x = 0, y = 0 (Rej = 3000, c/d = 2.5, d = 3 mm).
It can be observed that both the RNG turbulent model and LRM-LS showed satisfactory agreement with the
PIV experimental data. The RNG model has also been adopted by Sharif and Mothe to simulate the flow field of
turbulent slot jet impingement from concave cylindrical surfaces, with jet-exit Reynolds number = 3000, 6000,
9000 and 12000, and it produced satisfactory hydrodynamic flow field predictions compared to the experimental
data26.
4.2. Hydrodynamics of twin jets, triple jets and quad jets. The CFD simulated flow fields of three parallel
multi-jet systems are compared with that of single jet in Figure 5.
0 10 20 30 40 50-0.4
-0.3
-0.2
-0.1
0.0
Twin Jets
u z (m
/s)
z/d
PIV CFD-RNG-k-e CFD-LRM-LS CFD-RSM
0 10 20 30 40 50-0.4
-0.3
-0.2
-0.1
0.0
Quad Jets
u z (m
/s)
z/d
PIV CFD-RNG-k-e CFD-LRM-LS CFD-RSM
0 10 20 30 40 50-0.4
-0.3
-0.2
-0.1
0.0
u z (m
/s)
z/d
PIV CFD-RNG-k-e CFD-LRM-LS CFD-RSM
Triple Jets
(a) (b) (c)

10
Figure 5. Influence of the spatial arrangement of multiple jets on (a) the velocity contours (rotated 90o to the left)
and (b) the axial velocity profile (c/d = 2.5, Rej = 3000, d = 3mm, in the axial plane y = 0).
The initial region is followed by the merging of the jets, due to mutual entrainment between them. The position
where the different jets start to interact can be determined by the velocity contours. In the downstream region, um
and x1/2 are used to normalize the axial velocity profile, in which um is the local maximum axial velocity of the
axial velocity profile and x1/2 is the half-width of the velocity, that is, at x = x1/2, uz = um/2. The flow structure of
the combined jet exhibits all characteristics of a single jet flow.8 Figure 5b shows that, for Line 1 and Line 2, the
velocity profiles for the triple jets and the quad jets are similar and symmetrical, which is similar to that of a
single-jet system.
-2 -1 0 1 20.0
0.5
1.0
u z/u
m
x/x1/2
Line 1 Line 2
0.0
0.5
1.0
u z/u
m
Line 1 Line 2
Line 1 Line 2
z/d
uz/uj
(a) (b)
Twin jets
Triple jets
Quad jets
Twin jets
Triple jets
Quad jets
0 10 20 30 40-8
-4
0
4
8
x/d
-8
-4
0
4
8
x/d
-8
-4
0
4
8
x/d
0.0
0.5
1.0 Line 1
u z/u
m Line 2
-8
-4
0
4
8
x/d
Single jet
0.0
0.5
1.0
u z/u
m
Line 1 Line 2
Single jet

11
Figure 6. Flow field characteristics of quad jets: (a) normalized axial velocity and pressure profile along the
central axis, x = 0, y = 0; (b) velocity vector field in the axial slice, y = 0 (c/d = 2.5, Rej = 3000, d = 3 mm). MP
is the merge point and CP is the combine point.
The flow field results for quad jets illustrate the characteristics of submerged parallel multiple jet flow fields.
Figure 6a shows the characteristic profiles of the normalized axial velocity, uz/uj, and the normalized pressure,
<p> = p/(Nρuj2/2), along the axial plane, y = 0, while Figure 6b shows the velocity vectors and pressure contour
for the quad jet flow.
From Figure 6, it can be seen that the velocity increases slowly in the direction of the stream, in the vicinity
between two jet nozzles (z/d < 5). Different from the case of parallel plane twin jets, the tubes were placed
underwater; the flow in the region between the multiple jets is not caused by a pair of systematically contra-rotary
stable vortices8, but mainly by the entrainment of the ambient fluid, which can also be illustrated by the velocity
vector field. The instantaneous velocity field obtained by Aleyasin and Tachie indicated no unsteady vortex in
the recirculation region of a submerged twin circular jet system.27 The work of Vouros and Panidis also proved
that for a system with one developed turbulent axisymmetric jet and a second, parallel, circular jet with a flow at
low Reynolds number, the recirculation region between the jets will be much weaker or not occur at all.28
Due to the disappearance of the negative velocity region between jets, the merge point should be defined in a
different way from parallel plane jets. In the experimental data reported by Tanaka9 for parallel plane jets, it can
be observed that when the distance between the jet tubes is small, the locations of the free stagnation point and
maximum pressure are very close. For the case of c/d = 4.25, the merge point determined at maximum pressure
<p>
0 5 10 15 20 250.00
0.05
0.10
0.15
0.20
0.25
0.30
u z/u
j
z/d
Combine point
Merge point
-1.0E-03
-5.0E-04
0.0E+00
5.0E-04
1.0E-03
1.5E-03
2.0E-03
<p>
(a)z/d
MP CPx/d
(b)

12
is 4.8% larger than that at the free stagnation point; when c/d increases, the difference between the two points
becomes apparent. Therefore, in the present study, the merge point is defined by the point corresponding to the
maximum pressure. For quad jets, zMP = 9.9d (Figure 6a). For triple jets, MP was found to be further away and
close to that of twin jets: for twin jets, zMP = 13.9d and for triple jets, zMP = 13.0d.
At the combine point (CP), the axial velocity reaches its maximum value (Figure 6a), while the pressure decays
rapidly between MP and CP (Figure 6a). Beyond CP, both axial velocity and pressure decay slowly. The jets are
now merged into one jet, with flow characteristics similar to those of a single jet.
The profiles of the circumferentially averaged axial velocity are presented in Figure 7. When the curve of the
mean velocity profile at different axial positions, z/d, tends to a Gaussian distribution, the position can be
determined as the combine point (CP). For twin jets, triple jets and quad jets, zCP/d is 18.9, 15.4 and 14.6,
respectively. A twin-jet system requires a longer time to achieve complete mixing between the jets than triple and
quad jet systems, while the time for triple jets is comparable to that for quad jets.
Comparison of the three different jet systems shows that the mixing process in twin and triple jet systems begins
at a similar downstream distance, further than that in a quad jet system, while triple and quad jet systems require
a shorter region for complete mixing between jets. It should be noted that the triple jet system has the shortest
distance between merge point and combine point (zCP-zMP = 2.4d), which means fast mixing and a high velocity
decay rate.

13
Figure 7. Circumferentially averaged axial velocity <uz> profiles for single jet (a), twin jets (b), triple jets (c) and
quad jets (d) (d = 3 mm, c/d = 2.5, Rej = 3000).
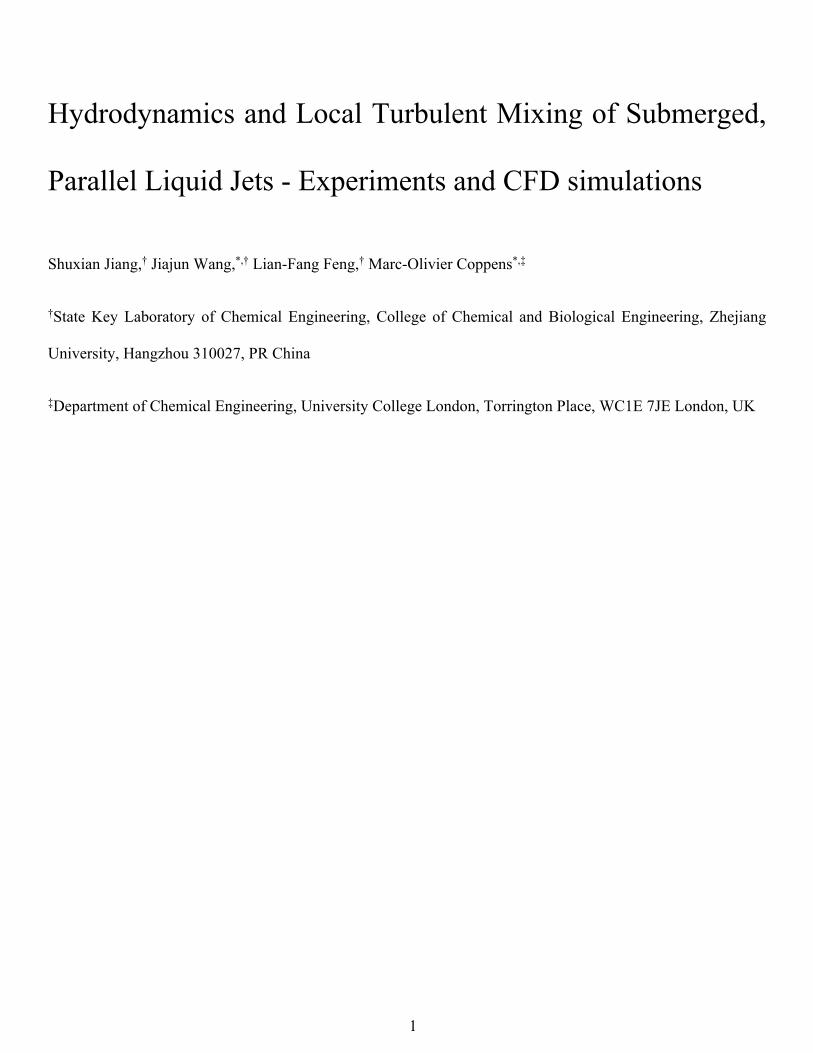
For multiple jets, before the jets combine into one, their half velocity width can be divided into –x1/2 and +x1/2,
depending on whether they are located in the inner shear layers or outer shear layers (Figure 8a). It is clear from
Figure 8b that in the region adjacent to the exits of the tubes, the spread of the inner shear layers of quad jets is
faster than the other two. The end point of the distribution of –x1/2 indicates that the shear layers have disappeared,
and the jets have merged. The distributions of outer shear layer half-velocity widths are shown in Figure 8c. Due
to the combination of the jets, there is a turning point for twin jets and triple jets; after this turning point, the
slopes of the lines suddenly increase. However, this turning point is not evident for quad jets. In the region
adjacent to the exits of the jet tubes, the difference between the lines is not obvious, which reveals that the
spreading rates of the outer shear layers are close to each other for different arrangements of jets in the converging
region and the merging region. However, in the combined region, the outer shear layers’ spreading rate for triple
jets is higher than for quad jets.
0 2 4 6 8 100.0
0.1
0.2
0.3
0.4
<uz>
r/uj
r/d
2.5 5 7.5 10 12.5 15 17.5 20
Quad jets z/d
0 2 4 6 8 100.0
0.1
0.2
0.3
0.4
<uz>
r/uj
r/d
2.5 5 7.5 10 12.5 15 17.5 20
Triple jets z/d
0 2 4 6 8 100.0
0.2
0.4
0.6
0.8
1.0
<uz>
r/uj
r/d
2.5 5 7.5 10 12.5 15 17.5 20
Single jet z/d
(a) (b)
(c) (d)
0 2 4 6 8 100.0
0.1
0.2
0.3
0.4
<uz>
r/uj
r/d
2.5 5 7.5 10 12.5 15 17.5 20
Twin jets z/d
14
Figure 8. (a) Definition of the inner shear layer half-velocity width, –x1/2, and outer shear layer half-velocity
width, +x1/2; (b) profiles of inner shear layer half-velocity widths, (c) profiles of outer shear layer half-velocity
widths (d = 3 mm, c/d = 2.5, Rej = 3000).
The characteristics of the submerged, multiple-jet flow fields are summarized in Figure 9. These flow fields
consist of three regions. The main difference between the flow fields of a submerged multi-jet system and a
parallel plane jet system (Figure 1) occurs in the converging region. For submerged multiple jets, the high jet
velocity leads to a negative pressure and the entrainment of ambient fluid.
Actual mixing and interaction between the jets occurs in the merging region.14 In this region, because of
increased interaction between the jets, the streamwise velocity increases in the direction of flow. The process of
the mixing between jets begins at the merge point and is virtually completed at the combine point; therefore, the
length of the merging region is called the mixing length.
-10.0 -7.5 -5.0 -2.5 0.0 2.5 5.0 7.5 10.00.0
0.2
0.4
0.6
0.8
1.0
-x1/2 +x1/2
u z
/uj
x/d
um
2 4 6 8 10 120.0
0.5
1.0
1.5
2.0
2.5
3.0
-x1/
2/d
z/d
Twin jets Triple jets Quad jets
2 4 6 8 10 12 14 16 18 200
1
2
3
4
5
+x1/
2/d
z/d
Single jet Twin jets Triple jets Quad jets
(b) (c)(a)
0.5um

15
Figure 9. Schematic flow fields of submerged multiple jets.
4.3. Mixing performance of twin jets, triple jets and quad jet flow. In order to compare the mixing
performance of different multiple-jet system, the total flow rate was controlled to be the same, Q = 0.17 m3/h, and
Rej = 10000, 6666.7, 5000 for twin, triple and quad jets, respectively. Based on the results of steady flow field,
unsteady CFD simulations were conducted to solve the species transport equation and quantify the mixing
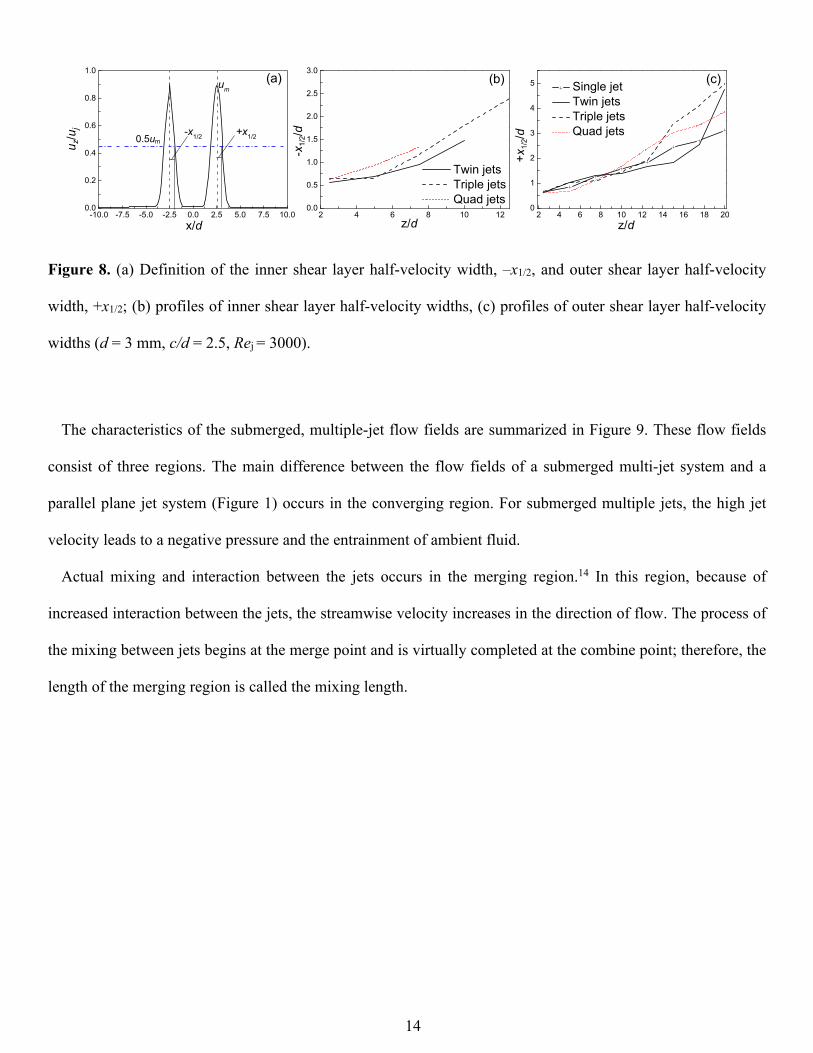
process. Figure 10 shows the mass fractions in the cloud of dye, which was released at the jet inlet, for twin, triple
and quad jets flows.
uj
d
s
uj
d
y
Oz
Umax
Umax_center
Combined Region
Merging Region
Converging Region
Combined jet
Outer mixing region
Potential core region
Inner mixing region
CPMP
16
Figure 10. Mass fractions in the cloud of dye, released at the jet inlet, wDye, simulated by CFD at (a) 0.1 s and (b)
0.4 s (d = 3 mm, c/d = 2.5, Q = 0.17 m3/h).
It can be seen that, at t = 0.1 s, the dye cloud diameter of quad jets is larger than the other ones, which is affected
by the arrangement of the jets. At t = 0.4 s, due to the transport of dye, the dye cloud diameter in the combined
region of triple jets is larger than that in the quad jets. Due to the higher spreading rate of the outer shear layers,
as shown in Figure 8, triple jets are more strongly entrained and better mixed with ambient fluid in the combined
region.
In order to quantitatively compare the spreading rates of the dye cloud for the three multiple jet systems in the
initial mixing stage, the dye cloud volume is defined as the region containing more than or equal to 10% mass
fraction of dye. The definition of the normalized dye cloud volume, <Vdye>, is as follows:
(7)
where Vm is the volume of mesh cell m, Vtotal is the effective volume of the tank; in addition, I = 1 when wm ³
10%, and I = 0 when wm < 10%, where wm is the dye mass fraction in mesh cell m.
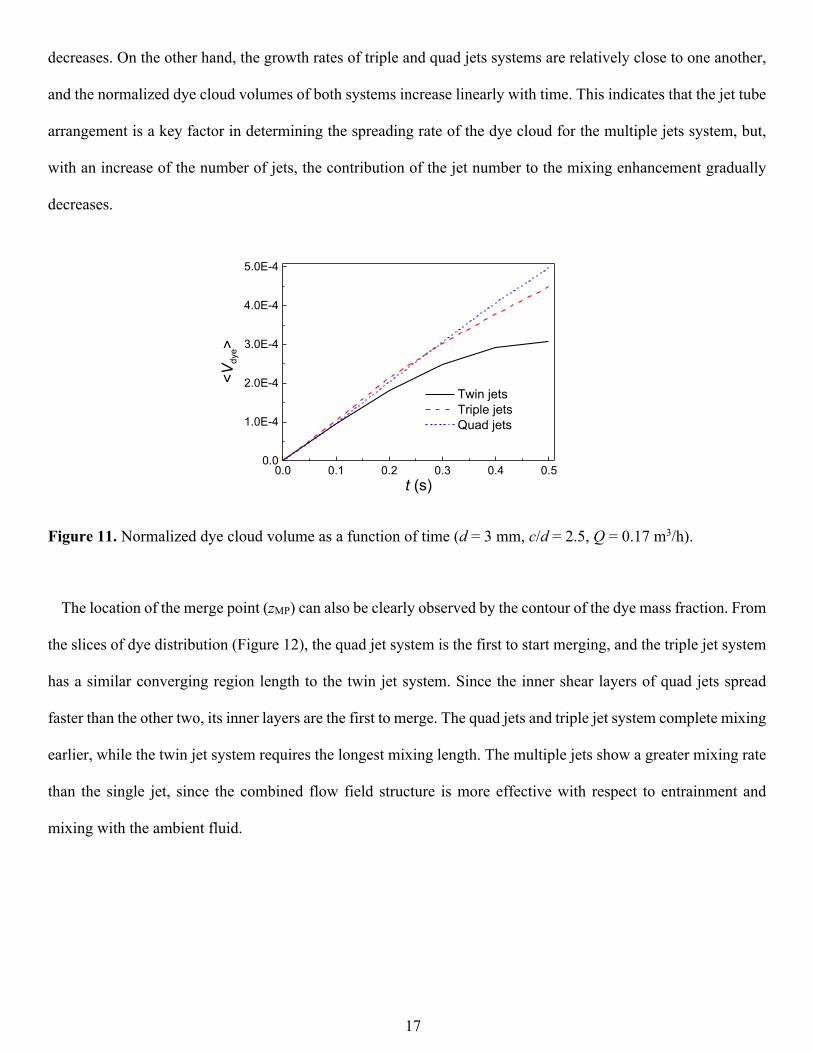
The results for the normalized dye cloud volume as a function of time are shown in Figure 11. For the same
total flow rate, although the twin jets system has the largest inlet velocity and Reynolds number, the growth rate
of the normalized dye cloud volume is the smallest, and, with increasing flow time, the growth rate gradually
y
xz
00.05
0.100.15
0.20(m)
(a)
Twin jets
Triple jets
Quad jets
Twin jets
Triple jets
Quad jets
wDye
(b)
1
N
mm
dyetotal
IVV
V=< >=å
17
decreases. On the other hand, the growth rates of triple and quad jets systems are relatively close to one another,
and the normalized dye cloud volumes of both systems increase linearly with time. This indicates that the jet tube
arrangement is a key factor in determining the spreading rate of the dye cloud for the multiple jets system, but,
with an increase of the number of jets, the contribution of the jet number to the mixing enhancement gradually
decreases.
Figure 11. Normalized dye cloud volume as a function of time (d = 3 mm, c/d = 2.5, Q = 0.17 m3/h).
The location of the merge point (zMP) can also be clearly observed by the contour of the dye mass fraction. From
the slices of dye distribution (Figure 12), the quad jet system is the first to start merging, and the triple jet system
has a similar converging region length to the twin jet system. Since the inner shear layers of quad jets spread
faster than the other two, its inner layers are the first to merge. The quad jets and triple jet system complete mixing
earlier, while the twin jet system requires the longest mixing length. The multiple jets show a greater mixing rate
than the single jet, since the combined flow field structure is more effective with respect to entrainment and
mixing with the ambient fluid.
0.0 0.1 0.2 0.3 0.4 0.50.0
1.0E-4
2.0E-4
3.0E-4
4.0E-4
5.0E-4
<Vdy
e>
t (s)
Twin jets Triple jets Quad jets

18
Figure 12. Dye mass fraction (wDye) distribution at frame t = 0.4 s for (a) single jet, (b) twin jets, (c) triple jets
and (d) quad jets (d = 3 mm, c/d = 2.5, Q = 0.17 m3/h). Images are rotated 90o to the left.
Comparing the contours of turbulence kinetic energy, k, and dye mass fraction, wDye (Figure 13), shows that
turbulence and local mixing are weak in the core region of the jets, close to the nozzles, thus the dye mass fraction
is high there. Within the outer mixing regions, the jet flows entrain and mix with the ambient fluid, and the
turbulence is more intense than that in the potential core region of the jets. Also, the value of turbulence kinetic
energy in the outer shear layers is larger than that in the inner shear layers, which means that turbulence is more
intense in the outer shear layers and the interaction between the jets and ambient flow is stronger. Around the
merge point (MP), the jets start to interact, which is reflected in an increase in turbulence kinetic energy and dye
concentration in the central region, x = 0.
Figure 13. Contour of turbulence kinetic energy, k (a), and dye mass fraction, wDye (b), for triple jets at t = 0.4 s
(d = 3 mm, c/d = 2.5, Q = 0.17 m3/h, in the plane y = 0).
xz
y
wDye1.00
0.75
0.50
0.25
0.00
(a)
(c)
(b)
(d)
x/d
z/d
x/d
wDye
k (J/kg) (a)
400 10 20 30-10
-5
0
5
10-10
-5
0
5
10
(b)
19
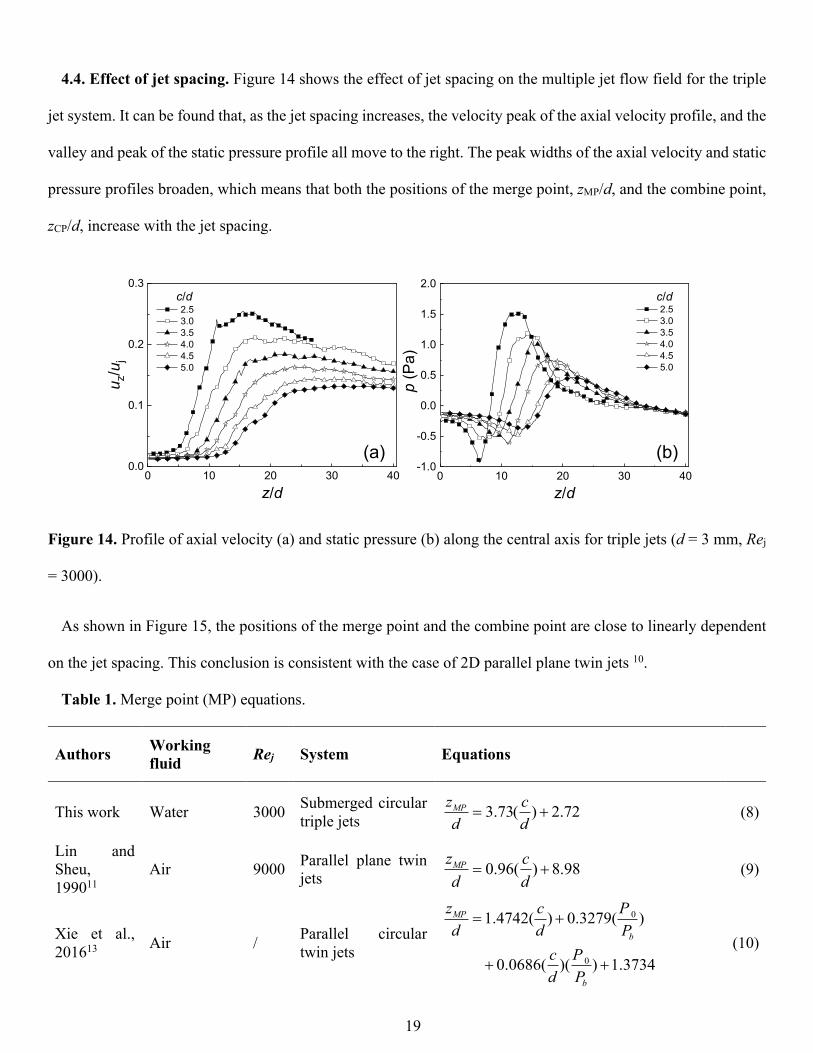
4.4. Effect of jet spacing. Figure 14 shows the effect of jet spacing on the multiple jet flow field for the triple
jet system. It can be found that, as the jet spacing increases, the velocity peak of the axial velocity profile, and the
valley and peak of the static pressure profile all move to the right. The peak widths of the axial velocity and static
pressure profiles broaden, which means that both the positions of the merge point, zMP/d, and the combine point,
zCP/d, increase with the jet spacing.
Figure 14. Profile of axial velocity (a) and static pressure (b) along the central axis for triple jets (d = 3 mm, Rej
= 3000).
As shown in Figure 15, the positions of the merge point and the combine point are close to linearly dependent
on the jet spacing. This conclusion is consistent with the case of 2D parallel plane twin jets 10.
Table 1. Merge point (MP) equations.
Authors Working fluid Rej System Equations
This work Water 3000 Submerged circular triple jets
(8)
Lin and Sheu, 199011
Air 9000 Parallel plane twin jets (9)
Xie et al., 201613 Air / Parallel circular
twin jets (10)
0 10 20 30 400.0
0.1
0.2
0.3
u z/u
j
z/d
2.5 3.0 3.5 4.0 4.5 5.0
c/d
0 10 20 30 40-1.0
-0.5
0.0
0.5
1.0
1.5
2.0
2.5 3.0 3.5 4.0 4.5 5.0
p (P
a)
z/d
c/d
(a) (b)
3.73( ) 2.72MPz cd d
= +
0.96( ) 8.98MPz cd d
= +
0
0
1.4742( ) 0.3279( )
0.0686( )( ) 1.3734
MP
b
b
z c Pd d P
c Pd P
= +
+ +

20
Durve et al., 201214 Air 2100
0 Parallel plane twin jets (11)
where P0 is the total pressure, Pb is the back pressure, and I is the turbulent intensity of the injected fluid.
Table 2. Combine point (CP) equations.
Authors Working fluid Rej System Equations
This work Water 3000 Submerged circular triple jets
(12)
Xie et al., 201613 Air / Parallel circular
twin jets (13)
Durve et al., 201214 Air 21000 Parallel plane twin
jets (14)
For the merge point (Table 1 and Figure 15a), the slope for liquid triple jets is 3.73. For the combine point
(Table 2 and Figure 15b), the slope of liquid triple jets is 6.19. Both are steeper than the slopes reported for parallel
plane twin jet systems. This means that in a three-dimensional multi-jet system, the characteristic points of the
flow field are more sensitive to jet spacing. In addition, it can be observed in Figure 15a that the literature data
reported by Zang et al.29 for three dimensional submerged twin jets are close to this work. Therefore, the
sensitivity to jet spacing can be attributed to the difference in spatial dimension. Compared with 2D jet systems,
the interaction between jets in 3D systems becomes weaker, since the jets only interact with the ambient flow in
the inner shear layers. The different definition of MP might also contribute to the difference in slope.
It should be noted that the ratio of the slope of zCP/d to the slope of zMP/d is 1.66, which is quite close to the
ratio for a gas parallel plane twin jet system, which is 1.71-1.72 13, 14.
1.442( ) 2.06( ) 2.453MPz c Id d
= + -
6.19( ) 0.67CPz cd d
= -
0
0
2.5348( ) 0.2342( )
0.4114( )( ) 4.0803
CP
b
b
z c Pd d P
c Pd P
= +
+ +
2.462( ) 2.06( ) 2.453CPz c Id d
= + -

21
Figure 15. Variation in the positions of the merge point, MP (a), and the combine point, CP (b), as a function of
the normalized distance of the nozzles to the central axis, c/d, for triple jets. Comparison with data from the
literature for other jet systems.
4.5. Effect of the jet Reynolds number. First of all, the effect of the ratio of tube diameter to total tank size, d/T,
should be investigated, to confirm when the boundary restrictions can be ignored, and the fluid space can be
regarded as large enough. As shown in Figure 16, the effects of normalized tube diameter, d/T, on the positions
of the merge point and the combine point are investigated at constant jet Reynolds number and jet spacing. When
d/T is small enough (< 0.0125), the influence of the wall boundary can be ignored, and zMP/d and zCP/d tend to
constant values. When d/T > 0.0125, with increased d/T, zMP/d decreases and zCP/d increases, implying a much
larger mixing length. In this case, the influence of the boundaries become increasingly obvious and the wall effects
must be accounted for.
(a)
0 5 10 15 200
5
10
15
20
25
30
35
40
Miller et al.8
Tanaka9
Lin and Sheu11
Durve et al.14
This work
z CP/d
c/d0 5 10 15 20
0
10
20
30
Miller et al.8
Tanaka et al.9
Lin et al.11
Durve et al.14
Zang et al.29
This work
z MP/d
c/d
(b)
0.010 0.012 0.014 0.016 0.018 0.020 0.0226
8
10
12
14
16
18
20
z/d
d/T
MP CP

22
Figure 16. Dependence of the normalized positions of the merge point (MP) and combine point (CP) for triple
jets with different normalized tube diameter, d/T (c/d = 2.5, Rej = 3000).
The dependence of zMP/d and zCP/d on Rej is shown in Figure 17. Both zMP/d and zCP/d increase with Rej (Rej <
5000), and so does the mixing length, (zCP-zMP)/d, since when the jet velocity rises the turbulence around the jets
increases as well. When the inlet jet becomes even more turbulent (Rej ~ 5000), zMP/d and zCP/d reach stable values
around 13.7 and 17.7, respectively. This indicates that, when Rej is large enough, its influence on the flow field
structure is negligible. At near field (converging region and merging region), the decreasing mixing length of
turbulent jets with lower Reynolds number indicates better mixing performance than that of the fully developed
jets.
Figure 17. Dependence of the normalized positions of the merge point (MP) and combine point (CP) on the jet
Reynolds number, Rej, for triple jets (d = 3 mm, c/d = 2.5).
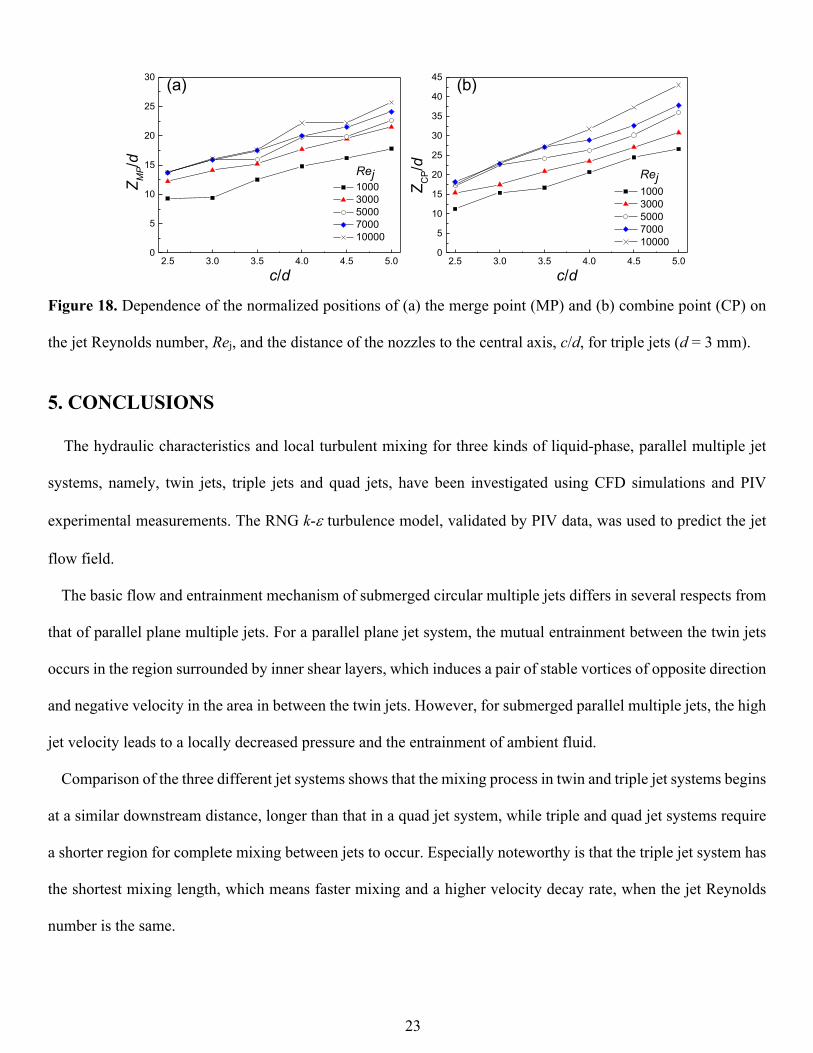
More generally, it is shown in Figure 18 that, with increasing jet spacing, the threshold to ignore the influence
of Rej also increases. When c/d = 5.0, even if Rej reaches 10000, its influence still cannot be neglected.
0 2000 4000 6000 8000 100005
10
15
20
z/d
Rej
MP CP
23
Figure 18. Dependence of the normalized positions of (a) the merge point (MP) and (b) combine point (CP) on
the jet Reynolds number, Rej, and the distance of the nozzles to the central axis, c/d, for triple jets (d = 3 mm).
5. CONCLUSIONS
The hydraulic characteristics and local turbulent mixing for three kinds of liquid-phase, parallel multiple jet
systems, namely, twin jets, triple jets and quad jets, have been investigated using CFD simulations and PIV
experimental measurements. The RNG k-e turbulence model, validated by PIV data, was used to predict the jet
flow field.
The basic flow and entrainment mechanism of submerged circular multiple jets differs in several respects from
that of parallel plane multiple jets. For a parallel plane jet system, the mutual entrainment between the twin jets
occurs in the region surrounded by inner shear layers, which induces a pair of stable vortices of opposite direction
and negative velocity in the area in between the twin jets. However, for submerged parallel multiple jets, the high
jet velocity leads to a locally decreased pressure and the entrainment of ambient fluid.
Comparison of the three different jet systems shows that the mixing process in twin and triple jet systems begins
at a similar downstream distance, longer than that in a quad jet system, while triple and quad jet systems require
a shorter region for complete mixing between jets to occur. Especially noteworthy is that the triple jet system has
the shortest mixing length, which means faster mixing and a higher velocity decay rate, when the jet Reynolds
number is the same.
2.5 3.0 3.5 4.0 4.5 5.00
5
10
15
20
25
30
35
40
45
Z CP/d
c/d
1000 3000 5000 7000 10000
Rej
2.5 3.0 3.5 4.0 4.5 5.00
5
10
15
20
25
30
Rej
1000 3000 5000 7000 10000
Z MP/d
c/d
(a) (b)

24
The merge point and combine point depend significantly on the jet spacing, and are linearly dependent on it, in
a more sensitive way than that for parallel plane multiple jets. The influence of jet Reynolds number on merge
point and combine point can be neglected when Rej > 5000, c/d = 2.5, and this threshold of Rej increases as jet
spacing increases, which is significant to guide the design of multi-jet systems. The required mixing length is
shorter when Rej is relatively small, which indicates that the turbulent jets with lower jet Reynolds number have
better mixing performance between jets in the near field than in the fully developed jets.
The three-dimensional interactions between jets and the impact on mixing provide valuable insights into more
complex multiple jet flows. For instance, fractal injectors and distributors30 are used when considering mixing in
reactors with more complicated tube structures, and the basic structure of these devices contain multiple parallel
jets.
AUTHOR INFORMATION
Corresponding Author
*E-mail address: [email protected] (Jiajun Wang), [email protected] (M.-O. Coppens).
Notes
The authors declare no competing financial interest.
ACKNOWLEDGMENTS
This work was supported financially by the National Key R&D Program of China (2017YFB0307702) and the
State Key Laboratory of Chemical Engineering (SKL-ChE-16D02). M.-O. C. is grateful to Zhejiang University
for a Qiushi Chair Professorship, funding his stays at Zhejiang University and making this collaboration possible.
NOMENCLATURE
c clearance between the jet and the geometric center of the multiple jets, m

25
d jet tube inner diameter, m
D cylinder tank inner diameter, m
H cylinder tank height, m
I turbulent intensity
k turbulence kinetic energy, m2/s2
l submerged jet tube length, m
N number of tubes
P0 total pressure, Pa
Pb back pressure, Pa
Q total flow rate, m3/h
Rej jet inlet Reynolds number
s spacing between twin jets, m
uj jet inlet velocity, m/s
um local maximum axial velocity, m/s
uz velocity component in the z direction, m/s
<uz>r circumferentially average axial velocity, m/s
<Vdye> normalized volume of the region where the dye mass fraction is larger than or equal to 10%
Vm volume of mesh cell m, m3
Vtotal effective volume of the tank, m3
wDye dye mass fraction
wm dye mass fraction in mesh cell m
x,y,z Cartesian coordinates, m
x1/2 width at half maximum velocity um, m
+x1/2 outer shear layer half-velocity width, m
- x1/2 inner shear layer half-velocity width, m
zCP distance from the nozzle to the combine point, m

26
zMP distance from the nozzle to the merge point, m
Greek Letters
μ viscosity, Pa×s
r density, kg/m3
e turbulence dissipation rate, m2/s3

27
REFERENCES
(1) Boushaki, T.; Sautet, J. C., Characteristics of flow from an oxy-fuel burner with separated jets: influence of
jet injection angle. Exp. Fluids 2010, 48, 1095-1108.
(2) Ghahremanian, S.; Bahram, M., Evaluation of RANS models in predicting low Reynolds, free, turbulent
round Jet. J. Fluid Eng-T. Asme. 2013, 136, 011201.
(3) Cho, Y.; Awbi, H. B.; Karimipanah, T., Theoretical and experimental investigation of wall confluent jets
ventilation and comparison with wall displacement ventilation. Build. Environ. 2002, 37, 1091-1100.
(4) Yan, F.; Zhai, G., Introduce of production process of difluoromethane. J. Salt Sci. Chem. Ind. (China) 2018,
47, 23-25.
(5) Li, N.; Zhang, K.; Xu, J., Experimental investigation for primary flow vectoring using parallel synthetic
jets. J. Propulsion Tech. (China) 2005, 26, 248-251.
(6) Kimura, N.; Miyakoshi, H.; Kamide, H., Experimental investigation on transfer characteristics of
temperature fluctuation from liquid sodium to wall in parallel triple-jet. Int. J. Heat Mass Transfer 2007, 50, 2024-
2036.
(7) Ghahremanian, S.; Moshfegh, B., Investigation in the near-field of a row of interacting jets. J. Fluid Eng-
T. Asme. 2015, 137, 121202.
(8) Miller, D. R.; Comings, E. W., Force-momentum fields in a dual-jet flow. J. Fluid Mech. 1960, 7, 237-256.
(9) Tanaka, E., The interference of two-dimensional parallel jets: 1st report, experiments on dual jet. Jsme. Int.
J. B 1970, 13, 272-280.
(10) Tanaka, E., The interference of two-dimensional parallel jets: 2nd report, experiments on the combined
flow of dual jet. Jsme Int. J. B-Fluids Therm. Eng. 1974, 17, 920-927.
(11) Lin, Y.; Sheu, M., Investigation of two plane parallel unventilated jets. Exp. Fluids 1990, 10, 17-22.
(12) Fujisawa, N.; Nakamura, K.; Srinivas, K., Interaction of two parallel plane jets of different velocities. J.
Visual-Japan. 2004, 7, 135-142.
(13) Xie, Z.; Xie, J.; Jiang, W.; Du, W., Numerical and experimental investigation of near-field mixing in
parallel dual round jets. Int. J. Aeropace Eng. 2016, 2016, 1-12.

28
(14) Durve, A.; Patwardhan, A. W.; Banarjee, I.; Padmakumar, G.; Vaidyanathan, G., Numerical investigation
of mixing in parallel jets. Nucl. Eng. Des. 2012, 242, 78-90.
(15) Svensson, K.; Rohdin, P.; Moshfegh, B., On the influence of array size and jet spacing on jet interactions
and confluence in round jet arrays. J. Fluid Eng-T. Asme. 2016, 138, 081206.
(16) Wang, H. H.; Lee, S.; Hassan, Y. A., Particle image velocimetry measurements of the flow in the
converging region of two parallel jets. Nucl. Eng. Des. 2016, 306, 89-97.
(17) Anderson, E. A.; Spall, R. E., Experimental and numerical investigation of two-dimensional parallel jets.
J. Fluid Eng-T. Asme. 2001, 123, 401-406.
(18) Faghani, E.; Rogak, S. N., Application of CFD and phenomenological models in studying interaction of
two turbulent plane jets. Int. J.Mech. Eng. Mechatronics 2012, 1, 36-49.
(19) Qiong, C.; Lu, D.; Lv, J., Numerical investigation on temperature fluctuation of the parallel triple-jet. Nucl.
Eng. Des. 2012, 249, 82-89.
(20) Choi; Seok-Ki; Seong-O; Kim, Evaluation of turbulence models for thermal striping in a triple jet. J. Press
Vess-T. Asme. 2007, 129, 583-592.
(21) Böhm, B.; Stein, O.; Kempf, A.; Dreizler, A., In-nozzle measurements of a turbulent opposed jet using
PIV. Flow Turbul. Combust. 2010, 85, 73-93.
(22) Svensson, K.; Rohdin, P.; Moshfegh, B., A computational parametric study on the development of
confluent round jet arrays. Eur. J. Mech. B/Fluids. 2015, 53, 129-147.
(23) Yakhot, V.; Orszag, S. A.; Thangam, S.; Gatski, T. B.; Speziale, C. G., Development of turbulence models
for shear flows by a double expansion technique. Phys. Fluids A 1992, 4, 1510-1520.
(24) Lee, S.; Lee, H. Y.; Lee, I. F.; Tseng, C. Y., Ink diffusion in water. Eur. J. Phys. 2004, 25, 331-336.
(25) Launder, B. E.; Sharma, B. I., Application of the energy-dissipation model of turbulence to the calculation
of flow near a spinning disc. Letters in Heat Mass Transf. 1974, 1, 131-137.
(26) Sharif, M.; Mothe, K. K., Parametric study of turbulent slot-jet impingement heat transfer from concave
cylindrical surfaces. Int. J. Therm. Sci. 2010, 49, 428-442.
29
(27) Aleyasin, S. S.; Tachie, M. F., Statistical properties and structural analysis of three-dimensional twin round
jets due to variation in Reynolds number. Int. J. Heat Fluid Flow 2019, 76, 215-230.
(28) Vouros, A.; Panidis, T., Influence of a secondary, parallel, low Reynolds number, round jet on a turbulent
axisymmetric jet. Exp. Therm. Fluid Sci. 2008, 32, 1455-1467.
(29) Zang, B.; New, T. H., On the wake-like vortical arrangement and behaviour associated with twin jets in
close proximity. Exp. Therm. Fluid Sci. 2015, 69, 127-140.
(30) Coppens, M.-O., Scaling-up and -down in a Nature-Inspired Way. Ind. Eng. Chem. Res. 2005, 44, 5011-
5019.

![Tidal Flow Patterns Near A Coastal Headland...In [34], submerged round jets were classified to turbulent (Re ≈ 3300 – 3500), transitional (Re ≈ 1600 – 1700) and laminar (Re](https://img.pdfslide.net/doc/110x75/60d236773826da03bb00555b/tidal-flow-patterns-near-a-coastal-headland-in-34-submerged-round-jets-were.jpg)