Embed Size (px)
Citation preview
NREL is a national laboratory of the U.S. Department of Energy, Office of Energy Efficiency and Renewable Energy, operated by the Alliance for Sustainable Energy, LLC.
Hydrogen Energy Storage and Power-to-Gas Establishing Criteria for Successful Business Cases
USAEE/IAEE 33rd Annual North American Conference
Josh Eichman, Marc Melaina
Pittsburgh, Pennsylvania 10/27/2015
NREL/PR-5400-65386
2
Outline
• Hydrogen System Configurations • Hydrogen Storage Opportunity • Approach • Cost vs. Revenue Comparison • Conclusions
3
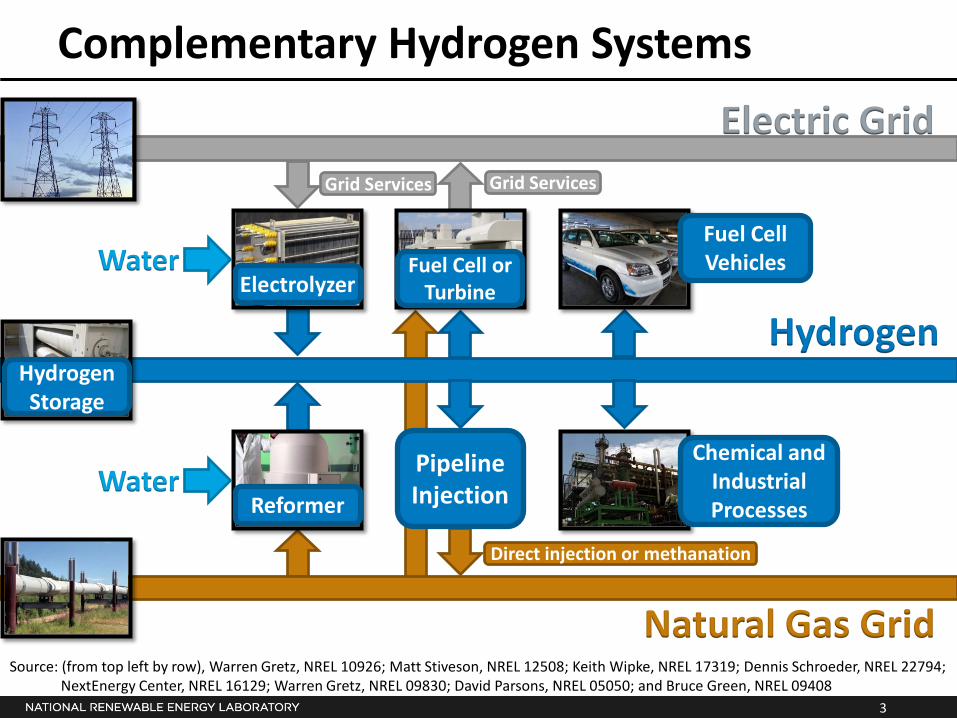
Complementary Hydrogen Systems
Electric Grid
Hydrogen
Pipeline Injection Water
Water Electrolyzer
Reformer
Fuel Cell or Turbine
Chemical and Industrial Processes
Hydrogen Storage
Natural Gas Grid Source: (from top left by row), Warren Gretz, NREL 10926; Matt Stiveson, NREL 12508; Keith Wipke, NREL 17319; Dennis Schroeder, NREL 22794; NextEnergy Center, NREL 16129; Warren Gretz, NREL 09830; David Parsons, NREL 05050; and Bruce Green, NREL 09408
Grid Services Grid Services
Fuel Cell Vehicles
Direct injection or methanation
4
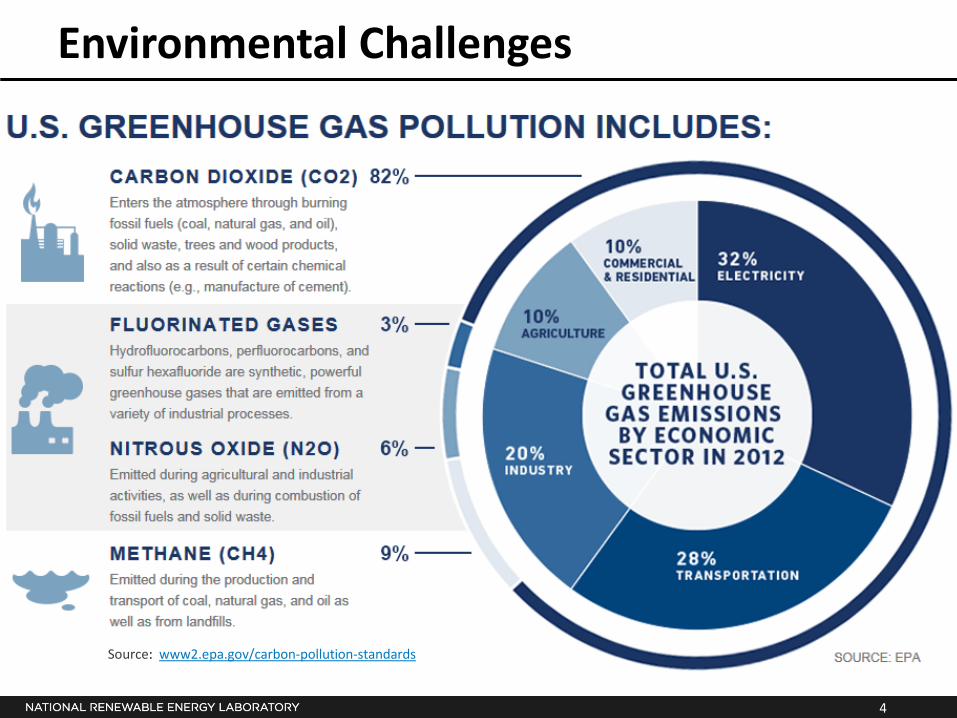
Environmental Challenges
Source: www2.epa.gov/carbon-pollution-standards
5
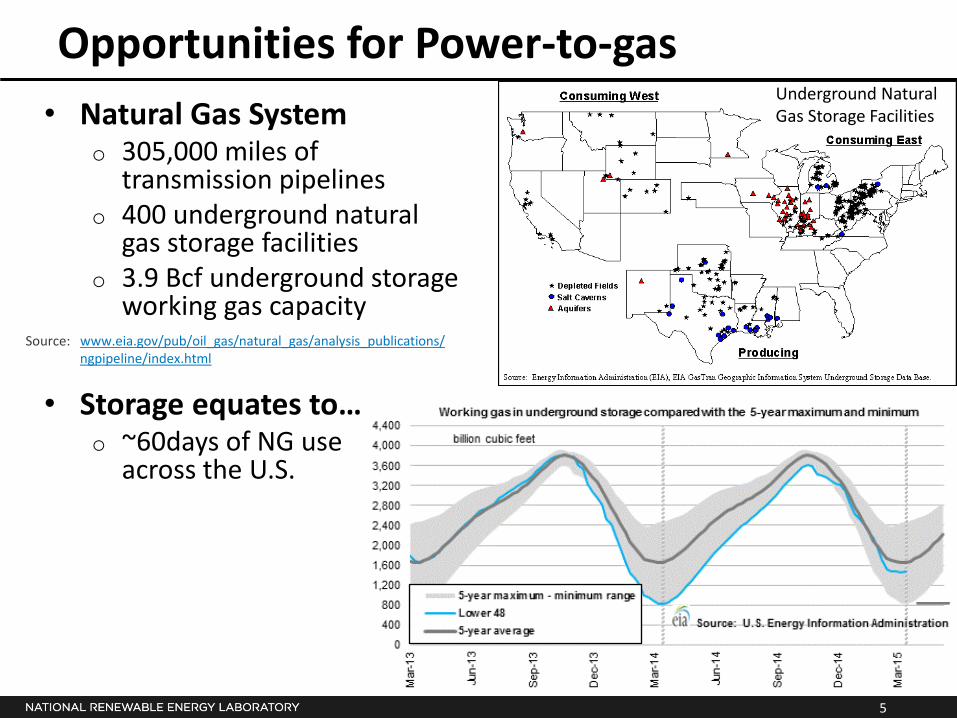
Opportunities for Power-to-gas • Natural Gas System
o 305,000 miles of transmission pipelines
o 400 underground natural gas storage facilities
o 3.9 Bcf underground storage working gas capacity
• Storage equates to… o ~60days of NG use
across the U.S.
Underground Natural Gas Storage Facilities
Source: www.eia.gov/pub/oil_gas/natural_gas/analysis_publications/ ngpipeline/index.html
6
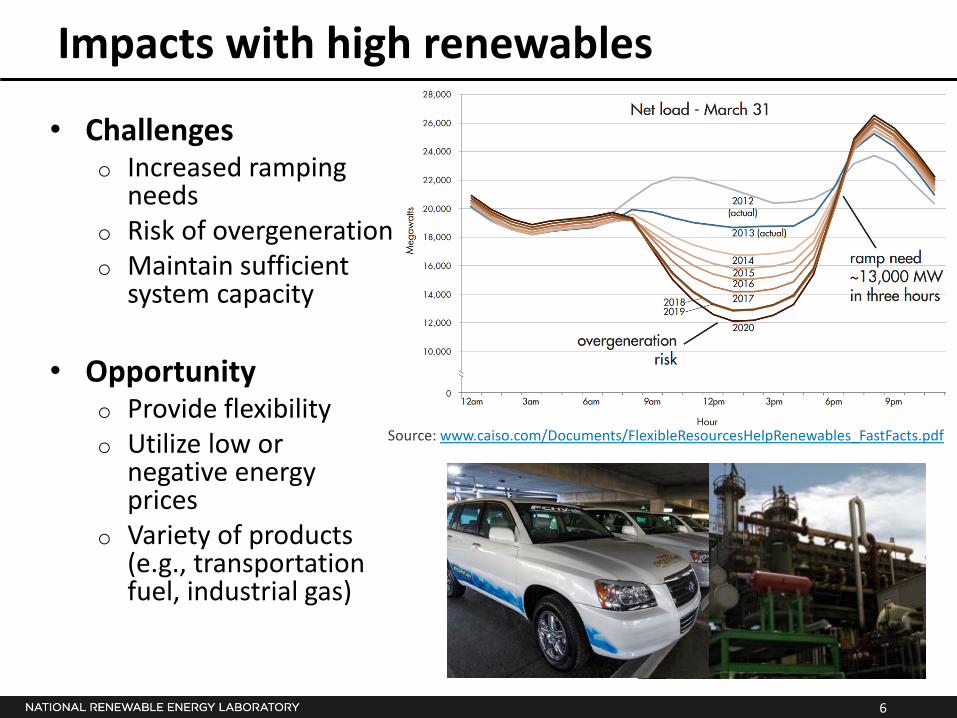
Impacts with high renewables
• Challenges o Increased ramping
needs o Risk of overgeneration o Maintain sufficient
system capacity
• Opportunity o Provide flexibility o Utilize low or
negative energy prices
o Variety of products (e.g., transportation fuel, industrial gas)
Source: www.caiso.com/Documents/FlexibleResourcesHelpRenewables_FastFacts.pdf
7
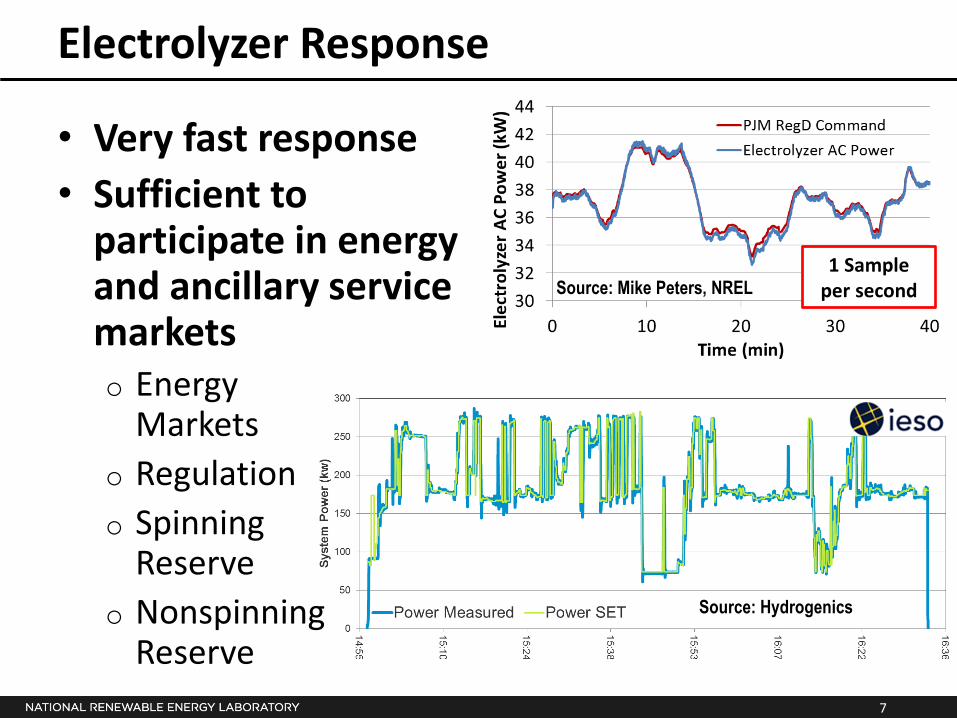
Electrolyzer Response
• Very fast response • Sufficient to
participate in energy and ancillary service markets o Energy
Markets o Regulation o Spinning
Reserve o Nonspinning
Reserve
1 Sample per second Source: Mike Peters, NREL
Source: Hydrogenics
8
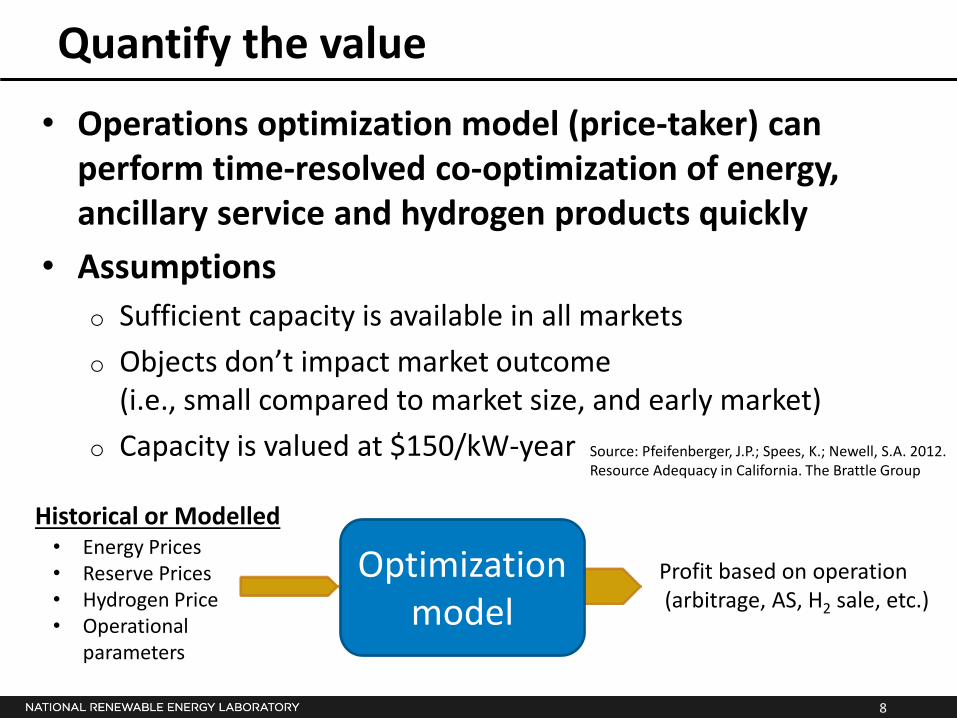
Quantify the value
• Energy Prices • Reserve Prices • Hydrogen Price • Operational
parameters
Historical or Modelled
Optimization model
Profit based on operation (arbitrage, AS, H2 sale, etc.)
• Operations optimization model (price-taker) can perform time-resolved co-optimization of energy, ancillary service and hydrogen products quickly
• Assumptions o Sufficient capacity is available in all markets o Objects don’t impact market outcome
(i.e., small compared to market size, and early market) o Capacity is valued at $150/kW-year Source: Pfeifenberger, J.P.; Spees, K.; Newell, S.A. 2012.
Resource Adequacy in California. The Brattle Group

9
Properties Pumped Hydro
Lithium Ion Battery
Stationary Fuel Cell Electrolyzer Steam Methane
Reformer Rated Power Capacity (MW) 1.0 1.0 1.0 1.0 500 kg/day Energy Capacity (hours) 8 4 8 8 8
Capital Cost ($/kW) 15001 - 23472 38501 - 41001 15003 - 59182 4303 - 21216 427 – 569 $/kg/day4
Fixed O&M ($/kW-year) 81 - 14.272 251 - 501 3502 424 4.07 – 4.50 % of Capital4
Hydrogen Storage Cost ($/kg) - - 6235 6235 6235
Installation cost multiplier 1.24 1.24 1.24 1.24 1.924
Lifetime (years) 30 121
(4500cycles) 20 204 204
Discount Rate 10% 10% 10% 10% 10%
Efficiency 80% AC/AC1 90% AC/AC1 40% LHV 70% LHV 0.156 MMBTU/kg4 0.6 kWh/kg4
Minimum Part-load 30%7 1% 10% 10% 100% Source: 1EPRI 2010, Electricity Energy Storage Technology Options, 1020676 2EIA 2012, Annual Energy Outlook 3DOE 2011, DOE Hydrogen and Fuel Cells Program Plan 4H2A Model version 3.0 5NREL 2009, NREL/TP-560-46719 (only purchase once if using FC&EY system) 6NREL 2008, NREL/TP-550-44103 7Levine, Jonah 2003, Michigan Technological University (MS Thesis)
Approach – Assumptions for Price-taker
10
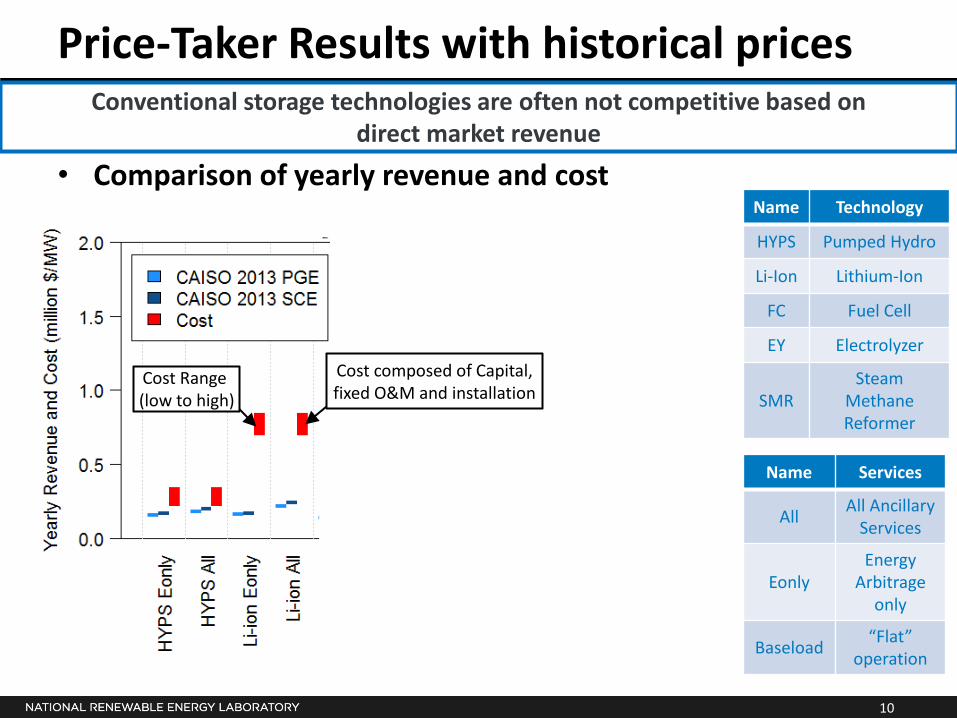
Price-Taker Results with historical prices
Name Services
All All Ancillary Services
Eonly Energy
Arbitrage only
Baseload “Flat” operation
Cost Range (low to high)
Cost composed of Capital, fixed O&M and installation
%
• Comparison of yearly revenue and cost
Conventional storage technologies are often not competitive based on direct market revenue
Name Technology
HYPS Pumped Hydro
Li-Ion Lithium-Ion
FC Fuel Cell
EY Electrolyzer
SMR Steam
Methane Reformer
11
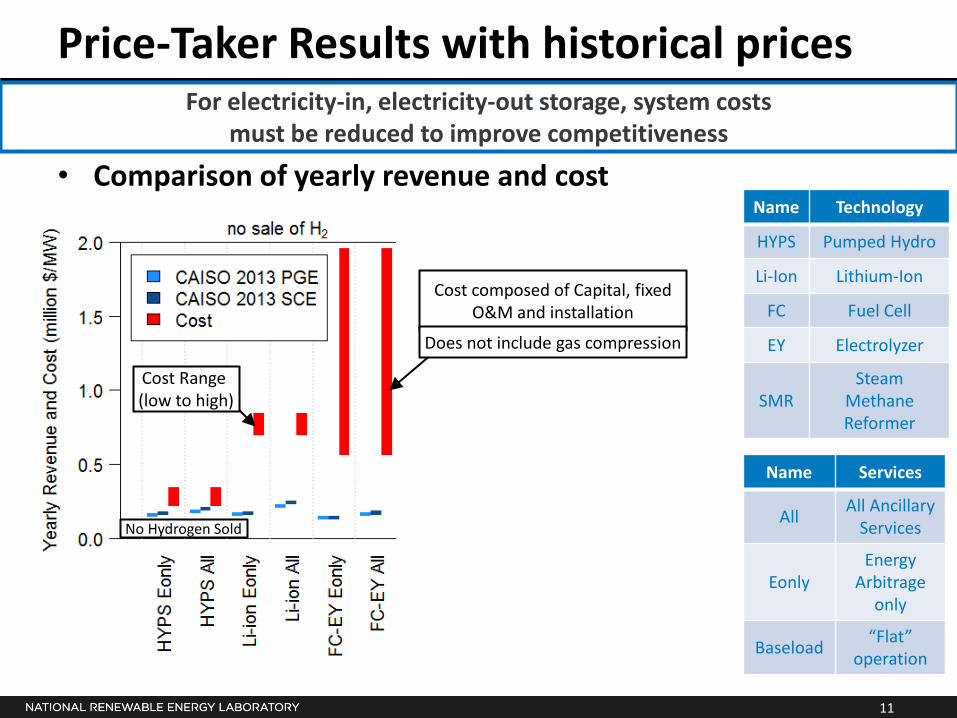
Price-Taker Results with historical prices
Name Services
All All Ancillary Services
Eonly Energy
Arbitrage only
Baseload “Flat” operation
• Comparison of yearly revenue and cost
For electricity-in, electricity-out storage, system costs must be reduced to improve competitiveness
Cost composed of Capital, fixed O&M and installation
Does not include gas compression
No Hydrogen Sold
Cost Range (low to high)
Name Technology
HYPS Pumped Hydro
Li-Ion Lithium-Ion
FC Fuel Cell
EY Electrolyzer
SMR Steam
Methane Reformer
12
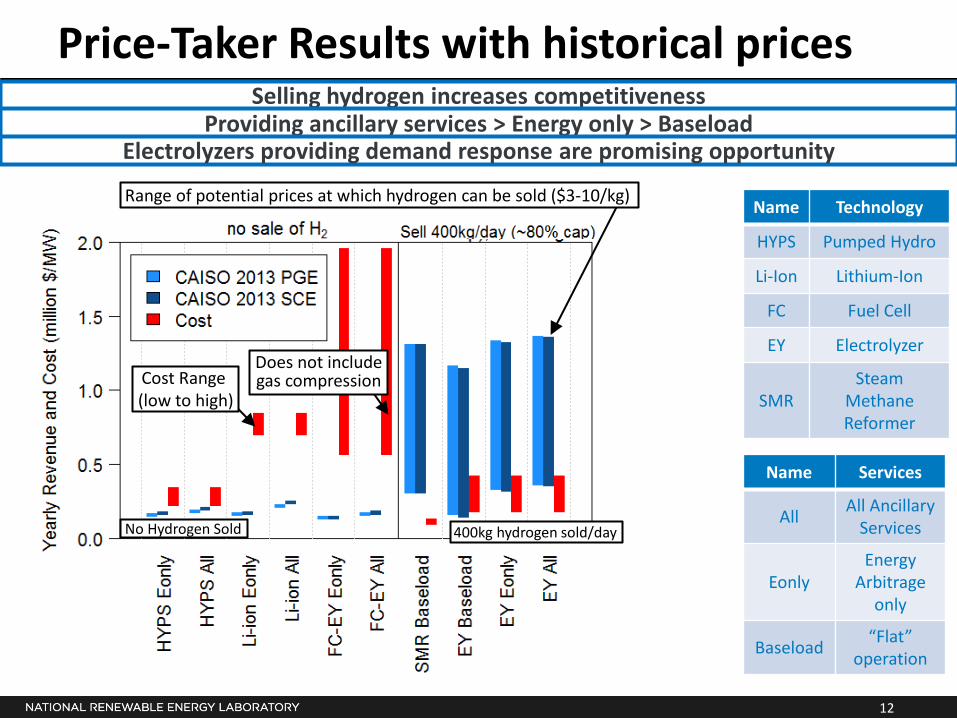
Price-Taker Results with historical prices
Name Services
All All Ancillary Services
Eonly Energy
Arbitrage only
Baseload “Flat” operation
400kg hydrogen sold/day
Selling hydrogen increases competitiveness Providing ancillary services > Energy only > Baseload
Range of potential prices at which hydrogen can be sold ($3-10/kg)
Electrolyzers providing demand response are promising opportunity
Does not include gas compression
No Hydrogen Sold
Cost Range (low to high)
Name Technology
HYPS Pumped Hydro
Li-Ion Lithium-Ion
FC Fuel Cell
EY Electrolyzer
SMR Steam
Methane Reformer
13
Conclusions
Economic Viability 1. Sell Hydrogen: Systems providing strictly
storage are less competitive than systems that sell hydrogen
2. Revenue w/ ancillary service > energy only > baseload
3. Electrolyzers operating as a “demand response” devices are particularly favorable
Questions?