Embed Size (px)
Citation preview

Hydrogen Isotope Gas
Absorption/Adsorption
Characteristics of Pd Nanopowders
A. Kitamura, Y. Miyoshi, H. Sakoh, A. Taniike (Division of Marine Engineering,
Graduate School of Maritime Sciences, Kobe University)
A.Takahashi, R. Seto, and Y. Fujita
(Technova Inc)
To be presented at ACS-NET 2011, Anaheim
1Kitamura ACSNET2011

Outline• Extensive measurements of heat release under
hydrogen isotope absorption/adsorption of 7 kinds (PP, PB, PZ, NZ, PNZ-I,PNZ-II, PNZ2B) of Pd nano-powders in a twin gas charging system have been made by Kobe group in 2010-2011.
• Anomalies in heat and D(H)-absorption observed by Pd (and Pd-Ni) nano-powders dispersed into/onto ZrO2 support are briefly overviewed.
• Heat and absorption data for larger Pure Pd powder and Pd-Black are shown in concentration in the present report.
Kitamura ACSNET2011 2

D2 gas cylinder
A2 system
H2run
Vacuum pumps
Reaction chamber
Pressure gaugeVacuum gauge
A1 system
D2 run
H2 gas cylinder
Outer vacuum chamber
A1・A2 twin system for simultaneous D2/H2 absorption experiments.3
Kitamura ACSNET2011 3

Ts
To
Ti
Vacuum pump Chiller
Vacuum pump
Vacuum pump
Pressure gauge
Pressure gauge
‘Super Needle’ valve
Liq. N2trap
Res
ervo
ir
tan
kH
2or
D2
Thermo-couples
Heater
Sample
Reaction chamber
Insulation chamber
Schematic of one of the twin absorption system. 4
Kitamura ACSNET2011 4

Samples tested: 7 kinds
[1] Phys. Lett. A, 373 (2009) 3109-3112.
[2] Low Eergy Nuclear Reactions, (AIP Conf. Proc. 1273, ed. Jan Marwan, 2010) to be changed to JCMNS4, 2011.
[3] LENR Source Book 3, (ed. Jan Marwan, ACS) to be published.
Pd Ni Zr O Supplier Remarks
100nmf -Pd 99.5%,
100nmf--- --- ---
Nilaco
Corp.[1],[2], this report
PP
Pd-black 99.9%,
300mesh--- --- ---
Nilaco
Corp.[1],[2], this report
PB
mixed oxide 0.312 --- 0.688 (1.69)
Santoku
Corp.
[1],[2],[3], ICCF16,
ACS2011PZ
mixed oxide --- 0.467 0.533 (1.53)
Santoku
Corp.[2]
NZ
mixed oxide 0.080 0.352 0.568 (1.57)
Santoku
Corp.[2]
PNZ
mixed oxide 0.023 0.891 0.292 (1.50)
Santoku
Corp.PNZII
mixed oxide0.04 0.29 0.67 (1.67)
Dr. B.
AhernICCF16, ACS2011
PNZ2B
5
Kitamura ACSNET2011 5

Experimental procedure
Sample setup
Absorption run{D2(H2) gas charging at R.T.}
Baking (440K, 3h, vac.)
Evacuation
Forced oxidation{O2 gas filling
at 470K for 30h}
Forced reduction {D2(H2) gas charging
at 570K for 24h}
Data acquisition: Temp., Pressure, Radiation (neutron, )
Evacuation
(#2 run) (#3 run) (#1 run) (A/B run)
Baking (570K, 0.5h, vac.)
6
Kitamura ACSNET2011 6

0.0
0.1
0.2
0.3
0.4
0.5
0.6
0 100 200 300 400
Time (min)
WD, W
H
(W)
0.00
0.05
0.10
0.15
0.20
PD, P
H
(MP
a)
D-PZ13#3H-PZ14#3DH
Power Pressure
2nd phase1st phase
Heat Evolution appeared in Two Phases: for PZ Samples
Integration gives the 1st phase specific output energy E1.
7
Kitamura ACSNET2011 7

0
100
200
300
400
500
1400 2400 3400Time [min]
Tem
per
atu
re [℃
]
0.10
0.15
0.20
0.25
0.30
0.35
0.40
Pre
ssu
re [
MP
a]
DpD
by introducing O2 gas at a pressure of 0.2 MPa and a temperature
of 470 K for 30 hours. The pressure difference DpD is used to
calculate the degree of oxidization, x for Pd+(x/2)O2→PdOx
Forced oxidization
0
100
200
300
400
500
1400 2400 3400Time [min]
Tem
pera
ture
[℃
]
0.10
0.15
0.20
0.25
0.30
0.35
0.40
Pre
ssur
e [M
Pa]
A1 T
A2 T
A1 Ps
A2 Ps
9Kitamura ACSNET2011
8

Comparison of the 1st-phase specific output energy E1 for the
runs D(H)-PZ11(12)#1 through D(H)-PZ13(14)#3Bd
-0.5
0.0
0.5
1.0
1.5
2.0
2.5
3.0
E1 (
eV/a
tom
-Pd
)
D-PZ11 H-PZ12
#1 #2 #3 #3d #3A #3Ad #3B 3Bd
-0.5
0.0
0.5
1.0
1.5
2.0
2.5
3.0
E1 (
eV/a
tom
-Pd
)
D-PZ13 H-PZ14
#1 #1d #1A #1Ad #1B #1Bd #2 #2d #3 #3d
PZ11-14 sample (Pd:31.2% Zr:68.8%)
PZ13,14#3run
PdO/Pd(D2) : 0.073
PdO/Pd(H2) : 0.061
PZ11,12#3run
PdO/Pd(D2) : 0.086
PdO/Pd(H2) : 0.054
10
Kitamura ACSNET2011 9
Bulk-like Data Bulk-like Data

0.0
1.0
2.0
D/P
d, H
/Pd
D-PZ13 H-PZ14
#1 #1A #1B #2 #30.0
1.0
2.0
D/P
d, H
/Pd
D-PZ11 H-PZ12
#1 #2 #3 #3A #3B
Comparison of the loading ratio D(H)/Pd for the runs
D(H)-PZ11(12)#1 through D(H)-PZ13(14)#3Bd
PZ11-14 sample (Pd:31.2% Zr:68.8%)
PZ13,14#3run
PdO/Pd(D2) : 0.073
PdO/Pd(H2) : 0.061
PZ11,12#3run
PdO/Pd(D2) : 0.086
PdO/Pd(H2) : 0.054
11
Kitamura ACSNET2011 10
Bulk-like Data Bulk-like Data

0.0
0.5
1.0
1.5
QD (e
V/D
),
QH
(e
V/H
)
D-PZ13 H-PZ14
#1 #1A #1B #2 #3
0.0
0.5
1.0
1.5
QD (e
V/D
),
QH
(e
V/H
)
D-PZ11 H-PZ12
#1 #2 #3 #3A #3B
Comparison of the hydridation energy QD(H) for the runs
D(H)-PZ11(12)#1 through D(H)-PZ13(14)#3Bd
PZ11-14 sample (Pd:31.2% Zr:68.8%)
PZ13,14#3run
PdO/Pd(D2) : 0.073
PdO/Pd(H2) : 0.061
PZ11,12#3run
PdO/Pd(D2) : 0.086
PdO/Pd(H2) : 0.054
12
Kitamura ACSNET2011 11
Bulk-like DataBulk-like Data

0.0
0.5
1.0
1.5
2.0
0 20 40 60 80 100
Time (min)W
D(H
) (W
), h
D(H
) (e
V/D
(H))
0.0
0.5
1.0
1.5
2.0
0 20 40 60 80 100
Time (min)
WD
(H) (W
), h
D(H
) (e
V/D
(H))
Typical variation of the specific sorption energy, hD (hH),
compared with that of the power, WD (WH), in the #3 run for
the PZ13(14) sample.
1b phase1a phase 1b phase1a phase
D-PZ13#3 H-PZ14#3
0.0
0.5
1.0
1.5
2.0
0 200 400 600 800
Time (min)
WD
(H) (W
), h
D(H
) (e
V/D
(H))
100 0
hD hH
h value for bulk Pd
WD WH
WD
(H)
[W]
,h
D(H
)[e
V/D
(H)]
16Dynamic D(H)-Sorption Energy observed for PZ Samples:
Larger for D-sorption in the Ia Phases
Kitamura ACSNET2011 12

0.0
0.5
1.0
1.5
2.0
0 20 40 60 80 100
Time (min)W
D(H
) (W
), h
D(H
) (e
V/D
(H))
0.0
0.5
1.0
1.5
2.0
0 20 40 60 80 100
Time (min)
WD
(H) (W
), h
D(H
) (e
V/D
(H))
hD
WD
WH
hH
1b phase 1b phase
Typical variation of the specific sorption energy, hD (hH),
compared with the power, WD (WH), in the #2 run for the
PZ11(12) sample.
#2 Run (After O-Reduction) for PZ Samples showed
bulk-like data.
0.0
0.5
1.0
1.5
2.0
0 200 400 600 800
Time (min)
WD
(H) (W
), h
D(H
) (e
V/D
(H)) D-PZ11#2
H-PZ12#2
h value for bulk Pd
WD
(H)
[W]
,h
D(H
)[e
V/D
(H)]
17
Kitamura ACSNET2011 13

-0.5
0.0
0.5
1.0
1.5
-50 150 350
Time (min)
WD
(H) (
W),
P
D(H
) (
MP
a)
-0.5
0.0
0.5
1.0
1.5
LD
(H)
W-H
W-D
P-H
P-D
L-H
L-D
Heat-Power
Pressure
Significant Heat Peak After 0.19% Surface-PdO Formation
Large Powder of Pure Pd :PP3,4#3 100-nmf Pd
LD(t)
LH(t)
18
Kitamura ACSNET2011 14
Phase-IPhase-II

-0.3
-0.2
-0.1
0.0
0.1
0.2
0.3
0.4
PP3#1 PP3#1d PP3#2 PP3#2d PP3#3 PP3#3d PP3#3A
E1
[e
V/a
tom
-Pd
]
D
H
Comparison of the 1st-phase specific output energy E1 for
the runs D(H)-PP3(4)#1 through D(H)-PZ3(4)#3A
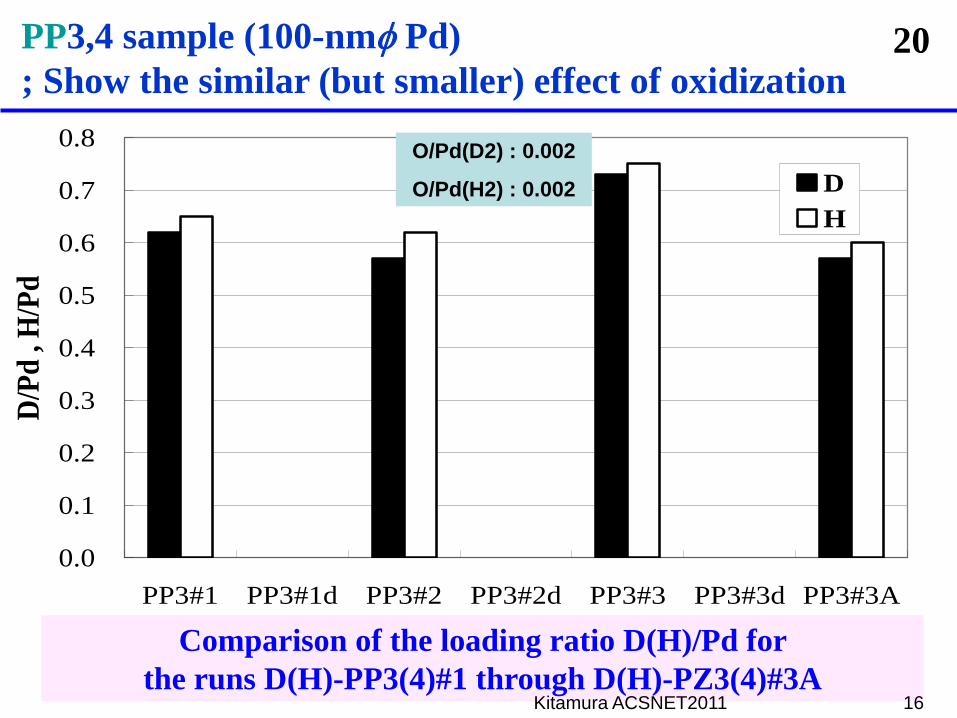
PP3,4 sample (100-nmf Pd)
; Show the similar (but smaller) effect of oxidization
O/Pd(D2) : 0.002
O/Pd(H2) : 0.002
19
Kitamura ACSNET2011 15
Bulk-like Data (Sorption-E = De-sorption-E)
0.0
0.1
0.2
0.3
0.4
0.5
0.6
0.7
0.8
PP3#1 PP3#1d PP3#2 PP3#2d PP3#3 PP3#3d PP3#3A
D/P
d ,
H/P
d
D
H
Comparison of the loading ratio D(H)/Pd for
the runs D(H)-PP3(4)#1 through D(H)-PZ3(4)#3A
O/Pd(D2) : 0.002
O/Pd(H2) : 0.002
PP3,4 sample (100-nmf Pd)
; Show the similar (but smaller) effect of oxidization20
Kitamura ACSNET2011 16

0.0
0.1
0.2
0.3
0.4
0.5
0.6
PP3#1 PP3#1d PP3#2 PP3#2d PP3#3 PP3#3d PP3#3A
QD
[e
V/D
] ,
QH
[eV
/H]
D
H
Comparison of the hydridation energy QD(H) for
the runs D(H)-PP3(4)#1 through D(H)-PZ3(4)#3A
O/Pd(D2) : 0.002
O/Pd(H2) : 0.002
PP3,4 sample (100-nmf Pd)
; Show the similar (but smaller) effect of oxidization21
Kitamura ACSNET2011 17
Bulk-like Data

0.0
0.3
0.6
0.9
1.2
0 50 100 150 200
Time (min)
WD
(H
) (
W)
0
0.5
1
1.5
2
h
D(H
) (e
V/D
(H))
0.0
0.3
0.6
0.9
1.2
0 50 100 150 200
Time (min)
WD
(H
) (
W)
0
0.5
1
1.5
2
h
D(H
) (
eV
/D(H
))
PP3,4 #1(right) and #3(left) (100-nmf Pd):
Effect of slight PdO layer is great (Ia) cf. bulky (Ib).
PP3,4#3
(After Oxidization)
h value for bulk
Pd (ca. 0.3 eV)
PP3,4#1
(As received, pure Pd)
1a phase
1b phase 1b phase
O/Pd(D2) : 0.002
O/Pd(H2) : 0.002
22
Heat Power
Heat Power
Kitamura ACSNET2011 18
η

Palladium Black Samples
PB5,6#1: Virgin Runs (10g each)
-0.3
0.0
0.3
0.6
0.9
1.2
1.5
-300 0 300 600
Time (min)
WD
(H)
(W),
P
D(H
) (M
Pa
)
-0.3
0.0
0.3
0.6
0.9
1.2
1.5
LD
(H)W-H
W-D
P-H
P-D
L-H
L-D
Power D/Pd
H/Pd
Kitamura ACSNET2011 19

PB5,6#1; h-values vs. power
0.0
0.2
0.4
0.6
0.8
1.0
1.2
1.4
1.6
0 100 200 300 400 500
Time (min)
WD
(H) (W
), h
D(H
) (e
V/D
(H)) Eta-H
Eta-D
W-H
W-D
Phase-Ia Phase-Ib
Eta
Power
Bulk Level Eta
Kitamura ACSNET2011 20
η

PB5,6#2; After Forced De-Oxidization
-0.2
0.0
0.2
0.4
0.6
0.8
1.0
-50 0 50 100 150 200 250 300 350 400 450 500 550
Time (min)
WD
(H) (
W),
P
D(H
) (
MP
a)
-0.2
0.0
0.2
0.4
0.6
0.8
1.0
LD
(H)
W-H
W-D
P-H
P-D
L-H
L-D
H/Pd
D/Pd
Power
Pressure
Kitamura ACSNET2011 21

PB5,6#2 h-values vs. powers after De-oxidization
0.0
0.2
0.4
0.6
0.8
1.0
0 10 20 30 40 50 60
Time (min)
WD
(H) (W
), h
D(H
) (e
V/D
(H)) Eta-H
Eta-D
W-H
W-D
Phase-Ib Only
Eta : Close to bulk values
Power
Kitamura ACSNET2011 22
η

PB5,6#3: 2(D)-1.7(H)%PdO/Pd, After Oxidization
-1.0
0.0
1.0
2.0
3.0
4.0
5.0
6.0
-50 0 50 100 150 200
Time (min)
WD
(H) (
W),
P
D(H
) (
MP
a)
-0.2
0.0
0.2
0.4
0.6
0.8
1.0
1.2
LD
(H)
W-H
W-D
P-H
P-D
L-H
L-D
Ia Ib Phase-II
Power
D/Pd
Kitamura ACSNET2011 23

PB5,6#3 h vs. Power: After Forced Oxidization (2-1.7%)
0.0
0.5
1.0
1.5
2.0
2.5
3.0
3.5
4.0
0 20 40 60 80 100
Time (min)
WD
(H) (W
), h
D(H
) (e
V/D
(H)) Eta-H
Eta-D
W-H
W-D
Ia Phase Ib Phase
Power
Eta
Kitamura ACSNET2011 24
η

Integrated Heat Data for PB5,6 E1
-0.4
-0.2
0
0.2
0.4
0.6
0.8
1
eV/a
tom
-Pd
D2 H2
#1 #1d #3 #3d #3A #3Ad #2 #2d #3_2
#3d_2
Bulk-like Data
Kitamura ACSNET2011 25

Integrated Data for PB
0
0.2
0.4
0.6
0.8
1
1.2
1.4
#1 #1d #3 #3d #3A #3A #2 #2d #3_2 #3_2d
D2 H2
LD, L
H
0
0.2
0.4
0.6
0.8
1
#1 #1d #3 #3d #3A #3A #2 #2d #3_2 #3_2d
eV
/ato
m-D
(H
)
D2 H2
Absorption Energy per D(H) Saturated Loading Ratios
Bulk-like Data
Bulk-like Data
Kitamura ACSNET2011 26

PZ: 8-nmf Pd(31.2%)Zr(68.8%)
(1)The 1st phase is found to be divided into sub-phases Ia and Ib;
Summary-1
1a phase; with rapid absorption/adsorption and high heat output.
- Probably occurring in the near-surface region
- Oxygen incorporation is necessary for this phase to appear.
- hD value is larger than hH., several times in some cases.
1b phase; with a lower heat output nearly equal to the bulk value.
(2) The 1a phase is observed only in #1 and #3 runs.
(3)The as-received sample has very large 1st-phase parameters;
(specific output energy E1D(H), the loading ratio D(H)/Pd~2.0,
the hydridation energy QD(H): 1.5(1.3) eV or more for D(H).)
Forced reduction sample has given the significantly smaller
1st-phase parameters (close to those for bulk Pd sample).
Forced oxidization sample has substantially recovered
the large values of the 1st-phase parameters.Kitamura ACSNET2011 27

PP: 100-nmf Pd 99.5%
(1) The similar effects are observed less prominently;
- the existence of the 1a and 1b phases, and
- increased absorption parameters by oxygen incorporation.
- general trend is similar to the following PB behavior.
PB: palladium black
(1) Virgin (as received) samples gave high D(H)/Pd values (ca. 1.0)
and higher heat release than PP.
(2) Slight PdO formation made more enhanced effect of initial large
heat peak (QD(H): 1.2(1.1) eV/D(H)-sorption), Ia phase, and
following Ib phase with bulky (ca. 0.3 eV/D(H)-sorption) heat
power.
(4) After the forced de-oxidization, heat levels and loading ratios gave
bulk-like values (0.3 eV/D(H) and D(H)/Pd = ca. 0.6)
(5) The ratio of hD/hH is a little bit larger than 1.0 for Ia phases.
Summary-2
Kitamura ACSNET2011 28

Summary-3:Tested Metal/Ceramics Powders and Results
Pd Ni Zr O Supplier
100nmf -Pd
PP
995%,
100nmf
--- --- --- Nilaco
Corp.
[1],[2]
Pd-black
PB
99.9%,
300mesh
--- --- --- Nilaco
Corp.
[1],[2]
8-10nmf -Pd
PZ
0.346 --- 0.654 (1.64) Santoku
Corp.
[1],[2],[3], discussed
in the present paper
mixed oxide
NZ
--- 0.358 0.642 (1.64) Santoku
Corp.
[2]
mixed oxide
PNZ
0.105 0.253 0.642 (1.64) Santoku
Corp.
[2]
2nmf-PdNi
PNZ2B
0.04 0.29 0.67 (1.67) Dr. B.
Ahern
only briefly in the
present paper
[1] Phys. Lett. A, 373 (2009) 3109-3112.
[2] Low Eergy Nuclear Reactions, (AIP Conf. Proc. 1273, ed. Jan Marwan, 2010).
[3] LENR Source Book 3, (ed. Jan Marwan, ACS) to be published.29
Anomalies observed?
No, bulk metal data, but PdO
Yes, a little large heat & D/Pd
Yes, Heat and D/Pd reproducible
No heat and loading
Yes, but weak
Yes, very large heat and
D(H)/M, reproducible
Drastic change happens by Meso-Catalyst! Why?
Kitamura ACSNET2011

Supplement Data below
Kitamura ACSNET2011 30

The 1st phase is divided into the 1a-phase and the 1b-phase.
0.0
0.1
0.2
0.3
0.4
0.5
0.6
0 100 200 300 400
Time (min)
WD, W
H
(W)
0.00
0.05
0.10
0.15
0.20
PD, P
H
(MP
a)
D-PZ13#3H-PZ14#3DH
Power Pressure
2nd phase1st phase
1b phase
1a phase
13
Kitamura ACSNET2011 31
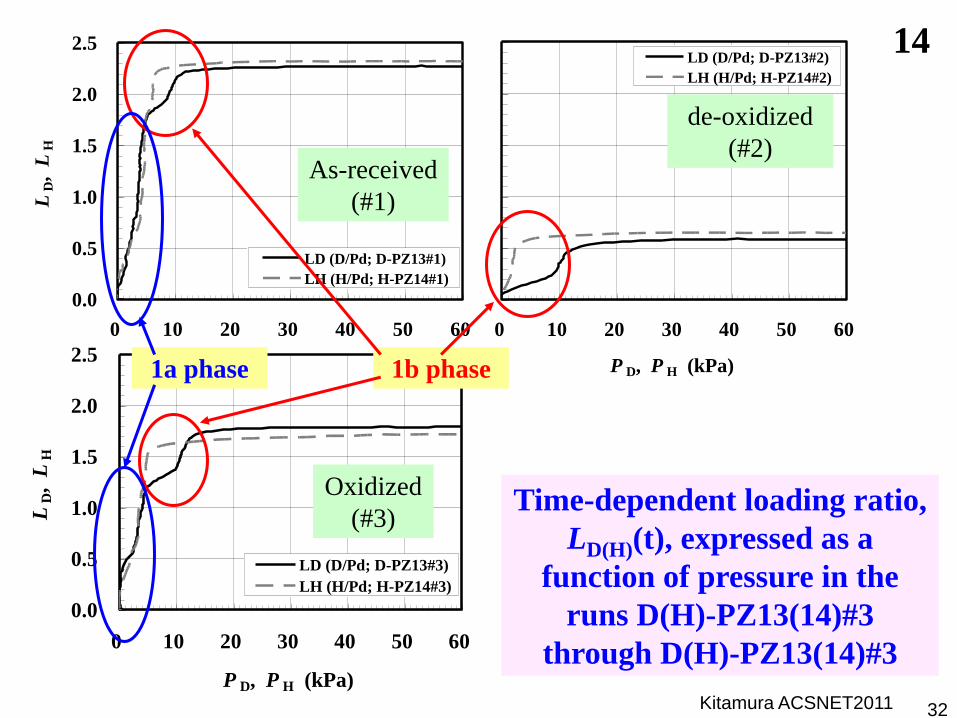
Time-dependent loading ratio,
LD(H)(t), expressed as a
function of pressure in the
runs D(H)-PZ13(14)#3
through D(H)-PZ13(14)#3
0.0
0.5
1.0
1.5
2.0
2.5
0 10 20 30 40 50 60
P D, P H (kPa)
LD, L
H
LD (D/Pd; D-PZ13#3)
LH (H/Pd; H-PZ14#3)
0.0
0.5
1.0
1.5
2.0
2.5
0 10 20 30 40 50 60
P D, P H (kPa)
LD, L
H
LD (D/Pd; D-PZ13#2)
LH (H/Pd; H-PZ14#2)
0.0
0.5
1.0
1.5
2.0
2.5
0 10 20 30 40 50 60
P D, P H (kPa)
LD, L
H
LD (D/Pd; D-PZ13#1)
LH (H/Pd; H-PZ14#1)
As-received
(#1)
de-oxidized
(#2)
Oxidized
(#3)
1a phase 1b phase
14
Kitamura ACSNET2011 32

Time-resolved specific sorption energy,
or differential heat of hydrogen uptake,
defined as the output energy per one hydrogen isotope
atom absorbed/adsorbed,
)()(
d)()(
true
tLttL
ttWt
tt
t
-+
+
Dh
D
,,)()(
d),()(
tLttL
ttWt
tt
t
-D+
D+
h
+
t
tttW
tW
meas d)(
),(
The interval Dt is arbitrary, and chosen here to be 1 min.
The values of Wtrue(t) should be de-convoluted from the measured output power
Wmeas(t), which has an indicial delay with a time constant of , and is
approximated here by W(t,) averaged over .
The hydridation energy QD(H) introduced earlier is equal to the integrated power
over the 1st phase divided by D(H)/Pd at the end of the 1st phase in the absence
of oxygen.
15
Kitamura ACSNET2011 33

-0.2
0.0
0.2
0.4
0.6
0.8
-50 150 350 550 750
Time (min)
WD
(H
) (W
), P
D(H
) (M
Pa)
-0.3
0.0
0.3
0.6
0.9
1.2
LD
(H
)
Pd Ni Zr O Supplier
0.04 0.29 0.67 (1.67)Dr. B.
Ahern
PNZ2B3,4#1
Pressure for H
Pressure for D
Power
LD(t)
0
1
2
3
0 10 20 30 40 50 60
Pressure (kPa)
LD, L
H
H/PdNi (H-PNZ2B1#1)
D/PdNi (D-PNZ2B2#1)
L(t) vs PLH(t)
23
Kitamura ACSNET2011 34

-0.5
0.0
0.5
1.0
1.5
2.0
2.5
3.0
3.5
4.0
E1 (
eV
/ato
m-P
dN
i)
H-PNZ2B1
D-PNZ2B2
#1 #1d #1A #1Ad #1B #1Bd #2 #2d #3 #3d
-0.5
0.0
0.5
1.0
1.5
2.0
2.5
3.0
3.5
4.0
E1 (
eV
/ato
m-P
dN
i)
H-PNZ2B3D-PNZ2B4
#1 #1d #1A #1Ad #1B #1Bd #2 #2d #3 #3d
Comparison of the 1st-phase specific output energy E1 for the
runs D(H)-PNZ2B2(1)#1 through D(H)-PNZ2B4(3)#3d
PNZ2B1-4 sample (Pd : 4% Ni : 29% Zr : 67%)
; Deoxidization works as well as oxidization
PNZ2B3,4#3run
PdO/Pd(D2) : 0.086
PdO/Pd(H2) : 0.087
PNZ2b1,2#3run
PdO/Pd(D2) : 0.069
PdO/Pd(H2) : 0.072
24
Kitamura ACSNET2011 35

0.0
0.5
1.0
1.5
2.0
2.5
3.0
3.5
LD, L
H
H-PNZ2B1D-PNZ2B2
#1 #1A #1B #2 #30.0
0.5
1.0
1.5
2.0
2.5
3.0
3.5
LD, L
H
H-PNZ2B3
D-PNZ2B4
#1 #1A #1B #2 #3
Comparison of the loading ratio D(H)/[Pd・Ni] for the runs
D(H)-PNZ2B2(1)#1 through D(H)-PZ4(3)#3
PNZ2B3,4#3run
PdO/Pd(D2) : 0.086
PdO/Pd(H2) : 0.087
PNZ2b1,2#3run
PdO/Pd(D2) : 0.069
PdO/Pd(H2) : 0.072
PNZ2B1-4 sample (Pd : 4% Ni : 29% Zr : 67%)
; Deoxidization works as well as oxidization25
Kitamura ACSNET2011 36

0.0
0.2
0.4
0.6
0.8
1.0
QD (
eV
/ato
m-D
), Q
H (
eV
/ato
m-H
)
H-PNZ2B3D-PNZ2B4
#1 #1A #1B #2 #3
0.0
0.1
0.2
0.3
0.4
0.5
0.6
0.7
0.8
0.9
1.0
QD (
eV
/ato
m-D
), Q
H (
eV
/ato
m-H
)
H-PNZ2B1D-PNZ2B2
#1 #1A #1B #2 #3
Larger energy QD(H) for the D-runs
D(H)-PNZ2B2(1)#1 through D(H)-PNZ2B4(3)#3
PNZ2B3,4#3run
PdO/Pd(D2) : 0.086
PdO/Pd(H2) : 0.087
PNZ2b1,2#3run
PdO/Pd(D2) : 0.069
PdO/Pd(H2) : 0.072
PNZ2B1-4 sample (Pd : 4% Ni : 29% Zr : 67%)
; Deoxidization works as well as oxidization26
Kitamura ACSNET2011
37

PNZ2B3,4#1
0.0
0.3
0.6
0.9
1.2
0 50 100 150 200
Time (min)
WD
(H) (W
), h
D(H
) (e
V/D
(H))
0.0
0.5
1.0
1.5
2.0
W-D
W-H
Eta-D
Eta-H
Absorption / desorption energies are constant and anomalously large,
while Ni does not absorb D(H) at all at room temperature.
WD
(H)[
W]
h value for
bulk Pd
27
Kitamura ACSNET2011 38

PB5,6#3_2: 0.47%PdO/Pd
The second forced-oxidization runs gave smaller Ia phase.
-0.5
0.0
0.5
1.0
1.5
2.0
2.5
3.0
-50 0 50 100 150 200
Time (min)
WD
(H) (
W),
P
D(H
) (
MP
a)
-0.2
0.0
0.2
0.4
0.6
0.8
1.0
1.2
LD
(H)
W-H
W-D
P-H
P-D
L-H
L-D
IaIb
PowerH/Pd
Kitamura ACSNET2011 39

PB5,6#3_2 h
0.0
0.5
1.0
1.5
2.0
2.5
3.0
0 10 20 30 40 50 60
Time (min)
WD
(H) (W
), h
D(H
) (e
V/D
(H)) Eta-H
Eta-D
W-H
W-D
Ia PhaseIb Phase
Kitamura ACSNET2011 40
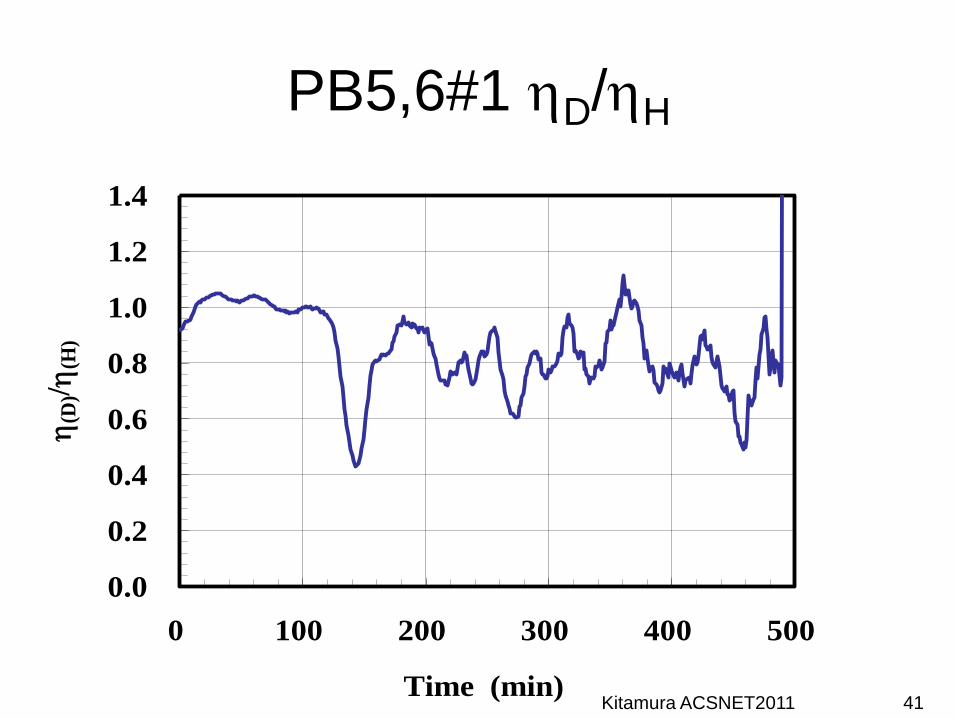
PB5,6#1 hD/hH
0.0
0.2
0.4
0.6
0.8
1.0
1.2
1.4
0 100 200 300 400 500
Time (min)
h(D
)/h
(H)
Kitamura ACSNET2011 41

PB5,6#2 hD/hH
0.0
0.2
0.4
0.6
0.8
1.0
1.2
1.4
0 20 40 60
Time (min)
h(D
)/h
(H)
Kitamura ACSNET2011 42

PB5,6#3 hD/hH
0.0
0.2
0.4
0.6
0.8
1.0
1.2
1.4
0 20 40 60 80 100
Time (min)
h(D
)/h
(H)
Kitamura ACSNET2011 43

PB5,6#3A hD/hH
0.0
0.2
0.4
0.6
0.8
1.0
1.2
1.4
0 20 40 60
Time (min)
h(D
)/h
(H)
Kitamura ACSNET2011 44

PB5,6#3_2 hD/hH
0.0
0.2
0.4
0.6
0.8
1.0
1.2
1.4
0 20 40 60
Time (min)
h(D
)/h
(H)
Kitamura ACSNET2011 45

PB5,6 Integrated Data Table
QD xQR
kJ kJ/g-Pd eV/atom-Pd eV/D(H) eV/atom-Pd
D2 unknown 8.00 0.80 0.88 1.11 0.80 0.00 -3.11 -0.34
H2 unknown 8.16 0.82 0.90 1.19 0.76 0.00 -2.92 -0.32
D2 0.0203 5.97 0.60 0.69 1.01 0.65 0.03 -2.74 -0.30
H2 0.0171 5.56 0.56 0.65 1.04 0.59 0.03 -2.98 -0.33
D2 0.0000 1.57 0.16 0.17 0.61 0.28 0.00 -1.59 -0.17
H2 0.0000 1.97 0.20 0.22 0.71 0.31 0.00 -2.01 -0.22
D2 0.0000 1.59 0.16 0.18 0.63 0.28 0.00 -1.63 -0.18
H2 0.0000 2.02 0.20 0.22 0.72 0.31 0.00 -2.05 -0.23
D2 0.0047 2.56 0.26 0.29 0.71 0.40 0.01 -1.87 -0.21
H2 0.0047 2.93 0.29 0.33 0.80 0.40 0.01 -2.27 -0.25
E1D(H)/Pd kJ
PB5,6#3_2
1st phase desorption
PB5,6#1
eV/atom-Pd
PB5,6#3
PB5,6#3A
PB5,6#2
PdO/Pd
Kitamura ACSNET2011 46

Summary of the results obtained so far(1) PZ sample (Santoku; Pd36Zr64)
- very large specific energy of absorption/adsorption, E1 ~ 2 eV/Pd,
- very large loading ratio, D(H)/Pd ~ 1.5 - 2.3,
- very large hydridation energy, QD(H) ~1.0 eV/D(H),
- 1a-phase; near-surface phenomenon with h(1a) = 1.33(1.15) eV/D(H), while
1b-phase; bulk characteristics with h(1b) = 0.47(0.41) eV/D(H),
- deteriorates after an absorption run, and recovers after forced oxidization.
(2) PP sample (Nilaco; 0.1-mf)
- E1 ~ 0.2 eV/Pd, D(H)/Pd ~ 0.6, QD(H) ~ 0.3 eV/D(H),
- less prominent 1a-phase, and less effective enhancement by oxidization.
(3) PB sample (Nilaco; Pd-black)
- intermediate characteristic values.
(4) PNZ (Santoku; Pd11Ni25Zr64, Pd2Ni44Zr54) and NZ (Ni36Zr64)
- absorption in proportion to Pd content.
(5) PNZ2B (B.Ahern; Pd4Ni29Zr67; melt spinning)
- absorption occurs at R.T. with E1 ~ 2.0 (1.8) eV/atom-[PdNi],
- D(H)/[PdNi] ~ 3.3 (3.3),
- QD(H) (and h) ~ 0.55 (0.50) eV/atom-D(H),
- 1a-phase / 1b-phase ; indistinguishable,
- modest deterioration after absorption runs. Kitamura ACSNET2011 47