Embed Size (px)
Citation preview
HYDROGEN PRODUCTION AND PURIFICATION FROM COAL AND OTHER HEAVY FEEDSTOCKS Year 6 – Activity 1.4 – Development of a National Center for Hydrogen Technology Revised Topical Report Prepared for: AAD Document Control National Energy Technology Laboratory U.S. Department of Energy 626 Cochrans Mill Road PO Box 10940, MS 921-107 Pittsburgh, PA 15236-0940 DOE NETL Cooperative Agreement No. DE-FE0003466 Performance Monitor: Arun Bose
Prepared by:
Grant E. Dunham
Energy & Environmental Research Center University of North Dakota
15 North 23rd Street, Stop 9018 Grand Forks, ND 58202-9018
June 2012
EERC DISCLAIMER LEGAL NOTICE This research report was prepared by the Energy & Environmental Research Center (EERC), an agency of the University of North Dakota, as an account of work sponsored by the U.S. Department of Energy (DOE) National Energy Technology Laboratory (NETL), the North Dakota Industrial Commission, and a consortium of industrial sponsors. Because of the research nature of the work performed, neither the EERC nor any of its employees makes any warranty, express or implied, or assumes any legal liability or responsibility for the accuracy, completeness, or usefulness of any information, apparatus, product, or process disclosed or represents that its use would not infringe upon privately owned rights. Reference herein to any specific commercial product, process, or service by trade name, trademark, manufacturer, or otherwise does not necessarily constitute or imply its endorsement or recommendation by the EERC. DOE ACKNOWLEDGMENT This report was prepared with the support of DOE NETL Cooperative Agreement No. DE-FE0003466. However, any opinions, findings, conclusions, or recommendations expressed herein are those of the author(s) and do not necessarily reflect the views of DOE. DOE DISCLAIMER This report was prepared as an account of work sponsored by an agency of the United States Government. Neither the United States Government, nor any agency thereof, nor any of their employees makes any warranty, express or implied, or assumes any legal liability or responsibility for the accuracy, completeness, or usefulness of any information, apparatus, product, or process disclosed, or represents that its use would not infringe upon privately owned rights. Reference herein to any specific commercial product, process, or service by trade name, trademark, manufacturer, or otherwise does not necessarily constitute or imply its endorsement, recommendation, or favoring by the United States Government or any agency thereof. The views and opinions of authors expressed herein do not necessarily state or reflect those of the United States Government or any agency thereof.
HYDROGEN PRODUCTION AND PURIFICATION FROM COAL AND OTHER HEAVY FEEDSTOCKS
Year 6 – Activity 1.4 – Development of a National Center for Hydrogen Technology
ABSTRACT Air Products and Chemicals, Inc., is developing the sour pressure swing adsorption (PSA) technology which can be used to reject acid gas components (hydrogen sulfide [H2S] and carbon dioxide [CO2]) from sour syngas streams such as coal gasification syngas. In the current work, tests were conducted to investigate the impact of continuous exposure of real sour syngas and dilute levels of hydrochloric acid (HCl) and ammonia (NH3) on the preferred adsorbent of that process. The results show a modest (~10%–15%) decrease in CO2 adsorption capacity after sour syngas exposure, as well as deposition of metals from carbonyl decomposition. Continuous exposure to HCl and NH3 yield a higher degree of CO2 capacity degradation (up to 25%). These tests represent worst-case approaches since the exposure is continuous and the HCl and NH3 levels are relatively high compare to an industrial sour syngas stream. Long-term PSA tests are needed to unequivocally evaluate the impact of cyclic exposure to these types of streams.
i
TABLE OF CONTENTS
LIST OF FIGURES ........................................................................................................................ ii LIST OF TABLES .......................................................................................................................... ii EXECUTIVE SUMMARY ........................................................................................................... iii BACKGROUND ............................................................................................................................ 1 EXPERIMENTAL APPROACH.................................................................................................... 1 RESULTS AND DISCUSSION ..................................................................................................... 3
Characterization of Adsorbent Samples Exposed to Syngas ................................................ 3 Characterization of Adsorbent Exposed to HCl and NH3 ..................................................... 5
CONCLUSIONS............................................................................................................................. 8 SYNGAS ANALYSIS ................................................................................................... Appendix A
ii
LIST OF FIGURES 1 Ten-bed exposure unit at the EERC ...................................................................................... 2 2 Schematic of ambient-temperature exposure unit ................................................................. 2 3 Iron and sulfur loadings on the exposed adsorbent samples ................................................. 6 4 Mass spectrometry data for Adsorbent A (top) and Adsorbent B (bottom) samples heated to 200C in TGA ........................................................................................................ 9
LIST OF TABLES 1 Conditions for the Second Set of Exposure Tests ................................................................. 3 2 CO2 Capacities by TGA for Samples Exposed to Sour Syngas ............................................ 4 3 Elemental Composition (wt%, mmol/g) as Determined by XRF Analysis for Elements >0.02 wt% and Ni .................................................................................................. 6 4 Adsorbent Weight Change after Syngas Exposure ............................................................... 7 5 CO2 Capacities by TGA for Samples Exposed to HCl or NH3 Containing Syngas .............. 8
iii
HYDROGEN PRODUCTION AND PURIFICATION FROM COAL AND OTHER HEAVY FEEDSTOCKS
Year 6 – Activity 1.4 – Development of a National Center for Hydrogen Technology
EXECUTIVE SUMMARY Activity 1.4 is a collaborative effort with Air Products and Chemicals, Inc. (APCI), to develop a technology for purifying hydrogen in a syngas stream produced from coal and other heavy feedstocks through gasification.
APCI is developing the sour pressure swing adsorption (PSA) technology which can be used to reject acid gas components (hydrogen sulfide [H2S] and carbon dioxide [CO2]) from sour syngas streams such as coal gasification syngas. Separation is achieved by selectively adsorbing these species onto a solid adsorbent and, subsequently, desorbing them during the regeneration steps of the process. It is, therefore, critical that the adsorbent be physically and chemically stable in the sour syngas. In this work, tests were conducted to investigate the impact of continuous exposure of real sour syngas and dilute levels of hydrochloric acid (HCl) and ammonia (NH3) on the preferred adsorbent.
Two separate sets of tests were conducted under this scope of work. In the first, two adsorbent samples (A and B) were continuously exposed to sour syngas. This feed gas was generated by gasifying petroleum coke (petcoke) in the entrained-flow gasifier at the Energy & Environmental Research Center (EERC). In the second set of tests, adsorbent samples were continuously exposed to feed gas containing dilute levels of HCl or NH3. Spent adsorbent was returned to APCI for characterization and analysis. The CO2 adsorption capacities for the fresh and spent samples were determined by thermogravimetric adsorption (TGA) analysis and elemental compositions were determined by x-ray fluorescence (XRF) analysis. The results of the first test show that continuous exposure of the adsorbent to petcoke-derived sour syngas yields a CO2 capacity reduction of 10%–15%. This is in contrast to results obtained from PSA operation with the same feed gas where there was no decrease in H2S capacity after 1000 cycles. This suggests that continuous syngas exposure is a more aggressive test of the stability of the material. It also indicates that extended PSA cycle tests, beyond 1000 cycles, should be conducted. Continuous exposure of the adsorbents to dilute levels of HCl and NH3 lead to significant CO2 capacity losses (up to 25%). Again, the actual impact under PSA cycling is likely less. Nevertheless, these results suggest that provisions for upstream removal of HCl and NH3 should be considered in future work.
1
HYDROGEN PRODUCTION AND PURIFICATION FROM COAL AND OTHER HEAVY FEEDSTOCKS
Year 6 – Activity 1.4 – Development of a National Center for Hydrogen Technology
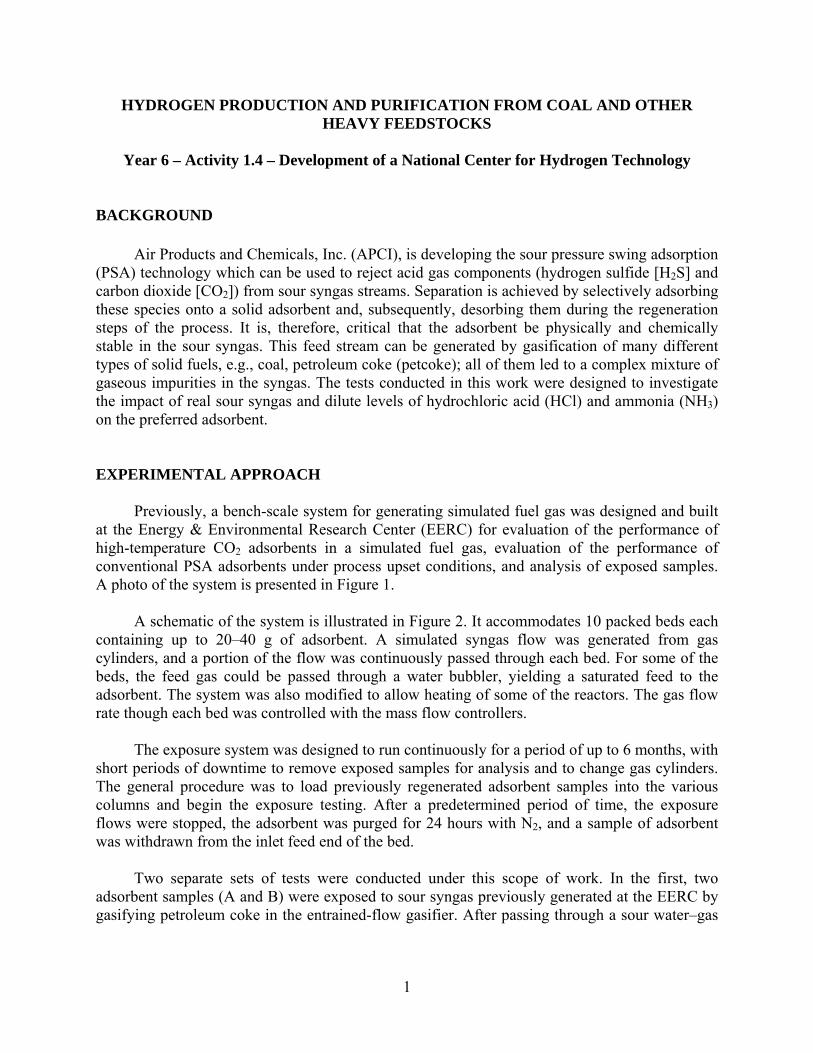
BACKGROUND Air Products and Chemicals, Inc. (APCI), is developing the sour pressure swing adsorption (PSA) technology which can be used to reject acid gas components (hydrogen sulfide [H2S] and carbon dioxide [CO2]) from sour syngas streams. Separation is achieved by selectively adsorbing these species onto a solid adsorbent and, subsequently, desorbing them during the regeneration steps of the process. It is, therefore, critical that the adsorbent be physically and chemically stable in the sour syngas. This feed stream can be generated by gasification of many different types of solid fuels, e.g., coal, petroleum coke (petcoke); all of them led to a complex mixture of gaseous impurities in the syngas. The tests conducted in this work were designed to investigate the impact of real sour syngas and dilute levels of hydrochloric acid (HCl) and ammonia (NH3) on the preferred adsorbent. EXPERIMENTAL APPROACH Previously, a bench-scale system for generating simulated fuel gas was designed and built at the Energy & Environmental Research Center (EERC) for evaluation of the performance of high-temperature CO2 adsorbents in a simulated fuel gas, evaluation of the performance of conventional PSA adsorbents under process upset conditions, and analysis of exposed samples. A photo of the system is presented in Figure 1. A schematic of the system is illustrated in Figure 2. It accommodates 10 packed beds each containing up to 20–40 g of adsorbent. A simulated syngas flow was generated from gas cylinders, and a portion of the flow was continuously passed through each bed. For some of the beds, the feed gas could be passed through a water bubbler, yielding a saturated feed to the adsorbent. The system was also modified to allow heating of some of the reactors. The gas flow rate though each bed was controlled with the mass flow controllers. The exposure system was designed to run continuously for a period of up to 6 months, with short periods of downtime to remove exposed samples for analysis and to change gas cylinders. The general procedure was to load previously regenerated adsorbent samples into the various columns and begin the exposure testing. After a predetermined period of time, the exposure flows were stopped, the adsorbent was purged for 24 hours with N2, and a sample of adsorbent was withdrawn from the inlet feed end of the bed. Two separate sets of tests were conducted under this scope of work. In the first, two adsorbent samples (A and B) were exposed to sour syngas previously generated at the EERC by gasifying petroleum coke in the entrained-flow gasifier. After passing through a sour water–gas
2
Figure 1. Ten-bed exposure unit at the EERC.
Figure 2. Schematic of ambient-temperature exposure unit.
3
shift catalyst bed and cooling/condensation, the gas was compressed and stored in multiple gas cylinders. These cylinders supplied exposure gas for the test. Two adsorbent materials were evaluated in three adsorbent-filled vessels. Each consisted of roughly 10 g of adsorbent in a ½-in.-o.d. × 4-in.-long reactor. The reactors were maintained at 30°C (86°F), with a gas flow rate through each of 500 cm3/min. The gas supply pressure was constant at 400 psig. The first vessel (22188) was packed with Adsorbent A and exposed to 500 cm3/min of syngas for 813 hours. The other two vessels, 16320 and 8568, were both packed with Adsorbent B. Vessel 8568 was put into service at the start of the testing but was inadvertently overheated after 339 hours of exposure. Fresh adsorbent was loaded into Vessel 163320 and exposed for the remainder of the syngas exposure testing, 474 hours. In the second set of tests, adsorbent samples were continuously exposed to dilute levels of HCl and NH3. The test conditions are presented in Table 1. Each vessel contained between 2 and 3 g of adsorbent material. The exposure time for the reactors exposed to gas containing HCl was shorter because of a regulator failure. Spent adsorbent samples were returned to APCI for characterization and analysis. To gauge adsorbent stability, CO2 capacities for the fresh and spent samples were determined by thermogravimetric analysis (TGA). The TGA analyzer consists of a very sensitive balance capable of measuring the mass change of an adsorbent sample under various gas atmospheres and temperatures. The standard TGA procedure used to determine CO2 capacity involved heating the sample to 200°C under N2 purge, cooling the sample to 40°C, and exposing it to 100% dry CO2 at 1 atmosphere. The final steady weight change yielded an estimate of the CO2 adsorption capacity. Elemental compositions were determined by x-ray fluorescence (XRF) analysis. Table 1. Conditions for the Second Set of Exposure Tests Reactor
1 Reactor
2 Reactor
3 Reactor
4 Sorbent B B A A 50 ppm HCl, 500 ppm CO balance N2 Yes No Yes No 50 ppm NH3, 50 ppm CO, balance N2 No Yes No Yes Temperature, °C (°F) Ambient 60 (140) 60 (140) Ambient Pressure, psig 400 400 400 400 Hours of Exposure 623.5 751.5 623.5 751.5 RESULTS AND DISCUSSION
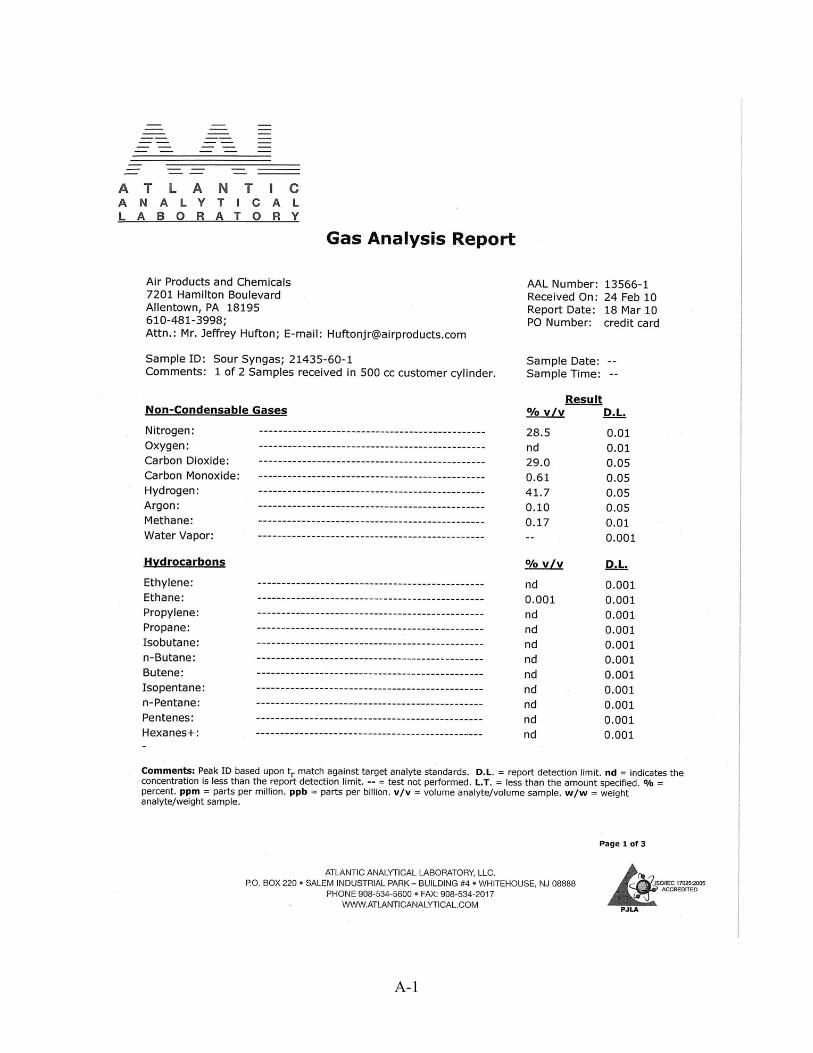
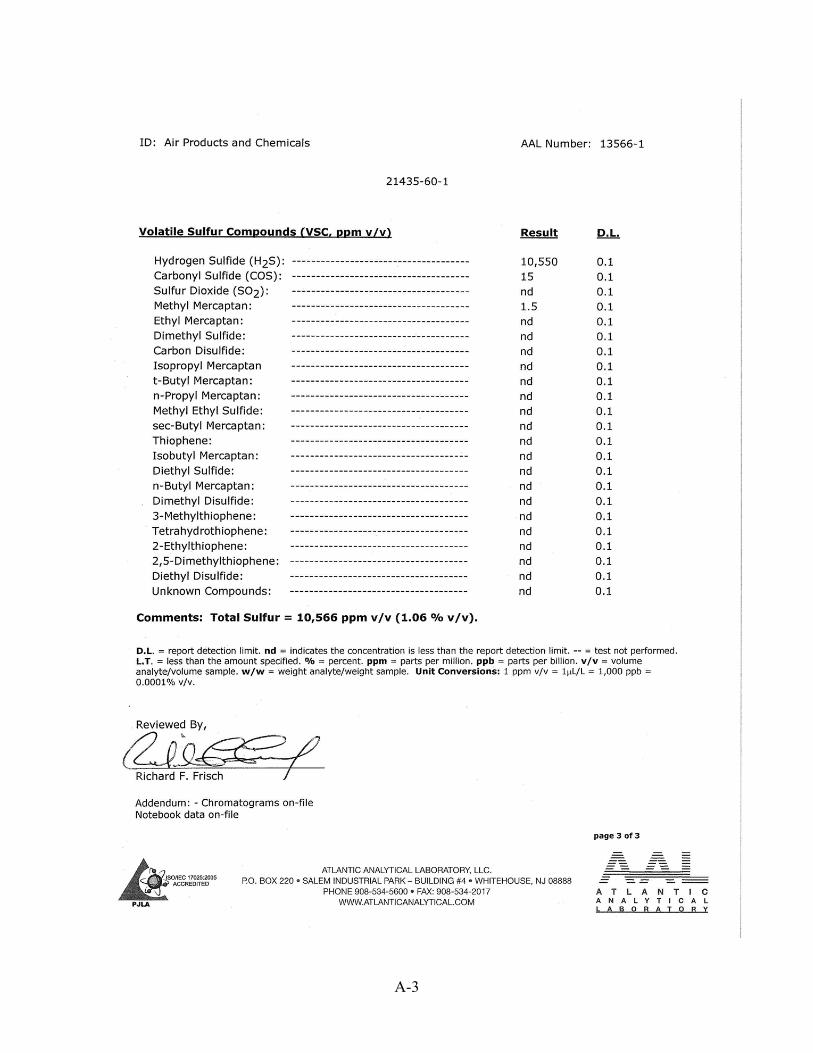
Characterization of Adsorbent Samples Exposed to Syngas Analysis of the syngas used in this work is listed in the Appendix A. It provides an indication of the more significant components of the mixture; trace inorganic impurities such as HCl, NH3, AsH3, HCN, and others were not characterized.
4
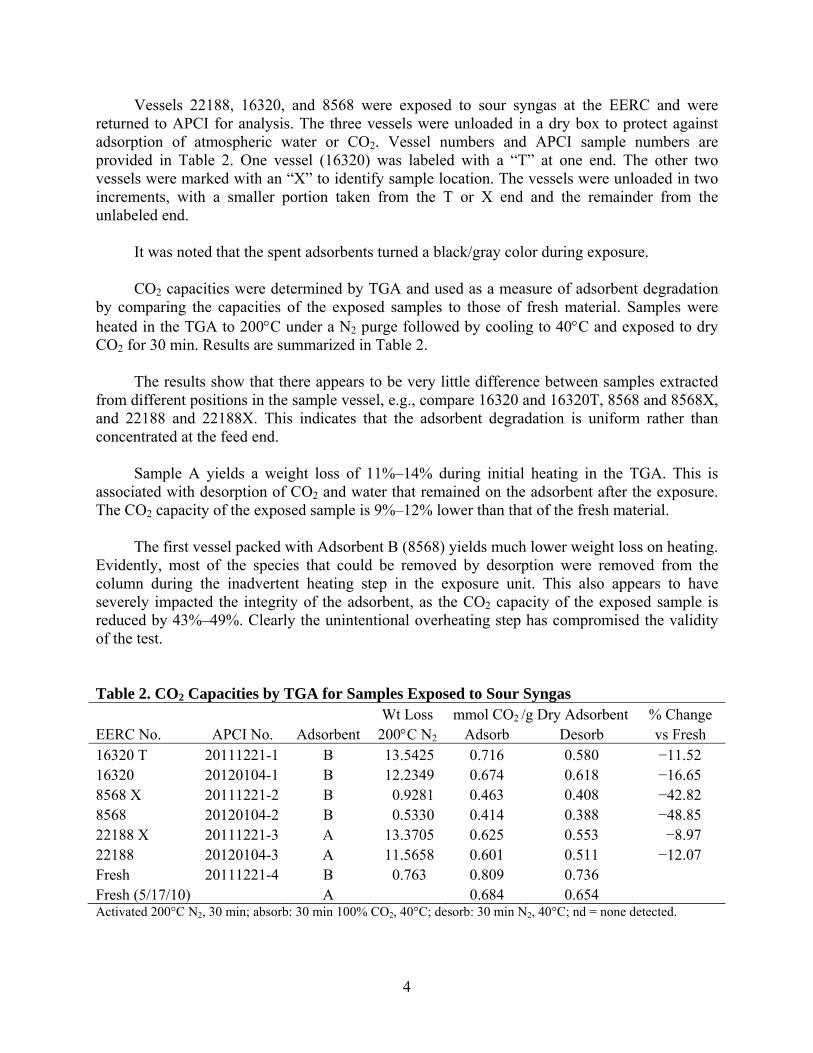
Vessels 22188, 16320, and 8568 were exposed to sour syngas at the EERC and were returned to APCI for analysis. The three vessels were unloaded in a dry box to protect against adsorption of atmospheric water or CO2. Vessel numbers and APCI sample numbers are provided in Table 2. One vessel (16320) was labeled with a “T” at one end. The other two vessels were marked with an “X” to identify sample location. The vessels were unloaded in two increments, with a smaller portion taken from the T or X end and the remainder from the unlabeled end. It was noted that the spent adsorbents turned a black/gray color during exposure. CO2 capacities were determined by TGA and used as a measure of adsorbent degradation by comparing the capacities of the exposed samples to those of fresh material. Samples were heated in the TGA to 200C under a N2 purge followed by cooling to 40C and exposed to dry CO2 for 30 min. Results are summarized in Table 2. The results show that there appears to be very little difference between samples extracted from different positions in the sample vessel, e.g., compare 16320 and 16320T, 8568 and 8568X, and 22188 and 22188X. This indicates that the adsorbent degradation is uniform rather than concentrated at the feed end. Sample A yields a weight loss of 11%–14% during initial heating in the TGA. This is associated with desorption of CO2 and water that remained on the adsorbent after the exposure. The CO2 capacity of the exposed sample is 9%–12% lower than that of the fresh material. The first vessel packed with Adsorbent B (8568) yields much lower weight loss on heating. Evidently, most of the species that could be removed by desorption were removed from the column during the inadvertent heating step in the exposure unit. This also appears to have severely impacted the integrity of the adsorbent, as the CO2 capacity of the exposed sample is reduced by 43%–49%. Clearly the unintentional overheating step has compromised the validity of the test. Table 2. CO2 Capacities by TGA for Samples Exposed to Sour Syngas Wt Loss mmol CO2 /g Dry Adsorbent % Change EERC No. APCI No. Adsorbent 200C N2 Adsorb Desorb vs Fresh 16320 T 20111221-1 B 13.5425 0.716 0.580 −11.52 16320 20120104-1 B 12.2349 0.674 0.618 −16.65 8568 X 20111221-2 B 0.9281 0.463 0.408 −42.82 8568 20120104-2 B 0.5330 0.414 0.388 −48.85 22188 X 20111221-3 A 13.3705 0.625 0.553 −8.97 22188 20120104-3 A 11.5658 0.601 0.511 −12.07 Fresh 20111221-4 B 0.763 0.809 0.736 Fresh (5/17/10) A 0.684 0.654 Activated 200°C N2, 30 min; absorb: 30 min 100% CO2, 40°C; desorb: 30 min N2, 40°C; nd = none detected.
5
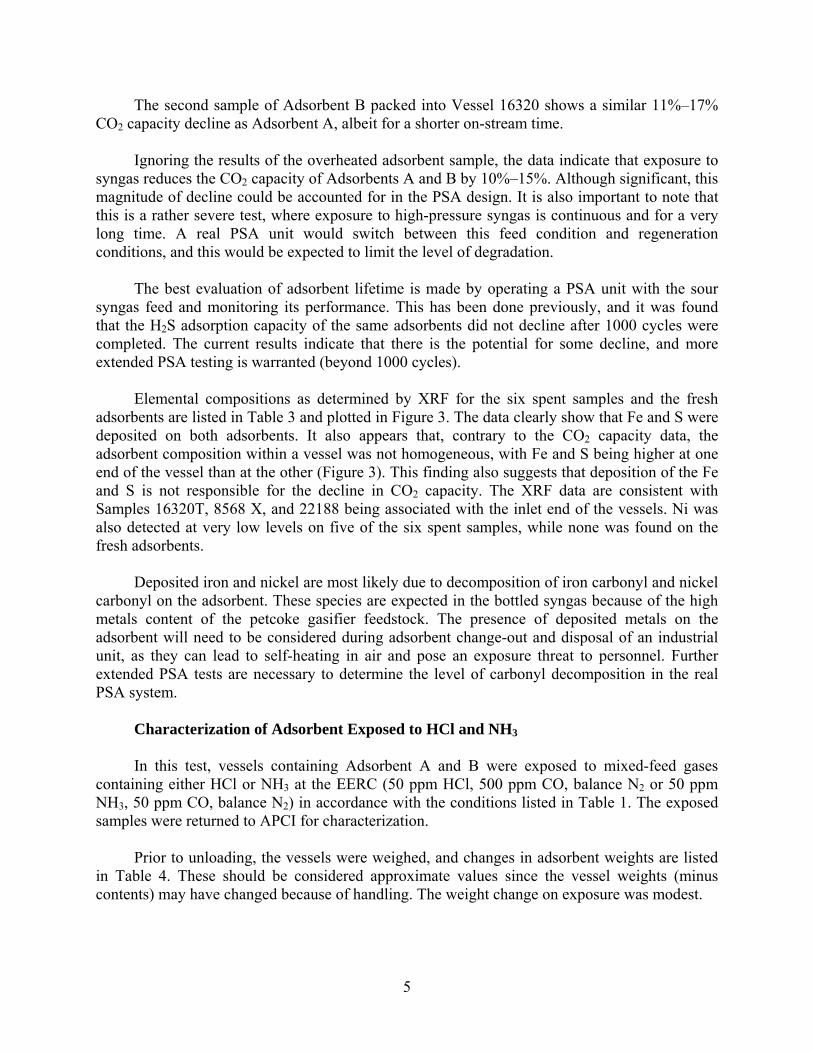
The second sample of Adsorbent B packed into Vessel 16320 shows a similar 11%–17% CO2 capacity decline as Adsorbent A, albeit for a shorter on-stream time. Ignoring the results of the overheated adsorbent sample, the data indicate that exposure to syngas reduces the CO2 capacity of Adsorbents A and B by 10%–15%. Although significant, this magnitude of decline could be accounted for in the PSA design. It is also important to note that this is a rather severe test, where exposure to high-pressure syngas is continuous and for a very long time. A real PSA unit would switch between this feed condition and regeneration conditions, and this would be expected to limit the level of degradation. The best evaluation of adsorbent lifetime is made by operating a PSA unit with the sour syngas feed and monitoring its performance. This has been done previously, and it was found that the H2S adsorption capacity of the same adsorbents did not decline after 1000 cycles were completed. The current results indicate that there is the potential for some decline, and more extended PSA testing is warranted (beyond 1000 cycles). Elemental compositions as determined by XRF for the six spent samples and the fresh adsorbents are listed in Table 3 and plotted in Figure 3. The data clearly show that Fe and S were deposited on both adsorbents. It also appears that, contrary to the CO2 capacity data, the adsorbent composition within a vessel was not homogeneous, with Fe and S being higher at one end of the vessel than at the other (Figure 3). This finding also suggests that deposition of the Fe and S is not responsible for the decline in CO2 capacity. The XRF data are consistent with Samples 16320T, 8568 X, and 22188 being associated with the inlet end of the vessels. Ni was also detected at very low levels on five of the six spent samples, while none was found on the fresh adsorbents. Deposited iron and nickel are most likely due to decomposition of iron carbonyl and nickel carbonyl on the adsorbent. These species are expected in the bottled syngas because of the high metals content of the petcoke gasifier feedstock. The presence of deposited metals on the adsorbent will need to be considered during adsorbent change-out and disposal of an industrial unit, as they can lead to self-heating in air and pose an exposure threat to personnel. Further extended PSA tests are necessary to determine the level of carbonyl decomposition in the real PSA system.
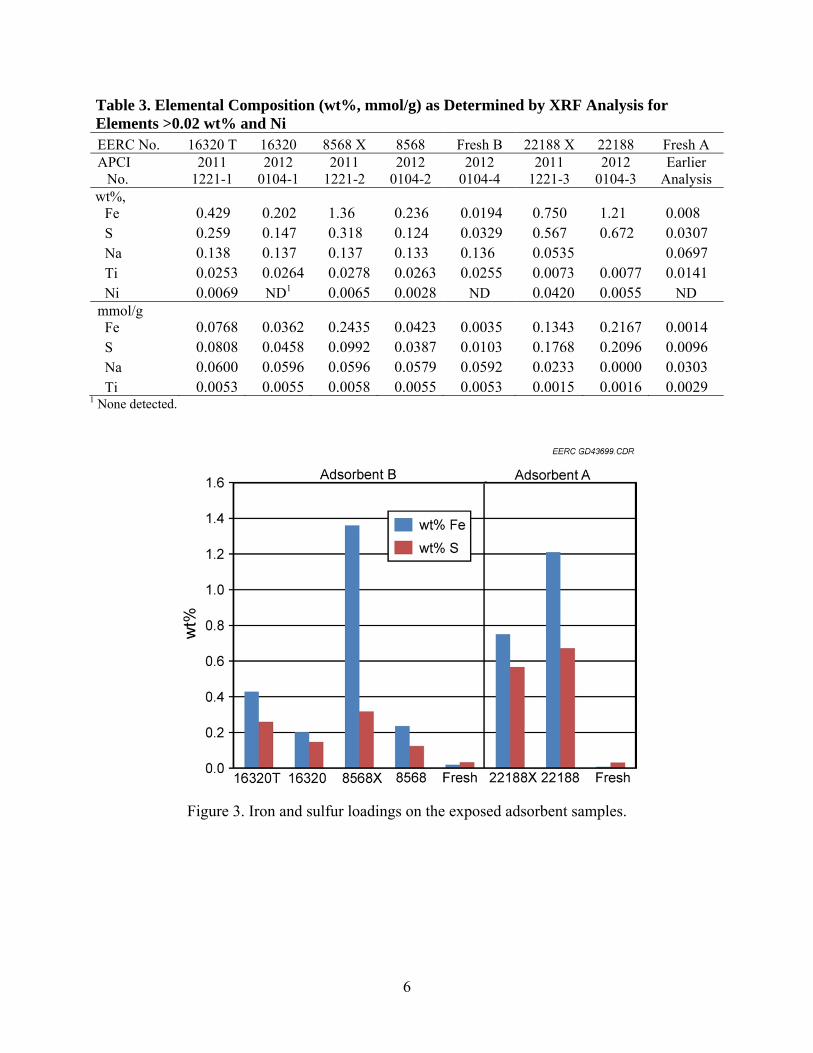
Characterization of Adsorbent Exposed to HCl and NH3 In this test, vessels containing Adsorbent A and B were exposed to mixed-feed gases containing either HCl or NH3 at the EERC (50 ppm HCl, 500 ppm CO, balance N2 or 50 ppm NH3, 50 ppm CO, balance N2) in accordance with the conditions listed in Table 1. The exposed samples were returned to APCI for characterization. Prior to unloading, the vessels were weighed, and changes in adsorbent weights are listed in Table 4. These should be considered approximate values since the vessel weights (minus contents) may have changed because of handling. The weight change on exposure was modest.
6
Table 3. Elemental Composition (wt%, mmol/g) as Determined by XRF Analysis for Elements >0.02 wt% and Ni EERC No. 16320 T 16320 8568 X 8568 Fresh B 22188 X 22188 Fresh AAPCI
No. 2011
1221-1 2012
0104-1 2011
1221-22012
0104-22012
0104-42011
1221-32012
0104-3 Earlier
Analysiswt%, Fe 0.429 0.202 1.36 0.236 0.0194 0.750 1.21 0.008 S 0.259 0.147 0.318 0.124 0.0329 0.567 0.672 0.0307 Na 0.138 0.137 0.137 0.133 0.136 0.0535 0.0697 Ti 0.0253 0.0264 0.0278 0.0263 0.0255 0.0073 0.0077 0.0141 Ni 0.0069 ND1 0.0065 0.0028 ND 0.0420 0.0055 NDmmol/g Fe 0.0768 0.0362 0.2435 0.0423 0.0035 0.1343 0.2167 0.0014 S 0.0808 0.0458 0.0992 0.0387 0.0103 0.1768 0.2096 0.0096 Na 0.0600 0.0596 0.0596 0.0579 0.0592 0.0233 0.0000 0.0303 Ti 0.0053 0.0055 0.0058 0.0055 0.0053 0.0015 0.0016 0.0029
1 None detected.
Figure 3. Iron and sulfur loadings on the exposed adsorbent samples.
7
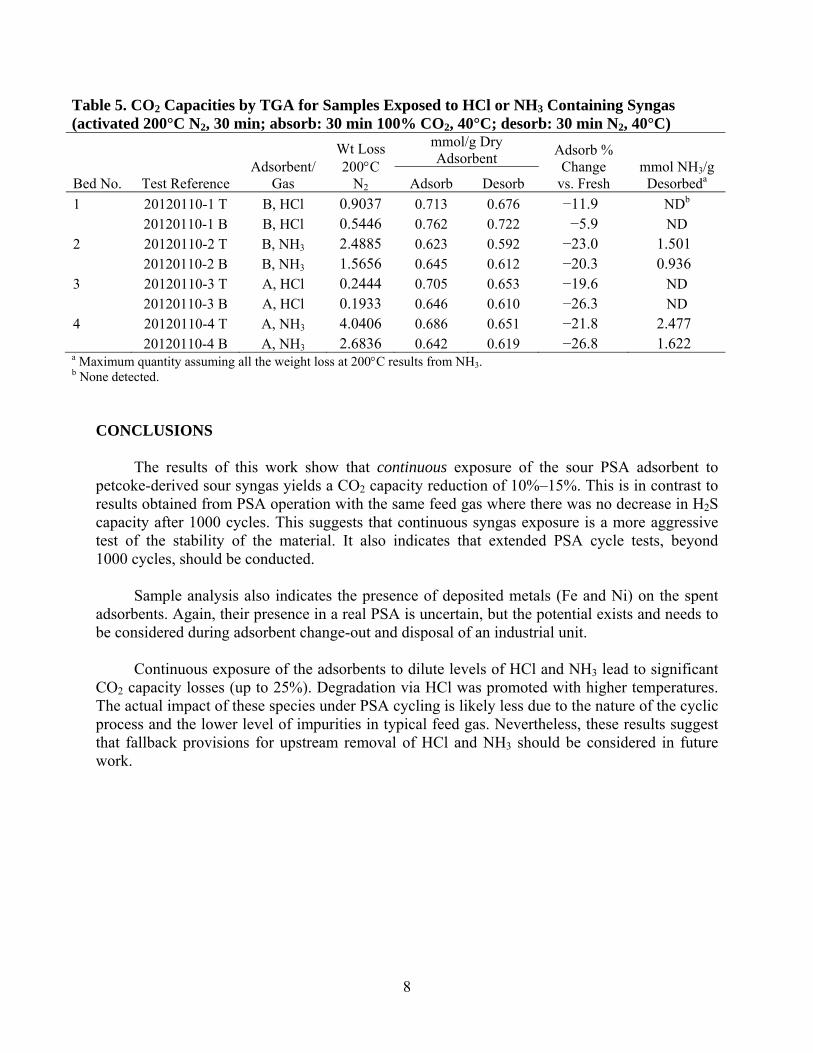
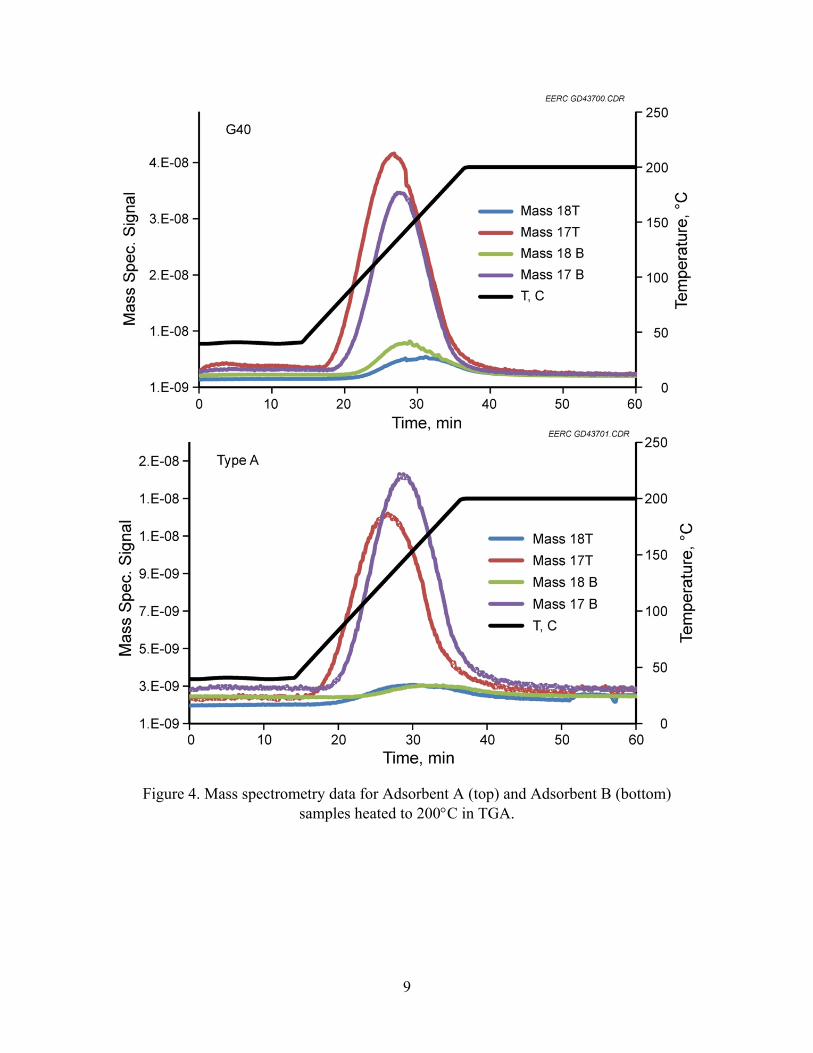
Table 4. Adsorbent Weight Change after Syngas Exposure Vessel Adsorbent Weight Adsorbent Weight Number Adsorbent/Gas Sample No. Before Exposure after Exposure % Change 1 B, HCl 20120110-1 2.67 2.74 2.62 2 B, NH3 20120110-2 2.78 2.81 1.08 3 A, HCl 20120110-3 2.57 2.62 1.95 4 A, NH3 20120110-4 2.49 2.63 5.62 The vessels were unloaded in a N2-purged dry box. A portion of the each adsorbent from the “T” end of the vessel (inlet) was removed and kept separate from the remainder marked “B” (outlet). As previously, CO2 capacities were determined by TGA and used as a measure of adsorbent degradation. Samples were heated in the TGA to 200C under a N2 purge, followed by cooling to 40C, and exposed to dry CO2 for 30 min. Results are summarized in Table 5. They show that continuous exposure of the adsorbents to 50 ppm HCl and NH3 yields a significant (up to 25%) decrease in the CO2 capacity of the material. There is generally not a very large difference in capacity between the inlet and bulk of the adsorbent, indicating that the exposure occurs throughout the sample. The results for Reactors 1 and 3 suggest that higher temperatures (60°C versus 20°C) promote adsorbent degradation by HCl, while the extent of NH3 degradation was similar at these two temperatures. Mass spectrometry was used to check for evolution of HCl and NH3 upon heating to 200C. The absence of a mass peak at 36 indicated that HCl was not desorbed during heating. NH3, however, was desorbed from the Vessel 2 and 4 samples as shown by a relatively large peak at 17. Water also has a mass peak at 17, but it is much smaller than its peak at 18, and it can be concluded that most (perhaps all) of the mass 17 peak intensity is due to NH3. Plots of mass 17 and 18 peak signals are shown in Figure 4. Estimates of the amount of NH3 desorbed are listed in Table 1 and assume that all of the TGA weight loss results from NH3. The message from these tests is that continuous exposure to NH3 and HCl at higher temperatures should be avoided. It is not clear if similar levels of degradation would be seen in a PSA unit operating with limited feed/regeneration steps and with much lower HCl/NH3 levels. Additional long-term PSA testing is needed to investigate that point. If degradation is observed, then process designs that incorporate upstream removal of NH3 and HCl should be investigated.
8
Table 5. CO2 Capacities by TGA for Samples Exposed to HCl or NH3 Containing Syngas (activated 200°C N2, 30 min; absorb: 30 min 100% CO2, 40°C; desorb: 30 min N2, 40°C)
Adsorbent/ Gas
Wt Loss 200C
N2
mmol/g Dry Adsorbent
Adsorb % Change
vs. Fresh
mmol NH3/g
DesorbedaBed No. Test Reference Adsorb Desorb
1 20120110-1 T B, HCl 0.9037 0.713 0.676 −11.9 NDb
20120110-1 B B, HCl 0.5446 0.762 0.722 −5.9 ND2 20120110-2 T B, NH3 2.4885 0.623 0.592 −23.0 1.501 20120110-2 B B, NH3 1.5656 0.645 0.612 −20.3 0.936 3 20120110-3 T A, HCl 0.2444 0.705 0.653 −19.6 ND 20120110-3 B A, HCl 0.1933 0.646 0.610 −26.3 ND4 20120110-4 T A, NH3 4.0406 0.686 0.651 −21.8 2.477 20120110-4 B A, NH3 2.6836 0.642 0.619 −26.8 1.622 a Maximum quantity assuming all the weight loss at 200C results from NH3. b None detected.
CONCLUSIONS The results of this work show that continuous exposure of the sour PSA adsorbent to petcoke-derived sour syngas yields a CO2 capacity reduction of 10%–15%. This is in contrast to results obtained from PSA operation with the same feed gas where there was no decrease in H2S capacity after 1000 cycles. This suggests that continuous syngas exposure is a more aggressive test of the stability of the material. It also indicates that extended PSA cycle tests, beyond 1000 cycles, should be conducted. Sample analysis also indicates the presence of deposited metals (Fe and Ni) on the spent adsorbents. Again, their presence in a real PSA is uncertain, but the potential exists and needs to be considered during adsorbent change-out and disposal of an industrial unit. Continuous exposure of the adsorbents to dilute levels of HCl and NH3 lead to significant CO2 capacity losses (up to 25%). Degradation via HCl was promoted with higher temperatures. The actual impact of these species under PSA cycling is likely less due to the nature of the cyclic process and the lower level of impurities in typical feed gas. Nevertheless, these results suggest that fallback provisions for upstream removal of HCl and NH3 should be considered in future work.
9
Figure 4. Mass spectrometry data for Adsorbent A (top) and Adsorbent B (bottom) samples heated to 200C in TGA.
APPENDIX A
SYNGAS ANALYSIS
A-1

A-2
A-3