Embed Size (px)
Citation preview
HYDROGENATION
Vegetable oil
Seventy five (75) % of world edible oil is vegetable oil
•Shortening
•Margarine
•Mayonnaise
•Confectionary fat
•Less desirable for salad and frying oil, Why?
Melting Point
•Slip Melting PointOfficial AOCS (1989) Method Cc 3-25. A column of fat was tempered at 10 C for 16 h in an open capillary tube. The tube was then heated slowly in a water bath until the fat column started to rise due to hydrostatic pressure. The temperature at which this occurs was determined as SMP using averaging of four replicates.
•Solid Fat Content (Nuclear Magnetic Resonance, NMR)
Hydrogenation
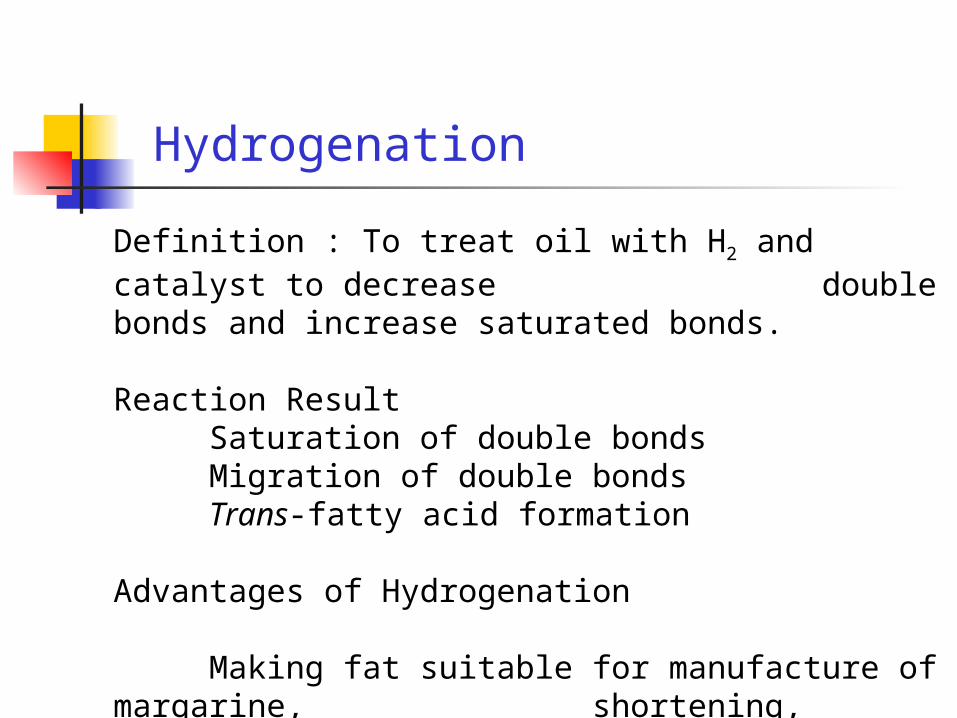
Definition : To treat oil with H2 and catalyst to decrease double bonds and increase saturated bonds.
Reaction ResultSaturation of double bondsMigration of double bondsTrans-fatty acid formation
Advantages of Hydrogenation
Making fat suitable for manufacture of margarine, shortening, coating fats, cooking oil and salad
dressing oil.
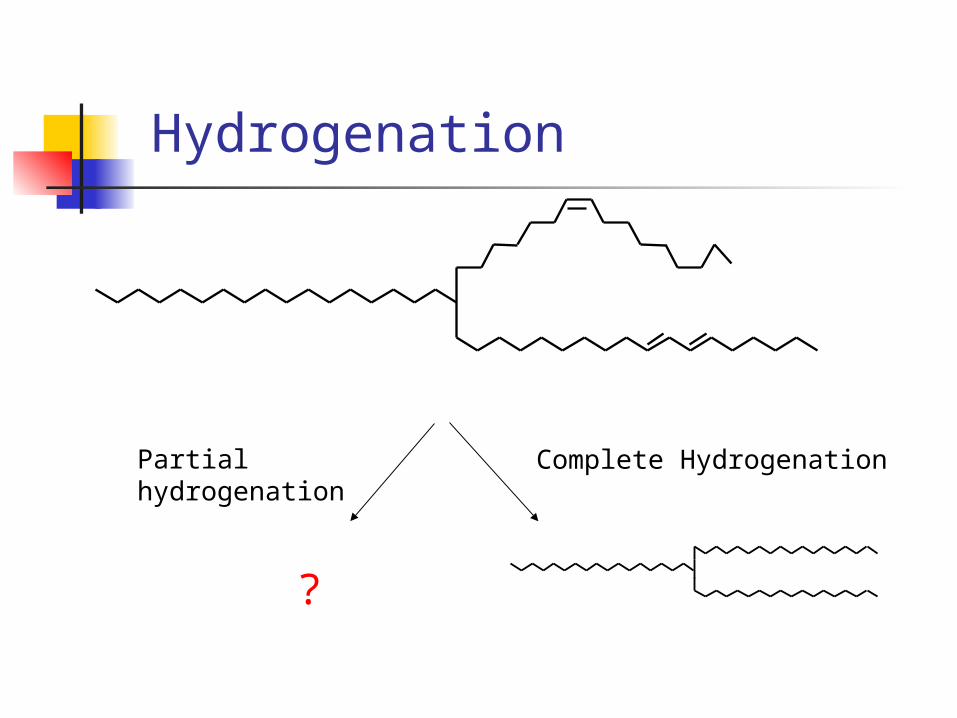
Hydrogenation
Complete HydrogenationPartial hydrogenation
?
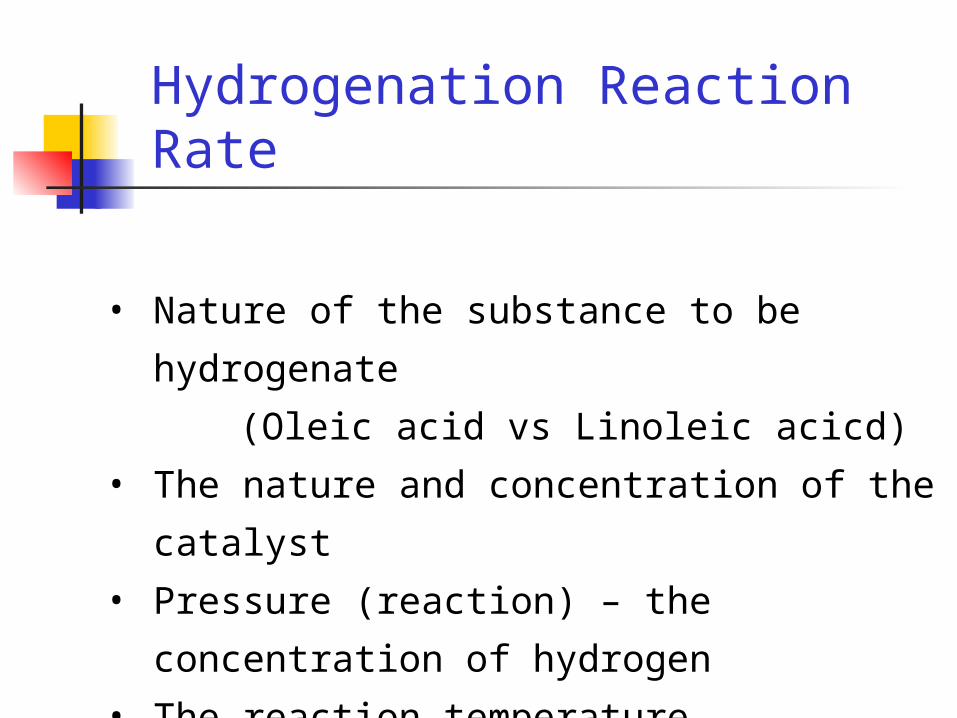
Hydrogenation Reaction Rate
• Nature of the substance to be hydrogenate
(Oleic acid vs Linoleic acicd)
• The nature and concentration of the catalyst
• Pressure (reaction) – the concentration of hydrogen
• The reaction temperature
• The degree of agitation
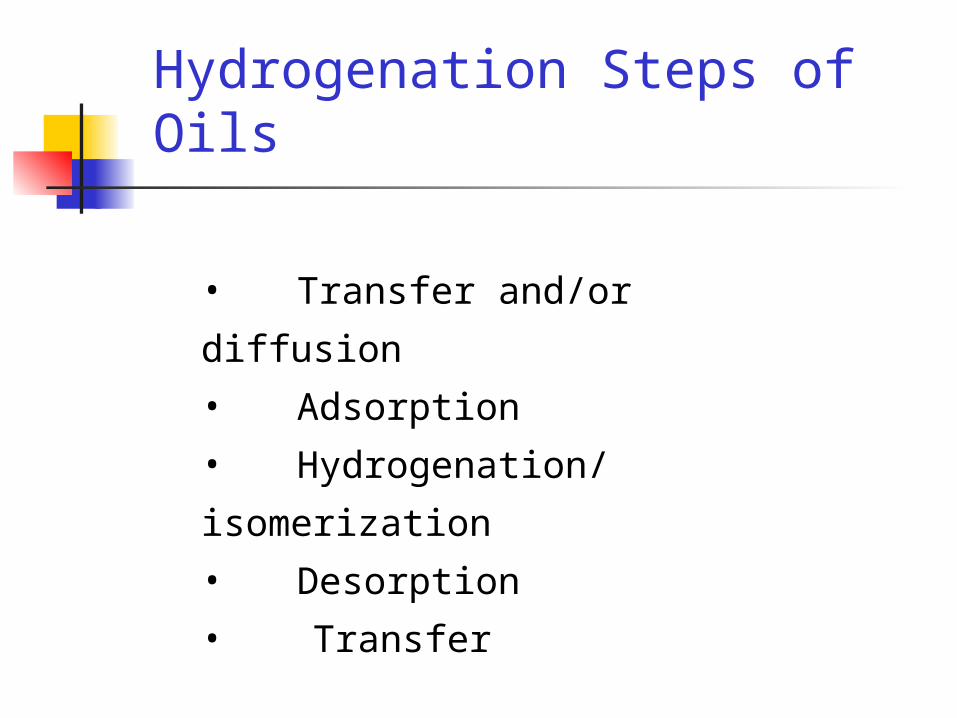
Hydrogenation Steps of Oils
• Transfer and/or diffusion
• Adsorption
• Hydrogenation/isomerization
• Desorption
• Transfer
Transfer and Diffusion
Transfer and adsorption steps are critical steps in controlling the degree of isomerization and selectivity of reactions.
Transfer: Transfer of reactants and products to and from the bulk of the liquid oil phase and outside
surface of the catalyst.
Diffusion: Diffusion of reactant into the pores of the catalyst. Diffusion of products out
of the pores of catalyst.
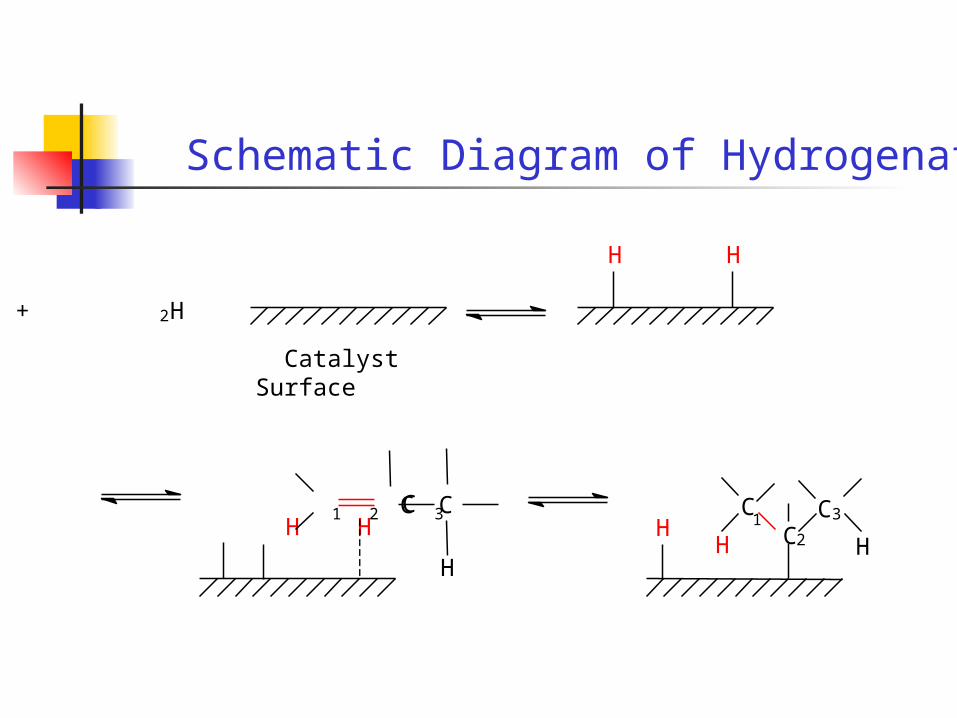
Schematic Diagram of Hydrogenation
H2 +
Catalyst Surface
C1 C2 C3 H H
H
H H
H C2
C1
H
C3
H
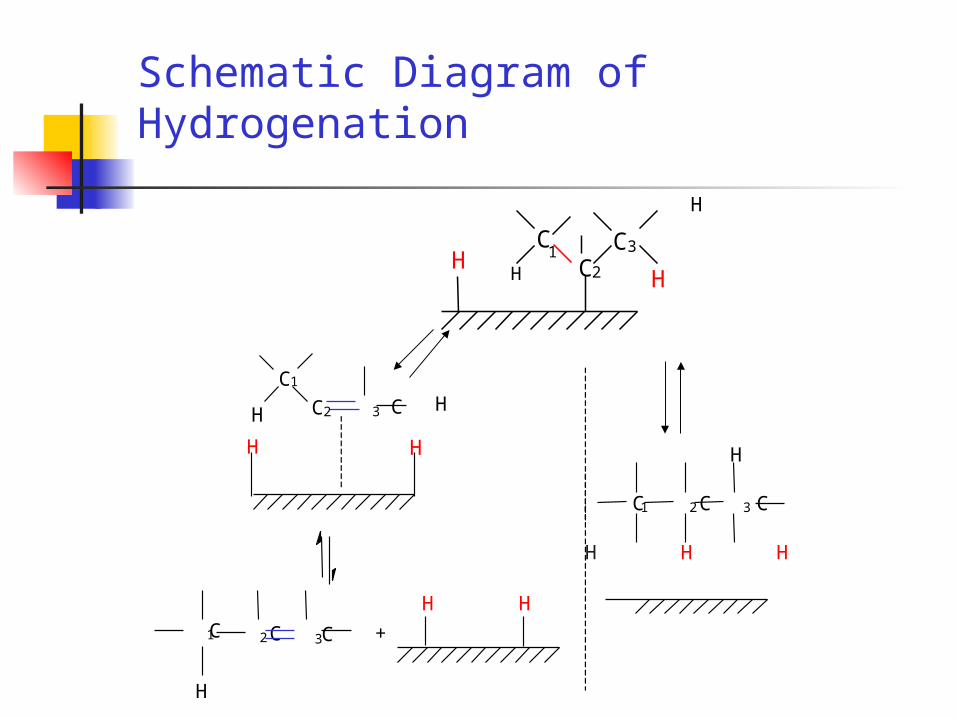
Schematic Diagram of Hydrogenation
H H H
C1 C2 C3
H
H H
+
H
C1 C2 C 3
H H
C2 C3 HC1
H
H C2
C1
H
C3
H
H
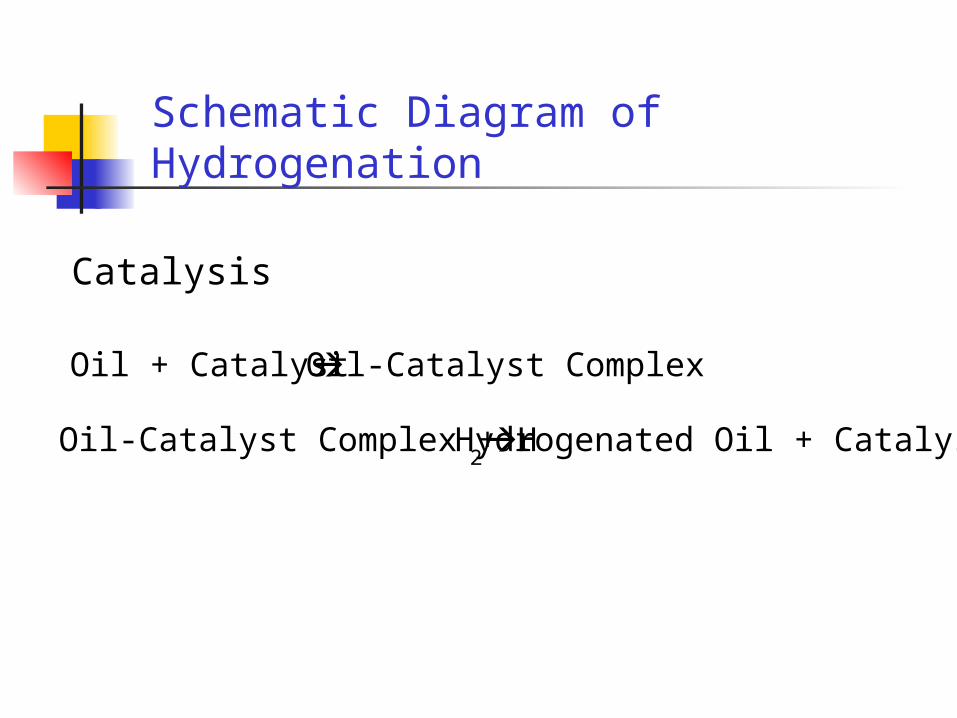
Schematic Diagram of Hydrogenation
Catalysis
Oil + Catalyst Oil-Catalyst Complex
Oil-Catalyst Complex + H2 Hydrogenated Oil + Catalyst
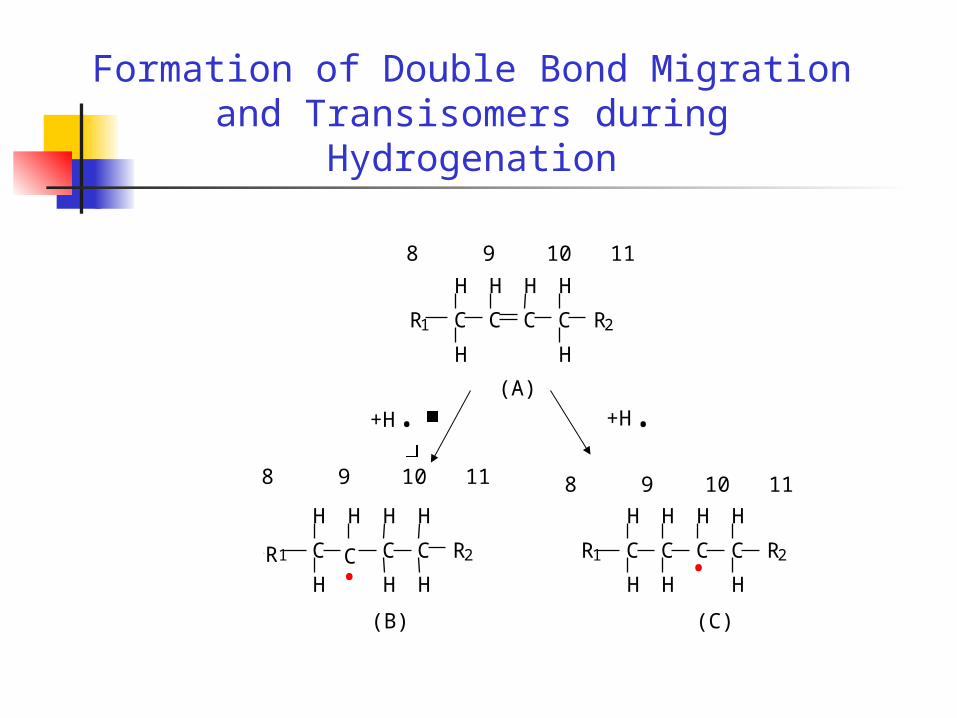
Formation of Double Bond Migration and Transisomers during Hydrogenation
8 9 10 11
R1 C C C C
H
H
H
R2
H
H
H
(A)
+H . +H .
R 1 C C
H
H
C C R2
H
H
H
H
H
. R1 C C
H
H
C C R2
H
H
H
H
H
. (B) (C)
R
8 9 10 11 8 9 10 11
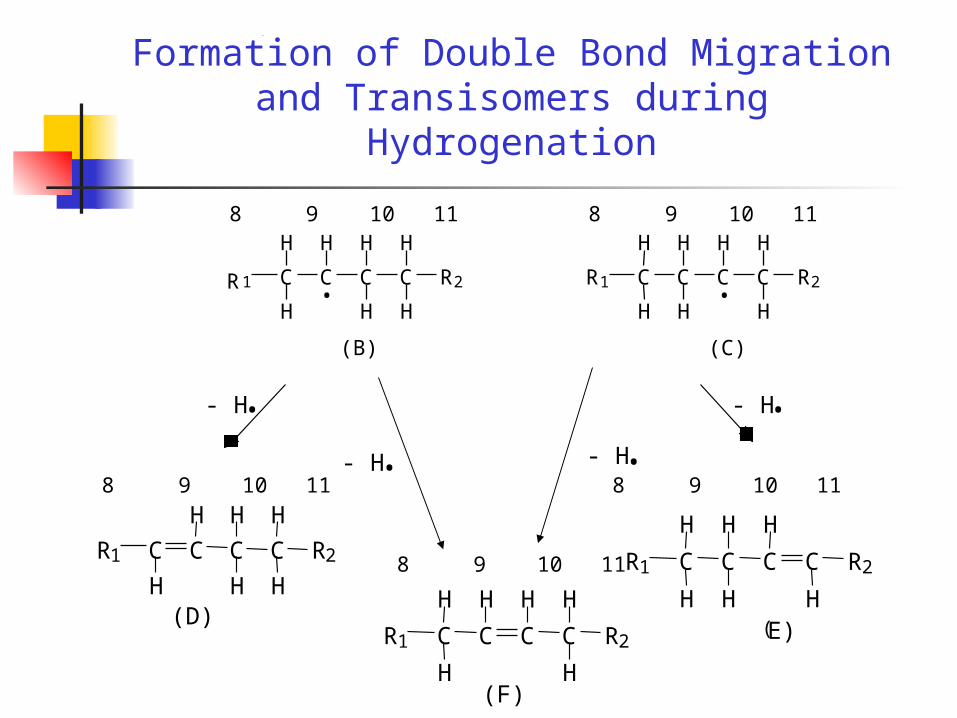
Formation of Double Bond Migration and Transisomers during Hydrogenation
R
- H
R1 C C C C
H
H
H
R2
H
H
H
C CR1 C C R2
H
H H
H
H
HR1 C C C C R2
H
H
H
H
H
H(D) (E)
(F)
.. .
.- H- H
- H
1 C C
H
H
C C R2
H
H
H
H
H
. R1 C C
H
H
C C R2
H
H
H
H
H
.
(B) (C)
R
8 9 10 11 8 9 10 11
8 9 10 11 8 9 10 11
8 9 10 11
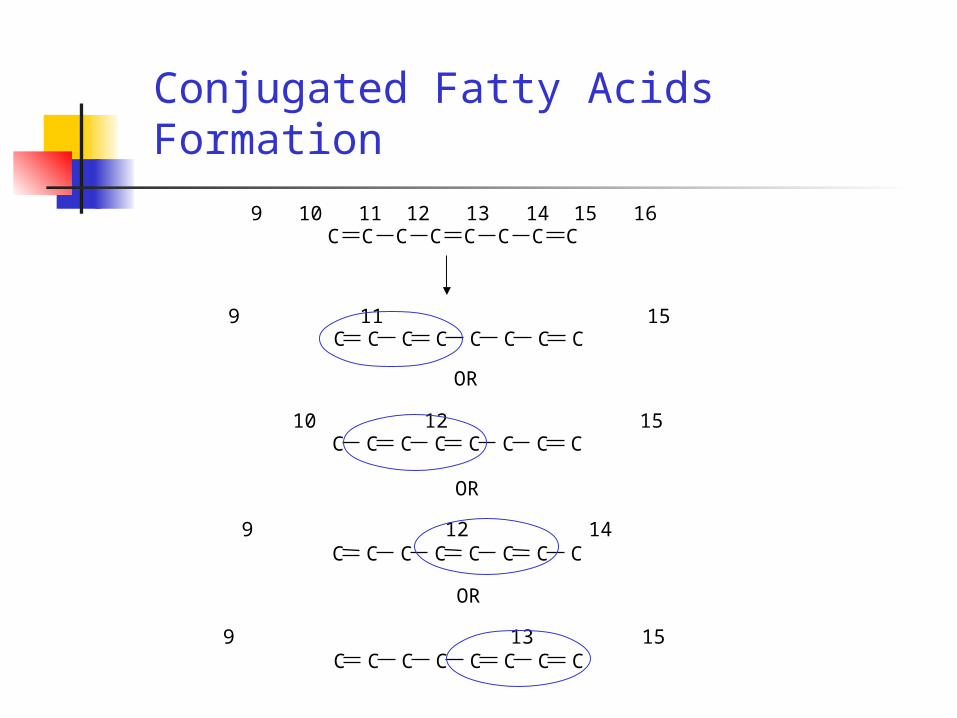
Conjugated Fatty Acids Formation
C C C C C C C C9 10 11 12 13 14 15 16
9 11 15C C C C C C C C
OR
10 12 15C C C C C C C C
C C C C C C C C
OR
9 12 14
9 13 15
OR
C C C C C C C C
Adsorption
Adsorption of the reactants on the catalyst surface is
important in controlling the selectivity and isomerization
during hydrogenation.
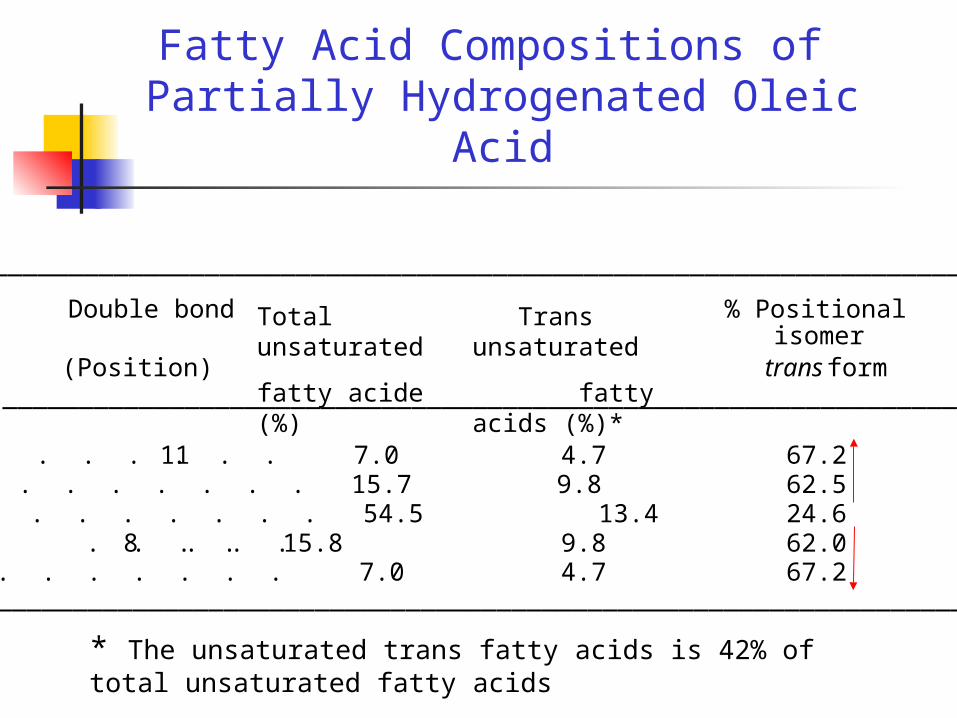
Fatty Acid Compositions of Partially Hydrogenated Oleic Acid
Double bond % Positional isomer(Position) trans form__________________________________________________________________
11 . . . . . . . 7.0 4.7 67.2 10 . . . . . . . 15.7 9.8 62.5 9 . . . . . . . 54.5 13.4 24.6
8 . . . . . . . 15.8 9.8 62.0 7 . . . . . . . 7.0 4.7 67.2
__________________________________________________________________
__________________________________________________________________
Total unsaturated
fatty acide (%)
Trans unsaturated
fatty acids (%)*
* The unsaturated trans fatty acids is 42% of total unsaturated fatty acids
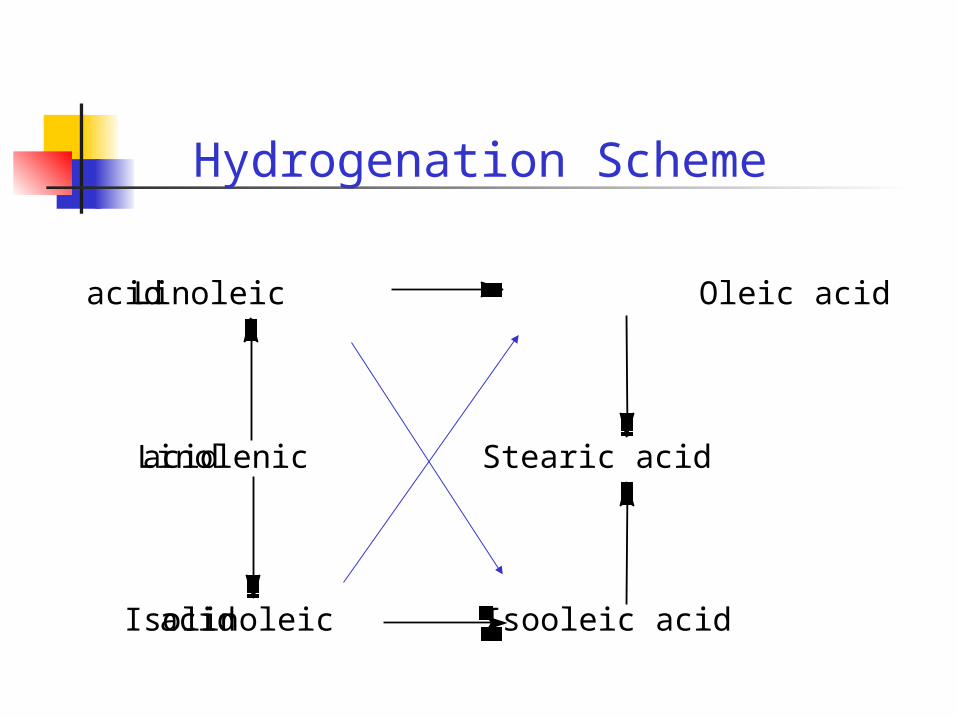
Hydrogenation Scheme
Linoleic acid Oleic acid
Linolenic acid Stearic acid
Isolinoleic acid Isooleic acid
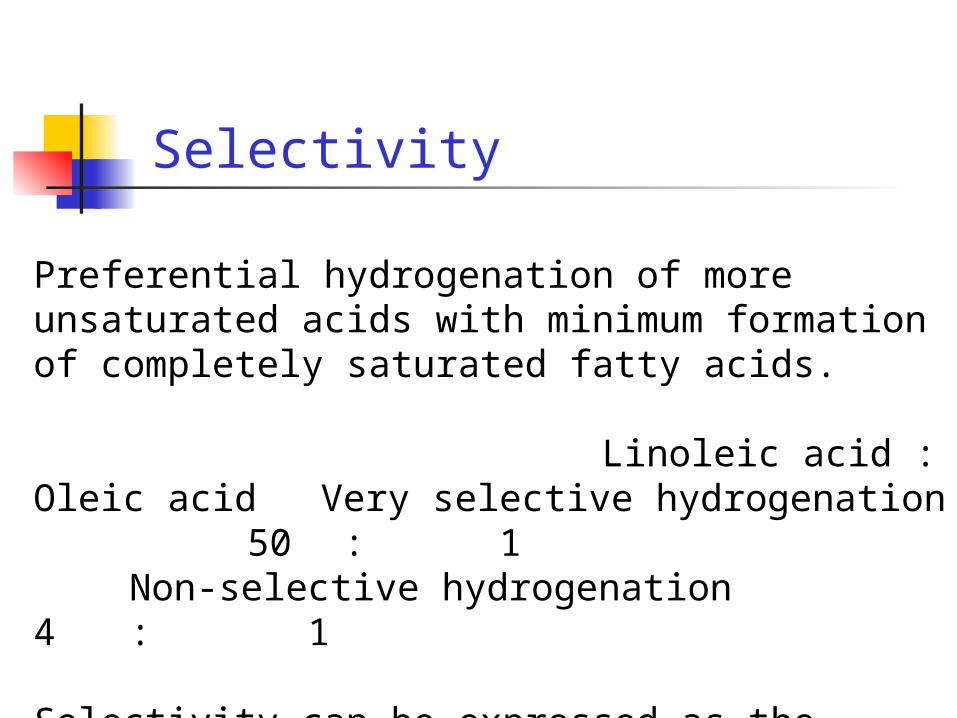
Selectivity
Preferential hydrogenation of more unsaturated acids with minimum formation of completely saturated fatty acids.
Linoleic acid : Oleic acidVery selective hydrogenation 50 : 1Non-selective hydrogenation 4 : 1
Selectivity can be expressed as the ratio KLO/KO ; the relative rate of hydrogenation of linoleate to that of oleate.
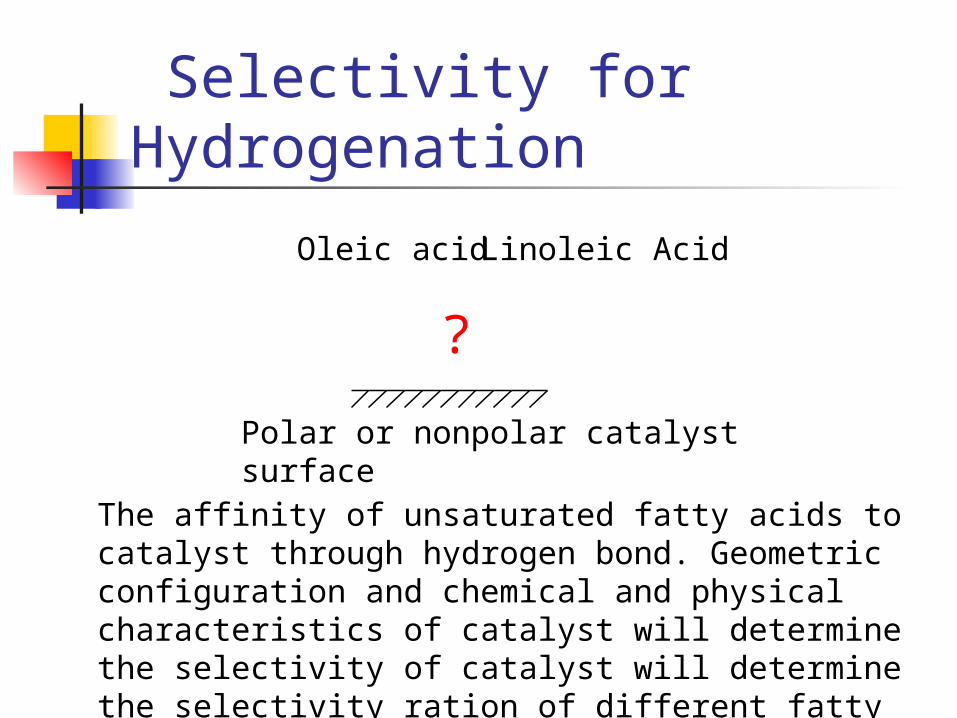
Selectivity for Hydrogenation
Oleic acid Linoleic Acid
?
The affinity of unsaturated fatty acids to catalyst through hydrogen bond. Geometric configuration and chemical and physical characteristics of catalyst will determine the selectivity of catalyst will determine the selectivity ration of different fatty acids.
Polar or nonpolar catalyst surface
Why does selectivity important in hydrogenation?
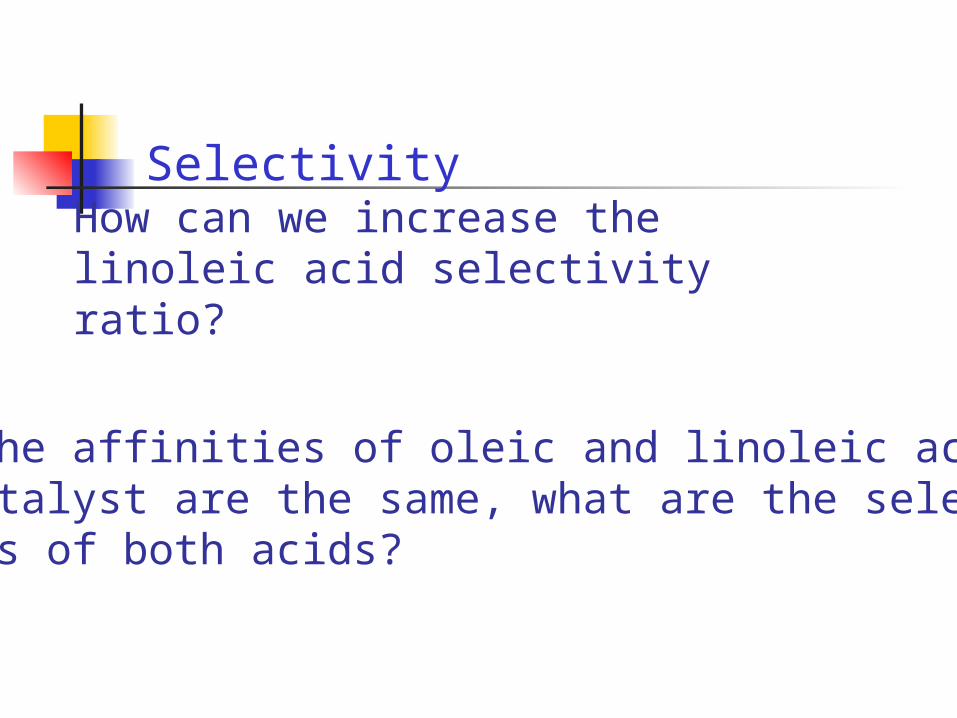
How can we increase the linoleic acid selectivity ratio?
When the affinities of oleic and linoleic acids to catalyst are the same, what are the selectivity ratios of both acids?
Selectivity

Hydrogenation of Soybean Oil
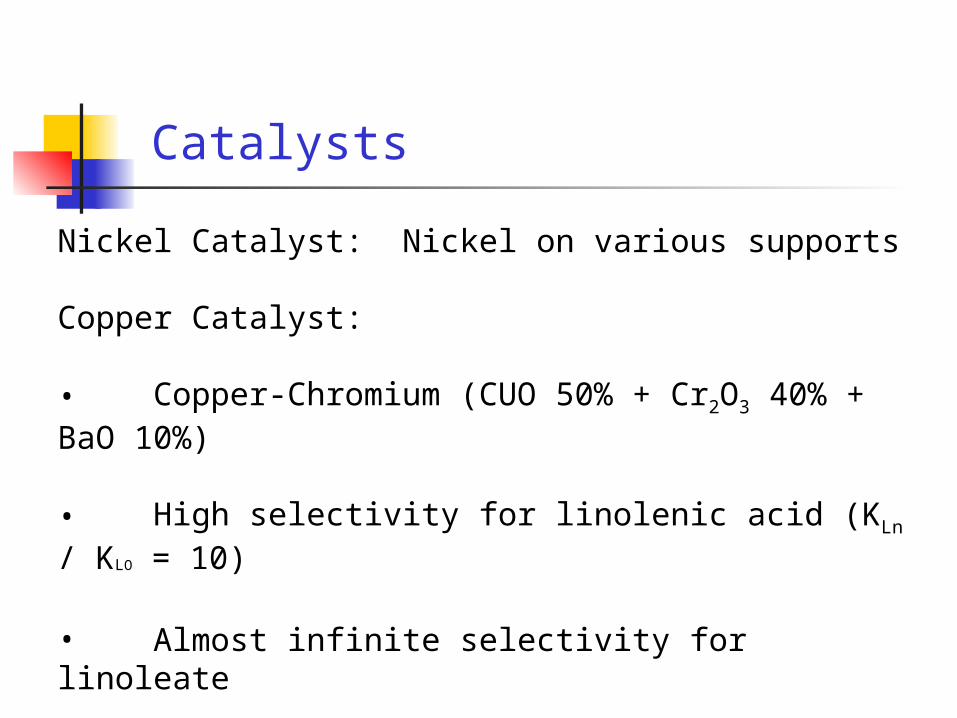
Catalysts
Nickel Catalyst: Nickel on various supports
Copper Catalyst:
• Copper-Chromium (CUO 50% + Cr2O3 40% + BaO 10%)
• High selectivity for linolenic acid (KLn / KLO = 10)
• Almost infinite selectivity for linoleate
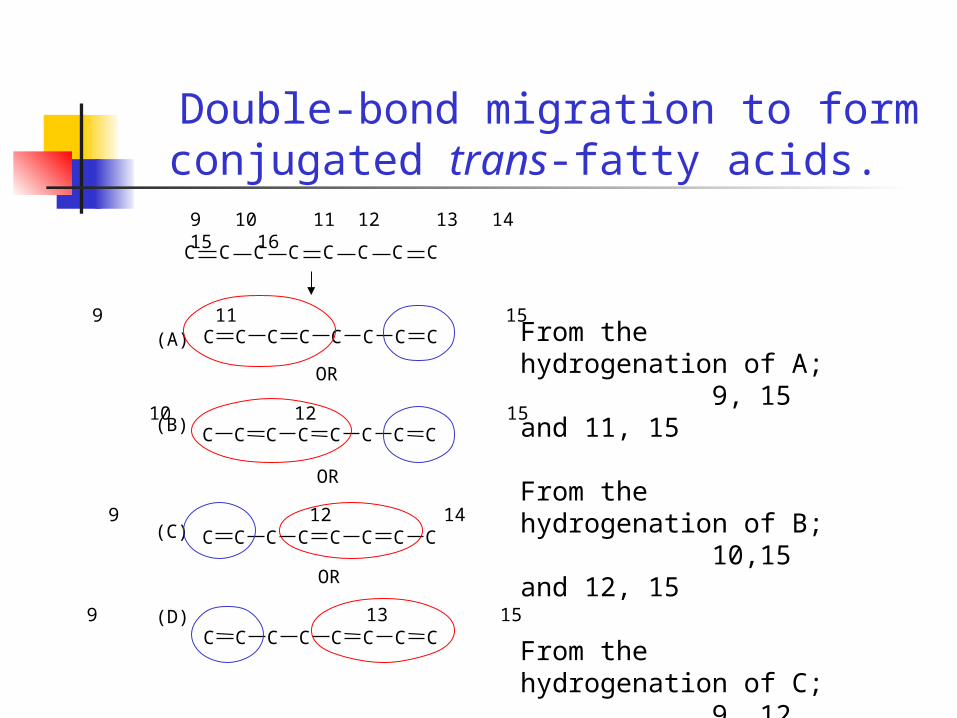
Double-bond migration to form conjugated trans-fatty acids.
C C C C C C C C
OR
9 13 15
9 12 14
OR
C C C C C C C C
C C C C C C C C 10 12 15
OR
C C C C C C C C9 11 15
9 10 11 12 13 14 15 16
C C C C C C C C
(A)
(B)
(C)
(D)
From the hydrogenation of A; 9, 15 and 11,
15
From the hydrogenation of B; 10,15 and
12, 15
From the hydrogenation of C; 9, 12 and 9,
14
From the hydrogenation of D; 9, 13 and 9,
15
Triglyceride Stereospecificity
Hydrogenation of fatty acids in triglyceride is
not a function of their location
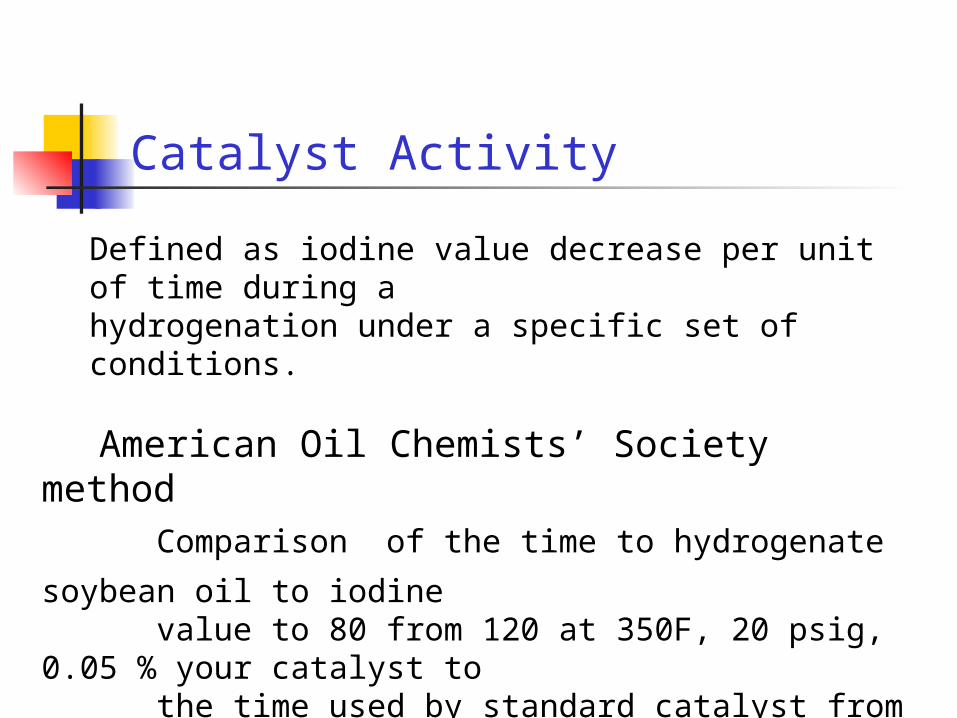
Catalyst Activity
Defined as iodine value decrease per unit of time during a hydrogenation under a specific set of conditions.
American Oil Chemists’ Society method Comparison of the time to hydrogenate soybean oil to iodine value to 80 from 120 at 350F, 20 psig, 0.05 % your catalyst to the time used by standard catalyst from AOCS
The life of catalyst – how long a catalyst will remain active and useful.
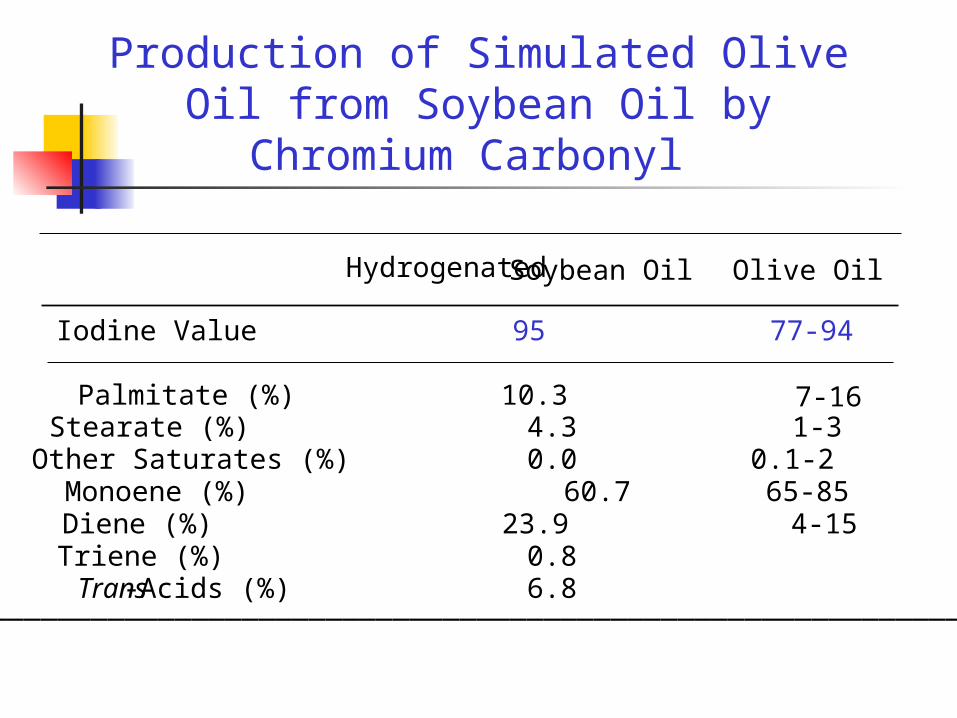
Production of Simulated Olive Oil from Soybean Oil by Chromium Carbonyl
Hydrogenated Soybean Oil Olive Oil
Iodine Value 95 77-94
Palmitate (%) 10.3 7-16Stearate (%) 4.3 1-3Other Saturates (%) 0.0 0.1-2Monoene (%) 60.7 65-85Diene (%) 23.9 4-15Triene (%) 0.8Trans-Acids (%) 6.8
_____________________________________________________________
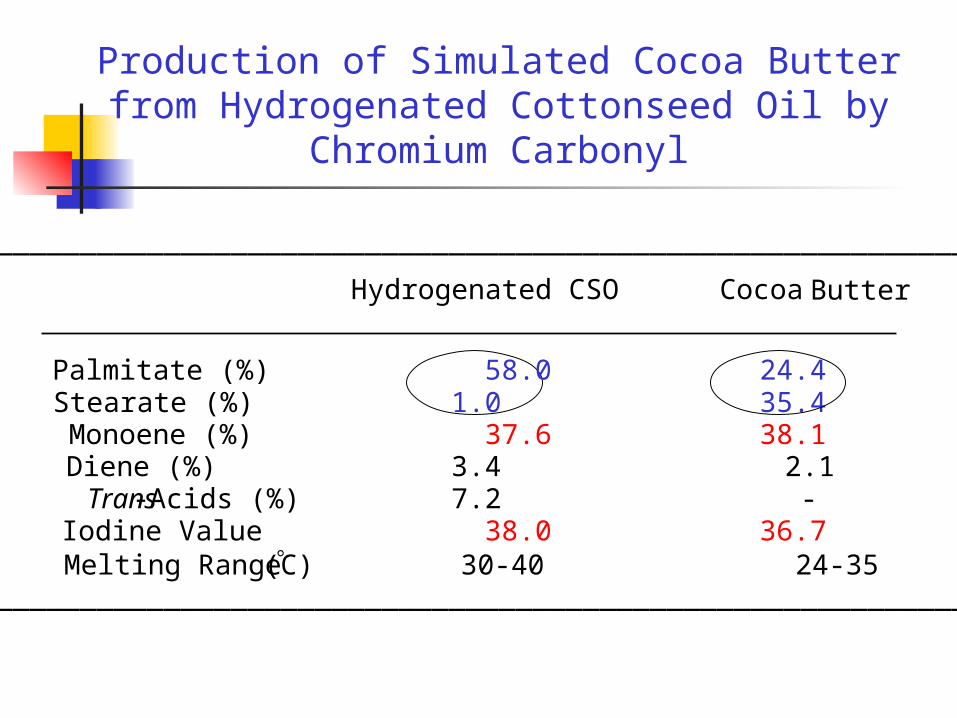
Production of Simulated Cocoa Butter from Hydrogenated Cottonseed Oil by Chromium Carbonyl
_____________________________________________________________
Hydrogenated CSO Cocoa Butter
Palmitate (%) 58.0 24.4Stearate (%) 1.0 35.4Monoene (%) 37.6 38.1Diene (%) 3.4 2.1Trans-Acids (%) 7.2 -Iodine Value 38.0 36.7Melting Range ( C) 30-40 24-35
_____________________________________________________________
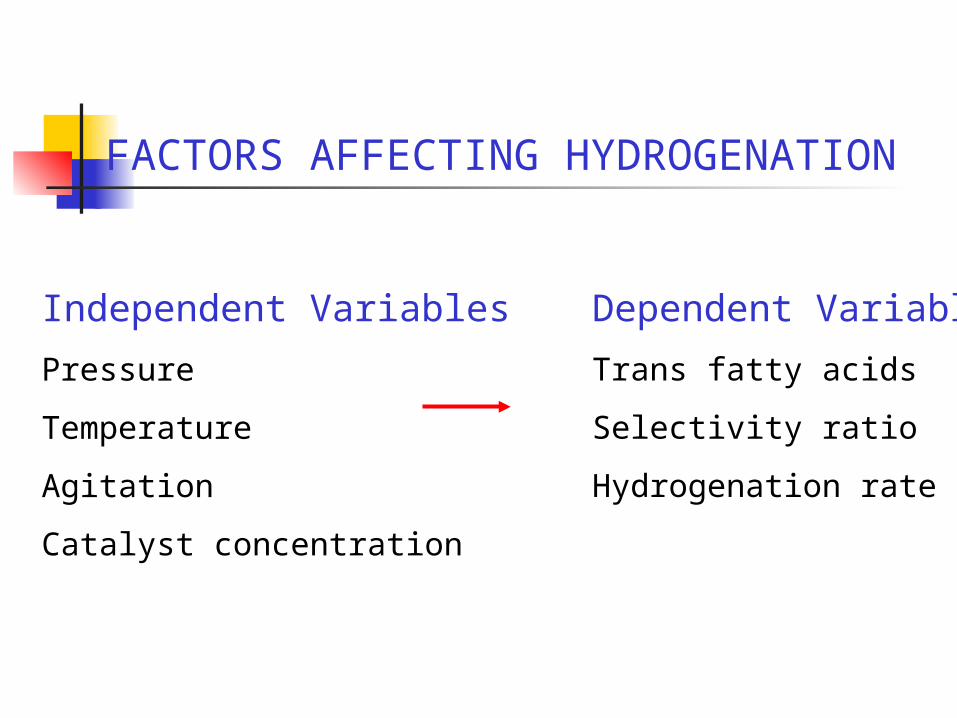
FACTORS AFFECTING HYDROGENATION
Independent Variables
Pressure
Temperature
Agitation
Catalyst concentration
Dependent Variables
Trans fatty acids
Selectivity ratio
Hydrogenation rate
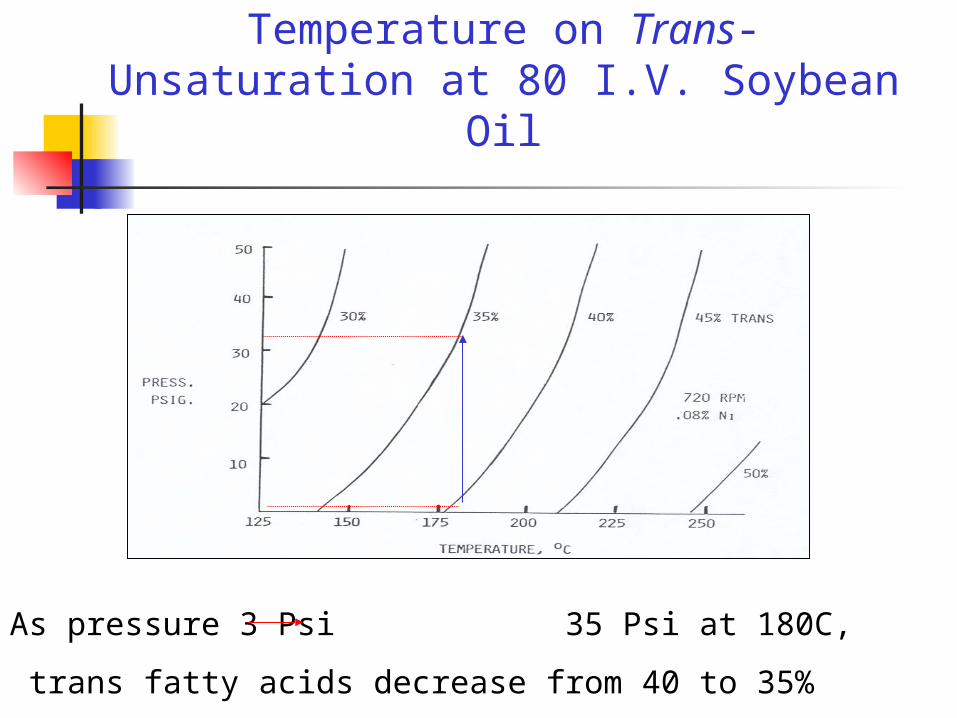
Effects of Pressure and Temperature on Trans-Unsaturation at 80 I.V. Soybean Oil
As pressure 3 Psi 35 Psi at 180C,
trans fatty acids decrease from 40 to 35%
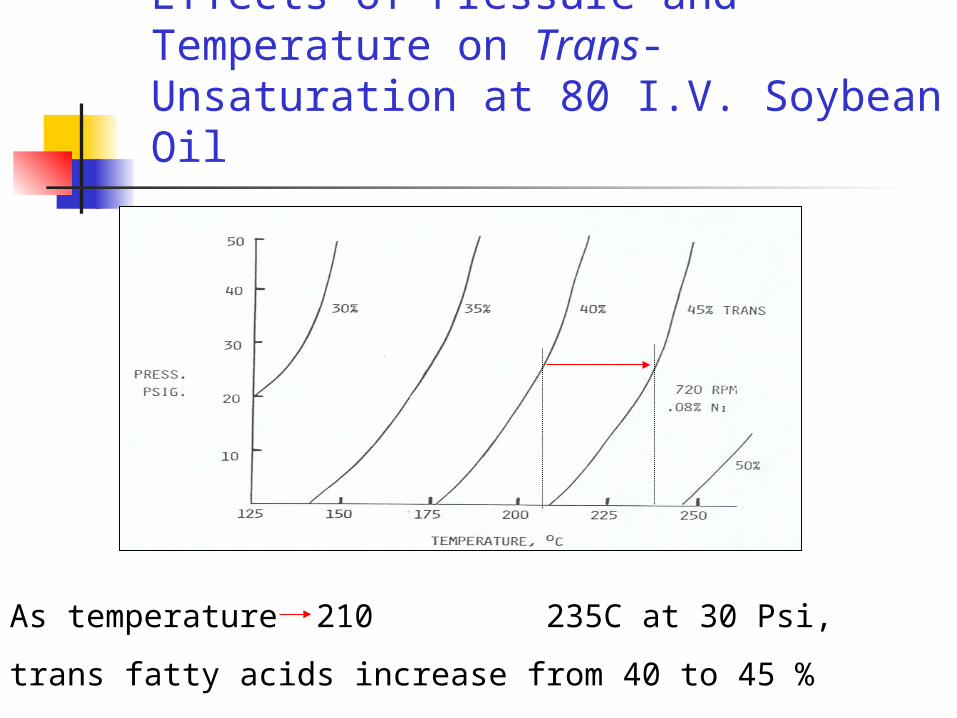
Effects of Pressure and Temperature on Trans-Unsaturation at 80 I.V. Soybean Oil
As temperature 210 235C at 30 Psi,
trans fatty acids increase from 40 to 45 %
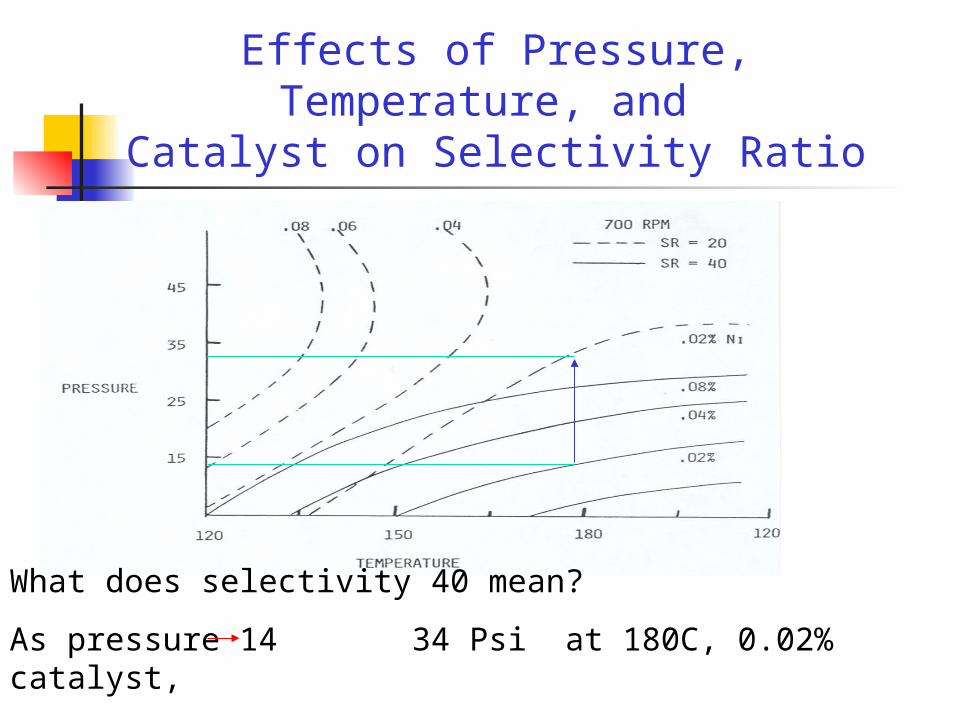
Effects of Pressure, Temperature, and Catalyst on Selectivity Ratio
What does selectivity 40 mean?
As pressure 14 34 Psi at 180C, 0.02% catalyst,
selectivity rate decrease from 40 to 20
Effects of Pressure, Temperature, and Catalyst on Selectivity Ratio
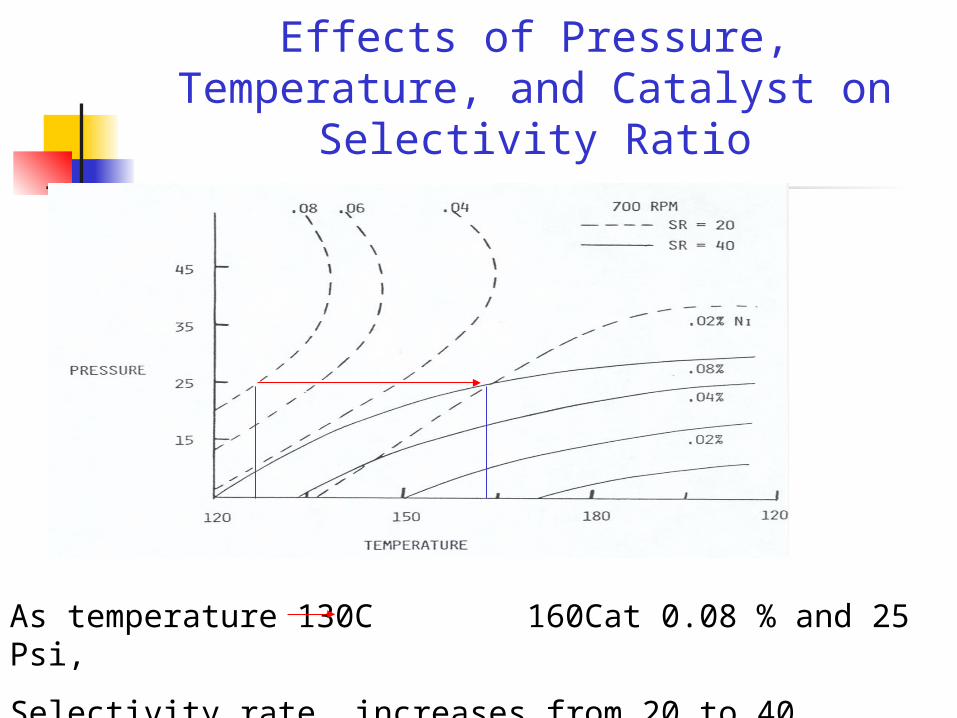
As temperature 130C 160Cat 0.08 % and 25 Psi,
Selectivity rate increases from 20 to 40
Effects of Pressure, Temperature, and Catalyst on Selectivity Ratio
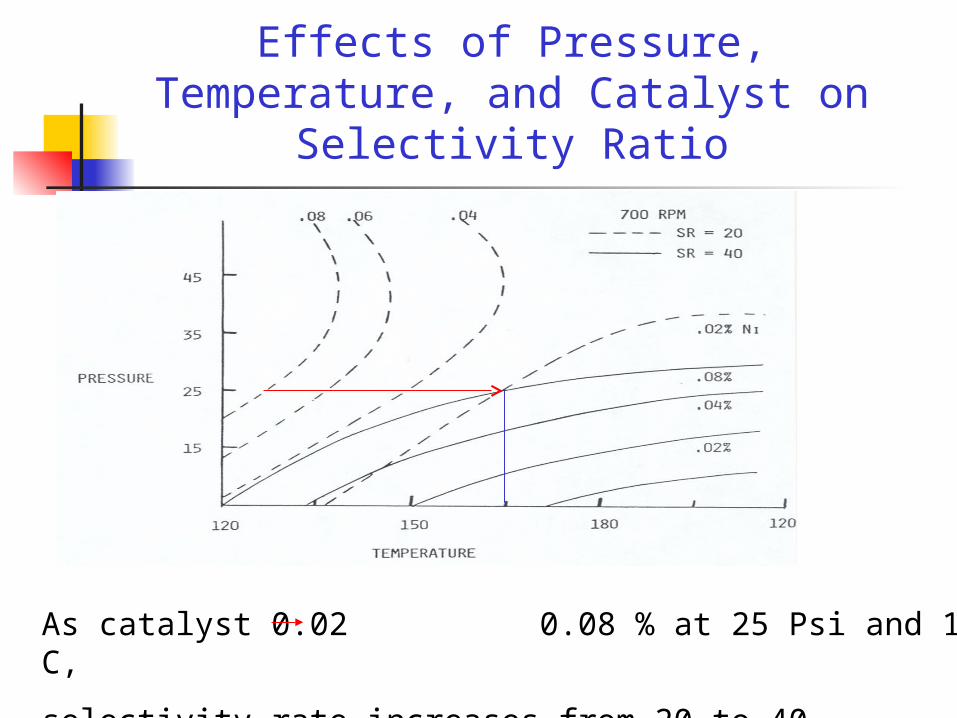
As catalyst 0.02 0.08 % at 25 Psi and 165 C,
selectivity rate increases from 20 to 40
Effects of Agitation and CatalystConcentration on Selectivity Ratio
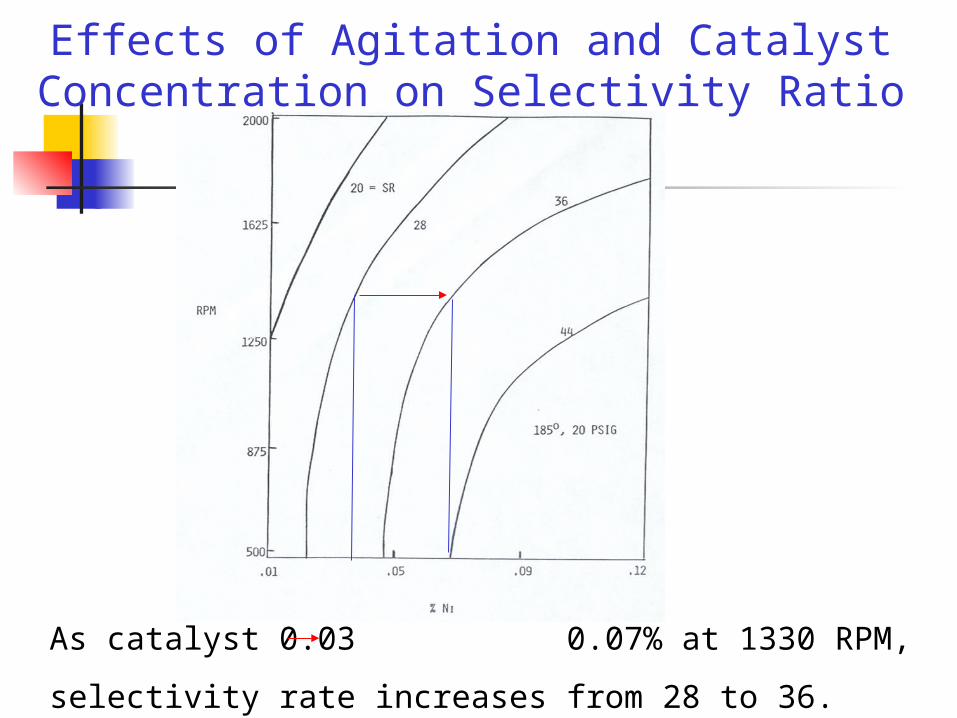
As catalyst 0.03 0.07% at 1330 RPM,
selectivity rate increases from 28 to 36.
Effects of Agitation and Catalyst Concentration on Selectivity Ratio
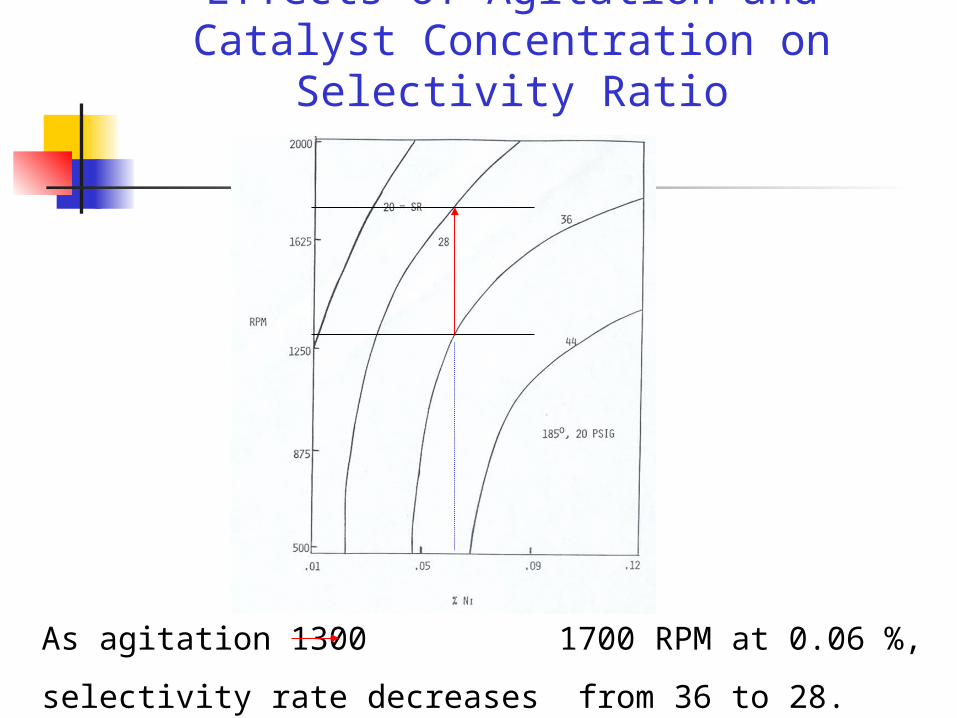
As agitation 1300 1700 RPM at 0.06 %,
selectivity rate decreases from 36 to 28.
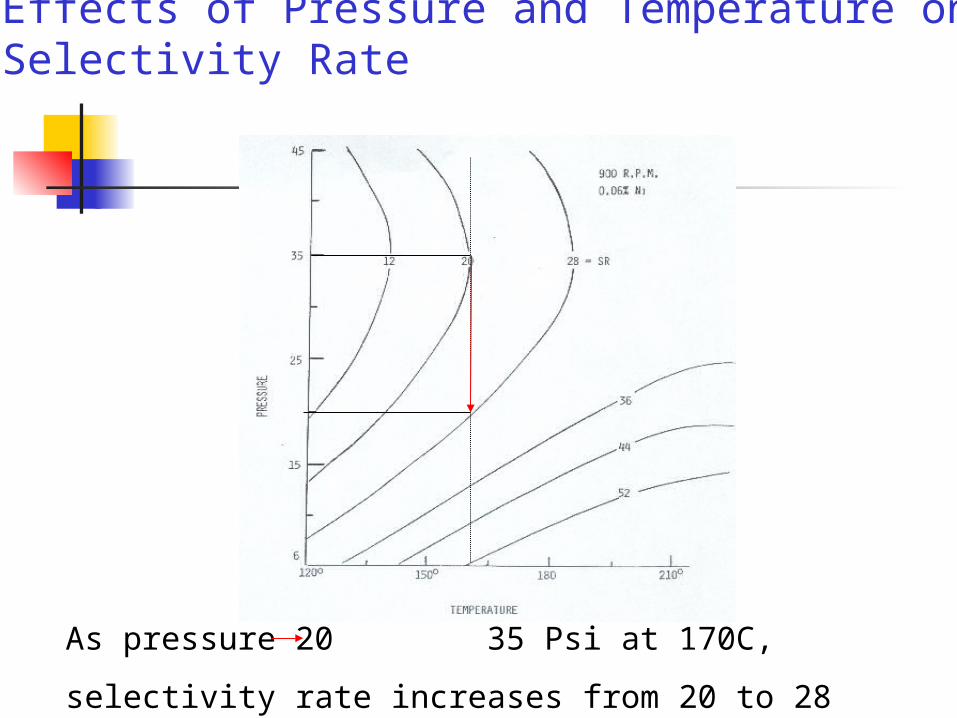
Effects of Pressure and Temperature on Selectivity Rate
As pressure 20 35 Psi at 170C,
selectivity rate increases from 20 to 28
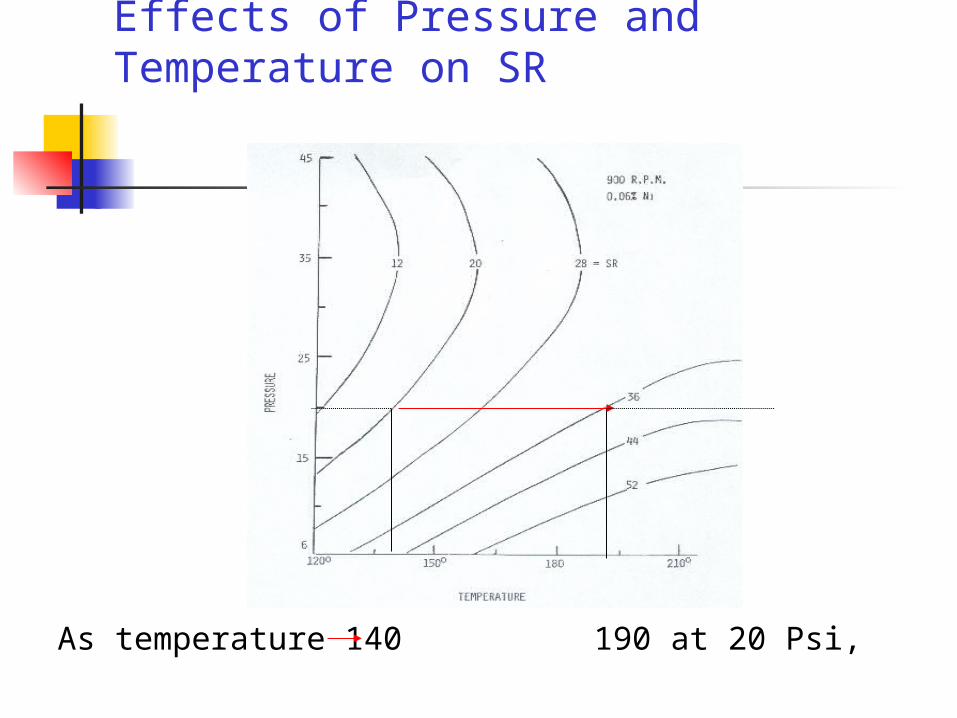
Effects of Pressure and Temperature on SR
As temperature 140 190 at 20 Psi,
selectivity increases from 20 to 36
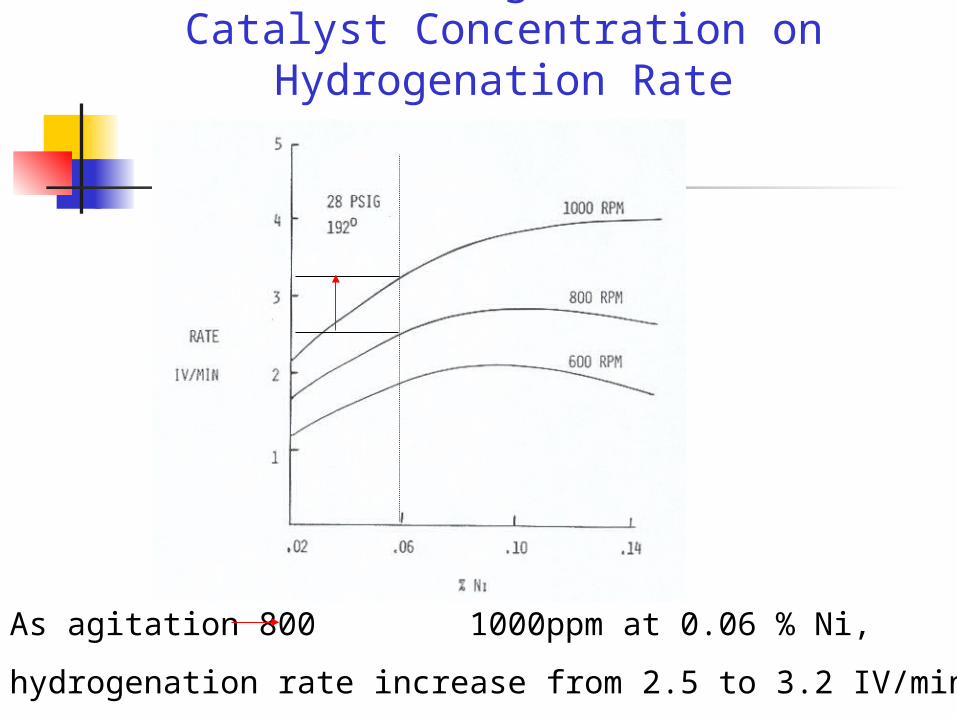
Effects of Agitation and Catalyst Concentration on Hydrogenation Rate
As agitation 800 1000ppm at 0.06 % Ni,
hydrogenation rate increase from 2.5 to 3.2 IV/min.
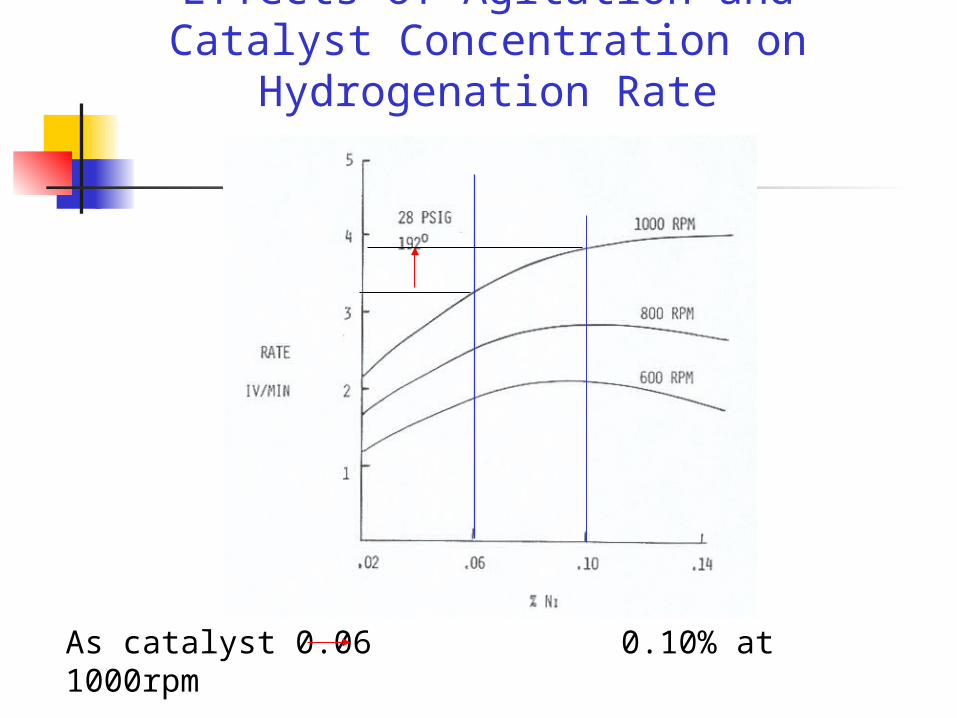
Effects of Agitation and Catalyst Concentration on Hydrogenation Rate
As catalyst 0.06 0.10% at 1000rpm
hydrogenation rate increases from 3.3 to 3.8 IV/min.
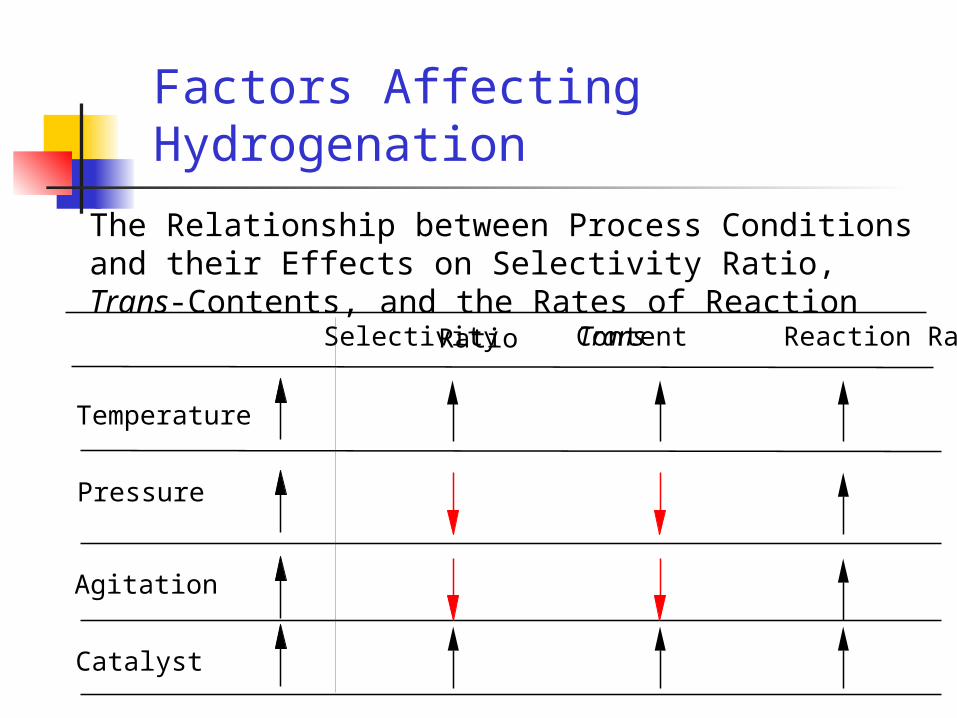
Factors Affecting Hydrogenation
The Relationship between Process Conditions and their Effects on Selectivity Ratio, Trans-Contents, and the Rates of Reaction
Selectivity Ratio TransContent Reaction Rate
Temperature
Pressure
Agitation
Catalyst


![api.liparifoods.com · Web viewINGREDIENTS: PEANUTS (PEANUTS ROASTED IN VEGETABLE OIL [PEANUT, COTTONSEED, SUNFLOWER SEED, AND/OR CANOLA], SALT), RAISINS, CHOCOLATE GEMS (CONFECTIONARY](https://img.pdfslide.net/doc/110x75/5e9a2b4e8301416e11013412/api-web-view-ingredients-peanuts-peanuts-roasted-in-vegetable-oil-peanut-cottonseed.jpg)