Embed Size (px)
Citation preview

Hydrogeological Site Investigation and Mounding Analysis for Onsite Wastewater Discharge
Blaire MacAulay, P.Geo., M.Sc .
Base l i ne Wa te r Resou rce I nc .
w w w. b a s e l i n e w a t e r . c o m
C l e a r S t a r t . C l e a n F i n i s h .

Outline Status of site investigation & mounding analysis in Alberta
Private Sewage Systems Standard of Practice - 2009 revision
2015 Updates
Site investigation process
Mounding analysis modelling
Process timeline summary
Design of long term groundwater monitoring network
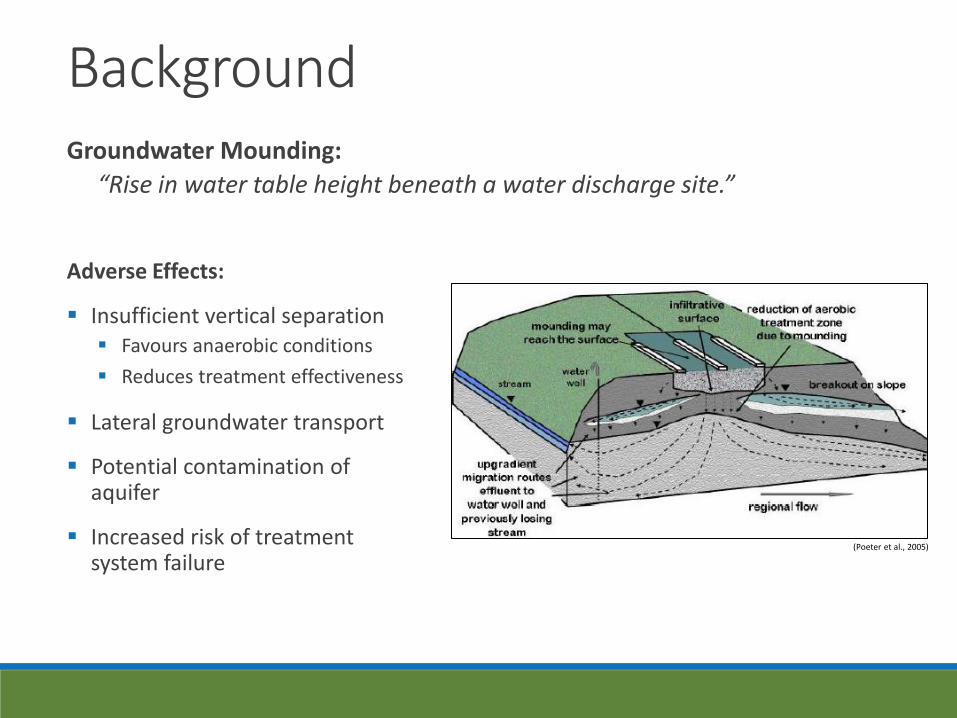
Background Groundwater Mounding:
“Rise in water table height beneath a water discharge site.”
(Poeter et al., 2005)
Adverse Effects:
Insufficient vertical separation Favours anaerobic conditions
Reduces treatment effectiveness
Lateral groundwater transport
Potential contamination of aquifer
Increased risk of treatment system failure

Revision Status Disconnect between site investigation
& mounding SOP requirements and practice
2015 Revision of SOP
Plumbing Technical Council Task Group
More stringent requirements for site assessment and mounding
Expectation for site investigation & mounding unchanged since 2009

Revision Status Objective:
Clearly outline requirements for proper site investigation & mounding analysis
Result:
Assist users in planning feasibility-phase site investigation
Assist Regulators in review of application
More stringent requirements become regulations and aid in protection of receptors

2015 SOP Changes/Trends
Site Investigation & Mounding Related:
1. Updated hydrogeologic investigation and mounding requirements for systems > 9 m3/day
2. Investigation must be adjusted based on site complexity
3. Further protection of waterbodies & contaminant/pathogen attenuation
4. Increased requirements for monitoring well placement
5. Assess chemistry of domestic water supply input into system
6. Define long term monitoring and contingency plans

Site Investigation Process
Phases:
1. Initial site visit
2. Program planning
3. Field work & data collection
4. Data analysis
5. Reporting & recommendations
Objective: “…to assess and quantify the capability of the site to infiltrate and disperse the effluent load into the soil in a manner that obtains treatment objectives…” (Safety Codes Council, 2009)

Initial Site Visit (1 Day)
Purpose:
Better understand site conditions prior to planning a detailed field program.
Observe:
Vegetation
Site layout & infrastructure
Surface water, drainage areas
Topography
Access
Soil conditions (< 30 cm)
Involve project personnel from multiple disciplines
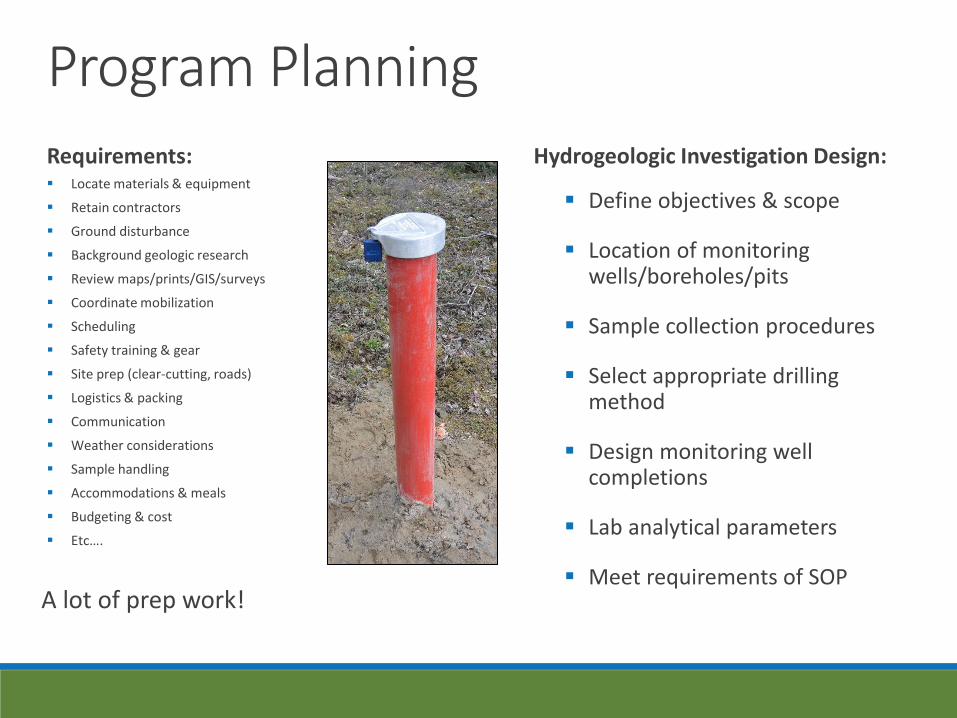
Program Planning Requirements: Locate materials & equipment
Retain contractors
Ground disturbance
Background geologic research
Review maps/prints/GIS/surveys
Coordinate mobilization
Scheduling
Safety training & gear
Site prep (clear-cutting, roads)
Logistics & packing
Communication
Weather considerations
Sample handling
Accommodations & meals
Budgeting & cost
Etc….
Hydrogeologic Investigation Design:
Define objectives & scope
Location of monitoring wells/boreholes/pits
Sample collection procedures
Select appropriate drilling method
Design monitoring well completions
Lab analytical parameters
Meet requirements of SOP A lot of prep work!

Fieldwork & Data Collection
Requirements:
2009 SOP: Detailed site investigation required for all systems > 5.7 m3/day
2015 Revision: Most notable changes for Hydrogeologic Characterization
1) Soil Characterization 2) Hydrogeologic Characterization 3) Detailed Site Description

1) Soil Characterization
Investigation Depth (2015):
Small (5.7 – 9 m3/day)
1. >300 mm (1 ft) below depth necessary to prove vertical separation, AND
2. Determine effluent linear loading capacity
Prescribed depths from 2009 SOP removed
Minimum Number of Profiles (2015):
Two locations: at least 1 excavated test pit. Other 1 borehole with intact soil coring
Additional locations for complex site, or if system area increases
Investigation Depth (2015):
Large (>9 m3/day)
1. Maximum depth of 15 m (50 ft)

Soil Sampling
Soil Sampling:
Frequency: 1 sample per 0.5 m depth
Representative sample of each distinct soil unit
Grab samples in bags or jars
Basic characterization
Grain size analysis
Collect intact soil cores
Observe soil structure
Used for lab hydraulic conductivity testing
Soils must be continuously logged during drilling, or within test pit.

Soil Classification
Canadian System of Soil Classification
Grain Size Analysis: Hydrometer: Sand/Silt/Clay
Sieve: Sand breakdown Fine/Medium/Coarse
Note:
Colour
Grain size
Mottling
Structure
Consistency
Roots
Pores
Clay films
Concretions
Precipitates
Coarse fragments
Horizon boundary
Unit thickness
Reaction to acid

Soil Analytical Parameters
Establish baseline soil chemistry.
Laboratory Analyses:
Electrical Conductivity (EC)
Sodium Adsorption Ratio (SAR)
pH
Detailed Salinity
Metals
Grain Size
Soil EC Probe
(Field)
Soil Investigation Objective Summary
Deliverables:
1. Continuous, detailed soil profile logs
Identify coarse vs. fine soils
Identify structures that limit or enable flow
2. Depth to limiting soil layers
Clays, very fine sediment
3. Background/baseline soil chemistry
4. Variation in site soil properties
Heterogeneity (vertical and horizontal)

2) Hydrogeological Investigation
Investigation Depth:
Maximum depth of 15 m (50 ft)
Justification from hydrogeological professional
Minimum Number Monitoring Points:
Three groundwater monitoring wells
Additional locations for complex site, or if system area increases
2015 SOP Revision Changes:
Additional site evaluation for large (>9 m3/day) systems

Monitoring Well Placement
Layout reflects:
Size & shape of discharge system
Direction of regional groundwater flow
Geology & hydrogeology
Conceptual Monitoring Well Network
Position wells:
Upgradient of system (background)
Downgradient of system
Cross gradient
Between system and waterbody
Between system and water source well
Between system and adjacent buried infrastructure
Drain Field
Monitoring Wells
Groundwater Flow Direction
Lake
Water Source Well
Buried Sand Channel

Monitoring Well Completions
Pre-pack Screen
Steel Casing
2” Solid PVC
Lock
Bentonite Chips
Filter Sand

Wastewater Discharge
Monitoring Well Completions
Sand
Sand
Silty Clay
Clay
Monitoring wells completed at different depths
Requirement of 2015 SOP > 9 m3/day

Groundwater Flow Regime
Based on water table surface elevation

Hydraulic Conductivity (K) *Paramount for mounding analysis!
Slug test measures horizontal hydraulic conductivity of saturated zone.
Bouwer-Rice Model: Calculate K

Groundwater Analytical Parameters
Laboratory Analyses:
Routine Parameters Chloride, hardness, nitrogen, pH, alkalinity, ions
Total & Dissolved Metals
Biological Oxygen Demand (BOD)
Chemical Oxygen Demand (COD)
Bacteriological Parameters
Fecal Coliform & E. coli. bacteria
Nutrient Parameters Phosphorous, Nitrogen, Dissolved Organic Carbon
(DOC), Total Kjeldahl Nitrogen, Ammonia, etc…
Other site-specific parameters
Establish baseline groundwater chemistry
Sample collected after monitoring well development

Transport & Attenuation Modelling
2015 SOP: For systems > 9 m3/day
Guidance referenced in 2015 SOP
Required when:
Potential for affected groundwater to reach a river/lake/stream/creek
Waterbody within 1 km of system
Purpose:
Estimate loading potential of phosphorous, nitrogen, and chloride to surface water
(Gerrard, 2010)

Hydrogeological Investigation Objectives
Deliverables:
1. Static water level elevation Available vertical separation
2. Direction of site groundwater flow
3. Hydrogeologic setting
4. Horizontal hydraulic conductivity of saturated zone (field)
5. Vertical hydraulic conductivity (lab)
6. Baseline groundwater chemistry
7. Transport & attenuation modelling (if near waterbody)
8. Site wide heterogeneity

3) Detailed Site Description
Bedrock
Topography
Surface Water
Vegetation - Dry
Flood Plain
Weather Conditions
Infrastructure
Mass Wasting

Mounding Analysis
Required when:
1. The available vertical separation distance to a limiting soil layer does not exceed 300 mm (1 foot); OR
2. Daily peak flow exceeds 5.7 m3 (2009)
3. Daily peak flow exceeds 9.0 m3 (2015)
2015 Revision, >9 m3/day:
Complexity of analysis required must reflect complexity of system
Based on design flow volume
Based on results of site investigation

Mounding Analysis
Calculate Mounding Height: Hantush 1967 Analytical Solution
Mounding Height (zmax) Function of:
Loading Rate (q’)
Initial saturated thickness (hi) of aquifer
Horizontal hydraulic conductivity (Kh)
Discharge area (l, w)
Time since infiltration began (t)
Specific yield (Sy) Literature sourced value
Hantush solution highly dependent on hydraulic conductivity (K)
Accurate field measure of K is a must!

Mounding Principles
Mound rises from static water level up.
Mound necessary to drive groundwater away from site.
Goal is to achieve balance between input and output rate away from site.
Steady State.
(Modified after Carleton, 2010)

Mounding Analysis
Analytical Model: “First Step”
Mound height at center of
drainfield
Groundwater breakout on
side slope
Poeter et al. 2005

Model Assumptions & Limitations
1. Aquifer is homogeneous & isotropic
2. Aquifer extent is infinite
3. Static water level is horizontal No regional flow
4. Depth to limiting soil layer is constant
5. Infiltration is vertical until water table No vadose zone spreading
6. No boundary condition effects
Model complexity should match site complexity and risk.
Numeric models allow for more complexity (i.e. MODFLOW)
Higher cost, more detailed site investigation required
Requires professional interpretation
Simplification of Site

Misconception: Mound Growth Mound height growth is logarithmic.
Discharging water for half the time ≠ twice the capacity
After 1 year, achieved 53% of total growth (10 years)
Potential for system failure realized after 2-3 years of system function
10.0, 8.4
0
1
2
3
4
5
6
7
8
9
0 1 2 3 4 5 6 7 8 9 10
Mo
un
d H
eigh
t (m
)
Years
Peak Mound Height Growth
Mounding Trend

Misconception: Drainfield Size
1. Drainfield shape
Area = 10,000 m2 Rectangle: 200 x 50 m Square: 100 x 100 m
Rectangle: 20.0 m3/day Square: 17.9 m3/day
2. Doubling drainfield area does not double capacity
Area 1: 100 x 50 = 5,000 m2 Area 2: 141 x 71 = 10,011 m2
Area 1: 15.8 m3/day Area 2: 18.5 m3/day

Misconception:
“All sites are suitable with good system design”
A maximum capacity discharge rate exists
Based on soil & hydrogeological conditions
Changing system design will not increase this maximum
Not all sites set up for success of high volume demand
More beneficial to construct multiple systems with large spacing
Consider interference effects

Process Timeline
Activity Duration
1) Planning & Site Visit 2-3 Weeks
2) Field Program 1 Week
3) Lab Results (Turnaround) 1 Week
4) Analysis, Interpretation & Modelling 3 Weeks
5) Reporting, Maps, Tables 3 Weeks
6) Design Revision 4 Weeks
7) Approval Variable
TOTAL 15 Weeks 4 Months

Long-Term Groundwater Monitoring
Purpose:
1. Operational system monitoring
2. Establish long-term trends Seasonal variation
Monitoring Well Placement:
Site investigation wells may be used long term
Add wells based on site investigation and design changes
Minimum three wells
Frequency:
Quarterly for first year
Adjusted based on baseline conditions & initial measurements

Concluding Remarks
Intent of 2015 SOP revision to facilitate design of a site investigation & mounding analysis
Improved guidelines for users and Regulators
Quality site investigation improves mounding model output
Investment in feasibility-phase site investigation & mounding reduces economic and environmental risk
Not all sites are destined for success
Water stewardship involves ongoing cooperation of all project stakeholders

Questions?

References Bouwer, H., Rice, R.C. 1976. A Slug Test for Determining Hydraulic Conductivity of Unconfined Aquifers With Completely or Partially Penetrating Wells. Water Resources Research, vol. 12, no. 3, pp. 423-428. Carleton, G.B. 2010. Simulation of Groundwater Mounding Beneath Hypothetical Stormwater Infiltration Basins. U.S. Geological Survey Scientific Investigations Report 2010-5102, pp. 64 Gerrard, J. 2010. Diane Orihel – and a new approach to algal blooms on Killarney Lake – and the implications for Lake Winnipeg?. October 6, 2010. Available online at: http://manitobaliberals.blogspot.ca/2010_10_03_archive.html. Accessed March 2, 2015. Hantush, M.S. 1967. Growth and Decay of Groundwater Mounds in Response to Uniform Percolation. Water Resources Research, Vol. 3, pp. 227-234. Poeter, E., McCray, J., Thyne, G., Siegrist, R. 2005. Guidance for Evaluation of Potential Groundwater Mounding Associated with Cluster and High-Density Wastewater Soil Absorption Systems. Project No. WU-HT-02-45. Prepared for the National Decentralized Water Resources Capacity Development Project, Washington University, St. Louis, MO, by the International Groundwater Modeling Center, Colorado School of Mines, Golden, CO. Safety Codes Council. 2012. Alberta Private Sewage System Standard of Practice Handbook. Edmonton, Alberta.