Embed Size (px)
Citation preview

Revision 2 1 2
Hydrogrossular, Ca3Al2(SiO4)3−x(H4O4)x: An Ab initio 3
Investigation of its Structural and Energetic Properties. 4
Valentina Lacivita,1,2,*
Agnes Mahmoud,3Alessandro 5
Erba,3Philippe D’Arco,
2and Sami Mustapha
4 6
1Institut du Calcul et de la Simulation, UPMC, Sorbonne 7
Universités, F-75005 Paris (France) 8
2Institut des Sciences de la Terre Paris (UMR 7193 UPMC-9
CNRS), UPMC, Sorbonne Universités, F-75005 Paris (France) 10
3Dipartimento di Chimica and Centre of Excellence NIS 11
(Nanostructured Interfaces and Surfaces), Università di Torino, 12
via Giuria 5, IT-10125 Torino (Italy) 13
4Institut de Mathématiques de Jussieu (UMR 7586 UPMC-14
CNRS), UPMC, Sorbonne Universités, F-75005 Paris (France) 15
16 17 18

2
Abstract 19
Structural and energetic properties of the grossular-katoite solid solution are studied with a 20
full ab initio quantum chemical approach. An all-electron basis set and the hybrid B3LYP 21
functional are used. Calculations are performed within the primitive cell of cubic garnets. The 22
hydrogarnet substitution, SiO H O , yields 136 symmetry-independent configurations 23
ranging from triclinic to cubic symmetry. All of them have been structurally optimized, the 24
relaxed geometries being characterized by pseudo-cubic conventional cells. At the present 25
level of approximation, the most stable configurations constitute by far the largest 26
contributions to the system properties. Considering only the most stable configurations, 27
average geometrical features of the actual solid solution are closely approximated. The excess 28
volume displays a highly non-ideal behavior that is favorably compared with carefully 29
analyzed and selected experimental data. The excess enthalpy deviates from the regular 30
model; it draws an asymmetric function of composition with two minima that can be 31
associated to structures or compositions observed in nature. Geometrical variations and 32
distribution of the tetrahedra are analyzed. Calculations provide independent support to the 33
use of a split-atom model for experimental refinements on these compounds. The asymmetry 34
of the enthalpy of mixing can be associated with two distinct distribution patterns of the 35
tetrahedra. Hydrogen interactions also contribute to the asymmetry of the excess enthalpy, as 36
it turns out by comparison between compositions close to fully hydrated katoite and those 37
close to grossular. Hydrogen interactions in Si-free katoite are found to be weak as suggested 38
by dramatic changes in the H environment associated with the introduction of SiO 39
tetrahedra. 40
Keywords: hydrogarnet, hydrogrossular, grossular, hibschite, katoite, solid solution, ab initio, 41
Crystal code 42

3
INTRODUCTION 43
Silicate garnets are nominally anhydrous minerals (NAMs) with stoichiometry 44 X Y SiO , which, nonetheless, have been found to commonly contain hydrous 45
components. Garnets characterized by a hydrous component fall under the general heading of 46
hydrogarnets. They are crystalline solid solutions of general formula X Y SiO H O , 47
whose composition varies through an isomorphous series from 0 to 3. 48
The main mechanism for hydrogen incorporation in silicate structures is through 49
hydrogarnet substitution: Si 4H . That is, protons are arranged in connection with four 50
oxygen anions surrounding tetrahedral Si-free vacancies. The replacement of H for Si atoms 51
was originally observed by Cohen-Addad et al. (1963) via nuclear magnetic resonance and 52
neutron diffraction experiments on the fully hydrated synthetic sample Ca Al H O . Af-53
terwards, numerous experimental studies on other hydrogarnets have confirmed this process 54
(Aines and Rossman 1984, Cohen-Addad et al. 1967, Foreman Jr. 1968, Lager et al. 1989). 55
The incorporation of hydrous components into NAMs significantly affects their physical 56
and chemical properties, thus modifying their technological applicability. Examples are the 57
hydrolytic weakening of silicate materials for glass technologies (Griggs 1967), and the 58
dielectric loss increase of ceramic substrates used as electronic packaging materials (Shannon 59
et al. 1992). Changes in elasticity are also relevant to the properties of the Earth’s mantle 60
where they can hold relatively large amounts of “water” (Knittle et al. 1992, Mackwell et al. 61
1985, O’Neill et al. 1993). 62
Apparently, the hydration capability of garnets is directly related to the Ca content in the 63
dodecahedral sites (X). Indeed, natural occurrences show ugrandites, Ca Al, Fe, Cr SiO , 64
featuring “water” contents up to about 20 wt% (Passaglia and Rinaldi 1984), while pyral-65
spites, Mg, Fe, Mn Al SiO , stand between 0.01 and 0.25 wt% (Aines and Rossman 66
1984). The analysis of synthetic samples confirms such differences (Ackermann et al. 1983, 67
Cohen-Addad et al. 1963, Geiger et al. 1991). The key to interpretation was given by 68
Sacerdoti and Passaglia (1985) while analyzing the structural response of grossular, 69 Ca Al SiO , to hydrogarnet substitution: a progressive shortening of the octahedral-70
dodecahedral shared edge and a corresponding lengthening of the octahedral unshared edge 71
was observed. This suggested a potential for substantial hydration only in those garnets 72
whose anhydrous form displays a shared octahedral edge longer than the unshared one. By 73
comparison between structures of various silicate garnet end-members previously 74

4
characterized (Novak and Gibbs 1971), they concluded that calcic garnets, i.e., garnets with 75
ionic radius X 1 Å, are the only ones that comply with such a requirement. Lager et al. 76
(1989) later corroborated Sacerdoti and Passaglia’s analysis with the results of distance-least-77
squares simulations on the effect of the hydrogarnet substitution on grossular, andradite and 78
pyrope structures. They reasoned on a presumable effect of repulsion below some lower limit 79
distance between the oxygen atoms involved in the shared edge: the minimum O O distance 80
would be approached further along the shared edge of the anhydrous structure, and this may 81
explain the high-water content of Ca-bearing garnets relative to other garnets. In addition, a 82
remark is made to the fact that the eight-coordinated site widens as a consequence of the 83
hydrogarnet substitution. According to Zabinski (1966), this effect should be energetically 84
promoted by an X cation as large as Ca , but rather hindered by smaller X cations, e.g., 85 Mg in pyrope. 86
A calcic hydrogarnet that occurs frequently in the literature is hydrogrossular, 87 Ca Al SiO H O , whose first reports date back to the early 1900s. In 1906, Cornu 88
introduced the name hibschite for a new silicate mineral found at Marienberg, Bohemia, 89
which, more than 30 years later, turned out to be hydrogrossular of ideal composition 90 Ca Al SiO H O (Belyankin and Petrov 1941). The same conclusion was drawn by Pabst 91
(1937) with regard to plazolite, a mineral named by Foshag (1920) in the aftermath of its first 92
occurrence at Crestmore, California. In fact, hibschite and plazolite coincide, as was 93
demonstrated by Pabst himself shortly after (1942). Today, the name plazolite has been 94
abandoned; the official nomenclature adopts the name hibschite for identifying terms of the 95
hydrogrossular series with 0 1.5. Hydrogrossular with 1.5 3 is called katoite, 96
by the name assigned to the first natural sample of water-rich member of the series, 97 Ca Al SiO H O , found in Pietramassa, Italy (Passaglia and Rinaldi 1984). Figure 1 98
reports a graphical representation of the structure of hydrogrossular as a function of the 99
substitutional fraction of H for Si atoms. 100
Crystal chemistry and physical properties of hydrogrossular have been widely investigated 101
due to important scientific and technological implications. As a typical product of cement 102
hydration, katoite is of special concern to cement and concrete research for materials 103
engineering. Fully-hydrated katoite, Ca Al H O , is a recognized constituent of set 104
Portland cement, and its composition often includes Si in mature cement pastes (Taylor and 105
Newbury 1984). It is known that silica from various sources in cement can react with calcium 106
and alumina ionic species to precipitate calcium aluminosilicate hydrates (Jappy and Glasser 107

5
1991). These are thermodynamically stable phases (Ackermann et al. 1983, Atkins et al. 108
1992, Bennett et al. 1992, Dilnesa et al. 2014) affecting rheology, solubility and global 109
endurance of the material. For example, Flint and Wells (1941) found that siliceous katoite 110
displays far greater resistance to the attack by sulfate solutions than the Si-free isomorphous 111
form. This is relevant not only for civil construction purposes, but also in view of the em-112
ployment of cement-based materials for the immobilization and containment of toxic wastes, 113
such as radioactive waste repositories (Atkins and Glasser 1992). Hydrogrossular is a poten-114
tial host phase for various toxic metals and metalloids, like Cr VI . Evidence for chromate 115
substitution in katoite, i.e., substitution of hydroxyl H O tetrahedra by chromate 116 CrO tetrahedra, has been provided (Hillier et al. 2007). 117
In Earth science, hydrogrossular is regarded as a likely “water” carrier in eclogite regions 118
of the upper mantle. Spectroscopic studies performed on hibschite, up to 25 GPa pressure, 119
indicate that it is stable throughout the whole pressure range of the upper mantle (Knittle et 120
al. 1992). Katoite, instead, undergoes phase transitions under increasing pressure. Single-121
crystal X-ray diffraction (XRD) experiments by Lager et al. (2002) suggested a possible 122
phase transition from 3 to 43 symmetry, at about 5 GPa. A recent theoretical 123
investigation by Erba et al. (2015) supported the thermodynamical instability of the 3 124
phase above 5 GPa, but found the 43 phase to be stable only above 15 GPa; in the 5 15 125
GPa range both phases were described as unstable. O’Neill et al. (1993) investigated the 126
elastic properties of natural hibschite hydrated to 42% and observed a compressibility about 127 40% higher than that of anhydrous grossular. An explanation was proposed, relying on the 128
larger volume of the [H O ]4- tetrahedron compared with the smaller, more rigid [SiO ]4- 129
tetrahedron. By comparing isothermal densities calculated at 300 K for two chemically 130
equivalent assemblages, one containing hibschite and the other containing grossular plus H O 131
as separated phases, they found the former to be denser (and therefore thermodynamically 132
more stable) within the pressure range of the Earth’s upper mantle. 133
Natural occurrences of hydrogrossular, along with laboratory syntheses carried out at high 134
temperatures ( 420 K) and pressures, suggest the existence of a continuous solid solution 135
between the two end-members: grossular ( 0) and Si-free katoite ( 3). Numerous 136
phases, scattered throughout the compositional range, were synthesized via hydrothermal 137
treatment (Cheng et al. 1990, Cohen-Addad et al. 1967, Flint et al. 1941, Geiger et al. 2012, 138
Lager et al. 1989). However, Jappy and Glasser (1991) showed that the mutual solubility of 139
the end-members changes significantly at lower temperatures and pressures. Investigating 140

6
stability and solubility of solid solutions synthesized in the katoite range of composition at 141 370 K and 10 GPa pressure, they found a miscibility gap between compositions 142 Ca Al SiO . H O . and Ca Al SiO . H O . , and a maximum Si content at-143
tainable of Ca Al SiO . H O . . Results consistent with the existence of a miscibility 144
gap occurred also in later works (Bennett et al. 1992, Dilnesa et al. 2014, Kyritsis et al. 145
2009). This indicates that hydrogrossular is a non-ideal solid solution. 146
In the present study, structural and energetic properties of the hydrogrossular series are 147
investigated with ab initio simulations. The composition range from 0% to 100% grossular 148
is explored, with reference to the 12 tetrahedral sites available for substitution in the end-149
member primitive cell. This allows for explicitly considering compositions 150 0, 0.25, 0.5, 0.75, 1, 1.25, 1.5, 1.75, 2, 2.25, 2.5, 2.75, 3 . Each intermediate term is 151
represented by a number of independent atomic configurations that were efficiently selected 152
via symmetry-adapted Monte-Carlo (SA-MC) sampling, as recently proposed by Mustapha et 153
al. (2013) and D’Arco et al. (2013). For all configurations, minimum energy structures have 154
been calculated at the B3LYP level of theory, using all-electron Gaussian-type basis sets. 155
Both SA-MC and geometry optimizations have been performed with the quantum-chemistry 156
software package for periodic calculations CRYSTAL14 (Dovesi et al. 2014a,b). The same 157
computational setup has already been successfully applied for studying structural, energetic, 158
spectroscopic, elastic and optical properties of the end-members grossular and Si-free katoite 159
(Erba et al. 2014a,b, 2015, Mahmoud et al. 2014, Orlando et al. 2006, Pascale et al. 2004), 160
and of the grossular-andradite joint (De La Pierre et al. 2013, Lacivita et al. 2013, 2014). 161
The results presented in the following provide new outlook on the relationship between 162
excess mixing enthalpy and volume of the hydrogrossular solid solution. This is important 163
information to accomplish production of densely packed and pressure-resistant concretes. In 164
the same vein, one can infer valuable clues about the compositions that would be most 165
favored under the pressure of the Earth’s mantle. Finally, some of the results can also be 166
interesting to other minerals showing hydrogarnet-type substitutions, such as crystalline 167
zircon ZrSiO (Balan et al. 2013, Botis et al. 2013). 168
THEORETICAL METHOD 169
Structural Model for Solid Solutions 170
Garnet end-members have a cubic structure of space group 3 , with| | 48 171

7
symmetry operators. Reference is here made to the primitive unit cell of grossular (Gro), 172
which contains 80 atoms and counts 4 formula units. The structure displays dodecahedral 173
(Ca), octahedral (Al) and tetrahedral (Si) crystallographic sites. There are 12 tetrahedral sites 174
available for hydrogarnet substitution, Si 4H . Solid solutions are obtained by 175
progressively replacing Si cations with 4 protons at a time. When the number n of Si cations 176
is reduced to zero, the Si-free katoite (Kat) end-member is obtained. Apart from the end-177
members Gro (n = 12) and Kat (n = 0), eleven intermediate compositions are explicitly 178
considered: 1, 2 . . . 11. 179
For each intermediate composition, 12!/ ! 12 ! substitutional atomic 180
configurations can be defined, which sum up to 4096 over the whole range of compositions. 181
This number can be significantly reduced following the symmetry analysis recently proposed 182
by Mustapha et al. (2013). Configurations are naturally partitioned into symmetry-183
independent classes (SICs), according to the operators retained after substitution. Given 184
the subgroup of symmetry associated to the l-th class of composition n, the number of 185
configurations belonging to that SIC is 186 | | (1)
Since all configurations of a given class are equivalent to each other, the number of calcu-187
lations to be actually performed reduces to only one per SIC. can then be interpreted as 188
the multiplicity of class l. The macroscopic properties of the solid solution are calculated as 189
Boltzmann averages over all SICs, where every class weighs in proportion to its own 190
multiplicity . For example, the average volume is defined as 191
(2)
where the sum runs over the SICs of composition n and 192 e ∆∑ e ∆ (3)
is the probability of finding the l-th SIC at temperature T. ∆ is the difference 193
between its energy , and the energy of the most stable configuration with the same 194
chemical composition, . 195

8
For the present system, a total number of 136 SICs is expected on the basis of Pòlyà’s 196
theorem (Pòlyà and Read 1987). These SICs are distributed over the composition range as 197
outlined in Table I. Depending on the number n of Si atoms in the primitive cell, fractional 198
composition x = 3(1 − n/12), number of SICs , total number of atomic configurations 199
and minimum multiplicity (corresponding to the maximum symmetry) of the 200
respective classes are reported. At each composition, canonical representatives for the 201
various SICs have been selected via uniform at random SA-MC sampling, as recently devised 202
by D’Arco et al. (2013) and implemented in the CRYSTAL14 code (Dovesi et al. 2014a,b). 203
The basics of the SA-MC method are provided as supplementary information, along with a 204
brief outline of the practical procedure adopted to build the classes of configurations. We 205
address the reader to (D’Arco et al. 2013) for a comprehensive theoretical treatment, and to 206
(Dovesi et al. 2014b) for details about the mentioned computational options. 207
A general concern about simulations of disordered crystalline materials and solid solutions 208
is related to the size of the adopted structural model. Is it large enough? If large super-cells 209
(multiples of the primitive one) seem preferable for comparison with real systems, one has to 210
take into account practical feasibility aspects. The larger the super-cell, the more numerous 211
the SICs, so as the number of calculations to be performed rapidly becomes prohibitive. It is 212
necessary to find the right balance between accuracy and computational costs, by analyzing 213
carefully every situation. For example, when dealing with dilute defects, large (to some 214
extent) super-cells must be used in order to reduce the interactions between them. This is not 215
a problem because the presence of a single defect in the cell corresponds to only one 216
symmetry-independent configuration to be structurally optimized. Furthermore, for 217
sufficiently low concentrations, calculations can be performed by freezing in some 218
geometrical variables. In the case of concentrated solutions, as the ones studied in this work, 219
no simple choice exists. The size of the unit cell must be large enough to allow access to 220
different intermediate compositions and to account for eventual atomic clustering. In 221
addition, one must bear in mind that the impact of the theoretical approximation might be 222
property-dependent. As regards the average geometrical properties here calculated, we will 223
show in the next section that a close comparison with experiments on the actual solid solution 224
is achieved. This makes us confident on the accuracy of our results and, consequently, on the 225
appropriateness of the model system chosen for the present work. 226
Computational Details 227

9
All calculations have been performed with the CRYSTAL14 program (Dovesi et al. 228
2014a,b). Minimum energy structures of all SICs were calculated at the B3LYP level of 229
theory (Becke 1993), using all-electron atom-centered Gaussian-type basis sets. Oxygen, 230
hydrogen, silicon, aluminum and calcium atoms were described by (8s)-(411sp)-(1d), (31s)-231
(1p), (8s)-(6311sp)-(1d), (8s)-(611sp)-(1d) and (8s)-(6511sp)-(21d) contractions of primitive 232
functions, respectively. 233
In CRYSTAL14, density functional exchange-correlation contributions are evaluated by 234
numerical integration over the cell volume: radial and angular points of the atomic grid are 235
generated through Gauss-Legendre and Lebedev quadrature schemes. For the present 236
calculations, an accurate predefined pruned grid was employed, corresponding to 99 radial 237
and 1454 angular points. Hartree-Fock exchange contributions to the hybrid functional were 238
calculated for atomic functions within a maximum distance of 59 direct lattice vectors from 239
the origin. The reciprocal space was sampled according to a sub-lattice with shrinking factor 240
3, which corresponds to a number of -points in the irreducible first Brillouin zone between 4 241
and 14, depending on the symmetry of the configuration. The convergence threshold on the 242
self-consistent-field energy was set to 10 Ha. 243
As regards geometry optimizations, CRYSTAL14 calculates analytical energy gradients 244
with respect to both atomic coordinates and unit-cell parameters (Civalleri et al. 2001, Doll 245
2001, Doll et al. 2001). A quasi-Newton optimization scheme is adopted in combination with 246
the Broyden-Fletcher-Goldfarb-Shanno algorithm (Broyden 1970a,b, Fletcher 1970, Goldfarb 247
1970, Shanno 1970) for Hessian updating. Convergence is checked on the root mean square 248
of both gradient components and nuclear displacements, the corresponding tolerances being 249
0.0003 a.u. and 0.0012 a.u., respectively. 250
RESULTS AND DISCUSSION 251
Lattice 252
As previously recalled, the end-members of the hydrogrossular series belong to the cubic 253
space group 3 . From a microscopic point of view, fractional occupancies of the 254
tetrahedral sites at the intermediate compositions imply necessarily certain lowering of the 255
local symmetry. Despite this, all 136 atomic configurations maintain a pseudo-cubic metric 256
after geometry relaxation. Optimized structural parameters of all configurations can be found 257
in the supplementary material. Here, for clarity sake, we explicitly discuss the case 6, 258
that corresponds to the situation where half of the tetrahedral sites is occupied by Si and the 259

10
other half by 4H . This is the most illustrative composition as it provides the widest 260
spectrum of symmetry-independent atomic distributions for the given number of 261
substitutional sites. Table II reports lattice parameters , , and angles , , for the 262
representatives of the SICs proper of this composition. The SICs are listed in order of 263
increasing energy, which varies by 51 mHa between 1 to 32. Multiplicities and 264
lattice types (as deduced from the residual symmetry H) of the various SICs are indicated. 265
We notice that only one SIC out of 32 maintains the cubic symmetry of the aristotype 266
(except for the inversion center). That is class 32, with 2. Many SICs are triclinic, 267
i.e., with multiplicity 48 4, 7, 10, 11, 13, 16, 17, 18, 19, 21, 25, 26, 30 . According 268
to Eq. (1), this means they are asymmetric, the unique operator in being the identity. Other 269
SICs belong to monoclinic ( 5, 9, 12, 14, 15, 22, 23, 24, 28), orthorhombic 1, 6, 8 , 270
tetragonal 2, 3, 27, 29 and trigonal 20, 31 crystal systems, with respective 271
multiplicities 12 or 24, 12, 6 or 12 and 8. 272
Despite the differences in symmetry, all SICs are rather close to the cubic metric: cell 273
edges differ from each other by 0.203 Å at most, and the angles depart from 90◦ by less than 274
1.3◦. For statistical purposes, we may refer to the percentage difference ∆ with respect to the 275
cubic average /3, or to the right angle. The average with sign, ∆, indicates 276
that is slightly biased towards elongation, while tends to shorten. Apart from that, it is 277
noteworthy that the absolute average difference, |∆|, is maintained well below 1%, and not 278
even the largest absolute percentage deviations, max |∆|, come to exceed such a threshold 279
(but for , where a slightly larger deviation of 1.43% is found). These findings are consistent 280
with the picture arising from experimental studies, according to which hydrogrossular 281
essentially retains the cubic structure of the end-members (Basso et al. 1983, Cheng et al. 282
1990, Cohen-Addad et al. 1967, 1963, Ferro et al. 2003, Flint et al. 1941, Jappy and Glasser 283
1991, Lager et al. 1989, Pabst 1937, 1942, Passaglia and Rinaldi 1984, Sacerdoti and 284
Passaglia 1985). 285
Excess Quantities 286
Excess enthalpies, ∆ , and volumes, ∆ , are obtained as differences between the 287
calculated values and the values expected for an ideal system, i.e., a system whose properties 288
vary linearly with the composition. ∆ and ∆ of the 136 configurations optimized along the 289
Gro-Kat binary are shown in Figures 2 and 3, respectively. Each composition goes with its 290
complementary, 12 , as regards number, multiplicity and symmetry of the respective 291

11
SICs (see Table I). However, the properties calculated at compositions and 12 may be 292
quite different, as we shall discuss below. 293
Enthalpy. In Figure 2, ∆ represents the free energy of mixing at 0 K. This is found to be 294
negative for all the SICs throughout the compositional range. At compositions from 2 to 295 10, an energy range min ∆ max ∆ spreads between the most stable and 296
the least stable SICs. The width of the range is quite large ( 30 mHa on average), 297
oscillating within a maximum of 51 mHa at 6, and a minimum of 11 mHa at 10. 298
Apart from 3, configurations at the extremes of the energy range always display some 299
symmetry ( 48 ). This is in line with a conjectured symmetry-energy relationship 300
suggesting that the critical points of the potential energy surface should correspond to 301
symmetric structures (Pauling 1929, Pickard and Needs 2011, Wales 1998). 302
For most of the compositions here explored, the minimum enthalpy configuration is far 303
more stable than the other SICs with the same composition: the Boltzmann distribution would 304
leave the ground state only at temperatures above 700 K. The only exceptions, in this respect, 305
are 2 and 7, where the difference between min ∆ and the next SIC is just 0.05 306
mHa (indistinguishable in Figure 2) and 0.8 mHa, respectively. 307
Function min ∆ is very asymmetric: it rapidly decreases upon substitution of 1 to 4 308
tetrahedral sites in Kat and then, as the silicon content increases further, it goes back to zero 309
(Gro) less sharply. The global minimum is found at 4. In addition, a discontinuity is 310
encountered between 7 and 8 that makes 8 a local minimum. The presence of 311
two minima indicates that min ∆ is not always concave upward but rather reverses its 312
curvature between these two points. This means that solid solutions in the range 4 8 313
exhibit a higher enthalpy than a mixture of two separate phases with respective compositions 314 4 and 8. Outside this range, solid solutions are thermodynamically favored by the 315
excess enthalpy. In particular, it turns out that min ∆ assists the insertion of silicon into 316
Kat more than that of hydrogen into Gro. 317
Finally, we note that the global minimum at 4 corresponds to a solid solution with 318
stoichiometry Ca Al SiO H O , that is the ideal formula assigned to the katoite mineral 319
(Passaglia and Rinaldi 1984). Moreover, this is just about the upper limit observed by Jappy 320
and Glasser (1991) for the substitution of Si into Kat at low temperature (95◦C) and under 321
ambient pressure. As regards 8, instead, the ideal composition of the hibschite mineral is 322
matched, namely Ca Al SiO 2H O (Belyankin and Petrov 1941, Pabst 1937). 323
12
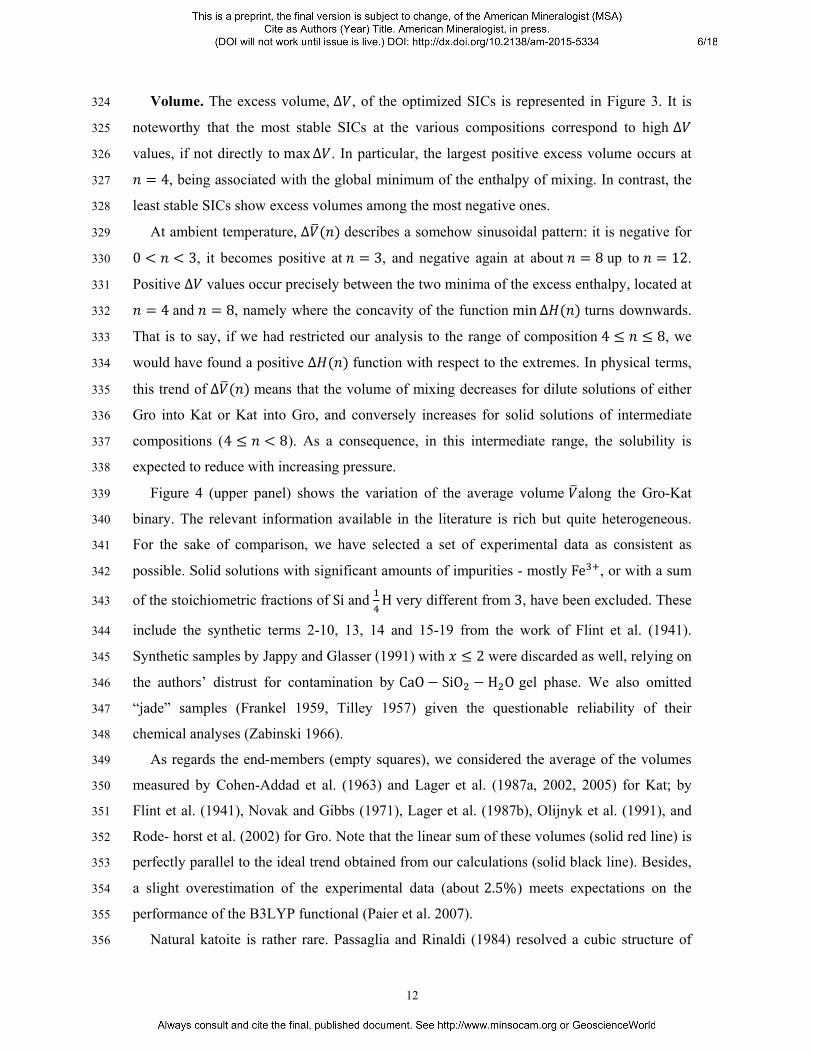
Volume. The excess volume, ∆ , of the optimized SICs is represented in Figure 3. It is 324
noteworthy that the most stable SICs at the various compositions correspond to high ∆ 325
values, if not directly to max ∆ . In particular, the largest positive excess volume occurs at 326 4, being associated with the global minimum of the enthalpy of mixing. In contrast, the 327
least stable SICs show excess volumes among the most negative ones. 328
At ambient temperature, ∆ describes a somehow sinusoidal pattern: it is negative for 329 0 3, it becomes positive at 3, and negative again at about 8 up to 12. 330
Positive ∆ values occur precisely between the two minima of the excess enthalpy, located at 331 4 and 8, namely where the concavity of the function min ∆ turns downwards. 332
That is to say, if we had restricted our analysis to the range of composition 4 8, we 333
would have found a positive ∆ function with respect to the extremes. In physical terms, 334
this trend of ∆ means that the volume of mixing decreases for dilute solutions of either 335
Gro into Kat or Kat into Gro, and conversely increases for solid solutions of intermediate 336
compositions (4 8). As a consequence, in this intermediate range, the solubility is 337
expected to reduce with increasing pressure. 338
Figure 4 (upper panel) shows the variation of the average volume along the Gro-Kat 339
binary. The relevant information available in the literature is rich but quite heterogeneous. 340
For the sake of comparison, we have selected a set of experimental data as consistent as 341
possible. Solid solutions with significant amounts of impurities - mostly Fe , or with a sum 342
of the stoichiometric fractions of Si and H very different from 3, have been excluded. These 343
include the synthetic terms 2-10, 13, 14 and 15-19 from the work of Flint et al. (1941). 344
Synthetic samples by Jappy and Glasser (1991) with 2 were discarded as well, relying on 345
the authors’ distrust for contamination by CaO SiO H O gel phase. We also omitted 346
“jade” samples (Frankel 1959, Tilley 1957) given the questionable reliability of their 347
chemical analyses (Zabinski 1966). 348
As regards the end-members (empty squares), we considered the average of the volumes 349
measured by Cohen-Addad et al. (1963) and Lager et al. (1987a, 2002, 2005) for Kat; by 350
Flint et al. (1941), Novak and Gibbs (1971), Lager et al. (1987b), Olijnyk et al. (1991), and 351
Rode- horst et al. (2002) for Gro. Note that the linear sum of these volumes (solid red line) is 352
perfectly parallel to the ideal trend obtained from our calculations (solid black line). Besides, 353
a slight overestimation of the experimental data (about 2.5%) meets expectations on the 354
performance of the B3LYP functional (Paier et al. 2007). 355
Natural katoite is rather rare. Passaglia and Rinaldi (1984) resolved a cubic structure of 356

13
space group 3 and cell parameter 12.358 Å (empty triangle), while later refinements 357
by Sacerdoti and Passaglia (1985) yielded 12.379 Å (full inverted triangle). Ferro et al. 358
(2003) described a new sample with cubic cell parameter 12.286 Å (full pentagon). We 359
notice that both natural katoite samples display stoichiometry close to Ca Al SiO H O , 360
which corresponds to the global minimum of the excess enthalpy here estimated at 4. 361
This evidence further supports the thermodynamic stability of this composition. Figure 4 also 362
reports volume values of some synthetic katoite samples: i) empty circles represent the 363
hydrothermal members number 1 and 12 from Flint et al. (1941); ii) asterisks are samples by 364
Jappy and Glasser (1991); iii) empty rhombi are taken from Pöllmann (2012). By inspection 365
of the lower panel of Figure 4, it turns out that most of the above mentioned katoite samples 366
display a negative excess volume. The only exceptions are the synthetic specimens from 367
Pöllmann (2012), plus two other synthetic samples (Flint et al. 1941, Jappy and Glasser 1991) 368
of composition very close to the pure Si-free compound. 369
The three data points around 7 correspond to different experiments carried out on 370
hibschite from Crestmore. Powder XRD analyses by Pabst (1937) provided a cubic structure 371
with lattice constant 12.16 Å (solid rhombus). Afterwards, hibschite was subjected to 372
single-crystal XRD by Basso et al. (1983), who obtained a lattice constant 12.174 Å 373
(solid triangle). The authors relied on the chemical formula calculated from the structure 374
refinement, namely Ca Al SiO . H O . , despite their own microprobe analysis 375
revealing a distinctly higher Si content: Ca . Mg . Fe . Al . SiO . H O . . 376
Indeed, in view of the remarkable agreement with the composition previously obtained by 377
Pabst (1942), Ca . Al . SiO . H O . , we assumed their microprobe analysis as the 378
most representative. This choice is in line with the outcome of an independent electron 379
microprobe analysis performed by O’Neill et al. (1993), which provided chemical 380
composition Ca . Mg . Fe . Al . SiO . H O . . The corresponding lattice 381
parameter, 12.183 Å (solid square), was measured via single-crystal XRD. It is 382
noteworthy that all the experiments performed on hibschite from Crestmore provide a 383
positive excess volume ∆ . 384
Members in the range 8 12 were synthesized by Cohen-Addad et al. (1967) 385
(cross), by Lager et al. (1989) (plus), and by Cheng et al. (1990) (solid circles). The empty 386
rhombus belongs to the set of synthetic hydrogrossular samples reported by Pöllmann (2012). 387
All these points occur below the solid red line joining the two end-members. In particular, 388
Cheng et al. (1990) carried out a thorough XRD and XPS (X-ray photoelectron spectroscopy) 389

14
investigation in order to define a quantitative relation between unit cell dimension and 390
composition 0 1. They found it to be nonlinear, with a negative volume of mixing 391
describing an asymmetric pattern. 392
Let us focus now on the lower panel of Figure 4. We notice that the collection of 393
experimental excess volumes suggests a sinusoidal trend of the function ∆ , which is 394
qualitatively very similar to that described by our calculated data. Indeed, ∆ is generally 395
negative for Kat-rich solid solutions ( up to 4 5 ), it is positive at intermediate 396
compositions ( 7), and finally returns negative for Gro-rich solid solutions (8 12). 397
The agreement between experimental and calculated data is satisfactory, apart from the latter 398
suffering from a slight underestimation of the amplitude of the negative ∆ values. On the 399
hibschite side, the intersection with the zero axis occurs around 8 in both series. On the 400
katoite side, instead, the present calculations seem somehow to anticipate (at 3) the sign 401
reversal of ∆ with respect to the experiments (about 4 5). Nevertheless, it is also true 402
that the measurements on katoite are rather dispersed in comparison with those on hibschite. 403
At intermediate compositions ( 4 8 ) we cannot compare precisely, because the 404
available experimental data are scarce, and because those on hibschite from Crestmore are 405
located right at the discontinuity of the calculated functions ∆ and ∆ . We may just 406
remark that samples reported by Pöllmann (2012) with positive excess volume lie very close 407
to the corresponding calculated points. 408
Octahedra 409
Figure 5 shows the variation of the octahedral-dodecahedral shared, , and unshared, , 410
edges with composition. The shared edge is represented in the upper panel. We notice that 411
the three oxygen pairs are well distinguished, being always OH OH O OH412 O O . All three distances are shortened with the increase of the number of Si atoms in 413
the primitive cell. Apart from the end-members Gro and Kat, hetero-pairs O OH are present 414
along the entire compositional range. In contrast, the distribution of homo-pairs, OH OH 415
and O O, is very asymmetrical: compositions with 5 are characterized by the exclusive 416
presence of OH OH pairs, while those with 7 display only pairs of type O O. This 417
may be related to the corresponding asymmetry of the excess enthalpy (Figure 2), so that the 418
simultaneous presence of OH OH, O OH and O O shared edges, occurring just between 419 5 and 7, may be related to the concavity change of the excess enthalpy in the same 420
range of compositions. By plotting the weighted average with increasing , we get an 421

15
upward linear (within the stripe width) trend that would indicate the elongation of the shared 422
edge with the increase of Si atoms. In fact, despite the shortening of for each oxygen pair 423
type, the progressive increase in weight of the O O pair determines the increase of . This 424
result is in perfect agreement with the average structure view provided by experimental 425
determinations (red asterisks). 426
As regards the unshared edge (lower panel), the lengths associated to pairs OH OH, 427 O OH and O O are much closer to each other. All of them slightly decrease with 428
increasing , with a variation of just 0.12 Å over the whole composition range. In this case, 429
the average function is consistent with the individual trends: it provides a linear (within the 430
stripe width) shortening of the unshared edge with an increasing number of Si atoms. Again, 431
the predicted average behavior conforms to the experiments (red asterisks). 432
To recap, average and octahedral edge lengths are consistent with a macroscopic 433
picture according to which the shared octahedral edge decreases in length while the unshared 434
edge increases. They intersect at about 10 (vertical dashed line in Figure 5), that is very 435
close to the crossing between the experimental curves (Lager et al. 1989). 436
Tetrahedra Distribution and Structural Response to Hydrogarnet Substitution 437
From the discussion addressed above (Section IIIB), one may deduce that, within the 438
present model, the Gro-Kat solid solution at low temperature can essentially be represented 439
by the most stable configurations at the various compositions. Therefore, unless otherwise 440
stated, the following structure analysis will refer to configurations of minimal enthalpy (red 441
points in Figure 2). In order to rationalize the effects of the hydrogarnet substitution, we will 442
exploit the typical polyhedral interpretation of the garnet structure (Novak and Gibbs 1971). 443
That is, hydrogrossular consists of a three-dimensional network of alternating, corner-sharing 444 SiO (or H O ) tetrahedra and AlO octahedra, in which triangular dodecahedral cavities 445
accommodate Ca cations. 446
Oxygens and Hydroxyls. Figure 6 shows δ O distances between the barycenter δ of the 447
tetrahedra and the O atoms at their vertices, as a function of the composition. It turns out that 448
both kinds of tetrahedra are rather insensitive to variations in composition, more so for the 449 SiO tetrahedra, where the presence of a central Si atom freezes the oxygens via covalent 450
interactions. Protonated H O tetrahedra lack such an internal constraint and thus display a 451
wider dispersion of the δ O distances. To get a quantitative estimation of the tetrahedral 452
distortion at intermediate compositions, we applied the iterative least-squares technique 453
16
proposed by Dollase (1974), and obtained maximum deformations of 4.5% for SiO 454
compared to Gro, and 5.2% for H O compared to Kat. These deformation rates are rather 455
low, which indicates both the tetrahedral sites to be fairly close to the respective “ideal” limit 456
structures. 457
According to our calculations, the oxygens of the solid solution are unambiguously split 458
into Gro-like and Kat-like tetrahedral sites, whatever the composition. This picture is 459
consistent with experimental refinements by Armbruster and Lager (1989) and by Lager et al. 460
(1989), who successfully adopted the split-atom model to account for oxygen positional 461
disorder in katoite and hibschite samples, i.e., oxygen sets on two different sites depending 462
upon whether the tetrahedron is occupied by Si or protonated. They worked out, in this way, 463
anomalously short O H D bond distances (0.65 0.74 Å) previously reported (Lager et 464
al. 1987a, 1989, Sacerdoti and Passaglia 1985), as artifacts due to the use of standard ordered 465
refinement models yielding a single average oxygen position rather than the two real ones. 466
In fact, by considering a weighted mean of the calculated δ O values for SiO and 467 H O tetrahedra, a linear function of composition is obtained (gray stripe in Figure 6), which 468
decreases from 1.979 Å at 0 (Kat), to 1.662 Å at 12 (Gro). This coincides with the 469
average picture provided by XRD experiments (red asterisks). 470
Hydrogen interactions. Let us now analyze what happens to the hydrogen atoms. We are 471
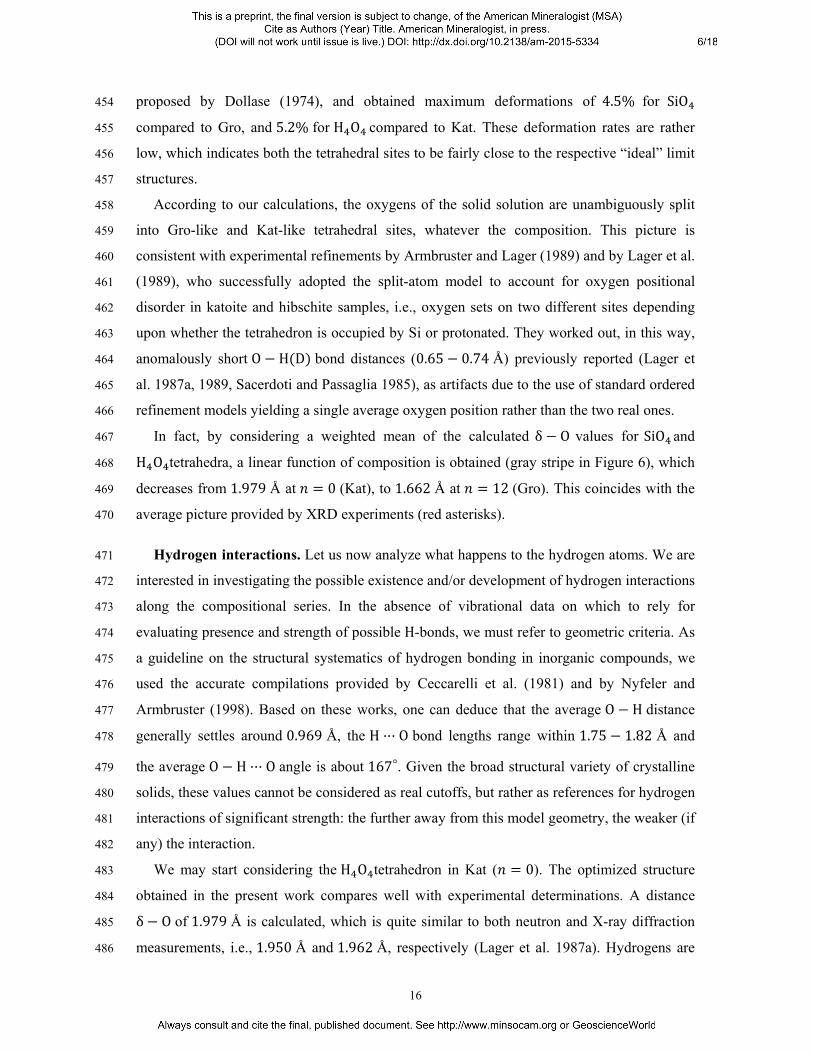
interested in investigating the possible existence and/or development of hydrogen interactions 472
along the compositional series. In the absence of vibrational data on which to rely for 473
evaluating presence and strength of possible H-bonds, we must refer to geometric criteria. As 474
a guideline on the structural systematics of hydrogen bonding in inorganic compounds, we 475
used the accurate compilations provided by Ceccarelli et al. (1981) and by Nyfeler and 476
Armbruster (1998). Based on these works, one can deduce that the average O H distance 477
generally settles around 0.969 Å, the H O bond lengths range within 1.75 1.82 Å and 478
the average O H O angle is about 167◦. Given the broad structural variety of crystalline 479
solids, these values cannot be considered as real cutoffs, but rather as references for hydrogen 480
interactions of significant strength: the further away from this model geometry, the weaker (if 481
any) the interaction. 482
We may start considering the H O tetrahedron in Kat ( 0). The optimized structure 483
obtained in the present work compares well with experimental determinations. A distance 484 δ O of 1.979 Å is calculated, which is quite similar to both neutron and X-ray diffraction 485
measurements, i.e., 1.950 Å and 1.962 Å, respectively (Lager et al. 1987a). Hydrogens are 486

17
located slightly outside the tetrahedron, the angle δ O H being 36°. Our computed O H 487
bond length, i.e., 0.961 Å, is in line with previous calculations (Pascale et al. 2004) as well as 488
with targeted structure refinements corrected for thermal motion effects, i.e., 0.95 Å (Lager 489
et al. 2005). According to Lager et al. (2005) a bifurcated H-bond is formed with the oxygens 490
located at the opposite vertices of the face, with the H atom lying approximately on the 491
bisector plane. They collected time-of-flight neutron powder data on Ca Al D O , 492
measuring two intra-tetrahedral D O distances, D1 O3 2.551 Å and D1 O3’ 493 2.499 Å (notation as in Figure 7), and respective angles O1 D1 O3 133.5° and 494 O1 D1 O3’ 139.6° . In addition, they identified an inter-tetrahedral H-bond, D3495 O1’, as large as 2.606 Å, with an angle O3 D3 O1’ equal to 111.1°.† A clear divergence 496
from the geometric H-bond requirements here adopted (Ceccarelli et al. 1981, Nyfeler and 497
Armbruster 1998) is observed, which implies at least the classification into rather weak 498
interactions. That said, our calculations define pretty much the same picture: i) the intra-499
tetrahedral parameters are H1 O3 2.564 Å, H1 O3’ 2.513 Å, O1 H1 O3500 133.2°and O1 H1 O3’ 138.8° ; ii) the inter-tetrahedral parameters are H3 O1’501 2.610 Å and O3 H3 O1’ 109◦. These values are reported in Table III and compared 502
with selected distances and angles of minimum energy SICs calculated at different 503
compositions . 504
When a silicon atom is introduced in the unit cell ( 1), one H O tetrahedron is 505
replaced for SiO . This causes a drastic change in the geometry of the hydrogen interactions 506
in the neighborhood. We focus on the first star of neighbors, i.e., four H O tetrahedra on 507
which the perturbation is evenly distributed as each of them interacts with one oxygen of the 508 SiO unit. Figure 7 shows the detail of the local rearrangement. H3 flips toward O1’ with a 509
dramatic enlargement of the angle δ O3 H3 ( 65.5 ◦). The simultaneous gain in 510
directionality of the inter-tetrahedral interaction ( O3 H3 O1’ 148.7 ◦) implies a 511
strengthening of the latter, that is deduced from the increment of the O3 H3 bond length 512
( 0.969 Å) and from the corresponding decrease of the H3 O1’ distance ( 2.077 Å). 513
Meanwhile, the repulsion exerted by H3 on the other three hydrogens of the H O 514
tetrahedron fades, so that they can come closer to its center δ. H1 is particularly concerned: 515
the angle δ-O1-H1 tightens to 24.21◦, and the intra-tetrahedral interaction with O3 intensifies 516
†We recall that, in cubic Si-free katoite, oxygen atoms, as well as hydrogen atoms, are all
equivalent. The proposed labeling is a convenient way to discuss geometrical relations.

18
( H1 O3 2.335 Å, O1 H1 O3’ 148.0° ) at the expense of the one with O3’ 517
(H1 O3’ 2.593 Å, O1 H1 O3’ 134.4°). This suggests that the position of the H 518
atoms is controlled by the electrostatic interactions between them, rather than by hydrogen 519
interactions, and thus emphasizes the weakness of the latter. 520
In the opposite situation, that is when all tetrahedra but one are occupied by Si ( 11), 521
we obtain a fairly different arrangement of the hydrogen atoms (see Table III). This time, a 522
single H O tetrahedron is surrounded by four SiO tetrahedra. Each hydrogen of H O 523
interacts with one SiO tetrahedron at a distance H3 O1’ of 2.191 Å, forming angles 524 O3 H3 O1’ 127.1◦ and δ O3 H3 45.52◦. By comparison with 1, we can 525
infer that hydrogen interactions in this case are generally not as strong. A certain asymmetry 526
emerges, which may be somehow reflected by the excess enthalpy represented in Figure 2: 527 ∆ is about 18 mHa at 1 and about 7 mHa at 11. Besides, we should not expect 528
otherwise given that the ratio of hydrogen donor-to-acceptor is necessarily different in the 529
two cases. At 1 there are four H O tetrahedra (donors) strongly engaged in as many 530
hydrogen interactions with one SiO (acceptor). The latter acts as an attractive pole for the 531
nearest hydrogen atoms, thus unbalancing the layout of the surroundings. At 11 it 532
remains a single H O tetrahedron (donor). Its hydrogens participate one-by-one in 533
interactions with four neighboring SiO tetrahedra (acceptors) that are evenly spaced out. The 534
result is an isotropic “strain” of the donor with respect to the reference Kat. 535
At intermediate compositions, hydrogen interactions are far more complicated to 536
rationalize. The parameters reported in Table III for 4, 6 suggest stronger interactions 537
than in Kat, but their input to the stability of the system is blurred by new rising 538
contributions. At 6 , for instance, the most stable and the least stable SICs exhibit 539
hydrogen interactions of comparable strength, the difference being rather in their number. 540
One would expect that the higher the number of interactions, the more stable the structure. In 541
fact, we find the opposite situation: in the least stable SIC, which has cubic symmetry, each 542
tetrahedron H O SiO interacts with four neighbors SiO (H O ); in the most stable SIC, 543
instead, the inter-tetrahedral hydrogen interactions are halved. Indeed, we may conclude that 544
the necessity to invoke “H-bonds” to understand the energetics of the system is not so 545
obvious. It is to be recalled that such partitioning of the energy is nothing but the result of a 546
rational process of interpretation, which can be useful to account for some properties but, 547
still, is far from being fully comprehensive. 548

19
Tetrahedra Distribution. Figure 8 shows the distribution of the H O and SiO tetrahedra 549
in the pseudo-cubic cell of minimum energy configurations at different compositions n (the 550
number of Si atoms refers to the primitive cell). Two distinct patterns of distribution can be 551
recognized: one for 7 and another one for 7 (SICs with 3 and 11 are not 552
shown in the figure as they are poorly illustrative). On the katoite side ( 7 ), the 553 SiO tetrahedra are progressively arranged in planes 1 0 1 , until a structure of alternate 554
“layers” of Gro and Kat is finally obtained at n = 6. Hence, a tendency emerges towards some 555
sort of separation between the two phases, which accounts for the positive excess volumes 556
calculated at 4 6 (Figures 3 and 4). Note that the plane of growth of the SiO layers 557
coincides with the mirror planes for the pseudomerohedral twins inducing ferroelastic lattice 558
strain in majorite (Heinemann et al. 1997). We may also remark that force-field calculations 559
by Becker et al. (2000) and by Becker and Pollok (2002) provided a similar tendency to 560
cation ordering in alternating layers for 1: 1 compositions of barite-celestite and grossular-561
andradite solid solutions, respectively. On the hibschite side ( 7), a mixed distribution of 562 SiO and H O tetrahedra appears to be thermodynamically favored, which nicely correlates 563
with the negative excess volumes of Figures 3 and 4. These two tetrahedra distribution 564
patterns meet at 7, that is right at the discontinuity encountered on both the calculated 565
enthalpy and volume of mixing (Figures 2 and 3). As previously discussed, composition 566 7 features a small energy difference (about 0.8 mHa) between min ∆ and the next SIC. 567
Figure 8 shows the corresponding structures: the most stable at the bottom and the less stable 568
at the top. The most stable configuration displays a tetrahedra arrangement consistent with 569
the hibschite pattern, while the second is consistent with the katoite pattern. Plots of ∆ 570
(solid lines), represent the two series of configurations with different colors. Each color 571
corresponds to a continuity region of the excess enthalpy function. This suggests that ∆ 572
is given by a superposition of two different curves with minima at 4 and 8 , 573
respectively, that intersect at 7. In order to decipher the effective interactions that shape 574
the ∆ function, a classical “J-formalism” or cluster expansion (CE) may be applied. This 575
method was adopted, for example, by Becker and Pollok (2002) to fit the energies of mixing 576
of grossular-andradite solid solutions. In that case, the authors used a CE of pairwise cation 577
interactions only, up to third nearest neighbors. However, for a non-regular system like the 578
grossular-katoite binary, one should either extend the CE to at least three body interactions, 579
or consider pairwise interactions as functions of composition (Vinograd et al. 2010). The 580
application of such approach would be an interesting follow-up to this study. 581

20
Let us now have an insight on the tetrahedra distribution of the enthalpy local minimum at 582 8, which corresponds to stoichiometry Ca Al SiO H O . Figure 9 shows a perfect 583
correspondence with the experimental structure of henritermierite (Armbruster et al. 2001), 584
that is another mineral of the hydrogarnet group having formula Ca Mn SiO H O . 585
Even the hydrogen positions in henritermierite resemble the arrangement provided by our 586
calculation. Due to the Jahn-Teller distortion of octahedral Mn3+, henritermierite has a 587
tetragonal lattice (space group 4 / ), with cell parameters 12.489 and 11.909 Å 588
and a ratio / 1.049. An Al-dominant analogue of average composition 589 Ca Al . Mn . Fe . SiO H O . , named holstamite, has also been reported with a 590
slightly lower ratio: / 1.034, being 12.337 Å and 11.930 Å (Halenius et al. 591
2005). Holstamite belongs to a solid solution between henritermierite and a hypothetical 592
tetragonal end-member Ca Al SiO H O , which, given the absence of Mn , should be 593
associated to the smallest / ratio along the series. In fact, the most stable configuration 594
calculated at 8 does correspond to such a hypothetical end-member: it has the exact 595
stoichiometry, a tetragonal symmetry and a pseudo-cubic unit cell with ratio / 1.023. 596
IMPLICATIONS 597
An ab initio quantum-mechanical approach has been adopted to analyze structure and 598
energetics aspects of the grossular-katoite solid solution. Calculations have been performed 599
within the primitive cell of cubic garnets, using all-electron Gaussian basis sets and the 600
B3LYP hybrid functional. The results obtained at the present level of approximation can be 601
summarized as follows: i) all the 136 SICs obtained by hydrogarnet substitution feature 602
pseudo-cubic conventional cells after full geometry relaxation; ii) at low temperatures 603
(approximately below 700 K), the properties of the system pertain essentially to the ground 604
state; iii) the excess enthalpy describes an asymmetric function, with two minima that can be 605
associated to natural minerals of stoichiometry Ca Al SiO H O and Ca Al SiO 2H O , 606
respectively; iv) the asymmetry of the enthalpy of mixing can be related to two different 607
distribution patterns of the tetrahedra H O and SiO , which intersect around composition 608 Ca Al SiO . H O . ( 7); v) for lower amounts of grossular, the SiO tetrahedra 609
tend to cluster in 1 0 1 planes and, consequently, the excess volume becomes positive 610
within the range 1 1.5; vi) hydrogen interactions also contribute to the asymmetry of 611
the excess enthalpy as those developed around one SiO in katoite 1 are stronger than 612
those around one H O in grossular 11 ; vii) the oxygens are unambiguously split into 613
21
grossular-like and katoite-like tetrahedral sites, whatever the composition; viii) hydrogen 614
interactions in fully-hydrated katoite are found to be weak as suggested by dramatic changes 615
in the H environment associated with the introduction of SiO tetrahedra. 616
Implications of this work can be envisaged at different levels. The immediate fallout is 617
represented by the complement of knowledge and by the interpretive support that theoretical 618
data provide to the experimental evidence. The atomistic approach of the simulation allowed 619
us to deepen the structural analysis of hydrogrossular, establishing interesting correlations 620
with the enthalpy of the solid solution. In fact, we have shown that the hydrogarnet 621
substitution is driven by a strong enthalpy gain. All compositions are possible on the basis of 622
the calculated excess enthalpy, meaning that the reported miscibility gap between 623
compositions Ca Al SiO . H O . and Ca Al SiO . H O . can be filled by 624
varying temperature and pressure conditions. On a practical level, the relationship between 625
stability and excess volume of hydrogrossular can serve the purpose of controlling the 626
rheology of cement pastes and producing dense concrete structures. Also, the positive excess 627
volumes calculated for 1 1.5 indicate that solid solutions with these compositions are 628
impeded by high pressures. The next step would be performing frequency calculations on the 629
optimized structures in order to access entropic contributions to the thermodynamics of the 630
system. 631
Besides that, the present work may also have a strong methodology impact in the field of 632
the theoretical study of solid solutions (and disordered crystals). In this regard, we have 633
shown the SA-MC sampling of the configurational space as a valuable route to tackle these 634
kinds of systems via first-principle simulations, and thus get accurate estimates of their 635
average structure and energetic properties. We can expect that the same holds true for other 636
properties (e.g., spectroscopic, dielectric, magnetic), but care must be taken when dealing 637
with tensor quantities because Boltzmann averages are not straightforward. Further work is 638
required in order to define an appropriate method for processing the calculated data in such 639
cases. Finally, there are some issues that still remain open, for example understanding the 640
relationship between symmetry and stability of the classes of configurations. We have found 641
that minima and maxima of the calculated enthalpy of mixing correspond to symmetric 642
configurations. If proven in general, this connection would be of great help in exploring 643
configurational spaces, as it would bridge directly towards minima and maxima of the 644
potential energy surface. The advantages, in terms of computational efficiency, would be 645
proportional to the size of the system: the larger the unit cell, the lower the ratio between 646
22
symmetric and asymmetric classes of configurations. 647
ACKNOWLEDGEMENTS 648
This work, partially undertaken within the framework of CALSIMLAB, is supported by the 649
public grant ANR-11-LABX-0037-01 overseen by the French National Research Agency 650
(ANR) as part of the “Investissements d’Avenir” program (reference: ANR-11-IDEX-0004- 651
02). It was granted access to the HPC resources of The Institute for scientific Computing and 652
Simulation financed by Region Ile de France and the project Equip@Meso (reference ANR-653
10-EQPX-29-01). We also acknowledge PRACE for awarding us access to the high-654
performance computing resource Hornet based in Germany at HLRS (Proposal 2014102294). 655
Finally, we express special thanks to the anonymous referees for thoroughly reading the 656
manuscript and providing sound comments. 657
658
659
23
Ackermann, L., Cemic, L., and Langer, K. (1983) Hydrogarnet substitution in pyrope: a 660
possible location for “water” in the mantle. Earth Planet Science Letters, 62, 208 – 214. 661
Aines, R.D., and Rossman, G.R. (1984) The hydrous component in garnets; pyralspites. 662
American Mineralogist, 69, 1116–1126. 663
Armbruster, T., Kohler, T., Libowitzky, E., Friedrich, A., Miletich, R., Kunz, M., 664
Medenbach, O., and Gutzmer, J. (2001) Structure, compressibility, hydrogen bonding, and 665
dehydration of the tetragonal Mn3+ hydrogarnet, henritermierite. American Mineralogist, 666
86, 147–158. 667
Armbruster, T., and Lager, G.A. (1989) Oxygen disorder and the hydrogen position in garnet- 668
hydrogarnet solid solutions. European Journal of Mineralogy, 1, 363–370. 669
Atkins, M., Bennett, D.G., Dawes, A.C., Glasser, F.P., Kindness, A., and Read, D. (1992) A 670
thermodynamic model for blended cements. Cement and Concrete research, 22, 497–502. 671
Atkins, M., and Glasser, F.P. (1992) Application of portland cement-based materials to 672
radioactive waste immobilization. Waste Management, 12, 105 – 131. 673
Balan, E., Yi, H., and Blanchard, M. (2013) First-principles study of OH defects in zircon. 674
Physics and Chemistry of Minerals, 40, 547–554. 675
Basso, R., Della Giusta, A., and Zefiro, L. (1983) Crystal structure refinement of plazolite: a 676
highly hydrated natural hydrogrossular. Neues Jahrbuch Fur Mineralogie-Monatshefte, pp. 677
251–258. 678
Becke, A.D. (1993) Density-functional thermochemistry. III. The role of exact exchange. 679
Journal of Chemical Physics, 98, 5648. 680
Becker, U., Fernandez-Gonzalez, A., Prieto, M., Harrison, R., and Putnis, A. (2000) Direct 681
calculation of thermodynamic properties of the barite/celestite solid solution from 682
molecular principles. Physics and Chemistry of Minerals, 27, 291–300. 683
Becker, U., and Pollok, K. (2002) Molecular simulations of interfacial and thermodynamic 684
mixing properties of grossular-andradite garnets. Physics and Chemistry of Minerals, 29, 685
52–64. 686
Belyankin, D.S., and Petrov, V.P. (1941) The grossularoid group (hibschite, plazolite). 687
American Mineralogist, 26, 450–453. 688
Bennett, D.G., Read, D., Atkins, M., and Glasser, F.P. (1992) A thermodynamic model for 689
blended cements. II: Cement hydrate phases; thermodynamic values and modelling 690
studies. Journal of Nuclear Materials, 190, 315–325. 691
Botis, S.M., Pan, Y., and Ewing, R.C. (2013) Hydrogen incorporation in crystalline zircon: 692
Insight from ab initio calculations. American Mineralogist, 98, 745–751. 693

24
Broyden, C.G. (1970a) The convergence of a class of double-rank minimization algorithms 1. 694
general considerations. IMA Journal of Applied Mathematics, 6, 76–90. 695
Broyden, C.G. (1970b) The convergence of a class of double-rank minimization algorithms 696
2. The new algorithm. IMA Journal of Applied Mathematics, 6, 222–231. 697
Ceccarelli, C., Jeffrey, G., and Taylor, R. (1981) A survey of O-H···O hydrogen bond 698
geometries determined by neutron diffraction. Journal of Molecular Structure, 70, 255 – 699
271. 700
Cheng, W., Greenwood, H.J., Hu, H., and Frost, D.C. (1990) XRD and XPS analyses of the 701
grossular-hydrogrossular series. Canadian Mineralogist, 28, 87–91. 702
Civalleri, B., D’Arco, Ph., Orlando, R., Saunders, V.R., and Dovesi, R. (2001) Hartree-Fock 703
geometry optimisation of periodic systems with the CRYSTAL code. Chemical Physics 704
Letters, 348, 131–138. 705
Cohen-Addad, C., Ducros, P., and Bertaut, E.F. (1967) Étude de la substitution du 706
groupement SiO par OH dans les composés Al Ca OH et 707 Al Ca SiO . OH . de type Grenat. Acta Crystallographica, 23, 220–230. 708
Cohen-Addad, C., Ducros, P., Durif-Varambon, A., Bertaut, E.F., and Delapalme, A. (1963) 709
Étude de la position des atomes d’hydrogène dans l’hydrogrenat Al O , 3CaO, 6H O. Solid 710
State Communications, 1, 85 – 87. 711
Cornu, F. (1906) XIII. Beiträge zur Petrographie des Böhmischen Mittelgebirges. 712
Tschermaks mineralogische und petrographische Mitteilungen, 25, 249–268. 713
D’Arco, Ph., Mustapha, S., Ferrabone, M., Noël, Y., De La Pierre, M., and Dovesi, R. (2013) 714
Symmetry and random sampling of symmetry independent configurations for the 715
simulation of disordered solids. Journal of Physics: Condensed Matter, 25, 355401. 716
De La Pierre, M., Noël, Y., Mustapha, S., Meyer, A., D’Arco, Ph., and Dovesi, R. (2013) The 717
in- frared vibrational spectrum of andradite-grossular solid solutions. A quantum-718
mechanical simulation. American Mineralogist, 98, 966–976. 719
Dilnesa, B.Z., Lothenbach, B., Renaudin, G., Wichser, A., and Kulik, D. (2014) Synthesis 720
and characterization of hydrogarnet Ca Al Fe SiO OH . Cement and 721
Concrete research, 59, 96–111. 722
Doll, K. (2001) Implementation of analytical Hartree-Fock gradients for periodic systems. 723
Computer Physics Communications, 137, 74–88. 724
Doll, K., Saunders, V.R., and Harrison, N.M. (2001) Analytical Hartree-Fock gradients for 725
periodic systems. International Journal of Quantum Chemistry, 82, 1–13. 726

25
Dollase, W.A. (1974) A method of determining the distortion of coordination polyhedra. 727
Acta Crystallographica, 30, 513–517. 728
Dovesi, R., Orlando, R., Erba, A., Zicovich-Wilson, C.M., Civalleri, B., Casassa, S., 729
Maschio, L., Ferrabone, M., De La Pierre, M., D’Arco, Ph., Noël, Y., Causà, M., Rérat, 730
M., and Kirtman, B. (2014a) CRYSTAL14: A program for the ab initio investigation of 731
crystalline solids. International Journal of Quantum Chemistry, 114, 1287–1317. 732
Dovesi, R., Saunders, V.R., Roetti, C., Orlando, R., Zicovich-Wilson, C.M., Pascale, F., Doll, 733
K., Harrison, N.M., Civalleri, B., Bush, I.J., D’Arco, Ph., Llunell, M., Causà, M., and 734
Noël, Y. (2014b) CRYSTAL14 User’s Manual. Università di Torino, Torino. 735
Erba, A., Mahmoud, A., Belmonte, D., and Dovesi, R. (2014a) High Pressure Elastic 736
Properties of Minerals from Ab initio Simulations: The Case of Pyrope, Grossular and 737
Andradite Silicate Garnets. Journal of Chemical Physics, 140, 124703. 738
Erba, A., Mahmoud, A., Orlando, R., and Dovesi, R. (2014b) Elastic Properties of Six 739
Silicate Garnet End-members from Accurate Ab initio Simulations. Physics and 740
Chemistry of Minerals, 41, 151–160. 741
Erba, A., Navarrete-López, A.M., Lacivita, V., D’Arco, P., and Zicovich-Wilson, C.M. 742
(2015) Katoite under Pressure: An Ab initio Investigation of its Structural, Elastic and 743
Vibrational Properties Sheds Light on the Phase Transition. Physical Chemistry Chemical 744
Physics, 17, 2660–2669. 745
Ferro, O., Galli, E., Papp, G., Quartieri, S., Szakáll, S., and Vezzalini, G. (2003) A new 746
occurrence of katoite and re-examination of the hydrogrossular group. European Journal 747
of Mineralogy, 15, 419–426. 748
Fletcher, R. (1970) A new approach to variable metric algorithms. Computer Journal, 13, 749
317–322. 750
Flint, E.P., McMurdie, H.F., and Wells, L.S. (1941) Hydrothermal and X-ray studies of the 751
garnet-hydrogarnet series and the relationship of the series to hydration products of 752
Portland. Journal of research of the National Bureau of Standards, 26, 13–34. RP1355. 753
Flint, E.P., and Wells, L.S. (1941) Relationship of the garnet-hydrogarnet series to the sulfate 754
resistance of Portland cements. Journal of research of the National Bureau of Standards, 755
26,13–33. 756
Foreman Jr., D.W. (1968) Neutron and X-Ray Diffraction Study of Ca Al O D , a 757
Garnetoid. Journal of Chemical Physics, 48, 3037–3041. 758
Foshag, W.F. (1920) Plazolite, a new mineral. American Mineralogist, 5, 183–185. 759
Frankel, J.J. (1959) Uvarovite garnet and South African jade (hydrogrossular) from the 760

26
Bushveld complex, Transvaal. American Mineralogist, 44, 565–591. 761
Geiger, C.A., Dachs, E., and Benisek, A. (2012) Thermodynamic behavior and properties of 762
katoite (hydrogrossular): A calorimetric study. American Mineralogist, 97, 1252–1255. 763
Geiger, C.A., Langer, K., Bell, D.R., Rossman, G.R., and Winkler, B. (1991) The hydroxide 764
component in synthetic pyrope. American Mineralogist, 76, 49–59. 765
Goldfarb, D. (1970) A family of variable-metric methods derived by variational means. 766
Mathematics of Computation, 24, 23–26. 767
Griggs, D. (1967) Hydrolytic Weakening of Quartz and Other Silicates. Geophysical Journal 768
of the Royal Astronomical Society, 14, 19–31. 769
Halenius, U., Haüssermann, U., and Harrison, H. (2005) Holtstamite, 770 Ca Al, Mn SiO H O , a new tetragonal hydrogarnet from Wessels Mine, 771
South Africa. European Journal of Mineralogy, 17, 375–382. 772
Heinemann, S., Sharp, T.G., Seifert, F., and Rubie, D.C. (1997) The cubic-tetragonal phase 773
transition in the system majorite Mg Si O - pyrope Mg Al Si O , and garnet 774
symmetry in the Earth’s transition zone. Physics and Chemistry of Minerals, 24, 206–221. 775
Hillier, S., Lumsdon, D.G., Brydson, R., and Paterson, E. (2007) Hydrogarnet: A host phase 776
for Cr(VI) in Chromite Ore Processing Residue (COPR) and other high pH wastes. 777
Environmental Science & Technology, 41, 1921–1927. 778
Jappy, T.G., and Glasser, F.P. (1991) Synthesis and stability of silica-substituted hydrogarnet 779 Ca Al Si O OH . Advances in Cement Research, 4, 1–8. 780
Knittle, E., Hathorne, A., Davis, M., and Williams, Q. (1992) A spectroscopic study of the 781
high-pressure behavior of the O H substitution in garnet, pp. 297–304. American 782
Geophysical Union, Washington. 783
Kyritsis, K., Meller, N., and Hall, C. (2009) Chemistry and Morphology of Hydrogarnets 784
Formed in Cement-Based CASH Hydroceramics Cured at 200◦to 350◦C. Journal of the 785
American Ceramic Society, 92, 1105–1111. 786
Lacivita, V., D’Arco, Ph., Orlando, R., Dovesi, R., and Meyer, A. (2013) Anomalous 787
birefringence in andradite-grossular solid solutions. A quantum-mechanical approach. 788
Physics and Chemistry of Minerals, 40, 781–788. 789
Lacivita, V., Erba, A., Dovesi, R., and D’Arco, Ph. (2014) Elasticity of Grossular-Andradite 790
Solid Solution: An Ab initio Investigation. Physical Chemistry Chemical Physics, 16, 791
15331–15338. 792
Lager, G.A., Armbruster, T., and Faber, J. (1987a) Neutron and X-ray diffraction study of hy- 793

27
drogarnet Ca Al O H . American Mineralogist, 72, 756–765. 794
Lager, G.A., Armbruster, T., Rotella, F.J., and Rossman, G.R. (1989) OH substitution in 795
garnets; X-ray and neutron diffraction, infrared, and geometric-modeling studies. 796
American Mineralogist, 74, 840–851. 797
Lager, G.A., Downs, R.T., Origlieri, M., and Garoutte, R. (2002) High-pressure single-crystal 798
X- ray diffraction study of katoite hydrogarnet: Evidence for a phase transition from 799 3 43 symmetry at 5 GPa. American Mineralogist, 87, 642–647. 800
Lager, G.A., Marshall, W.G., Liu, Z., and Downs, R.T. (2005) Re-examination of the 801
hydrogarnet structure at high pressure using neutron powder diffraction and infrared 802
spectroscopy. American Mineralogist, 90, 639–644. 803
Lager, G.A., Rossman, G.R., Rotella, F.J., and Schultz, A.J. (1987b) Neutron-diffraction 804
structure of a low-water grossular at 20K. American Mineralogist, 72, 766–768. 805
Mackwell, S., Kohlstedt, D., and Paterson, M. (1985) The role of water in the deformation of 806
olivine single crystals. Journal of Geophysical Research: Solid Earth, 90, 11319–11333. 807
Mahmoud, A., Erba, A., Doll, K., and Dovesi, R. (2014) Pressure Effect on Elastic 808
Anisotropy of Crystals from Ab initio Simulations: The Case of Silicate Garnets. Journal 809
of Chemical Physics, 140, 234703. 810
Mustapha, S., D’Arco, Ph., De La Pierre, M., Noël, Y., Ferrabone, M., and Dovesi, R. (2013) 811
On the use of symmetry in configurational analysis for the simulation of disordered solids. 812
Journal of Physics: Condensed Matter, 25, 105401. 813
Novak, G.A., and Gibbs, G.V. (1971) The crystal chemistry of silicate garnets. American 814
Mineralogist, 56, 791–825. 815
Nyfeler, D., and Armbruster, T. (1998) Silanol groups in minerals and inorganic compounds. 816
American Mineralogist, 83, 119–125. 817
Olijnyk, H., Paris, E., Geiger, C.A., and Lager, G.A. (1991) Compressional study of katoite 818 Ca Al O H and grossular garnet. Journal of Geophysical Research: Solid Earth, 96, 819
14313–14318. 820
O’Neill, B., Bass, J.D., and Rossman, G.R. (1993) Elastic properties of hydrogrossular garnet 821
and implications for water in the upper mantle. Journal of Geophysical Research: Solid 822
Earth, 98, 20031–20037. 823
Orlando, R., Torres, F., Pascale, F., Ugliengo, P., Zicovich-Wilson, C., and Dovesi, R. (2006) 824
Vibrational spectrum of katoite Ca Al OH : a periodic ab initio study. Journal of 825
Physical Chemistry B, 110, 692–701. 826

28
Pabst, A. (1937) The crystal structure of plazolite. American Mineralogist, 22, 861–868. 827
Pabst, A. (1942) Reexamination of hibschite. American Mineralogist, 27, 783–792. 828
Paier, J., Marsman, M., and Kresse, G. (2007) Why does the B3LYP hybrid functional fail 829
for metals? Journal of Chemical Physics, 127, 024103. 830
Pascale, F., Ugliengo, P., Civalleri, B., Orlando, R., D’Arco, Ph., and Dovesi, R. (2004) The 831
katoite hydrogarnet Si-free Ca Al OH : A periodic Hartree–Fock and B3-LYP study. 832
Journal of Chemical Physics, 121, 1005–1013. 833
Passaglia, E., and Rinaldi, R. (1984) Katoite, a new member of the Ca Al SiO -834 Ca Al OH series and a new nomenclature for the hydrogrossular group of minerals. 835
Bulletin de Minéralogie, 107, 605–618. 836
Pauling, L. (1929) The principles determining the structure of complex ionic crystals. Journal 837
of the American Chemical Society, 51, 1010–1026. 838
Pickard, C.J., and Needs, R.J. (2011) Ab initio random structure searching. Journal of 839
Physics: Condensed Matter, 23, 053201. 840
Pöllmann, H. (2012) Calcium aluminate cements – Raw materials, Differences, Hydration 841
and Properties. Reviews in Mineralogy and Geochemistry, 74, 1–82. 842
Pòlyà, G., and Read, R.C. (1987) Combinatorial Enumeration of Groups, Graphs, and 843
Chemical Compounds. Springer, New York. 844
Rodehorst, U., Geiger, C.A., and Armbruster, T. (2002) The crystal structures of grossular 845
and spessartine between 100 and 600 K and the crystal chemistry of grossular-spessartine 846
solid solutions. American Mineralogist, 87, 542–549. 847
Sacerdoti, M., and Passaglia, E. (1985) The crystal structure of katoite and implications 848
within the hydrogrossular group of minerals. Bulletin de Minéralogie, 108, 1–8. 849
Sanchez, J., Ducastelle, F., and Gratias, D. (1984) Generalized cluster description of 850
multicomponent systems. Physica A: Statistical Mechanics and its Applications, 128, 334-851
350. 852
Sanchez, J.M. (1993) Cluster expansions and the configurational energy of alloys. Physical 853
Review B, 48, 14013–14015. 854
Shanno, D.F. (1970) Conditioning of quasi-Newton methods for function minimization. 855
Mathematics of Computation, 24, 647–656. 856
Shannon, R.D., Mariano, A.N., and Rossman, G.R. (1992) Effect of H2O and CO2 on 857
Dielectric Properties of Single-Crystal Cordierite and Comparison with Polycrystalline 858
Cordierite. Journal of the American Ceramic Society, 75, 2395–2399. 859

29
Taylor, H.F.W., and Newbury, D.E. (1984) An electron microprobe study of a mature cement 860
paste. Cement and Concrete Research, 14, 565–573. 861
Tilley, C.E. (1957) On the replacement of anorthosite by hydrogrossular in the Transvaal. 862
Trans. Geological Society of South Africa, 60, 15–20. 863
Vinograd, V., Paulsen, N., Winkler, B., and van de Walle, A. (2010) Thermodynamics of 864
mixing in the ternary rhombohedral carbonate solid solution, Ca Mg , Mn CO , 865
from atomistic simulations. Calphad, 34, 113 – 119. 866
Wales, D.J. (1998) Symmetry, near-symmetry and energetics. Chemical Physics Letters, 285, 867
330 – 336. 868
Zabinski, W. (1966) Hydrogarnets, vol. 3, pp. 1–61. Pol. Akad. Nauk, Oddzial Krakowie 869
Kom. Nauk Mineral. 870
871
874
875
876
877
878
879
880
881
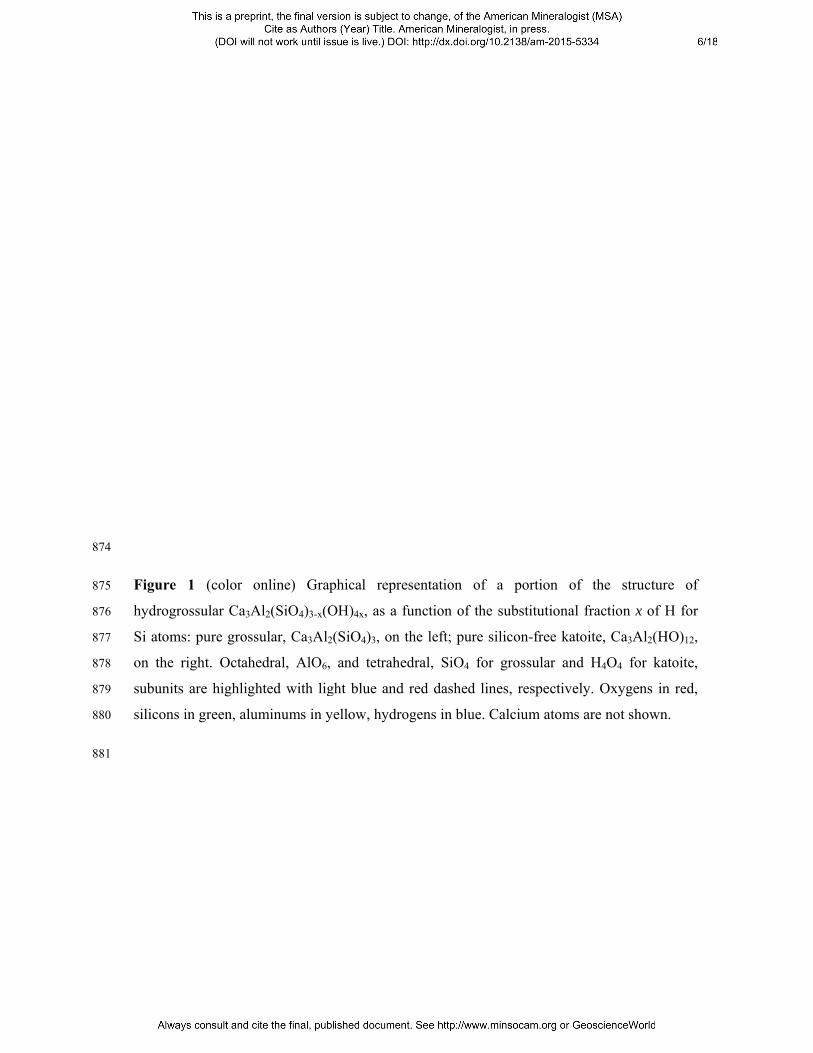
Figure
hydrogro
Si atoms
on the ri
subunits
silicons i
1 (color o
ossular Ca3A
: pure gross
ight. Octahe
are highligh
in green, alum
online) Grap
Al2(SiO4)3-x(O
sular, Ca3Al2
edral, AlO6,
hted with lig
minums in y
phical repr
OH)4x, as a
2(SiO4)3, on
, and tetrahe
ght blue and
yellow, hydr
esentation
function of
the left; pur
edral, SiO4
d red dashed
rogens in blu
of a portio
the substitu
re silicon-fre
for grossula
d lines, respe
ue. Calcium a
on of the
utional fractio
ee katoite, C
ar and H4O
ectively. Ox
atoms are no
structure o
on x of H fo
Ca3Al2(HO)1
O4 for katoit
xygens in red
ot shown.
of
or
12,
te,
d,

32
882
883
Figure 2 (color online) Excess enthalpy ∆ as a function of composition , which stands for 884
the number of Si atoms in the unit cell. Red and pink points are SICs with minimum and 885
maximum excess enthalpy, respectively; blue points are the SICs with ∆ closest to the 886
minimum; black points are SICs with intermediate excess enthalpy. Different symbols 887
represent different SIC multiplicities : full square 1; half full circle 2; half full diamond 3; 888
full up triangle 6; full down triangle 8; full diamond 12; full pentagon 16; circle with full 889
quarter 24; small full circle 48. 890
891
-0.06
-0.05
-0.04
-0.03
-0.02
-0.01
0
0 2 4 6 8 10 12
Δ H
(Ha)
n
Kat Gro

33
892
Figure 3 (color online) Excess volume ∆ as a function of composition , which stands for 893
the number of Si atoms in the unit cell. Different colors distinguish the SICs on the basis of 894
the corresponding excess enthalpy, according to the scheme defined in Figure 2. The solid 895
curve is an eye-guide approximating the average function ∆ n at 300 K. Different symbols 896
represent different SIC multiplicities (see caption to Figure 2 for details). 897
898
-60
-50
-40
-30
-20
-10
0
10
0 2 4 6 8 10 12
Δ V
(A3 )
n
Kat Gro

34
899
Figure 4 (color online) Boltzmann average volume (upper panel) and excess volume ∆ 900
(lower panel) as functions of the composition . Full black circles are calculated values at 901
300 K. Red symbols are experimental data by Pabst (1937), solid rhombus; Flint et al. (1941), 902
empty circles; Cohen-Addad et al. (1967, 1963), cross; Basso et al. (1983), full triangle; 903
Passaglia and Rinaldi (1984), empty triangle; Sacerdoti and Passaglia (1985), full inverted 904
triangle; Lager et al. (1989), plus; Cheng et al. (1990), solid circles; Jappy and Glasser 905
(1991), asterisks; O’Neill et al. (1993), solid square; Ferro et al. (2003), solid pentagon; and 906
Pöllmann (2012), empty rhombi. Empty squares are the end-members obtained as averages of 907
various experiments (Cheng et al. 1990, Cohen-Addad et al. 1963, Flint et al. 1941, Lager et 908
al. 1987a, 2005, 1987b, Novak and Gibbs 1971, Rodehorst et al. 2002). Solid straight lines in 909
the upper panel connect the end-members. 910
911
1700
1800
1900
2000
-50
-40
-30
-20
-10
0
10
0 2 4 6 8 10 12
ΔV- (A
3 )
n
V- (A3 )
Kat Gro

35
912
Figure 5 (color online) Octahedral shared, , and unshared, , edge length (Å) as a function 913
of composition . Full symbols represent average values for oxygen pairs O O, O OH and 914 OH OH. Gray stripes include weighted means over the three oxygen pairs contributing to 915
and at the various compositions. The vertical line indicates the composition at which the 916
intersection between the two gray stripes occurs. Red asterisks are experimental data from 917
Lager et al. (1987a), 0; Sacerdoti and Passaglia (1985), 2.56; Ferro et al. (2003), 918 4.48; Basso et al. (1983), 7.08; and Novak and Gibbs (1971), 12. 919
2.7
2.8
0 2 4 6 8 10 12
U (A
° )
n
2.6
2.7
2.8
2.9
S (A
° )
O-OO-OH
OH-OH

36
920
Figure 6 (color online) Tetrahedral δ-O distance (between the barycenter δ and the oxygens 921
at the vertices) as a function of composition , that is the number of Si atoms in the primitive 922
cell. Full circles and squares are average δ-O values for SiO and H O tetrahedra, 923
respectively. Error-bars range from the minimum to the maximum δ-O distance in each 924
tetrahedron. The gray stripe represents average δ-O distances weighted over the SiO and the 925 H O tetrahedra at each composition. Red asterisks are experimental data from Lager et al. 926
(1987a), 0; Sacerdoti and Passaglia (1985), 2.56; Ferro et al. (2003), 4.48; 927
Basso et al. (1983), 7.08; and Novak and Gibbs (1971), 12. 928
929
1.6
1.7
1.8
1.9
2.0
2.1
0 2 4 6 8 10 12
δ-O
(A° )
n
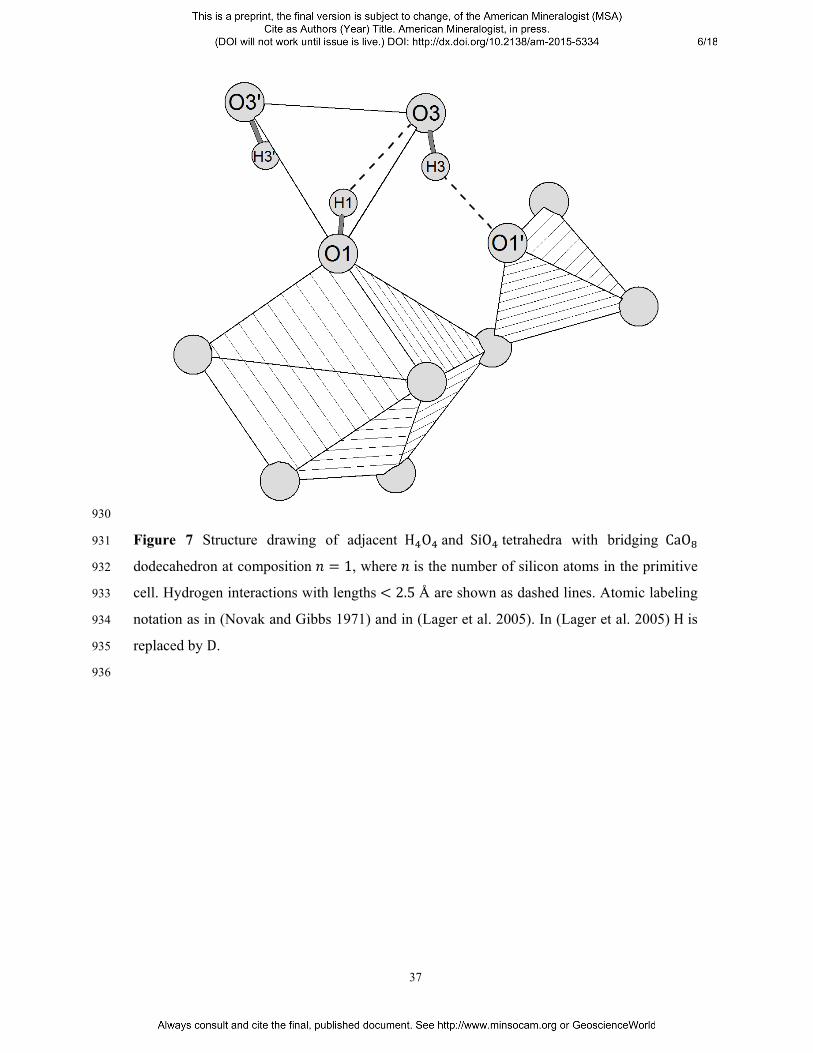
37
930
Figure 7 Structure drawing of adjacent H O and SiO tetrahedra with bridging CaO 931
dodecahedron at composition 1, where is the number of silicon atoms in the primitive 932
cell. Hydrogen interactions with lengths 2.5 Å are shown as dashed lines. Atomic labeling 933
notation as in (Novak and Gibbs 1971) and in (Lager et al. 2005). In (Lager et al. 2005) H is 934
replaced by D. 935
936

38
937
Figure 8 (color online) Distribution of SiO
(blue) and H O (gray) tetrahedra in the pseudo-cubic cell of m
inimum
energy SICs. The num
ber
of Si atoms refers to the prim
itive cell. At 7 , tw
o stable SICs w
ith very similar energy are illustrated: the m
ost stable SIC at the bottom
, the
next one at the top. Two distribution trends are visible, one for 7 and one for 7 , in w
hich a structural continuity between the SIC
s is
recognized. Plots of ∆ (solid lines) feature the tw
o series of SICs in different colors: each color corresponds to a continuity region. ∆
is likely a superposition of two curves w
ith minim
a at 4 and 8 , intersecting at 7 (discontinuity point). Dashed portions of these
curves are drawn as an eye guide.

39
938 Figure 9 (color online) The tetrahedra distribution of the minimum enthalpy configuration at 939
composition 8 (left) is compared to that of henritermierite, Ca Mn SiO H O 940
(right). SiO tetrahedra in blue; H O tetrahedra in gray. Yellow and brown spheres represent 941
octahedral cations. Note the agreement between calculated and experimental orientation of 942
the O H groups. 943
944

41
Table I Distribution of the SICs obtained by substitution of the tetrahedral sites in the garnet 947
primitive cell. For different numbers of Si atoms, fractional composition 3 1 948 /12 , number of SICs , total number of atomic configurations , and minimum 949
multiplicity (corresponding to the maximum symmetry) of the respective classes are 950
reported. 951
0 3.00 1 1 1
1 2.75 1 12 12
2 2.50 5 66 6
3 2.25 7 220 12
4 2.00 18 495 3
5 1.75 20 792 12
6 1.50 32 924 2
7 1.25 20 792 12
8 1.00 18 495 3
9 0.75 7 220 12
10 0.50 5 66 6
11 0.25 1 12 12
12 0.00 1 1 1
136 4096 952
953

42
Table II Lattice parameters , , (Å) and angles , , (degrees) of the SICs at composition 954 6, where is the number of in the primitive cell. The classes are listed in order of 955
increasing energy, the total variation being 51 mHa. Multiplicities and lattice types (Lat.), 956
as deduced from the analysis of the residual symmetry group, are also reported: Cub = cubic, 957
Tet = tetragonal, Trg = trigonal, Ort = orthorhombic, Mon = monoclinic, Trc = triclinic. 958
Lattice types might not refer to the conventional definition. Percentage indices of the overall 959
deviation from the ideal cubic structure are given at the bottom (see text for definitions). 960
Lat. 1 12 12.324 12.349 12.349 90.00 91.29 90.00 Ort 2 12 12.381 12.294 12.294 90.00 90.00 90.00 Tet 3 6 12.319 12.319 12.320 90.00 90.00 90.00 Tet 4 48 12.358 12.303 12.303 90.61 90.57 90.32 Trc 5 24 12.360 12.360 12.208 89.67 90.33 90.01 Mon 6 12 12.354 12.348 12.214 90.00 90.00 90.00 Ort 7 48 12.339 12.276 12.295 90.46 90.03 89.79 Trc 8 12 12.363 12.321 12.222 90.00 90.00 90.00 Ort 9 24 12.332 12.332 12.204 90.07 89.93 90.05 Mon 10 48 12.322 12.273 12.317 89.51 89.71 90.69 Trc 11 48 12.322 12.310 12.285 89.78 89.29 90.04 Trc 12 24 12.365 12.264 12.264 90.08 90.33 89.67 Mon 13 48 12.324 12.296 12.273 89.71 89.98 90.46 Trc 14 24 12.269 12.312 12.312 89.50 90.70 89.30 Mon 15 12 12.374 12.298 12.171 90.00 90.48 90.00 Mon 16 48 12.334 12.243 12.294 89.96 90.00 90.79 Trc 17 48 12.315 12.314 12.227 90.19 90.29 90.30 Trc 18 48 12.316 12.318 12.234 89.70 89.97 90.11 Trc 19 48 12.313 12.238 12.302 89.92 90.37 90.12 Trc 20 8 12.299 12.299 12.299 89.56 89.56 89.56 Trg 21 48 12.307 12.295 12.256 89.48 90.35 89.90 Trc 22 24 12.324 12.260 12.279 89.66 90.00 90.00 Mon 23 24 12.341 12.242 12.242 89.63 90.03 89.97 Mon 24 24 12.287 12.287 12.227 90.09 89.91 90.30 Mon 25 48 12.315 12.286 12.205 89.78 90.41 89.81 Trc 26 48 12.292 12.304 12.204 89.96 90.30 90.43 Trc 27 12 12.240 12.240 12.287 90.00 90.00 90.00 Tet 28 24 12.286 12.286 12.254 90.03 89.97 90.30 Mon 29 12 12.293 12.225 12.225 90.00 90.00 90.00 Tet 30 48 12.287 12.234 12.216 90.16 90.19 90.13 Trc 31 8 12.243 12.243 12.243 90.39 90.39 90.39 Trg 32 2 12.191 12.191 12.191 90.00 90.00 90.00 Cub |∆| 0.27 0.18 0.28 0.22 0.27 0.22 ∆ 0.24 0.00 -0.24 -0.07 0.15 0.08 max|∆| 0.76 0.41 0.90 0.68 1.43 0.88
961

43
962
963
964
Table III Selected distances (Å) and angles (degrees) involving the hydrogen atom at 965
different compositions . Minimum energy SICs are considered. Notation as in Figure 7. 966
0 1 4 6 11 O1 H1 0.961 0.961 0.961 0.962 0.963 O3 H3 - 0.969 0.965 0.964 0.963 H1 O3 2.513 2.335 2.547 2.472 2.412 H1 O3 2.564 2.593 2.553 2.590 2.677 H3 O1 2.610 2.077 2.172 2.164 2.191 O1 H1 O3 138.8 148.0 147.0 137.7 142.6 O1 H1 O3 133.2 134.4 133.4 141.5 117.1 O3 H3 O1 109.0 148.7 132.0 135.9 127.1 δ O1 H1 36.26 24.21 27.88 28.55 45.52 δ O3 H3 - 65.46 52.17 53.93 45.52 967