Embed Size (px)
DESCRIPTION
Hydrologic Models for Urban Floodplain Mapping and Damage Reduction in Brownsville, TX. Philip Bedient. Rice University CEE Department Houston, Texas. March 17, 2006. Background of Floodplain Studies. Floodplain studies: - PowerPoint PPT Presentation
Citation preview

Hydrologic Models for Urban Floodplain Mapping and Damage Reduction in Brownsville, TX
Philip BedientRice University
CEE DepartmentHouston, Texas
March 17, 2006

Background of Floodplain StudiesFloodplain studies:
Provide Water surface profiles and floodplain maps for land development and impact statements caused by urbanizationInclude the analysis of historic floods for model calibrationFeature the computation of the water surface profile for at least the 1% annual chance (100-yr) floodUsually do not include solutions for the flood problem

New Technologies for Floodplain Analysis
LIDAR and Radar provide accurate data sets for topography and storm eventsGIS Linked with new hydrologic models allows rapid ability to map resultsThe floodplains created can be overlain on aerial, land use, and public utilities maps to show potential impact

ObjectivesThe models developed will be within a GIS framework for easy data
manipulation and integration.
Use a lumped parameter hydrological model, HEC-HMS, and a hydraulic river analysis system, HEC-RAS, to develop a floodplain based on existing land use and land classification, LIDAR, and both NEXRAD and design storm rainfall data.
Use the same hydrologic and hydraulic models to predict the impact of urbanization on the North Main Drain and Cameron County Drainage District 1 Watersheds
Develop and model feasible flood mitigation options to reduce the effects of flooding on North Main Drain and Cameron County Drainage District 1 watersheds.

Overview of Brownsville, TXBrownsville is a medium-sized city in the south of Texas, located just north of the Rio Grande.It is characterized by very flat slopes and clay-rich soils which make the area very susceptible to floodingAccording to the 2000 US Census, Brownsville’s population has grown from 99,000 to 140,000 since 1990

Overview of Brownsville, TXBrownsville has 4 watersheds
2 main drainage ditches: Cameron County Drainage District 1 Ditch – 23 mi2 North Main Drain – 10 mi2
2 resaca networks: Resaca de la Guerra – 5 mi2 Town Resaca – 6 mi2

LIDAR and Watersheds

Why Accurate Floodplain Predictions are Important for Brownsville
Major events within the last 40 years have caused extensive flooding, a couple being larger than the 100-yr rainfall total of 11.7 inches within 24 hrs.Causes of flooding:
Slope and soil typeTopographic anomaliesRapid urbanizationUndersized drainage channels
Storm Rainfall (inches)
DATE TOTAL DAILY REMARKS
Sep-67 15.4 12.1 Hurricane Beulah
Aug-80 6.9 5.5 Hurricane Allen
Sep-84 15.2 7.9
Sep-88 5.4 4.7 Hurricane Gilbert
Oct-96 10.6 10.6 Tropical Storm Josephine


Overall MethodologyMETHODOLOGY

Methodology - LIDAR
LIDAR is Light Detection and Ranging and uses laser light reflection, GPS, and INSFlight Specs:
Flying Speeds: 200 – 250 km/hFlying Height: 300 – 1000 mScan Angles: 20 – 30 degPulse Rates: 2000 – 50,000 pulses/sec

Disadvantages of LIDARDisadvantages:
Accuracy depends on the accuracy of the GPS and INSProcessing the raw data is not exact
The digital terrain model is a regular surface which does not present remarkable discontinuities
The height of the points are independent of far points, but are correlated to points in the same surroundings

USGS 30m DEM
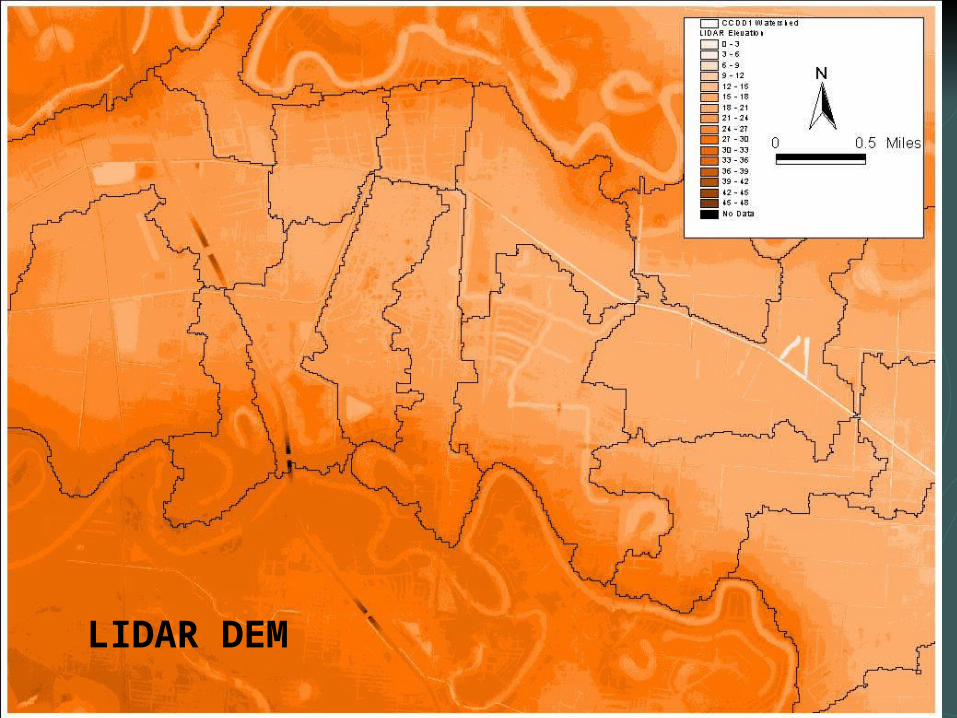
LIDAR DEM

Rainfall Data
Rainfall Duration
2-Year
10-Year
100-Year
1 hour 2 3.2 4.6
2 hours 2.68 4.08 5.9
3 hours 2.9 4.48 6.53
6 hours 3.3 5.42 8.25
12 hours 3.9 6.48 10
24 hours 4.6 7.475 11.75
NEXRAD TP-40 Design Storms

HEC-HMS

HEC-HMS Transforms
Model created by HEC-GeoHMS extension in ArcViewSimulates the runoff-precipitation response of a watershedBasin translation and attenuation represented by Clark Unit Hydrograph (TC&R)Flood wave attenuation in an open channel is modeled via the Modified Puls method (Storage – Discharge relationship depended on momentum and continuity equations)

HEC-RAS
Cross Sections WSE Profiles


HECRAS Bridge CS

HEC RAS Input Window

Multiple Cross Sections
River
Bridge


HEC RAS Profile Plots
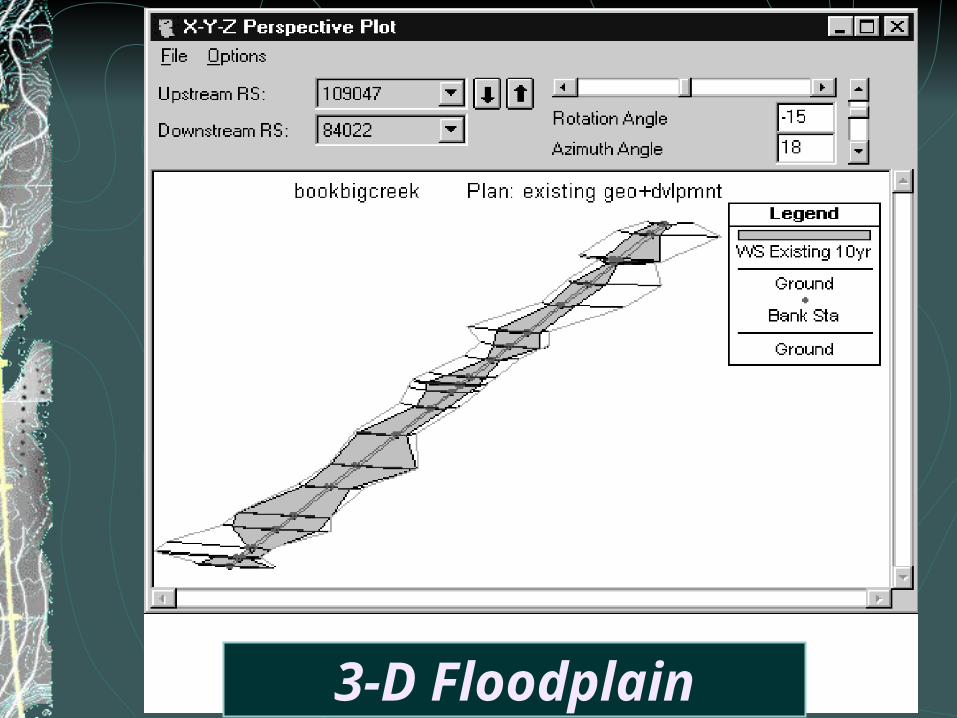
3-D Floodplain

Output Table

Extracting Cross Sections
Geo-RAS ExtensionElevations extracted from LIDAR by cross section shapefilesCross sections, streamlines, flowpaths, are exported from ArcView into HEC-RAS

HEC-RAS and HEC-HMS IterationsStorage/Outflow calculated based oninputted flows and channel geometry
Rating Curves developed based onCalculated storage/outflow
Rating Curve inputted intoHEC-HMS Modified Puls

Floodplain Delineation Based on Land Use
Used current and future Land Use and Land Classification for impervious values, % developed, and roughness coefficientsUsed the 2, 5, 10, 25, 50, and 100-yr design storms for BrownsvilleCalibrated the models with the May 7, 2004 rainfall data from NEXRAD

Floodplain Analysis - Houses

CalibrationUsed the May 7, 2004 storm for calibration:
8.41 inches in 34 hoursModeled between a 2- and 5-yr stormObserved high water marks:
Paredes Ln Rd: 20.53 ft Old Port Isabel: 16.93 ft
Modeled high water marks: Paredels Ln Rd: 20 ft (3%) Old Port Isabel: 16.75 ft (1%)

Flood Mitigation OptionsDetention/Retention Ponds
With controlling inlet and outlet structure
DiversionsChannel Modifications/Improvements
Channel MaintenanceChannel Widening and Lining
Hydraulic Structure ImprovementsImproving CulvertsElevating Bridges
PumpingBuyoutsDevelopment Controls

Option A: Construction of 12 detention ponds and the improvement of a hydraulic structure
Option B: Option A plus a channel improvement from Paredes Ln Road to FM 802
Option C: Option B plus an extend channel improvement to the end of the watershed and the elevation of two bridges

Existing Conditions 100-yr

Existing Conditions Option A 100-yr

Existing Conditions Option B 100-yr

Existing Conditions Option C 100-yr
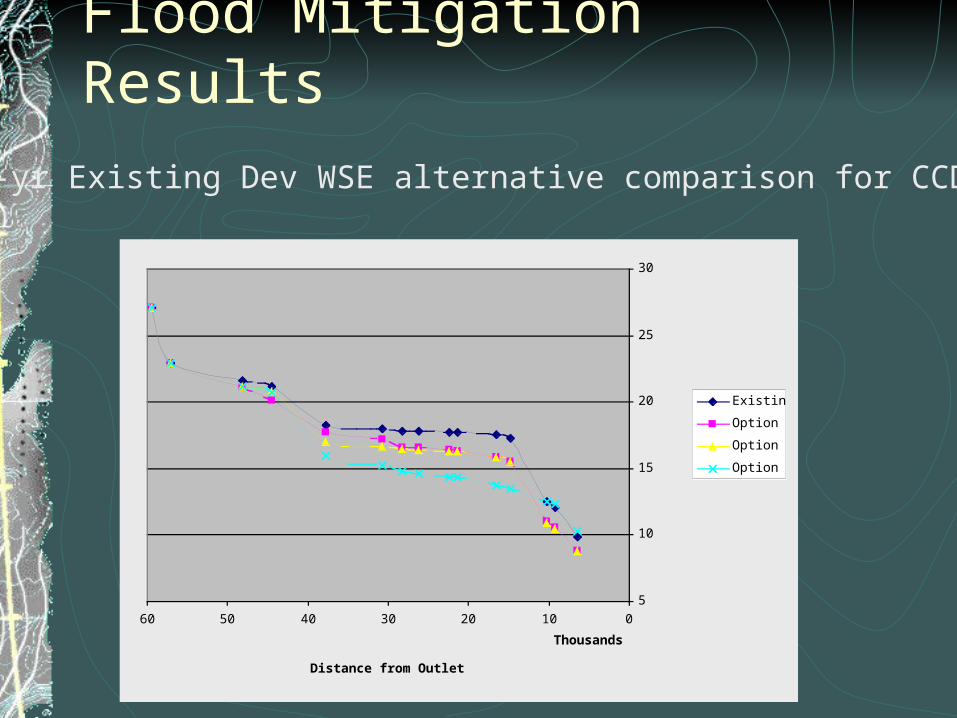
Flood Mitigation Results
5
10
15
20
25
30
0102030405060
Thousands
Distance from Outlet (ft)
Water Surface Elevation (ft)
Existing
Option A
Option B
Option C
100-yr Existing Dev WSE alternative comparison for CCDD1

Full Development Conditions 100-yr

Full Dev. Conditions Option A 100-yr

Full Dev. Conditions Option B 100-yr

Full Dev. Conditions Option C 100-yr

10
12
14
16
18
20
22
24
26
28
30
0102030405060
Thousands
Distance from Outlet (ft)
Water Surface Elevation (ft)
Existing
Option A
Option B
Option C
Flood Mitigation Results
100-yr Full Dev WSE alternative comparison for CCDD1

Conclusions - ObjectivesCreating a flood study within a GIS framework allows for easy manipulation of the data and models.Using a lumped parameter hydrological model (HEC-HMS) in conjunction with a river analysis system (HEC-RAS) can accurately predict floodplainsThe use of a high resolution DEM (LIDAR) provides accurate floodplain prediction with little calibration.The models allowed easy flood analysis to determine feasible mitigation options for the area

Conclusions – Flood AnalysisThe topography, soil, and rapid development of Brownsville makes the area susceptible to flooding for even small storm events.Option C for the CCDD1 ditch provides protection from the 100-yr storm for existing and future developmentStream and rain gages are needed for better model validation. Restrict the amount of allowable discharge into the drainage systems from future developments


![Brownsville herald. (Brownsville, Tex.). 1931-01-04 [p ]. · 2020. 10. 14. · gfmmmtmmmmmmmmmmmmmmmrnmm»»*>»»***mmmmmmmmmmmmmmmm..... ..... J| 1 « ----- --—— Brownsville](https://img.pdfslide.net/doc/110x75/611f38f716d6ee6a5426b1ec/brownsville-herald-brownsville-tex-1931-01-04-p-2020-10-14-gfmmmtmmmmmmmmmmmmmmmrnmmmmmmmmmmmmmmmmmm.jpg)