Embed Size (px)
Citation preview

HYDROLOGIC RESTORATION OFSOUTHERN GOLDEN GATE ESTATES
CONCEPTUAL PLAN
FINAL REPORTFebruary 1996
Big Cypress BasinSouth Florida Water Management District
Naples, Florida

HYDROLOGIC RESTORATION OFSOUTHERN GOLDEN GATE ESTATES
CONCEPTUAL PLAN
FINAL REPORTby
Gail C. AbbottAnanta K. Nath
Big Cypress Basin BoardSouth Florida Water Management District
Naples, Florida
Valerie Boyd, ChairA. Glenn Simpson, Vice Chair
Clifford B. Barksdale, SecretaryClaudia Davenport, Member
Ellin Goetz, MemberCarey Garland, Member
Paul Van Buskirk, Director
February 1996
This report was made possible by a subgrant from the FloridaDepartment of Community Affairs, in cooperation with the U.S.Department of Commerce, National Oceanic and AtmosphericAdministration, under Cooperative Agreement Award No. NA370Z0427. The views expressed herein are those of the author(s) and do notnecessarily reflect the views of NOAA or any of its subagencies.

ii
TABLE OF CONTENTS
Page
LIST OF FIGURES........................................................................................................................ iv
LIST OF TABLES ........................................................................................................................vii
ACKNOWLEDGMENTS............................................................................................................viii
EXECUTIVE SUMMARY............................................................................................................. 1
1. INTRODUCTION...................................................................................................................... 61-1. PROJECT BACKGROUND................................................................................... 61-2. HISTORICAL DEVELOPMENT OF GOLDEN GATE ESTATES...................... 81-3. PRIOR STUDIES AND REPORTS........................................................................ 91-4. INTERAGENCY COORDINATION ................................................................... 13
2. PROBLEM IDENTIFICATION .............................................................................................. 152-1. PLANNING ISSUES ............................................................................................ 15
2-1.1 Water Supply............................................................................................. 152-1.2 Flood Control ............................................................................................ 162-1.3 Natural Ecosystems Management ............................................................. 172-1.4 Water Quality ............................................................................................ 18
2-2. PROJECT GOALS AND OBJECTIVES.............................................................. 182-3. SUMMARY OF EXISTING CONDITIONS........................................................ 19
2-3.1 Meteorology .............................................................................................. 192-3.2 Surface Water Hydrology ......................................................................... 202-3.3 Groundwater.............................................................................................. 222-3.4 Soils .......................................................................................................... 23 2-3.5 Land Use.................................................................................................... 242-3.6 Wetlands.................................................................................................... 242-3.7 Canals and Structures ................................................................................ 26
3. PROBLEM ANALYSIS .......................................................................................................... 293-1. STUDY DESIGN FOR PROJECT ....................................................................... 29
3-1.1 Hydrologic and Hydraulic Modeling Criteria .......................................... 293-1.2 Modeling Algorithms ................................................................................ 31
3-1.2a Hydrologic Submodel.................................................................... 323-1.2b Hydraulic Submodel ................................................................... 34
iii
3-1.2c Groundwater Flow Submodel ....................................................... 353-1.3 Basic Fluxes of Simulation of the SGGE Model ...................................... 36
3-2. MODEL DEVELOPMENT .................................................................................. 373-2.1 Database Development.............................................................................. 37
3-2.1a Time Series Database .................................................................... 373-2.1b Meteorological Data ..................................................................... 38
A. Rainfall . . . . . . . . . . . . . . . . . . . . . . . . . . . . . . . . . . . . . . 38B. Evaporation . . . . . . . . . . . . . . . . . . . . . . . . . . . . . . . . . . .40
3-2.1c Calibration Data ............................................................................ 423-2.2 Land and Channel Segmentation............................................................... 443-2.3 Calibration and Verification...................................................................... 50
3-2.3a Need for and Nature of Model Calibration .................................... 503-2.3b Calibration Results ........................................................................ 52
A. Streamflows at Faka Union No. 1 (Basin Outlet) . . . . . . .55B. Streamflows at Faka Union No. 5 . . . . . . . . . . . . . . . . . . 60C. Streamflows at Faka Union No. 2 . . . . . . . . . . . . . . . . . . 65D. Stages at Merritt Canal at 55th Avenue Southeast . . . . . . 70E. Stages at Miller Canal at 26th Avenue Southeast . . . . . . .70F. South Miller Canal at Miller No. 1 . . . . . . . . . . . . . . . . . .75G. Summary of Calibration Results . . . . . . . . . . . . . . . . . . . .75
3-2.3c Final Calibration Parameters ......................................................... 803-2.3d Sensitivity Analysis of Model Parameters .................................... 803-2.3e Verification of the Model .............................................................. 92
3-3. EVALUATION OF MODEL PERFORMANCE ................................................. 923-3.1 Presence of Seasonal Variable High Groundwater Table in South
Florida Hydrology ..................................................................................... 923-3.2 Sheetflow Hydraulics ................................................................................ 943-3.3 Reach-Reservoir (RCHRES) Module of HSPF ........................................ 963-3.4 Assumptions in Alternative Analysis ...................................................... 963-3.5 Overall Complexity of Modeling SGGE................................................... 97
3-4. ASSESSMENT OF HYDROLOGIC CONDITIONS FOR THE SGGEREGION ............................................................................................................... 98
4. PLAN DEVELOPMENT ...................................................................................................... 1004-1. DEVELOPMENT OF ALTERNATIVE RESTORATION PLANS ................. 100
4-1.1 Criteria for Plan Development ................................................................ 1004-1.2 Identification of Alternatives................................................................... 101
4-1.2a Alternative 1: Diversion Structure ............................................. 1024-1.2b Alternative 2: Spreader Channel and Canal/Road Removal
Plan ............................................................................................. 1024-1.2c Alternative 3: Spreader Channels, Canal Blocks and Selected

iv
Road Removal Plan..................................................................... 105A. Alternative 3A . . . . . . . . . . . . . . . . . . . . . . . . . . . . . . . .114B. Alternative 3B . . . . . . . . . . . . . . . . . . . . . . . . . . . . . . . . 116C. Alternative 3C . . . . . . . . . . . . . . . . . . . . . . . . . . . . . . . .118
4-1.3 Cost Analysis of Plans............................................................................. 1204-1.3a Estimates of First Costs............................................................... 1204-1.3b Estimates of Annual Operation and Maintenance....................... 1204-1.3c Summary of Costs ....................................................................... 1324-1.3d Phased Implementation Costs and Funding ................................ 132
4-1.4 Summary of Alternatives......................................................................... 1344-2. HYDROLOGIC AND HYDRAULIC AND GROUNDWATER
FLOW SIMULATION OF ALTERNATIVES ................................................... 1364-3. EVALUATION OF ALTERNATIVE PLANS................................................... 140
4-3.1 Hydrologic Performance of Alternative 1 ............................................... 1404-3.2 Hydrologic Performance of Alternative 2 ............................................... 1424-3.3 Hydrologic Performance of Alternative 3A ............................................ 1594-3.4 Hydrologic Performance of Alternative 3B............................................. 1754-3.5 Hydrologic Performance of Alternative 3C ............................................ 1814-3.6 Additional Hydrologic Analysis.............................................................. 1844-3.7 Groundwater Analysis for Alternative Plans........................................... 1864-3.8 Summary of Plan Evaluations ................................................................. 1874-3.9 Economic Benefits Evaluation ................................................................ 192
5. RECOMMENDED PLAN .................................................................................................... 195
6. PLAN IMPLEMENTATION................................................................................................. 2016-1. PHASED RESTORATION................................................................................. 2016-2. MANAGEMENT PLAN..................................................................................... 201
7. CONCLUSIONS................................................................................................................... 202
REFERENCES............................................................................................................................ 204
APPENDICESA. List of HSPF AcronymsB. Pervious Land Segments/Reach-Reservoirs DefinedC. HSPF Data Input FilesD. Groundwater Analysis for Spreader ChannelsE. Memorandum Updating Feasibility of Faka Union Diversion Structure

v
LIST OF FIGURES
Figures Page
1. Project Location Map.................................................................................................7 2. Faka Union Canal Watershed Boundary (Existing/Pre-GGE).....................................21 3. Thiessen Polygons for Rainfall Distribution in SGGE.................................................39 4. Calibration Locations.................................................................................................43 5. Pervious Land Segments for the Faka Union Canal Watershed...................................49 6. Canal Segmentation for Faka Union Canal System.....................................................51 7. Schematic Representation of the Model Calibration Process.......................................53 8. Simulated vs Observed Average Annual Streamflows at Faka Union Weir No. 1........57 9. Simulated vs Observed Average Monthly Streamflows at Faka Union Weir No. 1......5810. Double Mass Curve for Streamflows at Faka Union Weir No. 1.................................6111. Simulated vs Observed Average Annual Streamflows at Faka Union Weir No. 5........6212. Simulated vs Observed Average Monthly Streamflows at Faka Union Weir No. 5......6313. Double Mass Curve for Streamflows at Faka Union Weir No. 5.................................6614. Simulated vs Observed Average Annual Streamflows at Faka Union Weir No. 2........6715. Simulated vs Observed Average Monthly Streamflows at Faka Union Weir No. 2......6816. Double Mass Curve for Streamflows at Faka Union Weir No. 2.................................6917. Simulated vs Observed Average Monthly Stages at Merritt Canal at 55th Ave SE......7118. Correlation Curve for Stages at Merritt Canal at 55th Ave SE....................................7219. Simulated vs Observed Average Annual Stages at Miller Canal at 26 Ave SE.............7320. Simulated vs Observed Average Monthly Stages at Miller Canal at 26th Ave SE........7421. Correlation Curve for Stages at Miller Canal at 26th Ave SE......................................7622. Simulated vs Observed Average Annual Stages at Miller Canal at Weir No. 1.............7723. Simulated vs Observed Average Monthly Stages at Miller Canal at Weir No. 1...........7824. Correlation Curve for Stages at Miller Canal at Weir No. 1.........................................7925. Simulated Monthly Hydrographs for Model Verification at Faka Union Weir No. 1.....9326. Surficial Aquifer Horizontal Movement Vector During Dry Season.............................9527. Conceptual Plan of Alternative 1 - Faka Union Diversion Structure...........................10328. Conceptual Plan of Alternative 2 - Spreader Channel and Canal/Road
Removal Plan.............................................................................................................10429. Schematic of a Typical Spreader Channel...................................................................10630. Cross-Section of Typical Spreader Channel................................................................10831. Typical Earthen Plug..................................................................................................11332. Conceptual Plan of Alternative 3A - Two Spreader Channels, Canal Plugs and
Partial Road Removal.................................................................................................11533. Conceptual Plan of Alternative 3B - Three Spreader Channels, Extensive Canal
Plugs and Partial Road Removal.................................................................................11734. Conceptual Plan of Alternative 3C - Three Spreader Channels, Extensive Canal
Plugs and Partial Road Removal.................................................................................119

vi
35. Area of Rehydration for Alternative 1.........................................................................14136. Runoff Hydrograph at Faka Union Weir No. 1 for Alternative 1.................................14337. Area of Rehydration for Alternative 2.........................................................................14538. Average Monthly Upper Zone Soil Storage (January 1970-December 1975),
Alternative 2...............................................................................................................14739. Average Monthly Upper Zone Soil Storage (January 1976-December 1981),
Alternative 2...............................................................................................................14840. Average Monthly Upper Zone Soil Storage (January 1982-December 1987),
Alternative 2...............................................................................................................14941. Average Monthly Upper Zone Soil Storage (January 1988-December 1992),
Alternative 2...............................................................................................................15042. Average Monthly Lower Zone Soil Storage (January 1970-December 1975),
Alternative 2...............................................................................................................15143. Average Monthly Lower Zone Soil Storage (January 1976-December 1981),
Alternative 2...............................................................................................................15244. Average Monthly Lower Zone Soil Storage (January 1982-December 1987),
Alternative 2...............................................................................................................15345. Average Monthly Lower Zone Soil Storage (January 1988-December 1992),
Alternative 2...............................................................................................................15446. Average Monthly Active Groundwater Storage (January 1970-December 1975),
Alternative 2...............................................................................................................15547. Average Monthly Active Groundwater Storage (January 1976-December 1981),
Alternative 2...............................................................................................................15648. Average Monthly Active Groundwater Storage (January 1982-December 1987),
Alternative 2...............................................................................................................15749. Average Monthly Active Groundwater Storage (January 1988-December 1992),
Alternative 2...............................................................................................................15850. Area of Rehydration for Alternative 3A.......................................................................16051. Runoff Hydrograph at Faka Union No. 1 for Alternative 3A........................................16252. Average Monthly Upper Zone Soil Storage (January 1970-December 1975),
Alternative 3A.............................................................................................................16353. Average Monthly Upper Zone Soil Storage (January 1976-December 1981),
Alternative 3A.............................................................................................................16454. Average Monthly Upper Zone Soil Storage (January 1982-December 1987),
Alternative 3A.............................................................................................................16555. Average Monthly Upper Zone Soil Storage (January 1988-December 1992),
Alternative 3A.............................................................................................................16656. Average Monthly Lower Zone Soil Storage (January 1970-December 1975),
Alternative 3A.............................................................................................................16757. Average Monthly Lower Zone Soil Storage (January 1976-December 1981),
Alternative 3A.............................................................................................................16858. Average Monthly Lower Zone Soil Storage (January 1982-December 1987),
vii
Alternative 3A.............................................................................................................169
59. Average Monthly Lower Zone Soil Storage (January 1988-December 1992),Alternative 3A.............................................................................................................170
60. Average Monthly Active Groundwater Storage (January 1970-December 1975),Alternative 3A.............................................................................................................171
61. Average Monthly Active Groundwater Storage (January 1976-December 1981),Alternative 3A.............................................................................................................172
62. Average Monthly Active Groundwater Storage (January 1982-December 1987),Alternative 3A.............................................................................................................173
63. Average Monthly Active Groundwater Storage (January 1988-December 1992),Alternative 3A.............................................................................................................174
64. Average Hydroperiods for Select Areas for Alternative 3A..........................................17665. Area of Rehydration for Alternative 3B.......................................................................17766. Runoff Hydrograph at Faka Union Weir No. 1 for Alternative 3B................................17967. Average Hydroperiods for Select Areas for Alternative 3B..........................................18068. Area of Rehydration for Alternative 3C.......................................................................18269. Runoff Hydrograph at Faka Union Weir No. 1 for Alternative 3C................................18370. Simulated Existing and Restored Distributed Flows Across U.S. 41.............................18571. Major and Minor Flowways in SGGE..........................................................................19672. Proposed Travel Corridor Through SGGE...................................................................19773. Low Water Crossing....................................................................................................198
viii
LIST OF TABLES
Tables Page
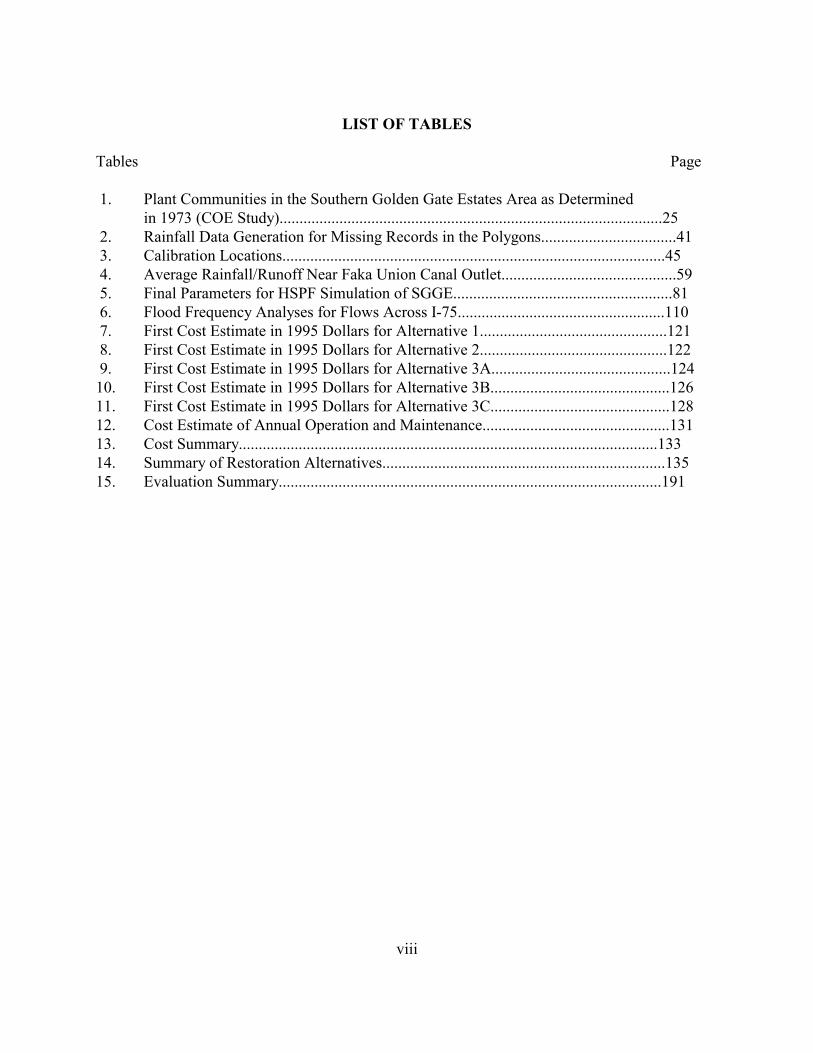
1. Plant Communities in the Southern Golden Gate Estates Area as Determinedin 1973 (COE Study)................................................................................................25
2. Rainfall Data Generation for Missing Records in the Polygons..................................41 3. Calibration Locations................................................................................................45 4. Average Rainfall/Runoff Near Faka Union Canal Outlet............................................59 5. Final Parameters for HSPF Simulation of SGGE.......................................................81 6. Flood Frequency Analyses for Flows Across I-75....................................................110 7. First Cost Estimate in 1995 Dollars for Alternative 1...............................................121 8. First Cost Estimate in 1995 Dollars for Alternative 2...............................................122 9. First Cost Estimate in 1995 Dollars for Alternative 3A.............................................12410. First Cost Estimate in 1995 Dollars for Alternative 3B.............................................12611. First Cost Estimate in 1995 Dollars for Alternative 3C.............................................12812. Cost Estimate of Annual Operation and Maintenance...............................................13113. Cost Summary.........................................................................................................13314. Summary of Restoration Alternatives.......................................................................13515. Evaluation Summary................................................................................................191

ix
ACKNOWLEDGMENTS
The development of this conceptual hydrologic restoration plan for Southern Golden Gate
Estates was initiated under the direction of Michael Slayton, formerly the Basin Administrator of
the Big Cypress Basin, and presently the Deputy Executive Director of the South Florida Water
Management District. Without his constant guidance throughout the study, this planning process
would not have been a reality.
Numerous individuals contributed freely of their time in the plan formulation through their
advice, comments, information and assistance during the tenure of this study. The contributions of
the following individuals and organizations are gratefully acknowledged:
� The Big Cypress Basin Board for their support and guidance throughout the plan
development process.
� Mr. Paul Van Buskirk for his skilled supervision and assistance in seeing this important
project to completion.
� Mr. Mack W. Gardner, Jr. and Ms. Debbie Skelton from the Florida Department of
Community Affairs for assistance in administration of the National Oceanic and Atmospheric
Association grant that contributed significantly to this plan development.
� Ms. Judy Haner and Mr. Mike Delate from the Florida Department of Environmental
Protection for providing assistance with identification of historic flowways and coordinating
efforts with the concurrent watershed restoration plan development for the Rookery Bay

x
National Estuarine Research Reserve.
� Ms. Sonja Durrwachter, Mr. Richard Gorden and Mr. Christopher Anderson from the Florida
Division of Forestry for providing assistance in issues related to forestry management in
formulating the alternatives and reviewing the documents.
� Messrs. Tony Polizos, Larry Banwarf and Howard Yamataki from USDA-NRCS in providing
digital information on soils and reviewing of report.
� Mr. Luis Cadavid from the SFWMD Department of Research and Evaluation and Mr. James
Gross and Mr. Mark Daron from the SFWMD Department of Planning for peer reviewing
the document.
� Dr. Norman Crawford of Hydrocomp Inc. and Mr. Anthony Donigian and Mr. Brian
Bricknell from Aqua Terra, Inc. for providing valuable suggestions during development of
the SGGE model.
� Big Cypress Basin staff members Mr. Warren Howard, Senior Engineering Technician, Mr.
George Guo, Staff Civil Engineer, and Mr. Rao Gadipudi, Summer Intern for assistance in
data collection and modeling efforts.
And finally, the authors would like to gratefully acknowledge Big Cypress Basin staff
member Ms. Joyce Amaral for her skillful competence and long hours of patience including
sacrificing many of her weekends in word processing and editing multiple drafts and final report of
this document.

xi

1
EXECUTIVE SUMMARY
The Southern Golden Gate Estates (SGGE) study area encompasses an approximately 94
square-mile area of sensitive environmental landscape in southwestern Collier County, south of
Interstate 75 (I-75) between the Fakahatchee Strand and Belle Meade watersheds. It is an important
surface storage and aquifer recharge area with a unique ecology of cypress, wet prairie, pine and
hardwood hammock and swamp communities. It also includes three major flowways that contribute
freshwater input to the Ten Thousand Island Estuary. Construction of road and drainage
modifications in the 1960's and 1970's have overdrained the area resulting in reduction of aquifer
storage, increased freshwater shock load discharges to the estuaries, invasion of upland vegetation
and increased frequency of forest fires.
Concern over the gradual degradation of environmental quality and water supply potential
of the region prompted the State of Florida to include the area as a component of the Save Our
Everglades (SOE) program in 1985. Subsequently, the project was included in the State's
Conservation and Recreation Lands (CARL) Acquisition program initiative for acquiring the entire
project area under public ownership. In 1992 the Governor of Florida requested the South Florida
Water Management District (SFWMD) to develop a conceptual hydrologic restoration plan for the
SGGE to enhance the environmental value and water resources of the region. This study was
initiated at this request to develop a detailed hydrologic restoration plan with the primary objectives
of reducing overdrainage and restoring historic sheetflow patterns while maintaining the existing
levels of flood protection for areas north of the project.
The Faka Union Canal Watershed that includes the SGGE and part of the Northern Golden

2
Gate Estates (NGGE), drains an approximately 189 square-mile area through a network of 70 miles
of four primary canals namely, the Miller, Faka Union, Merritt and Prairie Canals. The water levels
in these canals are controlled by 12 water control structures. The topography is characterized by low
relief and poorly defined drainage patterns with ground elevations ranging from 24 feet NGVD in
the headwaters to 2 feet NGVD near the outlet of the basin. Presently approximately 185,000 acre-
feet of freshwater is discharged annually from the Faka Union Canal to the Faka Union Bay estuary
as point source flow.
A continuous process hydrologic-hydraulic simulation model of the watershed was
developed using the United States Environmental Protection Agency's (EPA) watershed modeling
program Hydrologic Simulation Program-Fortran (HSPF) to quantify the rainfall-runoff patterns and
soil storage components of the watershed. The model was calibrated at six locations in the basin.
The watershed characteristics were simulated for a continuous 23-year period at a daily time step
under existing and restoration plan development conditions.
Assessment of the simulated existing condition of the watershed indicates that the canals
largely control the overall hydrology of the watershed discharging approximately 18 inches of runoff
annually to the Faka Union Bay. The canals also intercept shallow groundwater outflow, and have
continually lowered the water table. The generalized surficial groundwater flow directions vary
seasonally. During the wet season when the groundwater levels are high, the flow patterns into the
Faka Union Canal are in a south to southwesterly direction. As the dry season progresses, the
groundwater movement shifts to an east-west direction, draining directly into one of the north-south
canals. Construction of the canals has not only increased surface runoff, but has also increased the

3
rate of groundwater outflow, causing seasonal groundwater outflow peaks that were not present
before the canals were excavated.
Five alternative configurations of structural measures were developed and their performances
at meeting the objectives of the project were evaluated by the simulation model. The alternative
measures evaluated ranged from partial/incremental restoration to full scale approach with spreader
channels, swale and road removal, placement of canal blocks, and flood control pumpage from areas
north of I-75. Alternative 3C with structural components of 2.4 miles of spreader channels, 83 canal
plugs in four canals, partial removal and leveling of 130 miles of road and tramways, and installation
of three pump stations with a total capacity of 890 Horsepower and combined discharge capacity of
860 cfs, emergency backup generators and two portable pumps was found to be the optimum
configuration of the recommended plan to achieve the desired objectives of the project. In addition
to implementing the structural/nonstructural elements of Alternative 3C, other recommendations
include: maintenance of a travel corridor through the project area connecting Everglades Boulevard
and Jane’s Scenic Drive along the Faka Union Canal for fire management by the Division of Forestry
and for recreational public access; collection of additional streamflow data on the Miller, Faka Union
and Merritt Canals at I-75; continuation and enhancement of the existing groundwater monitoring
program in SGGE; determination of quantitative and qualitative success criteria for the project;
maintenance of optimal stages in the flowways; implementation of the restoration with an
interdisciplinary approach; use of a gradual and phased strategy for restoration implementation; and
inclusion of the impacted areas outside of the project area into a CARL project boundary, either the
Belle Meade or Save Our Everglades boundary. The estimated first cost of implementing the plan

4
is $11,652,769 in 1995 dollars. A breakdown of the costs of the specific elements of the plan is
shown below.

5
PLAN C COSTS
A. Spreader Channels ......................$ 1,092,371B. Canal Plugs................................ 3,594,454C. Road and Tram Removal............. 3,365,778D. Pump Stations............................. 2,060,240E. Other Site Work.......................... 20,000F. Contingency................................ 1,519,926
Total $11,652,769
Part of the funding for the initial cost of the project may be absorbed by the in-kind services of the
Florida Division of Forestry (FDOF) who currently manages the public lands within SGGE. Using
FDOF’s staff and equipment for the road and tram removal would reduce the first cost by
$3,365,778. Stockpiling the fill at the plug locations would eliminate hauling costs and reduce the
cost further by $905,700. The funding required for the remainder of the project is $7,381,291.
The implementation of this plan would result in restoration of the hydrology of 113 square
miles, including parts of Fakahatchee Strand, to near pre-development (pre-1960's) conditions. The
increased water storage (surface and groundwater) would cause increased evaporation and recharge,
which would result in an overall reduction of six inches of annual runoff basin wide. Freshwater
point flow discharges of the Faka Union Canal will be reduced from an annual average of 260 cfs
to 2 cfs and will be replaced by distributed runoff along a six-mile wide front through U.S. 41
bridges. Average annual groundwater levels will be one foot higher over existing conditions and will
provide for additional groundwater storage amounting to 25 billion gallons. Hydroperiod criteria
for the upland vegetation would not be exceeded.

6
A small area, approximately 1.1 square miles, of privately owned land in eastern Belle
Meade, not currently within the Belle Meade CARL project boundary, intercepts a prominent and
well-defined flowway that would be rehydrated with the implementation of this plan. From a water
management perspective, the optimal solution will be to include this area within the Belle Meade
or Save Our Everglades CARL project boundary so that the restoration of SGGE can be
implemented.
After nearly two decades of efforts by numerous organizations and individuals to devise a
hydrologic restoration plan for SGGE, land acquisition is underway to implement the restoration
measures for protecting the future water supplies and environmental resources of the region.
Acquisition of the entire project land under public ownership is the key element of the SGGE
restoration plan. It is further recommended that the State of Florida’s ongoing CARL acquisition
efforts be accelerated, and the Big Cypress Basin Board continue its support for funding the Florida
Department of Environmental Protection (FDEP) land acquisition personnel services so that
implementation of the hydrologic restoration efforts can be commenced in the very near future.

7
1. INTRODUCTION
1-1. PROJECT BACKGROUND
The SGGE portion of the Save Our Everglades CARL project encompasses an area of
approximately 94 square miles located in southwestern Collier County, south of I-75 (see Figure 1).
It is an important area for future surface storage and aquifer recharge which serves as the headwaters
of the central portion of the Ten Thousand Islands Estuary, part of the western Everglades.
Construction of road and drainage modifications in the 1960's and 1970's have overdrained the area,
allowing invasion of upland vegetation, wildfires, reduced aquifer storage, increased threat of salt
water intrusion and frequent freshwater shock loads to the estuary.
The project area was identified in 1985 as a component of the Governor of Florida's Save
Our Everglades program. Various studies have been conducted in the past to assess the feasibility
of modifying the existing water control works to reduce and reverse the environmental and water
resource impacts created by past overdrainage activities. The most recent of these is the U.S. Army
Corps of Engineers (COE) Feasibility study, completed in May 1986, in which the COE performed
a preliminary analysis of three conceptual plans. The COE study concluded that there is no basis for
Federal involvement in modifications of the existing water control system and that the report
provides conceptual information which could be used by State and local interests in determining long
term solutions to local water management and related resource management problems in the basin.
Subsequent to the COE study a "Committee on the Restoration of Golden Gate Estates”
(CRGGE) was established in 1987 by the Kissimmee River-Lake Okeechobee-Everglades
Coordinating Council to keep the restoration of SGGE on the agenda of the State's important

8
environmental projects. The committee recommended accelerated acquisition of the lands of SGGE

9

10

11
Figure 1. The Study Area
in the State's CARL acquisition program. Under the auspices of the CARL program initiative, the
Florida Department of Environmental Protection (formerly Florida Department of Natural
Resources) is purchasing land in the project area for conservation and restoration. As of September
30, 1995, 16,697 acres of land in 6,737 parcels have been acquired by the State. The CRGGE also
recommended further evaluation of the COE plan to develop an implementable physical restoration
program. In 1992 Governor Chiles requested that the District develop a conceptual hydrologic
restoration plan.
This project will provide a working plan to accomplish these objectives for the entire SGGE

12
area. In particular, restoration alternative plans will be based on a continuous process, long term
simulation of the hydrologic-hydraulic features of the watershed that had not been represented in
earlier studies.
1-2. HISTORICAL DEVELOPMENT OF GOLDEN GATE ESTATES
The Faka Union Canal system was excavated by the Gulf American Corporation (GAC) as
part of a real estate development project called Golden Gate Estates (GGE). The extensive canal and
roadway system was designed to allow year-round occupation of land that was once seasonally
flooded for several months each year (COE study, 1986). Construction of the southern canal system
was begun in 1968 and completed by mid 1971. Since that time, the ecological balance that existed
for hundreds of years has been severely altered and in some places the existing landscape does not
resemble the historic conditions at all. Construction of the canals has led to both increased volumes
and rates of runoff from the watershed which has had lasting effects on the area's water supply,
vegetation, wildlife, and coastal estuaries.
The canals intercept large volumes of surface and subsurface flow and quickly divert them
to the Faka Union Bay and the Ten Thousand Island Estuary of the Gulf of Mexico resulting in less
surface water available for storage. Since groundwater recharge is achieved primarily through
infiltration from surface detention storage, reduced groundwater recharge threatens both groundwater
supply for the region and the natural barrier to salt water intrusion. Continued overdrainage has
caused an eventual lowering of the groundwater table. This has caused vegetation to change from
wetland dominant to transitional and upland systems with invasive exotic species. The extreme dry
conditions caused by overdrainage have resulted in more frequent and more intense wildfires with

13
a greater destructive impact on vegetation.
The increased runoff rate has had severe effects on the receiving estuaries. Historically, the
estuaries would receive broad, slow moving sheets of water that were capable of carrying essential
nutrients but not high sediment loads. This has been replaced with point loads of freshwater at the
Faka Union Canal outlet that push salinity levels down and result in freshwater discharge shocks
throughout the Ten Thousand Island Estuary. The increased runoff rate drains the area quickly and
does not allow the hydroperiods necessary to sustain wetland vegetation. A study by Carter et al.,
1973, indicated that approximately a one-foot drop in the water table reduces cypress productivity
by 40 percent.
1-3. PRIOR STUDIES AND REPORTS
A number of studies have been conducted over the past 20 years regarding the Golden Gate
Estates Development and canal network. These studies have been reviewed and were referred to
periodically as the project progressed for hydrological, biological and ecological information of the
study area. All of these studies assumed some limited development in SGGE. The studies and their
summaries are described below.
One of the first studies conducted was "A Hydrologic Study of the GAC Canal Network"
(1974) by Black, Crow and Eidsness, Inc. for the Board of Collier County Commissioners. This
study pointed out hydraulic deficiencies with the GAC canal network including how it has altered
surface flow patterns and yet is unable to convey even a 10-year flood. The study recommended
improvements in the system with ways to lessen the environmental impacts of the canals but did not
address wetland restoration issues to predevelopment conditions. The study did provide valuable
14
information regarding the hydrology of the GGE and hydraulics of the canals.
Because most of GGE is owned privately, any significant change in its land use or hydrology
would affect privately owned land. To address this legal issue the Golden Gate Estates Study
Committee (GGESC), appointed by the Board of County Commissioners in 1975, hired Mr. Frank
E. Maloney, Dean Emeritus and Professor of Law of the University of Florida to examine the legal
issues associated with altering the water management system in GGE. In his "Report On Water
Resources Problems of Western Collier County," (1975) Mr. Maloney concluded that
“There is sufficient legal authority available either at the County, Water
Management District, State or Federal levels to make it possible to stabilize
water run-off in the Golden Gate Estates area and to control, reduce or
hopefully eliminate the substantial waste of fresh water resources of Collier
County, while at the same time reducing or eliminating the effects of salt water
intrusion which have resulted from the unnecessary lowering of ground water
elevations. Such stabilization would also result in reducing the siltation effects
of the pulse discharges of large quantities of water from the GAC Canals.”
Based on Mr. Maloney’s legal opinion, the GGESC proceeded with developing a restoration
plan for SGGE. The GGESC released the "Golden Gate Estates Redevelopment Study" (1977)
which is essentially made up of Dean Maloney's first report and one other. The second report called
"An Ecological and Hydrological Assessment of the Golden Gate Estates Drainage Basin, with
Recommendations for Future Land Use and Water Management Strategies," was written by Tropical
BioIndustries, and contains geographical, hydrological and biological information regarding the

15
study area, some of which had been supplemented by more recent information. This study
recommended a land use strategy for creating flowways that resemble the historic flow pattern and
creating conservation areas (mostly in the southern portion of GGE) where urban development would
not be allowed. This plan was further evaluated by the COE.
It was soon realized by the GGESC that a proper permanent solution may take many years
to implement because it would affect thousands of parcels of privately owned land and the major
changes to the roads and canals would be very costly. An interim plan was developed by consulting
engineers CH2M Hill called "Proposed Interim Modifications, Golden Gate Estates Canal System"
(1978) for the Board of County Commissioners. This plan called for raising the crest elevations of
several weirs by flashboards that would allow maintenance of canal water elevations at any desired
level between existing elevations and ground level. It also recommended installing four earthen
plugs to separate the Golden Gate Canal drainage basin from the Faka Union Canal drainage basin
and thereby reduce runoff into the Naples Bay. The plugs would also reduce runoff into Faka Union
Bay by diverting runoff to neighboring Fakahatchee Strand. All of the weir modifications outlined
in the plan except the earthen plugs have been implemented. The potential legal issues of this plan
were addressed in a report called "Legal Ramifications of Implementation of the Interim Action
Program in Golden Gate Estates, Collier County, Florida" (1979) by Dean Frank Maloney.
"Canal Discharge Impacts of Faka Union Bay" by John Wang and Joan Browder evaluated
the effects of the canal discharge on the Faka Union Bay's salinity using data analysis and numerical
modeling. They concluded that the three inputs to the Bay (groundwater seepage, canal discharge
and rainfall) have a high interrelation and depending on the location in the Bay, all three may be

16
significant factors for determining salinities. They also concluded that groundwater levels may better
represent actual discharge rates than the recorded canal discharges.
In the report "Impacts of Surface Drainage on Groundwater Hydraulics" (Flora C. Wang,
Allen R. Overman, 1981), the authors quantified the difference of surface and subsurface runoff
before and after the construction of the canals. They concluded the canals have increased surface
runoff by approximately 50 percent and caused a drawdown of the water table of approximately two
feet at a distance of one mile from the canal.
In a report called "Impacts of Drainage Canals on Surface and Subsurface Hydrology of
Adjacent Areas in South Florida" (1977), Flora C. Wang used a water balance model to show
monthly balances of precipitation, evapotranspiration, soil moisture and runoff. The report
quantified the effects of the canal systems on the shallow aquifer and summarized this in a table
showing estimated water table drawdown and its corresponding distance away from the canal.
A report by Environmental Science and Engineering, Inc. called "Golden Gate Estates
Groundwater and Septic Tank Investigation" (1979) summarized the results from soil and water
quality samples withdrawn from 130 sites in Golden Gate Estates. This report contains a map of the
major lithologic unit profiles in the study area.
"A Report on Acceptance and Flooding Golden Gate Estates" (1977) by Stanley W. Hole and
Associates identified several roads and canals to be accepted by Collier County and various canals
were inspected and a general assessment of the flood conditions within the Estates were provided.
This report provided some short term (1-2 months) data observations.
Engineering consultants Connell, Metcalf & Eddy published a report called "A Hydraulic

17
Study of the South Golden Gate Estates Canal Network, Collier County, FL" (1978). This
hydrologic and hydraulic study used the Soil Conservation Service (SCS) method of determining
runoff for the lower portion of the Estates and an event-based model (10-year, 5-day storm event).
This report provides some information regarding soil type in the study area, however, more detailed
soil information is currently available.
The most recent report, done by the COE called "Golden Gate Estates Feasibility Report"
(1986), evaluated three alternatives for modifying the canal network. This report was used as a
primary reference in the present study and the third restoration alternative presented in the report,
which originated from the GGESC, was used as a primary reference for developing alternative
restoration scenarios. The COE Feasibility Report used an event-based model to predict flood
hydrographs and the extent of floodplains. The report from the COE was preceded by a
Reconnaissance Report in 1980.
Another study used as data source includes "The Big Cypress National Preserve" (Michael
J. Duever et al., 1986) which provides valuable information about the regional wetland ecosystems
and, in particular, hydroperiod regimes of wetlands.
1-4. INTERAGENCY COORDINATION
This study has been conducted primarily by the Big Cypress Basin of the South Florida
Water Management District. Active participation by numerous public agencies, private groups and
non-profit environmental organizations provided valuable assistance throughout the development
of this restoration plan. The project was instituted under the directive of the Governor’s office as
a part of the Save Our Everglades Program initiative. The Florida Department of Community Affairs

18
(DCA) in cooperation with the U. S. Department of Commerce, National Oceanic and Atmospheric
Administration (NOAA) provided partial funding for the project through a grant under the auspices
of the Florida Coastal Zone Management Program.
The FDEP conducted a parallel study for development of a watershed management plan for
the Rookery Bay National Estuarine Research Reserve and the Ten Thousand Islands Aquatic
Preserve. Efforts of that study were continuously coordinated with this project, particularly in
identification of historic flowways and for development of structural alternatives. The Collier
County Stormwater Management Department which operated the canals and water control structures
in the SGGE area before those were adopted by the Big Cypress Basin, contributed significantly by
providing data on water levels and operation logs of the water control structures for the earlier
periods. Considerable efforts were also coordinated with the State Park Service personnel of the
Fakahatchee Strand State Preserve. The preserve is the closest neighbor of the SGGE project area,
and hydrologic restoration of SGGE would prove beneficial to the overall management of the flora
and fauna of the preserve.
The Florida Division of Forestry (FDOF) provided sufficient input in identifying the
restoration measures specific to the management of recreational forestry in the SGGE area.
Considerable support in all phases of the project development were also received from various
departments of the SFWMD.

19
2. PROBLEM IDENTIFICATION
2-1. PLANNING ISSUES
The rapid growth of southwest Florida and Collier County in particular, during the past two
decades with increased population and accompanying urban development has stimulated significant
concerns regarding the water and environmental resources of the region. A myriad of issues relating
to water supply, flood protection, water quality and natural ecosystems have emerged from poorly
planned urban developments in sensitive environmental settings like SGGE. The documented
evidences that several hundred miles of bulldozed limerock roads and dredged canals have adversely
impacted five major hardwood strands, two primary freshwater aquifers, three major hydrologic
flowways and numerous habitats speak of the problems brought forth by the development of SGGE.
A summary of the issues pertinent to water supply, natural ecosystems, flood control, and water
quality specific to this project is presented below.
2-1.1 Water Supply
The major freshwater aquifers underlying the SGGE region are the Water Table, Lower
Tamiami and Sandstone Aquifers. The Water Table and Lower Tamiami Aquifers are the primary
sources of water supply and occur within the Surficial Aquifer system. The Sandstone Aquifer, a
part of the intermediate aquifer system is separated from the surficial system by low permeability
sediments, and is only present on the northern part of the watershed. The primary sources of
recharge to the surficial aquifer system is rainfall. Downward movement of water through the leaky
confining beds underlying the water table recharges the Lower Tamiami Aquifer. Since most of the
SGGE canals are located in areas where the limestone of the shallow aquifer is within ten feet of the

20
land surface, there is a direct hydraulic connection between the canal system and the upper portions
of the Surficial Aquifer. Thus, rapid rate of runoff provided by the canals is a prime cause of
depletion of groundwater storage. The overdrainage by canals have caused general drawdown of
approximately two feet, at a distance of one mile from the canals in the Faka Union Canal watershed
(Wang and Overman, 1981).
The City of Naples Eastern Golden Gate Wellfield is located along the Faka Union Canal
between weirs Faka Union No. 4 and Faka Union No. 5. With a maximum daily allocation of 21.0
million gallons per day, this wellfield provides the lion’s share of the potable water for the City and
its unincorporated service area. Recharge from the canal does influence the yield of the wellfield.
Protection of the long term sustained yield of this wellfield is one of the primary water supply
related issues for the restoration of SGGE.
2-1.2 Flood Control
Continued maintenance, and possibly enhancement of the existing level of service for flood
control provided by the Golden Gate and Faka Union Canal system is of prime concern to the
residents of GGE. In spite of a very aggressive canal maintenance program undertaken by the Big
Cypress Basin, the rapid urban growth and subsequent encroachment into the low-lying natural
storage areas have resulted in occasional flooding in historic lowlands in some locations in NGGE.
The desired stormwater management level of service identified for the Estates area by Collier
County is protection against a 10-year recurrence interval flood, while for the urban corridor (areas
west of a line one mile east of CR 951) is for a 25-year flood.
This plan addresses the concerns that hydrologic restoration of SGGE involving
21
modification of the existing canals and water control structures may imperil flood control of the
rapidly urbanizing NGGE area. This SGGE restoration plan incorporates appropriate means of
maintaining, and where practical, enhancing the flood control functions of the NGGE.
2-1.3 Natural Ecosystems Management
A unique combination of ecosystem dominates the landscape of SGGE with a vast extent of
wet prairies, pine and cabbage palm flatwoods, hardwood hammocks and tidal marshes. The
sloughs, strands and wet prairies carry the freshwater surface flow to the Ten Thousand Island
Estuaries, one of the largest mangrove systems in Florida. As explained elsewhere in this report, the
large scale development of SGGE has played an effective role in overdraining the pristine forested
and emergent wetlands, and degraded the productivity of the wetland system due to shortened
hydroperiods. In addition, invasion of exotic plants like melaleuca and Brazilian pepper is beginning
to pose problems to the native ecosystem and habitat. Since the hydrology of an area is the basis for
structuring the type of plant and animal community that will exist, changes to the hydrology can
cause a reorganization of the plant and animal community structure. For SGGE, the protection and
management of the sensitive environmental resources is to be achieved by public acquisition and
restoration of the affected lands as outlined in numerous plans proposed over a two-decade period.
Statutory changes to the Areas of Critical State Concern Program in 1993 proposed designating
certain areas of Collier County as the Big Cypress Areas of Critical State Concern, and
recommended: “The acquisition of Save Our Everglades CARL projects needs to be completed.
The SFWMD’s Big Cypress Basin Board should continue to provide funding to FDEP for staff
dedicated to the acquisition of the Southern Golden Gate Estates portion of the Save Our Everglades

22
project. The Land Selection Advisory Council should elevate the priority rankings of these projects
to demonstrate the importance of these projects to the protection of the natural resources within the
Big Cypress Area of Critical State Concern. The Board of Trustees should support the FDEP in
using eminent domain to acquire these two CARL projects if voluntary negotiations are not
successful.” (District Water Management Plan; South Florida Water Management District, 1995)
2-1.4 Water Quality
Good quality of water is essential to all forms of life. In so far as the physical and chemical
conditions of surface waters in the Class III freshwater bodies (recreation, fish and wildlife
propagation) of the SGGE area are concerned, they generally meet the acceptable state standards.
The quality of groundwater is also within the FDEP’s drinking water standard for potable supply.
However, at issues are the quality and routing of the receiving waters of the Faka Union Bay and
the Ten Thousand Islands, where enormous volumes of freshwater outflow from the Faka Union
Canal System create abnormal salinity levels throughout the year.
The discharge from the Faka Union Canal varies seasonally with a large amplitude. This
results in large fluctuations in the salinity levels and current patterns with enormous shocks to the
aquatic biota of the Faka Union Bay, and often, too little freshwater input to the surrounding saline
areas. The rapid decline in the salinity to near freshwater conditions have caused prolonged salinity
stresses and has eliminated or displaced a high proportion of the benthic, midwater and fish plankton
communities from the Bay. Such suppressed plankton development have resulted in very low
relative abundance of midwater fish and also considerable drop in shellfish harvest levels. Seagrass
meadows are no longer a prevalent habitat type in the Bay. Instead, bare sandy mud and algal areas

23
predominate. The impact on commercial and recreational fisheries have been very significant.
2-2. PROJECT GOALS AND OBJECTIVES
The present study is instituted to develop a detailed hydrologic restoration plan of SGGE that
would achieve the following objectives:
a. Wetland hydroperiod restoration (pre-Golden Gate Estates development)
b. Surface water sheetflow restoration
c. Replacement of concentrated shock load discharges to estuaries with distributed
sheetflow
d. Improved water supply storage and aquifer recharge
e. Enhanced surface water deliveries to the adjacent Fakahatchee Strand State Preserve
f. Reduction of overdrainage of Fakahatchee Strand
g. Reduction of overdrainage of the adjacent Florida Panther National Wildlife Refuge
h. Maintenance of existing flood protection for areas north of I-75
2-3. SUMMARY OF EXISTING CONDITIONS
2-3.1 Meteorology
Typical of humid subtropical regions, the SGGE area undergoes about a 7-month dry season
and a 5-month wet season. The average annual temperature is about 75 degrees, with record
extremes ranging from 105 degrees in summer to 25 degrees in winter. Annual rainfall averages for
nearby Naples average 53 inches and within Collier County annual rainfall has varied from a low
of 30 inches to a high of 105 inches. During the wet season (May through October), nearly 80
percent of the annual rainfall occurs. Much of the rainfall is returned to the atmosphere by

24
evaporation from soil and free water surfaces, and transpiration through plants. Under natural
conditions the combined process of evapotranspiration accounts for an approximate loss of 45 inches
of water per year. Thus only about eight inches of average annual precipitation is available for
surface runoff and groundwater recharge.
2-3.2 Surface Water Hydrology
The Faka Union Canal watershed, including SGGE and part of NGGE, historically
encompassed an area of approximately 234 square miles (Black, Crow, and Eidsness, Inc. study,
1974). However, the extent of the historic drainage area has been reduced due to construction of
roads, canals and urban and agricultural development. The existing Faka Union Canal watershed
is approximately 189 square miles containing approximately 70 miles of canals with 12 weir
structures, and the majority of the watershed includes a grid-like system of roads spaced every
quarter mile. The topography of the basin is characterized by low relief and poorly defined drainage
patterns. Elevations range from 24 feet NGVD in the extreme north end with a gradual slope in the
central and southern part to elevations of 2 feet NGVD near the outlet of the basin some 28 miles
to the south. Over the basin, the water flows in a general southwest direction.
Historically, the general water movement can be characterized by slow, overland sheetflow
a few inches to a few feet deep and several miles wide. Much of the drainage is concentrated in
slightly lower sloughs and strands. Figure 2 shows the location of the existing Faka Union Canal
watershed and the approximate location of the surface drainage divide prior to the construction of
the Golden Gate Estates canal system. Since the construction of the canals, the surface flow patterns

25
have been changed and the roads and canals largely control the subbasin boundaries.
Prior to development, the Faka Union Canal watershed was characterized by flat, swamp
lands containing cypress trees, islands of pine forests, and wet and dry prairie. Much of the area was
regularly inundated by several feet of water during the wet season (COE study, 1986). During the
wet season, overland runoff would be stored in depressional areas and the peak flows would be
attenuated and a longer hydroperiod would be maintained well into the dry season.
26

27
The storage within these wetlands is a part of the hydrology of the watershed. Subsurface
flow, groundwater recharge and evapotranspiration are major components in the hydrologic cycle.
As the wet season ends and throughout the dry season, water stored in depressions is slowly depleted
as it recharges the shallow Water Table Aquifer and is used by vegetation in the evapotranspiration
process. This reduces the amount of surface runoff. It has been estimated that, of the 50+ inches
of rain received in western Collier County, historical natural runoff is on the order of 0 to 10 inches
annually (Runoff in Florida, 1966). The Black, Crow, and Eidsness study estimated that, after
construction of the canals, annual runoff for the Faka Union watershed has increased to about 17
inches.
2-3.3 Groundwater
The groundwater in western Collier County is composed of three major aquifer systems,
namely the Surficial Aquifer system, the Intermediate Aquifer system and the Floridan Aquifer
system. The Surficial Aquifer system, which is the most important in terms of public water supply,
contains the Water Table Aquifer and the Lower Tamiami Aquifer. The Intermediate Aquifer
system, whose primary aquifers are the Sandstone and the Mid-Hawthorn, is not extensively used.
The Floridan Aquifer system, consisting of the Lower Hawthorn and Suwannee formations, is yet
to be explored for adequate hydrogeologic evaluation. In Collier County, the Water Table Aquifer
is generally flat and follows the topography of the land, however local water table flow patterns are
influenced by water levels within the drainage canals (COE study, 1986).
Since the Water Table Aquifer is open to the land surface, it responds very quickly to
changes in monthly rainfall, and direct infiltration from rainfall is the main source of recharge. Other

28
sources of recharge are inflow from surface water bodies, such as canals, subsurface flow from
adjacent areas and upward seepage from semi-confined aquifers. Generally, recharge from the lakes
and canals is minimal; however, this recharge does occur after rainfall events when the canal levels
immediately upstream from the weirs are higher than adjacent groundwater levels (COE study,
1986).
2-3.4 Soils
Most of the soils in SGGE are characterized as moderately well to poorly drained and are
often subject to prolonged flooding. Vegetation is shaped by soil type, topography, water or
hydroperiod, fire and geology. Because of the strong correlation between soil type and vegetation,
observation of soil types in SGGE provides information about predevelopment natural flowways and
land cover. Duever et al. (The Big Cypress National Preserve, 1986) classified four major soil
groups (rock, sand, marl and organics) in the Big Cypress National Preserve. These major soil
groups are also found in the SGGE area.
Major lithologic units in Golden Gate Estates were also identified in a report called "Golden
Gate Estates Groundwater and Septic Tank Investigation" (1979), and also in subsequent
groundwater investigations performed by the South Florida Water Management District.
Observations from 130 well sites showed major soils of sand, clay, marl, weathered rock, shell beds,
soft sandy limestone and dense, hard limestone. Generally, it was shown that the SGGE area
consists of a top layer 0-15 feet thick of sand, clay, marl and weathered rock over a layer of moderate
to low permeable soft, sandy limestone and marl 20-50 feet thick over a moderately permeable
limestone layer.

29
Detailed soils map available from recent USDA-SCS soil surveys identifies the entire range
of hydric and non-hydric soils and are used in the present study.

30
2-3.5 Land Use
A large portion of the Faka Union Canal watershed is part of GGE and is zoned for single-
family residential land use. Some previously farmed areas in the northern part of the watershed are
now zoned residential and commercial. The residential zoning is low density with minimum lot size
of 2-1/4 acres. The remaining area is used for agriculture, predominately truck farming, except in
areas of persistent flooding. The most populated areas are north of State Route 84 or Alligator Alley
(I-75) especially near Golden Gate Boulevard. Telephone and electric services are not available in
most areas south of Alligator Alley and the area remains generally undeveloped. A small urban area
exists at the extreme southern end of the area called Port of the Islands.
Land use maps were obtained from both the SFWMD and Collier County. Land cover
complex designations north of Alligator Alley were generally accurate; however, south of Alligator
Alley they did not adequately reflect the current uses of the land. Using a combination of soil maps,
satellite land photos and field surveys, land uses were determined for this portion of the watershed.
2-3.6 Wetlands
A large portion of SGGE historically was dominated by wetland vegetation species such as
cypress. Vegetation maps are available in the reports by Tropical BioIndustries and in the COE
Feasibility report. These maps are very useful but may not represent current conditions due to the
succession of plant communities created by overdrainage.
Table 1 (COE, 1986) shows the dominant plant communities in the SGGE area as determined in
1973. The majority of the land cover in SGGE is identified as wetlands. The loss of sufficient
hydroperiods necessary to sustain wetland vegetation has caused a severe alteration of the historical

31
plant species composition from that of wetland to upland or invasive exotics. As wetlands are
TABLE 1
PLANT COMMUNITIES IN THE SOUTHERN GOLDEN GATE ESTATES AREAAS DETERMINED IN 1973 (COE STUDY)
Community Acres Percent of Total
Cypress Forest 42,020 45Uplands 14,180 15Mixed Swamp Forest 13,060 14Cypress-Pine Forest 9,841 11Dry Prairie 7,333 8Wet Prairie 2,455 3Dwarf Cypress Forest 873 1Pine Prairie 851 1Pine Forest 822 1Canals 658 1Melaleuca and/orBrazilian Pepper* 387 <1Estuarine** 210 <1
* This had the National Wetlands Inventory classification of palustrine, scrub/shrub, broad-leaved evergreen (PSS3). Typical species are Melaleuca, wax myrtle, sandweed(Hypericum). These evergreen shrub swamps may result from burning cypress swamps. This specific identification was not reported by Tabb and has not been ground-truthed.
** North of U.S. Highway 41 only.
drained, the organic soils that support wetland vegetation growth can be destroyed by fire, oxidation,
shrinkage and compaction. In addition, the processes responsible for the formation of these soils

32
cannot take place during a shortened hydroperiod (The Restoration of Golden Gate Estates, 1992).
The long inundation characteristic of cypress forests protects it from fire but once drained, the forests
are burned more frequently. This can cause slower growth rates and hinder regeneration. Cypress
forests cannot survive or develop in areas with frequent fires (The Restoration of Golden Gate
Estates, 1992). Slash pines are more resistant to fire and even require fire to prevent natural
succession to a hardwood hammock. Saw palmettos are extremely fire resistant. The more frequent
and intense fires in SGGE have resulted in a large part of the previously dominant cypress forest to
be invaded by pine and palmettos, and later by exotic species like Brazilian peppers.
The shortened hydroperiod of wet prairies "has resulted in an inhibited growth of periphytic
algae, which sustain the small forage fish. Additionally, there is no standing water for these fish,”
(The Restoration of Golden Gate Estates, 1992). Larger animals, particularly wading birds, cannot
survive without this food source.
An extensive roadway system in SGGE has resulted in a loss of canopy that has affected
understory vegetation, air flows and temperature. Many species, including some endangered orchids
and bromeliads, require exact temperature and/or humidity conditions.
2-3.7 Canals and Structures
The Faka Union Canal system is made up of four major canals (Miller, Faka Union, Merritt
and Prairie) and extends north from the estuaries of the Ten Thousand Islands nearly to County Road
846, a distance of some 28 miles. The canals are trapezoidal in shape and have an average excavated
depth of approximately 10 feet from top of bank to bottom of channel with surface widths ranging
from 45 to over 200 feet. Cross-section information of the canals is limited because only design
33
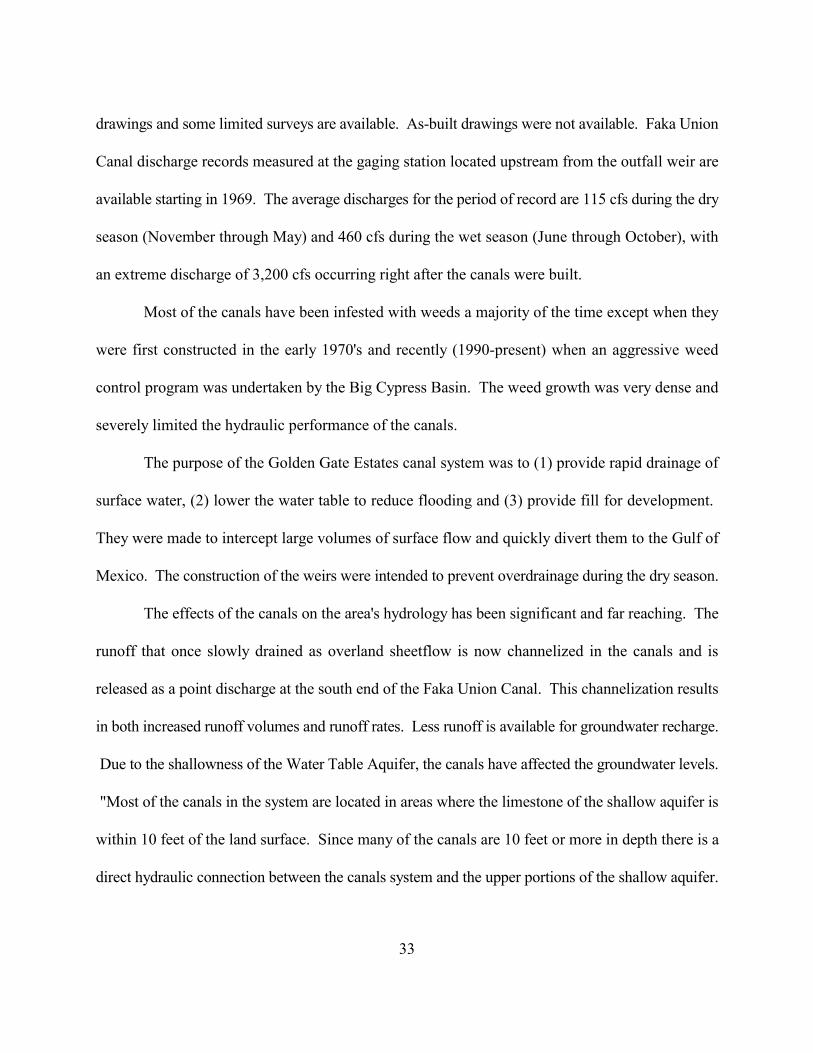
drawings and some limited surveys are available. As-built drawings were not available. Faka Union
Canal discharge records measured at the gaging station located upstream from the outfall weir are
available starting in 1969. The average discharges for the period of record are 115 cfs during the dry
season (November through May) and 460 cfs during the wet season (June through October), with
an extreme discharge of 3,200 cfs occurring right after the canals were built.
Most of the canals have been infested with weeds a majority of the time except when they
were first constructed in the early 1970's and recently (1990-present) when an aggressive weed
control program was undertaken by the Big Cypress Basin. The weed growth was very dense and
severely limited the hydraulic performance of the canals.
The purpose of the Golden Gate Estates canal system was to (1) provide rapid drainage of
surface water, (2) lower the water table to reduce flooding and (3) provide fill for development.
They were made to intercept large volumes of surface flow and quickly divert them to the Gulf of
Mexico. The construction of the weirs were intended to prevent overdrainage during the dry season.
The effects of the canals on the area's hydrology has been significant and far reaching. The
runoff that once slowly drained as overland sheetflow is now channelized in the canals and is
released as a point discharge at the south end of the Faka Union Canal. This channelization results
in both increased runoff volumes and runoff rates. Less runoff is available for groundwater recharge.
Due to the shallowness of the Water Table Aquifer, the canals have affected the groundwater levels.
"Most of the canals in the system are located in areas where the limestone of the shallow aquifer is
within 10 feet of the land surface. Since many of the canals are 10 feet or more in depth there is a
direct hydraulic connection between the canals system and the upper portions of the shallow aquifer.

34
Undoubtedly, construction of the GAC canal network has resulted in some drainage of the shallow
aquifer, which has caused a general lowering of the groundwater table during the dry season."
(Black, Crow and Eidsness, Inc. study, 1974). One study (Wang, 1978) concluded the water table
was lowered one and a half to two feet after the construction of the canals. A field investigation
(Swayze and McPherson, 1977) showed a drop in the water table of approximately two feet at a
distance of 6,000 feet from the canal.

35
3. PROBLEM ANALYSIS
3-1. STUDY DESIGN FOR PROJECT
3-1.1 Hydrologic and Hydraulic Modeling Criteria
Prior to the selection of a hydrologic-hydraulic simulation modeling tool for use in the
development of the restoration plan for SGGE, a set of criteria was developed to judge the
applicability of an available simulation program. It was decided that the ideal modeling program
should have the following capabilities or features.
1. Be able to continuously simulate the hydrologic-hydraulic behavior of the canal-
aquifer system for a considerably long period.
2. Be able to accurately incorporate the hydrologic-hydraulic effects of land use
changes, particularly the time history impact of the development of roads and canals
on the overall hydrology of the area.
3. Be able to project water table-surface water flow relationships under different
restoration alternative plans.
Although a number of available hydrologic-hydraulic models are known to have the
capability of meeting some of the above selection criteria, a search was made for an integrated and
comprehensive model that would specifically simulate water table-surface water flow relationship
in a continuous process. Based upon these requirements a specific, well documented hydrologic-
hydraulic model contained within a program package called the Hydrologic Simulation Program -
FORTRAN (HSPF) Version 10 was selected. HSPF is a comprehensive program package for
simulation of watershed hydrology and water quality developed for the U.S. Environmental

36
Protection Agency by Hydrocomp, Inc.
HSPF is the latest product resulting from more than 20 years of process research and model
development, testing, refinement and application. The initial stages of this research effort involved
the development of the Stanford Watershed Model (Crawford & Linsley, 1966) and the Hydrocomp
Simulation Program (HSP) (Hydrocomp, 1969). These two models provided the basic theory and
framework for the continuous simulation of hydrologic and hydraulic processes in HSPF. During
the second phase of development (1970's), water quality processes were superimposed on the
relevant transport components. The present Hydrologic-Hydraulic Water Quality Simulation
package of HSPF is, therefore, an extension and improvement of three previously developed models:
(1) the Agricultural Runoff Management (ARM) Model, (2) the Non-point Source runoff (NPS)
Model, and (3) the Hydrologic Simulation Program (HSP, including HSP Quality).
Simply put, this simulation model uses such meteorological information as the time history
of rainfall, temperature, wind movement, solar radiation, evaporation; such characteristics of the land
surface as land use patterns, slopes, soil types and agricultural practices to simulate the hydrologic
processes that occur in a watershed. The result of this simulation is a time history of the quantity
and quality of the runoff. The model then takes these results along with the information about the
stream channels in the watershed and simulates the hydraulic processes that occur in the stream
system. This part of the simulation produces a time history of water quantity and quality at any point
in the stream system. HSPF includes a data management system to process the large amounts of
input data for the simulations and equally large amounts of simulated output. Program sub-routines
are also provided to statistically analyze the data for ease of presentation and interpretation. HSPF

37
can be applied to a wide range of water resource problems. The key attribute that makes it applicable
to such a wide variety of water resource problems is its ability to simulate the continuous behavior
of time-varying physical processes and provide statistical summaries of the results.
More specifically, HSPF was found to meet the following objectives of the study:
� HSPF has the ability to model all aspects of the hydrologic cycle including direct runoff,
interflow, soil moisture, shallow groundwater storage and outflow. The understanding of the
complete water cycle in the study area is important to a successful restoration plan.
� HSPF has the ability to continuously model over a long time record (20 years or more). This
allows a wide range of meteorologic and hydrologic conditions (drought and flood) to be
studied.
� Most importantly, the continuous simulation allows the designer to observe the time-history
of the hydrologic-hydraulic behavior both during storm events and the rain-free intervals in
between. This is very important in wetland restoration.
� HSPF has the ability to model channel and reservoir routing. This is done using hydrologic
routing techniques.
3-1.2 Modeling Algorithms
The basic concept of the HSPF modeling is based on the lumped parameter approach where
the watershed is divided into “land segments,” each with relatively uniform meteorologic, soil and
land use characteristics. Similarly the channel system is segmented into "reaches" with each reach
demonstrating uniform hydraulic properties. The entire watershed is then represented by specifying
the reach network, i.e. the connectivity of the individual reaches, and the area of each land segment

38
that drains to each reach. Each land segment is then modeled to generate runoff to the stream
channel. The algorithm of the hydrologic and hydraulic submodels contained in HSPF is discussed
below. These separate discussions emphasize the function of each submodel within the overall
modeling scheme, the types of algorithms that are contained within each submodel, data needs, and
the kind of outputs that each submodel provides.
3-1.2a Hydrologic Submodel
The principal function of the Hydrologic submodel is to determine the volume and temporal
distribution of flow from the land to the canal system. This submodel currently contains two
application modules - PERLND (pervious land module) and IMPLND (impervious land module).
As used here, the concept of runoff from the land is broadly interpreted to include direct or surface
runoff, interflow and groundwater flow to streams. The amount and rate of runoff from the land to
the watershed stream system is largely a function of two factors. The first is the meteorological
events which determines the quantity of water available on or beneath the land surface, and the
second is the nature and use of the land.
The basic physical unit on which the hydrologic submodel operates is called the "Hydrologic
Land Segment." It is defined as a surface drainage unit that exhibits unique combinations of
meteorological parameters, such as precipitation and temperature, and land characteristics, such as
degree of perviousness, soil type and slope. A strict interpretation of this definition would lead to
the conclusion that there is virtually an infinite number of hydrologic land segments within even a
small watershed because of the large number of meteorological parameters and land characteristics
and because such parameters exhibit a continuous spatial variation throughout the watershed.

39
The practical and operational definition of a hydrologic land segment used within this model
is a surface drainage unit consisting of a subbasin or a combination of subbasins, within the
geographic area which can be considered represented by a particular meteorologic station and which
is relatively uniform with respect to three land characteristics: soil type, slope, and land use or cover.
Module PERLND simulates a pervious land segment with the above mentioned homogenous
hydrologic and climatic characteristics. Water movement is modeled along three flow paths:
overland flow, interflow and groundwater flow. Each of these three paths experiences differences
in time delay and differences in interactions between water and its various dissolved constituents.
A variety of storage zones are used to represent the storage processes that occur on the land surface
and in the soil horizons.
The hydrologic submodel operating on a time interval of one hour or less continually and
sequentially maintains a water balance between the various hydrologic processes by incorporating
a running account of the quantity of water that enters, leaves and remains within each phase of the
hydrologic cycle during each successive time interval. The water balance accounting operation is
performed by the PWATER (pervious land - water budget simulation) section of the PERLND
module. The fluxes and storages simulated in this module with special reference to the groundwater
component are described below.
The time series SUPY (water supply) representing the moisture supplied to the land segment
primarily includes rain. SUPY is then available for interception. Interception storage is the water
retained by any storage above the overland flow plane. For pervious areas the interception storage
is mostly on vegetation. Any overflow from interception storage is added to the surface external

40
lateral inflow to produce the total inflow into the surface detention storage. Inflow to the surface
detention storage is added to the existing storage to make up the water available for infiltration and
runoff. Moisture which directly infiltrates, moves into the lower zone and groundwater storage.
Other water may go to the upper zone storage, may be routed as runoff from surface detention or
interflow storage, or may stay in the overland flow plane from which it runs off or infiltrates at a later
time.
The processes of infiltration and overland flow interact and occur simultaneously depending
on the degree of perviousness and saturation of the land surface. The water in surface detention will
later infiltrate reoccurring as interflow or it can be contained in the upper zone storage. Water
infiltrating through the surface and percolating from the upper zone storage to the lower zone storage
may flow to active groundwater storage, or may be lost by deep percolation to inactive groundwater
storage. Active groundwater eventually reappears as base flow, but the deep percolation is
considered lost from the simulated system.
Lateral external inflows to interflow and active groundwater storage are also possible for
simulation. Evapotranspiration is simulated in all phases of the storages associated with the process,
i.e. from interception storage, upper and lower zone storages, active groundwater storage, and
directly from base flow.
3-1.2b Hydraulic Submodel
The primary function of the hydraulic submodel is to accept as input the runoff from the land
surface and the discharge of groundwater as produced by the hydrologic submodel, aggregate it, and
route it through the stream system, thereby producing a continuous time series output of discharge

41
values at predetermined locations along the streams of the basin. Module RCHRES (reach-reservoir)
of this submodel simulates the processes that occur in a single reach of an open channel or a
completely mixed lake or reservoir. Flow through the element of the reach is assumed to be
unidirectional. All inflows to the element are summed and enter the element without distinction as
to location of the entry. The outflow from the element may be distributed across several targets by
the user to properly represent normal outflows, diversions, etc. Evaporation, precipitation, solar
radiation and other heat exchange fluxes take place on the surface area of the water and are computed
along the reach.
The hydraulic behavior in the channel system or of a reservoir controlled by water control
structures is modeled on a continuous basis using the hydrologic reservoir routing technique. Use
of this routing procedure requires that a stage-discharge-cumulative storage table (FTABLE) be
prepared for each canal reach or reservoir with the values selected so as to encompass the entire
range of possible reservoir water surface elevations. A given stage-storage relationship can have
up to five different discharges for a given reach or reservoir thus facilitating the simulation of a
variety of potential outlet works and operating procedures. As simulated by the routing algorithm,
a volume of flow enters the reach during a given time increment with the flow entering from the
reach immediately upstream or coming directly from the land contiguous to the reach. The
incremental volume of flow is added to that already in the reach at the beginning of the time interval,
and the FTABLE is then used to estimate the discharge rate within the reach during the time
increment and, thereby, the volume of flow that would discharge from the reach during the time
increment. The volume of water in the reach at the end of the time increment is then calculated as

42
the initial volume plus the inflow volume minus the outflow volume. The above computational
process is then repeated for the next time increment and, as in the case for the first time increment,
the average flow rate from the reach is obtained. The channel routing computations proceed in a
similar manner for subsequent time increments in the reach in question and for all other reaches, thus
effectively simulating the passage of flood waves through the channel system.
3-1.2c Groundwater Flow Submodel
The groundwater flow that contributes to streamflow is calculated in HSPF as part of the
hydrologic submodel described above. The groundwater flow patterns in HSPF are simulated using
a storage/outflow relationship that is controlled mainly by several calibrated parameters. HSPF
limits the groundwater flow simulation to only that portion of the groundwater that contributes to
streamflow. All other groundwater flow is lumped together as “inactive” groundwater that is lost
from the system through deep percolation. Since this study is concerned with the upper portions of
the Water Table Aquifer and its interaction with the canal system, this approach was acceptable.
However, additional groundwater flow analysis was conducted using the U. S. Geological Survey’s
modular three dimensional finite difference groundwater flow (MODFLOW) program for the
purpose of determining seepage from the proposed spreader channels to the I-75 ditch. An analysis
of the entire groundwater system was needed to determine seepage flow. Both a two dimensional
and three dimensional groundwater flow simulation system were constructed.
3-1.3 Basic Fluxes of Simulation of the SGGE Model
With respect to the application of HSPF to investigate the effects of canals and land
development in the SGGE area, the basic fluxes of hydrologic simulation with and without the

43
effects of restoration plans on overall sheetflow pattern and hydroperiod regime are to be simulated
by the PWATER section of the PERLND module of the program. Water movement in the PERLND
module will be modeled along three flow paths: overland flow, interflow and shallow groundwater
flow. The impervious land module (IMPLND) was not utilized for the simulation.
The water balance for each land segment will be simulated through the processes of inflows,
outflows and storages taking place in the following six surface and subsurface storage zones.
1. Interception storage (CEPS)
2. Surface storage (SURS)
3. Interflow storage (IFWS)
4. Upper zone storage (UZS)
5. Lower zone storage (LZS)
6. Active groundwater storage (AGWS)
Hydraulic simulation for routing runoff from land surface and discharge from groundwater
through the canals are to be performed by the HYDR (hydraulic behavior simulation) section of the
RCHRES module. This module will simulate the hydraulic processes in the canals to produce
discharge rates and hydrographs.
3-2. MODEL DEVELOPMENT
The tasks necessary in the HSPF model application were database development,
segmentation of the watershed and canals, calibration and verification, and finally, model simulation
of the alternatives. Although HSPF has the capability to simulate water quality, this option was not
used at this time.

44
3-2.1 Database Development
3-2.1a Time Series Database

45
The HSPF program uses a time series database called the Time Series Storage (TSS) file.
Although HSPF, through its utility programs, has the ability to store, retrieve and manage the time
series data it uses, a stand alone program called ANNIE developed by U. S. Geological Survey
(USGS) was utilized in this project for this purpose. ANNIE has an extensive Watershed Data
Management (WDM) program package, and provides an easier to understand, more interactive and
efficient system of time series data management. HSPF also can utilize meteorological data such
as temperature, wind speed, solar radiation and dew point temperature for the calculation of snow
melt, dissolved oxygen levels and other water quality parameters. The SGGE model involved
application of two modules (PERLND and RCHRES) and meteorological data input of only
precipitation and pan evaporation were used. In addition to the meteorological data present in the
WDM file, streamflow and stage data available at various calibration points were added to the WDM
file for easier manipulation during the calibration and verification processes.
3-2.1b Meteorological Data
The meteorological data required by the PERLND module are continuous precipitation and
evaporation data, preferably in daily or hourly values. Daily meteorological values in the study area
were collected by the National Weather Service and the SFWMD in cooperation with several public
and private organizations.
A. Rainfall
The Thiessen polygon method for estimating areal extent rainfall distribution was used in this
study. Figure 3 shows the division of the study area into Thiessen polygons. Two queries were
made in the SFWMD Hydrometeorological Database (DBHYDRO) for rainfall. The first was for
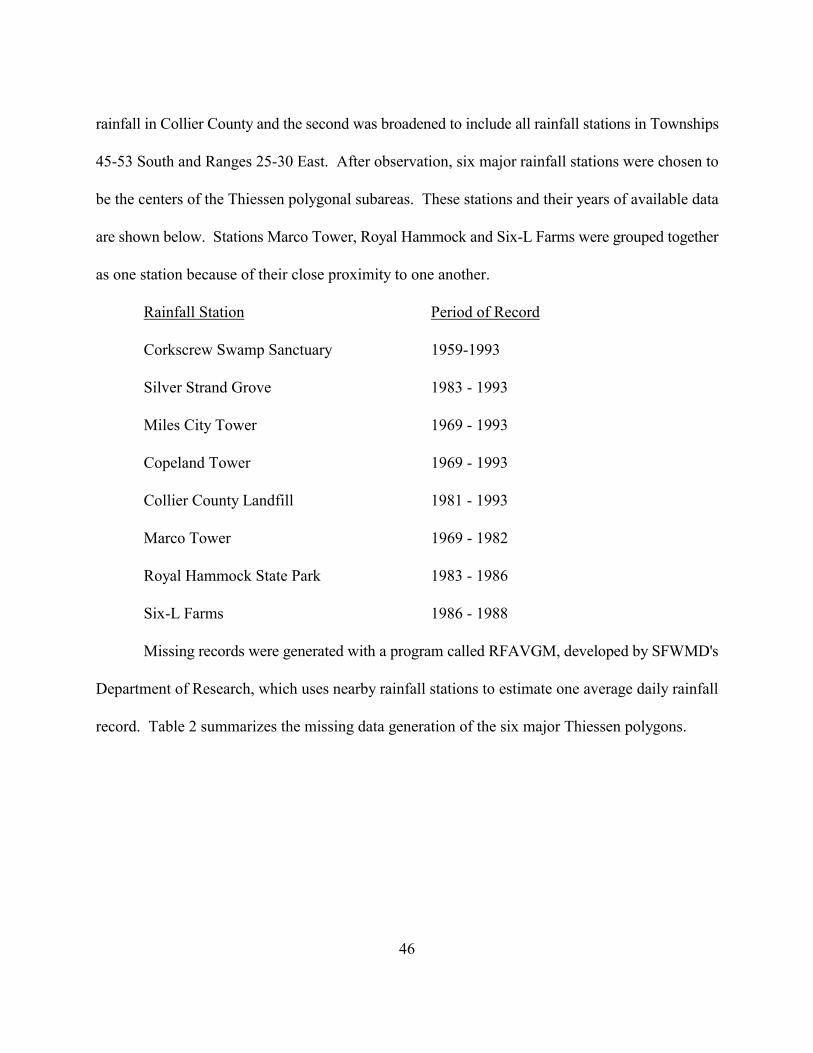
46
rainfall in Collier County and the second was broadened to include all rainfall stations in Townships
45-53 South and Ranges 25-30 East. After observation, six major rainfall stations were chosen to
be the centers of the Thiessen polygonal subareas. These stations and their years of available data
are shown below. Stations Marco Tower, Royal Hammock and Six-L Farms were grouped together
as one station because of their close proximity to one another.
Rainfall Station Period of Record
Corkscrew Swamp Sanctuary 1959-1993
Silver Strand Grove 1983 - 1993
Miles City Tower 1969 - 1993
Copeland Tower 1969 - 1993
Collier County Landfill 1981 - 1993
Marco Tower 1969 - 1982
Royal Hammock State Park 1983 - 1986
Six-L Farms 1986 - 1988
Missing records were generated with a program called RFAVGM, developed by SFWMD's
Department of Research, which uses nearby rainfall stations to estimate one average daily rainfall
record. Table 2 summarizes the missing data generation of the six major Thiessen polygons.

47

48
B. Evaporation
Since no one station close to the project area was found to have continuous records of pan
evaporation data for the simulation period 1970 to 1992, the overall evaporation database used for
the project was a combination of five stations, with missing records generated from weighted
average values. Evaporation stations in Lee, Collier, Hendry, Broward and Dade counties were
queried in the SFWMD’s DBHYDRO database. The following stations were found to have
reasonably continuous data for the period of record of 1970 to 1992: Corkscrew Swamp Sanctuary,
Caribbean Gardens in Naples, Lehigh Acres, Clewiston, Tamiami Trail at 40-mile bend, Homestead
and Hialeah. Hialeah and Homestead were not used because these stations are located on the east
coast of Florida and were not considered representative of the project location. The following table
shows the stations and the time periods used.
TABLE 2
RAINFALL DATA GENERATION FOR MISSING RECORDS IN THE POLYGONS
Polygon Polygon Complete % of Total Stations Used for Generation No. Name Years Records and the Years of Available Missing Missing Data
1 Corkscrew None 1.7 Corkscrew Tower (1969-1990) Swamp Immokalee #3NNW (1941-1992)
Sanctuary
2 Silver 1/70-6/83 60.0 Corkscrew Headquarters Strand (1959-1993) Miles City Tower (1969-1993)
Immokalee #3NNW (1941-1992)

49
Hendry Correctional Institute (1978-1983)
3 Miles City None 4.0 Fakahatchee Strand (1984-1990)Hendry Correctional Institute (1978-1983)Immokalee #3NNW (1941-1992)Corkscrew Headquarters (1959-1993)Copeland Tower (1969-1993)
4 Copeland None 2.7 Miles City Tower (1969-1993)Fakahatchee Strand (1984-1990)Everglades City (1924-1992)
5 Collier- 1/89 - 38.6 Marco Fire Station (1981-1993)Seminole 12/92 Copeland Tower (1969-1993)State Park Everglades City (1924-1992)
Naples Court House (1981-1993)
6 Collier 1/70 - 51.9 Naples Tower (1969-1993)Landfill 12/80 Naples (1942-1992)
Marco Tower (1969-1982)

50
Evaporation Station Periods Used
Tamiami Trail, 40-Mile Bend 1/70-6/74, 9/77-3/78
Corkscrew Swamp Sanctuary 7/74-8/77
Caribbean Gardens, Naples 4/78-12/78, 1/81-10/83
Lehigh Acres 1/79-12/80
Clewiston 11/83-12/92
Any missing data was filled in using averages calculated from the days of the respective
months before and after the missing data.
Generally, the Tamiami Trail station has poor records after 1975. The first period of record
(1/70-6/74) contained 14 percent estimated values and less than one percent missing values. The
second period (9/77-3/78) contained three percent estimated and 22 percent missing values. The
Corkscrew Swamp Sanctuary data was very good, containing less than one percent missing records
and less than one percent estimated records. Caribbean Gardens data contained four percent
estimated and two percent missing data. Also years 1979 and 1980 were missing. Lehigh Acres data
which was used for years 1979 and 1980 contained three percent missing data and 42 percent
estimated data. The estimated data is based on observed values in the field summed over a period
of days and averaged over those days. For the Clewiston record, the preferred DBKEY from
DBHYDRO were used for years 1983-1990 which contained no missing data. Years 1991 and 1992
came from the regular set of data and contained less than one percent missing data.
3-2.1c Calibration Data
The HSPF model for SGGE was calibrated using data from three streamflow stations and

51
three stage stations located at various points through out the watershed. Figure 4 shows the

52INSERT
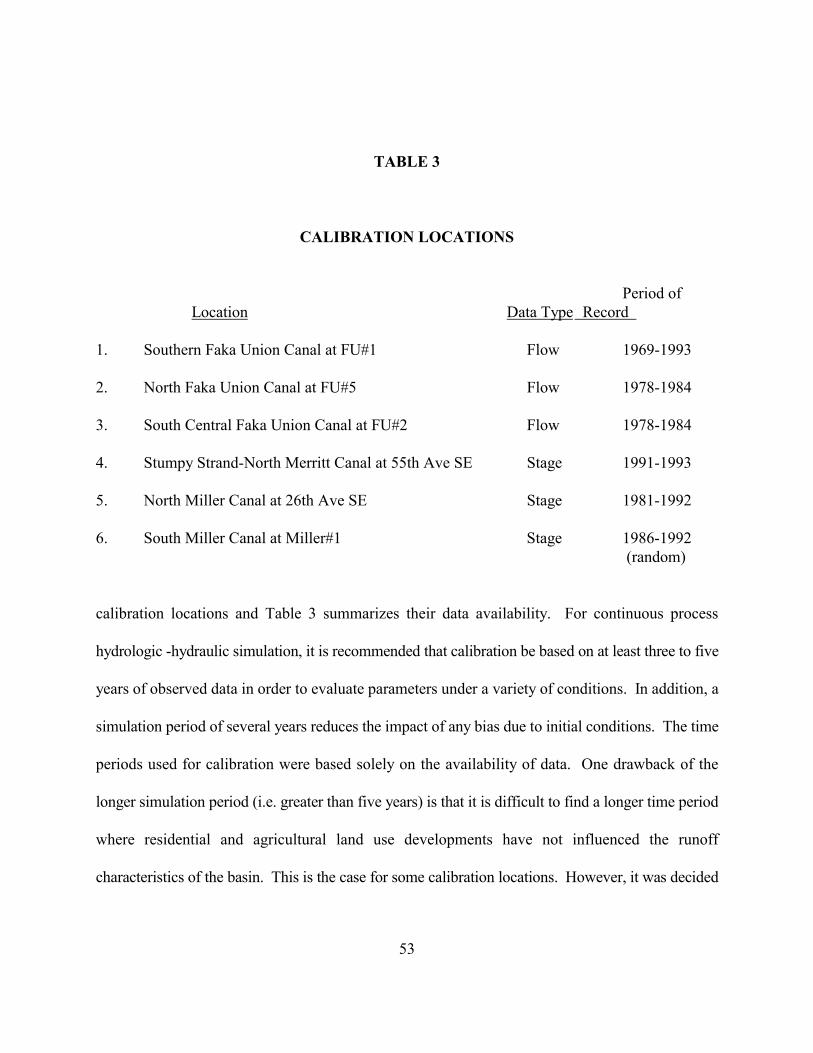
53
TABLE 3
CALIBRATION LOCATIONS
Period ofLocation Data Type Record
1. Southern Faka Union Canal at FU#1 Flow 1969-1993
2. North Faka Union Canal at FU#5 Flow 1978-1984
3. South Central Faka Union Canal at FU#2 Flow 1978-1984
4. Stumpy Strand-North Merritt Canal at 55th Ave SE Stage 1991-1993
5. North Miller Canal at 26th Ave SE Stage 1981-1992
6. South Miller Canal at Miller#1 Stage 1986-1992 (random)
calibration locations and Table 3 summarizes their data availability. For continuous process
hydrologic -hydraulic simulation, it is recommended that calibration be based on at least three to five
years of observed data in order to evaluate parameters under a variety of conditions. In addition, a
simulation period of several years reduces the impact of any bias due to initial conditions. The time
periods used for calibration were based solely on the availability of data. One drawback of the
longer simulation period (i.e. greater than five years) is that it is difficult to find a longer time period
where residential and agricultural land use developments have not influenced the runoff
characteristics of the basin. This is the case for some calibration locations. However, it was decided

54
to use all available data to provide a great variety of meteorological conditions. For instance, stage
data at Miller Canal Weir No. 1 was collected randomly at approximately seven to ten-day intervals.
Therefore, using all seven years of observed data for this station allowed more data points to be
compared.
3-2.2 Land and Channel Segmentation
Land segmentation is determined by several factors including the spatial variability of
weather data, soil and land characteristics, location of calibration data, and spatial resolution
requirements. Maps of soils, topography and land use of the study area were overlaid and used to
delineate the subbasins into land segments with similar characteristics. Land use and soils were
considered particularly important. In addition, infrared satellite image and photograph data were
analyzed.
For the purposes of generating the land related model input parameters, four general soil
types and eleven land use categories were identified for the pervious land segmentation (PLS). The
soil categories were formulated by generalizing a detailed soils map of the study area on the basis
of recently completed soil survey of Collier County by USDA Soil Conservation Service. The four
dominant soil categories are:
1. Non-Hydric
Examples of specific soil types found in this category are Immokalee Fine Sands,
Hallandale Fine Sands and Oldsmar Fine Sands. These soils have a top layer of four
to six inches. They are rarely ponded and the water table can range from six to
more than 40 inches below the surface.

55
2. Depressional
Examples of this soil type are Holopaw and Okeelanta Soils Depressional, the Boca,
Riviera, Limestone Substratum and Copeland Fine Sand Depressional, the Chobee,
Winder and Gator Soils Depressional, and the Riviera, Limestone Substratum-
Copeland Fine Sands. The top layer ranges from five to 13 inches thick and can have
a muck layer of up to 25 inches thick. These soils are naturally ponded six to nine
months out of the year.
3. Prairie
Soils included in this category are Pennsucco (marl prairie) and Ochopee Fine Sandy
Loam, Prairie (marl). The top layer is about five inches thick. With high rainfall, it
may be ponded for seven to 30 days.
4. Hydric
Soil types included in this general category are the Malabar Fine Sands, the Basinger
Fine Sands, the Riviera Fine Sands-Limestone Substratum, the Holopaw Fine Sands,
the Hallandale and Boca Fine Sands (Slough) and the Ochopee Fine Sandy Loam.
The top layer is two to five inches thick. With heavy rainfall, this soil type can be
ponded for seven to 30 days.
The information on land use and land cover complex categories were used to optimize initial
parameter estimates. The following dominant categories were selected:
1. Pasture/Old Fields
This category includes areas that were once farmed or used for pasture and now are

56
overgrown with grasses. (Mostly present in NGGE)
2. Non-Forested Uplands/Pine with a Light Canopy (Scattered)
These areas consist of non-hydric soil but are not thick pine forests. Sandy soil,
higher elevation areas and high infiltration are common characteristics. Vegetation
is generally 6-10 feet high (e.g. wax myrtle, scrub).
3. Pine Forest
These areas consist of non-hydric soil with a dominant pine canopy.
4. Cypress with Pine and/or Exotics
These areas contain mostly hydric soil but may have non-hydric soil. Here it is
assumed pine and other exotic species are invading the cypress. These areas may
have extensive, heavy invasion.
5. Agriculture
These areas are used for citrus, tomato or other vegetable crops.
6. Impervious
This category includes roofs and paved roads but does not include non-paved roads.
7. Non-Forested Slough and/or Wet Prairie and/or Pond
These areas usually contain depressional or prairie soil, although there may be some
other hydric soil. An example in this category is Lucky Lake Strand which comprises
the headwaters of Merritt Canal.
8. Cypress
These are primarily depressional areas of high water table with hydric soils and a

57
dominant cypress canopy.
9. Prairie with or without Scattered Cypress
These areas have dry prairie vegetation and may have scattered cypress. Soil is
depressional or prairie.
10. Prairie with Cabbage Palm or Pine
These areas usually have hydric soils but may also have prairie or depressional soils.
The Cabbage Palm and Pine are assumed to be invading the prairie.
11. Mixed Swamp Forest
These are moderate depressional areas in hydric soils with common vegetation
dominated by a mix of Cypress, Maple, Bay and Oak.
Initially, the hydrology of the watershed was proposed to be simulated in 185 PLS to account
for the extensive variety of land characteristics of the basin and to show a more realistic flow path
of the surface and subsurface water as it flowed from one land area (or PLS) to the next. However,
such level of detail and refinement works better on smaller watersheds. With each PLS requiring
numerous input parameters, some of which are sensitive calibration parameters, it becomes necessary
to limit segmentation of the watershed to larger PLS's. This provides a clearer picture of the
sensitivity of the calibration parameters and how they affect the basin runoff. Consequently, the
division of SGGE study area into PLS was modified to 35 PLS for model calibration and is shown
in Figure 5.

58

59
Channel segmentation is dependent upon the homogeneity of basic channel geometry,
location of stream gauges and spatial resolution requirements. Each reach should have similar
hydraulic characteristics, identified critical points in the canal and with flow travel time within the
individual reaches approximating the simulation time step. Initially, reaches in the canals were
divided at each weir and inflow points. The reaches were further divided so that each reach had a
similar cross-section and, therefore, similar stage-storage-discharge characteristics. The slopes vary
throughout the reaches. However, it was assumed that the reaches have reasonably homogeneous
bottom slopes. Calibration data is available at five weirs in the system which correspond to the reach
boundaries. Reaches were not further divided to equate flow time through individual reaches to the
simulation time step. Shown in Figure 6 are the total number of reaches (32) for the Faka Union
canal system.
The RCHRES module uses a function table (FTABLE) to specify the hydraulic properties
of a reach. The U. S. Army Corps of Engineer’s standard step backwater computation program
HEC-2 and cross-section data in the Black, Crow and Eidsness study were used to generate the
FTABLES for this study. Coded cross-sections were available from the COE Feasibility Study and
weir structures were added using original design drawings and field surveys of weir structures
Merritt No. 1 and Prairie No. 1. A survey of the upper portions of the Miller Canal and a field
observation of the culverts in the Miller Canal on 28th Avenue SE were also incorporated. Two
rating curves were used to represent wet and dry season operation of the stop logs in the water
control structures.
3-2.3 Calibration and Verification

60
3-2.3a Need for and Nature of Model Calibration
Many of the algorithms contained in HSPF are conceptual mathematical approximations of
complex natural phenomena. Therefore, before the model could be used to reliably simulate

61
streamflow behavior under alternative hypothetical basin development conditions, it is necessary to
calibrate the model, that is, to compare simulation model results with factual historic data and, if a
significant difference was found, to make parameter adjustments so as to adjust or calibrate the
model to the specific natural and man-made features of the basin. While the model is general in that
it is applicable to a wide range of geographic and climatic conditions, its successful application to
any given water resources system, such as the SGGE basin, very much depends on the calibration
process in which pertinent data on the natural resource and man-made features of the basin are used
to adapt the model to the local conditions. A schematic representation of the model calibration
process as used in this study is shown in Figure 7.

62
Since the model is designed to be applicable to many different water management
configurations, these parameters provide the mechanism to adjust the simulation for specific
topographical, hydrologic, edaphic, land use, and stream channel conditions. The large majority of
the input parameters are adapted from known watershed characteristics. Parameters that cannot be
precisely determined from known watershed features must be evaluated through calibration with
recorded data.
The HSPF modules used for the model simulation of SGGE that contain parameters
requiring calibration are the Pervious Land sub-model (PERLND) and Reach-Reservoir sub-model
(RCHRES).
A set of 27 input parameters for each PLS was used for the PERLND module simulation. In the
RCHRES module six parameters plus a function table or FTABLE was used for each reach.
3-2.3b Calibration Results
The calibration of the SGGE model utilized six streamflow and stage recording stations. The
approach to the calibration sequence was to find an overall calibration of the whole basin using data

63 IN

64
near the outlet of the basin and subsequently improve individual subbasin calibration without
disturbing previous calibration results. The outlet of the SGGE watershed at Faka Union Canal
Weir No. 1 was chosen as the first calibration location. Streamflows at the weir, which receives
runoff from the entire basin, were calibrated.
The initial parameters were chosen after careful study of several sources. The HSPF User's
Manual presented the specific algorithms used in the HSPF and allowable ranges of values for the
parameters. Consultation with Dr. Norm Crawford, principal author of the program, at a HSPF
training workshop provided typical ranges for the PERLND parameters. The HSPF Application
Guide provided a discussion of the general behavior of a few key parameters for the PERLND
module and RCHRES modules. Information was also available from three previous studies that
utilized the HSPF model. These studies were: "Continuous Simulation of Surface and Subsurface
Flows in Cypress Creek Basin, Florida, using Hydrological Simulation Program-Fortran" by Caroline
Hicks; "Hydrologic Study of the Water Control District of South Brevard for Present Conditions and
the Construction of L-74N Under the Upper St. Johns River Basin Plan" by the St. Johns River
Water Management District; and the "East Side Green River Watershed Hydrologic Analysis" by
Northwest Hydraulic Consultants Inc. The SCS Soil Survey for Collier County was used for initial
estimates of upper zone nominal storage (UZSN), lower zone nominal storage (LZSN), and the index
to mean infiltration rate (INFILT). Two key parameters, LZSN and INFILT, were assigned
progressively lower values, which indicate greater runoff potential, in the southern portions of the
basin due to lower elevations and the presence of "C" and "D" hydrologic soil groups.
Recommended default values for evapotranspiration parameters were used and the deep fraction and

65
active groundwater evapotranspiration parameters were set to zero and monthly variation of
parameters were not used initially. Initial storage conditions were adjusted after the first run to more
closely simulate the initial meteorological conditions.
Part of the Fakahatchee Strand State Preserve contributes runoff to the SGGE canal system.
Field studies have shown that groundwater moves from east to west from the Preserve to the Prairie
Canal, the easternmost canal of the Faka Union Canal system. Because of this, shallow groundwater
was routed from the Preserve to the Prairie Canal. However, due to topography, surface runoff and
interflow were not routed to the Prairie Canal but rather in a south to southwest direction. Therefore,
surface and interflow from the Preserve were considered as cross-basin flows in the water balance
equation for outflow through the Faka Union Canal.
The model output was analyzed by first establishing a water balance at the outlet of the basin
where inflows nearly equaled outflows. Further analysis was done by comparing both runoff
volumes and shapes of hydrographs. A regression analysis of observed and simulated flows and
stages was performed by double mass curve fit and also by using the method of least squares.
A. Streamflows at Faka Union No. 1 (Basin Outlet)
A water balance check or mass balance is a necessary first step in calibration. This assures
all inflows are accounted for and the model is set up correctly. The specific hydrologic components
of the final simulated water budget are shown below:
S I M U L A T E D O U T F L O W S I N F L O W S
DEEPFR + TAET + RUNOFF = TOTAL PRECIPITATION (in) (in) (in) (in) (in)1.52 36.74 21.53 59.79 59.72

66
DEEPFR = Fraction of groundwater that is lost to deep percolationTAET = Total simulated Evaporation
The outflows from the system closely match the inflows to the system. The final calibrated water
budget becomes the simulated existing conditions to which the various alternatives are compared.
All subsequent calibration performed for remaining subbasins within the SGGE watershed were
done without interfering with this balance significantly.
The time period for calibrating the model at Faka Union Canal Weir No. 1 included years
1970 through 1984. The model calibration results are shown in Figures 8 and 9 that compare
observed and simulated streamflow on an annual and monthly basis.
After 1975, a deviation was observed between simulated and recorded streamflows at Faka
Union Canal near Weir No. 1. One reason is that over the 15-year simulation period, the model
generated streamflows under somewhat constant or static watershed conditions using parameters that
are assumed to remain constant over time. During continuous process simulation although many
parameters were varied monthly, year to year progressive changes of watershed characteristics were
not reflected in them. Changes in canal hydraulics were, however, simulated with multiple
FTABLES in some strategic reaches. The recorded data reflect changes occurring on the watershed
and therefore, affected runoff characteristics. After examining the average yearly rainfall and the
average runoff recorded at the Faka Union Canal gauge near Weir No. 1 (Table 4), it is evident there
is a discrepancy between higher precipitation years corresponding with higher recorded runoff. The
conflicting rainfall-runoff relationship and the deviations of simulated streamflows after 1975 result
from changes to the canal cross-sections (scour, sedimentation and aquatic vegetation), water control
structures, and groundwater table over time. Most recently, the above mentioned changes to the

67
hydraulic performance of the canal system are less pronounced since a very aggressive maintenance
program has been in place since 1990. Additionally, changes to the water control structures are

68
Figure 8
Figure 9

69
TABLE 4
AVERAGE RAINFALL/RUNOFF NEAR FAKA UNION CANAL OUTLET
Year Rainfall Total (in) Average Runoff (cfs)
1970 67.07 381
1971 64.08 380
1972 63.50 198
1973 65.45 255
1974 60.02 324
1975 61.71 263
1976 65.71 118
1977 54.94 155
1978 54.56 260
1979 57.05 119
1980 51.42 176
1981 45.49 213
1982 69.14 375
1983 76.01 380

70
presently well documented.
The groundwater table recorded an abrupt decline in the early years following the
construction of the Faka Union Canal system. The first five years show the best correlation between
simulated and observed values. Groundwater level affects certain HSPF parameters such as INFILT,
LZSN and possibly DEEPFR and AGWRC as well, all of which are assumed to remain constant over
the simulation period.
A regression analysis of simulated and observed flows using the method of least squares
resulted in a R2 value of 0.73. R2 is a measure of the reliability of the correlation of two data sets.
The closer R2 is to a value of 1, the better the correlation between data sets. A double mass curve
for the simulated streamflows at Faka Union No. 1 is shown in Figure 10. Overall, the calibration
results for the entire watershed are satisfactory considering the changes in the characteristics of the
watershed over the long calibration period.
B. Streamflows at Faka Union No. 5
Streamflows at Weir No. 5 was calibrated for a period of five years, starting January 1, 1979
and ending December 31, 1983. This provided a cycle of both wet (1982-1983) and dry (1981) years
to be simulated. The controlling rainfall stations are Corkscrew Swamp Sanctuary and Silver Strand
Grove.
The overall calibration results at this station were somewhat less satisfactory than desired.
Figures 11 and 12 show simulated versus measured annual and monthly streamflows. This subbasin
was extremely difficult to calibrate. No adjustments could be made to the parameters to closely
simulate all five years. There are a few probable reasons for the difficulty in calibrating this

71
subbasin.
One explanation is the changing hydraulic characteristics of the canal. The Faka Union
Canal

72
Figure 10

73
Figure 11

74
Figure 12
Weir No. 5 was renovated in 1983. In 1983, additional stoplogs were added to the original v-notch
weir to allow for more storage. All other factors equal, the additional storage capacity in this portion
of the canal would result in lower observed discharge in 1983. It is to be noted, that in 1983, the
rainfall was higher (74 inches) than the rainfall received in 1982 (68 inches). But the observed
runoff for 1983 was lower than the observed runoff for 1982. Similarly, the v-notched weir
contained removable wooden boards, which were alternately removed and inserted several times
unrecorded during parts of the calibration period. Accurate records of operation of the boards for
the earlier years were not available. Vegetation growth is also a factor in the hydraulic performance
of the canal. It is suspected that little aquatic weed control was performed during this time.

75
Secondly, accurate measured flow data is the key to good calibration results. The flow data
at Faka Union No. 5 is classified as poor by the USGS. The USGS accuracy classifications are as
follows: "excellent" means that about 95 percent of the daily discharges are within five percent;
"good" within 10 percent; and "fair" within 15 percent. "Poor" means that daily discharges have less
than "fair" accuracy. The reasons for the low classification are probably due to the above mentioned
factors. Additionally, the discharge measurements used for calibration were extrapolated from
rating curves that related to the observed stage values with discharge. The frequency of some
discharge measurements were very widely distributed and did not adequately reflect the operation
of stop logs
at the water control structures.
The City of Naples wellfield lies just south of this weir. Some improvement in the simulated
dry season flows was obtained when withdrawals from the City of Naples wellfield were represented
in the RCHRES block as an additional “outflow” from the canal. The effects of the City's wellfield
on the discharge characteristics of Faka Union Canal is not directly modeled as the withdrawals are
from the Lower Tamiami Aquifer, a storage zone deeper than those simulated by HSPF. One of the
primary sources of recharge of the Lower Tamiami Aquifer is leakage from the Water Table Aquifer.
This is accounted for in HSPF by assuming the fraction lost from the system by deep percolation
in the DEEPFR parameter. However, the amount lost either remains constant over time or varies
with the current available groundwater storage. Higher available storage results in a greater volume
being lost to deep percolation or other losses. Groundwater storage is at its highest during the wet
season which may not correspond to heavy withdrawals from the wellfield which are higher during

76
the dry season. Therefore, the recharge was represented as an additional outflow column in the
FTABLES of the RCHRES block.
A regression analysis of simulated and observed flows using the method of least squares
resulted in a R2 value of 0.60. A double mass curve for the simulated streamflows at Faka Union
No. 5 is shown in Figure 13.
C. Streamflows at Faka Union No. 2
The time period for calibrating the model at Faka Union Canal weir No. 2 included years
1978 through 1983. Figures 14 and 15 show simulated versus measured annual and monthly
streamflows. A regression analysis of simulated and observed flows using the method of least
squares resulted in a R2 value of 0.83. A double mass curve for the simulated streamflows at Faka
Union No. 2 is shown in Figure 16.
After examining flows at the outlet of the basin and at Faka Union Weir No. 2 which
receives runoff from the central part of the basin, there was evidence that groundwater flows in an
east to west pattern into the Faka Union Canal both at a location just east of the north Faka Union
Canal, near Stumpy Strand, and also just east of the Faka Union Canal between Faka Union Canal
Weirs No. 2

77
Figure 13

78
Figure 14

79
Figure 15

80
Figure 16
and 3. Simulated flow volumes at the outlet of the basin were close to observed volumes for years
1982 and 1983 but simulated flow volumes at Faka Union No. 2 for the same period were
significantly lower than observed. This suggested that perhaps a greater area contributed runoff to
the Faka Union Canal above Weir No. 2. After parameters were adjusted for the central portion of
the basin and flow volumes still remained low, the watershed boundary for this subbasin was
extended to include areas east of Faka Union Canal between Weirs No. 2 and 3. This resulted
increase in some flow at Faka Union No. 2 but still remained low. A portion of groundwater flow
from the Stumpy Strand area was then routed to the Faka Union Canal instead of the Merritt Canal

81
and resulted in improved simulation.
D. Stages at Merritt Canal at 55th Avenue Southeast
In the remaining calibration locations observed stage records rather than streamflow
measurements were used. Stages on the Merritt Canal were calibrated for a period of one year,
starting December 1991 and ending November 30, 1992. Figure 17 show simulated versus
measured monthly stages. A regression analysis of simulated and observed stages using the method
of least squares resulted in a R2 value of 0.96. A correlation curve for the simulated versus observed
stages for Merritt Canal at 55th Ave SE is shown in Figure 18. The use of a shorter calibration
period for the Stumpy Strand-Lucky Lake Strand subbasin is a contributing factor for the better
correlation between simulated and observed stages.
E. Stages at Miller Canal at 26th Avenue Southeast
The time period for calibrating the model at Miller Canal at 26th Ave SE included nine years
from May 1983 through May 1992. Figures 19 and 20 show simulated versus measured annual and
monthly stages. A regression analysis of simulated and observed stages using the method of least

82
Figure 17

83
Figure 18

84
Figure 19

85
Figure 20
squares resulted in a R2 value of 0.69. A correlation curve for the simulated versus observed stages
at Miller Canal at 26th Ave SE is shown in Figure 21.
F. South Miller Canal at Miller No. 1
The calibration period at Miller Canal at Weir No. 1 started January 1986 and ended
December 1992. Figures 22 and 23 show simulated verses measured annual and monthly canal
stages. A regression analysis of simulated and observed stages using the method of least squares
resulted in a R2 value of 0.39. A correlation curve for the simulated versus observed stages is
shown in Figure 24. The stage records at this location were collected randomly with an average
frequency of once a week. Continuous data collection is preferred for calibration and the random
nature of the data is a likely cause of the low correlation between simulated and observed stages.

86
G. Summary of Calibration Results
The overall performance of the model was enhanced significantly by the inclusion of factors
such as time variant changes in the hydraulic properties of the canals and weirs. Progressive changes
in canal hydraulics due to scour, sedimentation, aquatic weed growth and undocumented operation
of water control structures posed greater challenges in the calibration process.

87
The weirs in the drainage system have undergone changes. Wooden boards were
alternately removed and inserted in the v-notched weirs several times and these operations were
unrecorded. A water level report by Stanley W. Hole and Associates in 1976 reported that sand
cement bags were added to the crests of Miller Weir No. 1 and Faka Union Weir No. 2
increasing their elevation approximately two feet. In 1983, several weirs including Faka Union
Weirs No. 5, 4, and 2 and Miller Weirs No. 1 and 3 were renovated. A limited representation of
the historic transient discharge characteristics were simulated by using multiple FTABLES in the
RCHRES block of the program.
Figure 21

88

89
Figure 22

90
Figure 23

91
Figure 24
Typical wet and dry season weir crest elevations were used. However, it is impossible to
chronologically account for every change to each weir structure due to incomplete records of
operation logs and also the necessary limitations in the model.
Excessive weed growth in the canals affect the hydraulic capacities of the canals and
consequently the recorded discharges at the outlet of the basin. A study on the conditions of the Faka
Union and Miller Canals south of Alligator Alley, prepared by Stanley W. Hole and Associates in
the summer of 1976, mentioned vegetative growth in both canals and particularly heavy growth in
the Faka Union Canal. With the exception of the Faka Union Weir No. 5 location, the calibration

92
locations near the headwaters of the canals showed better correlations than those further downstream.
3-2.3c Final Calibration Parameters
The final set of calibration parameters used for the simulation of SGGE is shown in Table
5. A list of parameter abbreviations from the HSPF program is shown in Appendix A.
3-2.3d Sensitivity Analysis of Model Parameters
Precipitation and evapotranspiration are direct determinants of water availability and
therefore, the simulation in HSPF is very sensitive to the magnitude of precipitation. A thorough
search for all available rainfall records resulted in the use of six different rainfall stations that
surround the SGGE area. Due to the convective nature of scattered summer thunderstorms, rainfall
at any given location can be spatially variable to a considerable extent. An example of this is evident
when the model output was examined for August 13, 1981. The Corkscrew Swamp Sanctuary
rainfall records report 3.75 inches of rain for that day; however, USGS discharge records for
the Faka Union Weir No. 5 approximately nine miles southeast of the rainfall station show only a
modest increase in discharge from 15 to 21 cfs over the next few days. On May 16, 1982 USGS

93
TABLE 5
FINAL PARAMETERS FOR HSPF SIMULATION OF SGGE
Parameter Set 1
PLS FOREST LZSN INFILT LSUR SLSUR KVARYAGWRC1 0 8 0.09 1660 0.00061 1.0 0.9802 0 8 0.04 1660 0.00032 0.0 0.9403 0 4 0.04 1660 0.00019 0.0 0.9404 0 4 0.04 1660 0.00016 0.0 0.9405 0 8 0.09 1660 0.00014 0.0 0.9606 0 6 0.09 1660 0.00012 0.0 0.9607 0 6 0.09 1660 0.00033 0.0 0.9608 0 4 0.09 1660 0.00035 0.0 0.9409 0 4 0.04 1660 0.00014 0.0 0.94010 0 2 0.04 1660 0.00008 0.0 0.94011 0 2 0.04 1660 0.00032 0.0 0.94012 0 4 0.10 1660 0.00013 0.0 0.94013 0 4 0.09 1660 0.00013 0.0 0.94014 0 4 0.04 1660 0.00002 0.0 0.94015 0 4 0.10 1660 0.00019 0.0 0.94016 0 4 0.04 1660 0.00002 0.0 0.94017 0 4 0.04 1660 0.00038 0.0 0.94018 0 6 0.09 1660 0.00021 0.0 0.94019 0 2 0.04 1660 0.00021 0.0 0.94020 0 2 0.04 1660 0.00030 0.0 0.94021 0 8 0.09 1660 0.00013 0.0 0.94022 0 4 0.04 1660 0.00012 0.0 0.94023 0 4 0.04 1660 0.00032 0.0 0.94024 0 4 0.04 1660 0.00018 0.0 0.94025 0 4 0.04 1660 0.00025 0.0 0.94026 0 4 0.04 1660 0.00013 0.0 0.94027 0 2 0.04 1660 0.00008 0.0 0.94028 0 2 0.04 1660 0.00008 0.0 0.94029 0 2 0.04 1660 0.00008 0.0 0.94030 0 4 0.04 1660 0.00042 0.0 0.92031 0 4 0.06 1660 0.00032 0.0 0.94032 0 4 0.04 1660 0.00018 0.0 0.94033 0 4 0.04 1660 0.00008 0.0 0.92034 0 4 0.04 1660 0.00032 0.0 0.94035 0 6 0.06 1660 0.00032 0.0 0.94036 0 4 0.04 1660 0.00020 0.0 0.92037 0 4 0.04 1660 0.00020 0.0 0.920
PLS = Pervious Land Segment SLSUR = slope of overland flow planeFOREST = fraction of winter forest transpiration KVARY = groundwater recession behaviorLZSN = lower zone nominal soil storage (in) parameter (1/in)INFILT = index to mean infiltration rate (in/hr) AGWRC = active groundwater recession LSUR =length of overland flow plane (ft) coefficient (1/day)
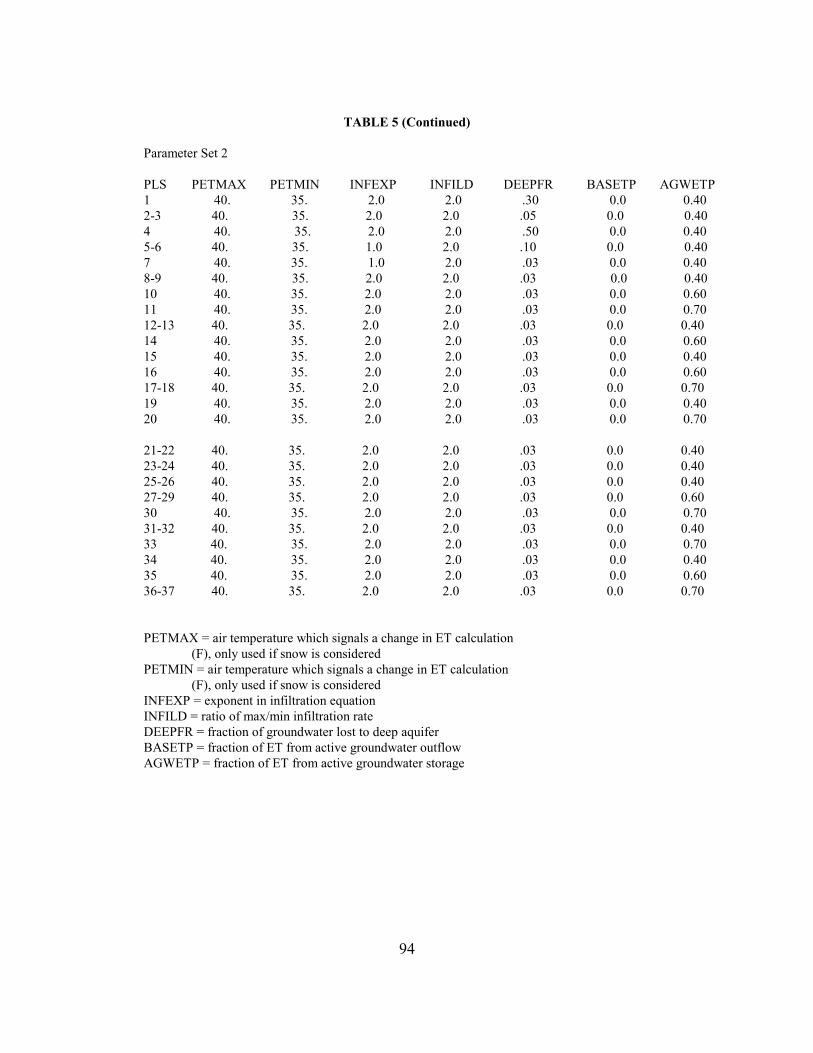
94
TABLE 5 (Continued)
Parameter Set 2
PLS PETMAX PETMIN INFEXP INFILD DEEPFR BASETP AGWETP1 40. 35. 2.0 2.0 .30 0.0 0.402-3 40. 35. 2.0 2.0 .05 0.0 0.404 40. 35. 2.0 2.0 .50 0.0 0.405-6 40. 35. 1.0 2.0 .10 0.0 0.407 40. 35. 1.0 2.0 .03 0.0 0.408-9 40. 35. 2.0 2.0 .03 0.0 0.4010 40. 35. 2.0 2.0 .03 0.0 0.6011 40. 35. 2.0 2.0 .03 0.0 0.7012-13 40. 35. 2.0 2.0 .03 0.0 0.4014 40. 35. 2.0 2.0 .03 0.0 0.6015 40. 35. 2.0 2.0 .03 0.0 0.4016 40. 35. 2.0 2.0 .03 0.0 0.6017-18 40. 35. 2.0 2.0 .03 0.0 0.7019 40. 35. 2.0 2.0 .03 0.0 0.4020 40. 35. 2.0 2.0 .03 0.0 0.70
21-22 40. 35. 2.0 2.0 .03 0.0 0.4023-24 40. 35. 2.0 2.0 .03 0.0 0.4025-26 40. 35. 2.0 2.0 .03 0.0 0.4027-29 40. 35. 2.0 2.0 .03 0.0 0.6030 40. 35. 2.0 2.0 .03 0.0 0.7031-32 40. 35. 2.0 2.0 .03 0.0 0.4033 40. 35. 2.0 2.0 .03 0.0 0.7034 40. 35. 2.0 2.0 .03 0.0 0.4035 40. 35. 2.0 2.0 .03 0.0 0.6036-37 40. 35. 2.0 2.0 .03 0.0 0.70
PETMAX = air temperature which signals a change in ET calculation (F), only used if snow is consideredPETMIN = air temperature which signals a change in ET calculation (F), only used if snow is consideredINFEXP = exponent in infiltration equationINFILD = ratio of max/min infiltration rateDEEPFR = fraction of groundwater lost to deep aquiferBASETP = fraction of ET from active groundwater outflowAGWETP = fraction of ET from active groundwater storage

95
TABLE 5 (Continued)
Parameter Set 3
PLS CEPSC UZSN NSUR INTFW IRC LZETP1 0.100 1.80 0.70 5.00 0.90 0.502 0.100 0.50 0.70 5.00 0.95 0.303 0.150 0.50 0.70 5.00 0.95 0.704 0.150 0.50 0.70 5.00 0.95 0.805 0.150 0.50 0.70 5.00 0.90 0.806 0.150 0.50 0.70 5.00 0.90 0.807 0.100 0.50 0.70 5.00 0.90 0.608 0.150 0.50 0.70 5.00 0.95 0.809 0.150 0.50 0.70 5.00 0.95 0.8010 0.150 0.50 0.70 5.00 0.95 0.7011 0.150 0.50 0.70 5.00 0.95 0.7012 0.150 0.50 0.70 5.00 0.95 0.7013 0.150 0.50 0.70 5.00 0.95 0.7014 0.100 0.50 0.70 5.00 0.95 0.4015 0.150 0.50 0.70 5.00 0.95 0.7016 0.150 0.50 0.70 5.00 0.95 0.7017 0.150 0.50 0.70 5.00 0.95 0.7018 0.150 0.50 0.70 5.00 0.95 0.7019 0.100 0.50 0.70 5.00 0.95 0.40 20 0.150 0.50 0.70 5.00 0.95 0.7021 0.100 0.50 0.70 5.00 0.95 0.30 22 0.150 0.50 0.70 5.00 0.95 0.7023 0.150 0.50 0.70 5.00 0.95 0.70 24 0.100 0.50 0.70 5.00 0.95 0.40 25 0.150 0.50 0.70 5.00 0.95 0.8026 0.150 0.50 0.70 5.00 0.95 0.7027 0.150 0.50 0.70 5.00 0.95 0.7028 0.100 0.50 0.70 5.00 0.95 0.4029 0.150 0.50 0.70 5.00 0.95 0.7030 0.200 0.50 0.70 5.00 0.95 0.9031 0.150 0.50 0.70 5.00 0.95 0.8032 0.150 0.50 0.70 5.00 0.95 0.4033 0.150 0.50 0.70 5.00 0.95 0.9034 0.150 0.50 0.70 5.00 0.95 0.7035 0.150 0.50 0.70 5.00 0.95 0.4036 0.200 0.50 0.70 5.00 0.95 0.9037 0.100 0.50 0.70 5.00 0.95 0.40
CEPSC = interception storage capacity (in)NSUR = Manning's n for overland flowUZSN = upper zone nominal soil storage (in)INTFW = interflow inflow parameterIRC = interflow recession rate (1/day)LZETP = lower zone evapotranspiration parameter

96
TABLE 5 (Continued)
Monthly Variable Parameter - LZETP
PLS JAN FEB MAR APR MAY JUN JUL AUG SEP OCT NOV DEC1 .25 .25 .25 .25 .40 .40 .40 .40 .25 .25 .25 .252 0.2 0.2 0.2 0.2 0.2 .05 .05 .05 .05 .05 0.2 0.23 .25 .25 .25 .25 .40 .40 .40 .40 .25 .25 .25 .254-6 0.4 0.4 0.5 0.6 0.7 0.7 0.6 0.5 0.4 0.4 0.4 0.47 0.3 0.4 0.4 0.4 0.5 0.5 0.4 0.3 0.3 0.3 0.3 0.38-13 0.4 0.4 0.5 0.6 0.7 0.7 0.6 0.6 0.5 0.5 0.4 0.414 0.2 0.2 0.2 0.2 0.2 0.2 0.2 0.2 0.2 0.2 0.2 0.215-17 0.4 0.4 0.5 0.6 0.7 0.7 0.6 0.5 0.4 0.4 0.4 0.418 0.4 0.4 0.5 0.6 0.7 0.7 0.6 0.5 0.4 0.4 0.4 0.419 0.2 0.2 0.2 0.2 0.2 0.2 0.2 0.2 0.2 0.2 0.2 0.220 0.5 0.6 0.7 0.7 0.8 0.8 0.7 0.7 0.7 0.6 0.6 0.521 0.2 0.2 0.2 0.2 0.2 .05 .05 .05 .05 .05 0.2 0.222 .25 .25 .25 .25 .40 .40 .40 .40 .25 .25 .25 .2523 .25 .25 .25 .25 .40 .40 .40 .40 .25 .25 .25 .2524 0.3 0.4 0.4 0.4 0.5 0.5 0.4 0.4 0.4 0.3 0.3 0.325 0.6 0.7 0.8 0.8 0.9 0.9 0.8 0.8 0.8 0.7 0.7 0.626 0.5 0.6 0.7 0.7 0.8 0.8 0.7 0.7 0.7 0.6 0.6 0.527 0.5 0.6 0.7 0.7 0.8 0.8 0.7 0.7 0.7 0.6 0.6 0.528 0.3 0.4 0.4 0.4 0.5 0.5 0.4 0.4 0.4 0.3 0.3 0.329 0.5 0.6 0.7 0.7 0.8 0.8 0.7 0.7 0.7 0.6 0.6 0.530 0.7 0.8 0.8 0.9 0.9 0.9 0.9 0.9 0.9 0.8 0.8 0.731 0.4 0.4 0.5 0.6 0.7 0.7 0.6 0.6 0.5 0.5 0.4 0.432 0.3 0.4 0.4 0.4 0.5 0.5 0.4 0.4 0.4 0.3 0.3 0.333 0.7 0.8 0.8 0.9 0.9 0.9 0.9 0.9 0.9 0.8 0.8 0.734 .25 .25 .25 .25 .40 .40 .40 .40 .25 .25 .25 .2535 0.3 0.4 0.4 0.4 0.5 0.5 0.4 0.4 0.4 0.3 0.3 0.336 0.7 0.8 0.8 0.9 0.9 0.9 0.9 0.9 0.9 0.8 0.8 0.737 0.3 0.4 0.4 0.4 0.5 0.5 0.4 0.4 0.4 0.3 0.3 0.3

97
TABLE 5 (Continued)
Parameters for Initial Conditions
PLS CEPS SURS UZS IFWS LZS AGWS GWVS1 0.00 0.0 0.0 0.0 6.0 1.7 0.002 0.00 0.0 0.0 0.0 6.0 1.7 0.003 0.00 0.0 0.0 0.0 6.0 3.5 0.004 0.00 0.0 0.0 0.0 6.0 2.0 0.005 0.00 0.0 0.0 0.0 6.0 1.7 0.006 0.00 0.0 0.0 0.0 6.0 2.0 0.007 0.00 0.0 0.0 0.0 6.0 2.0 0.008 0.00 0.0 0.0 0.0 5.0 1.7 0.009 0.00 0.0 0.0 0.0 5.0 2.0 0.0010 0.00 0.0 0.0 0.0 4.0 2.0 0.0011 0.00 0.0 0.0 0.0 4.0 2.0 0.0012 0.00 0.0 0.0 0.0 4.0 1.7 0.0013 0.00 0.0 0.0 0.0 4.0 2.0 0.0014 0.00 0.0 0.0 0.0 4.0 2.0 0.0015 0.00 0.0 0.0 0.0 4.0 1.7 0.0016 0.00 0.0 0.0 0.0 4.0 2.0 0.0017 0.00 0.0 0.0 0.0 3.0 2.0 0.0018 0.00 0.0 0.0 0.0 4.0 2.0 0.0019 0.00 0.0 0.0 0.0 3.0 2.0 0.0020 0.00 0.0 0.0 0.0 3.0 2.0 0.0021 0.00 0.0 0.0 0.0 6.0 1.7 0.0022 0.00 0.0 0.0 0.0 6.0 3.0 0.0023 0.00 0.0 0.0 0.0 4.0 2.0 0.0024 0.00 0.0 0.0 0.0 4.0 3.0 0.0025 0.00 0.0 0.0 0.0 4.0 1.7 0.0026 0.00 0.0 0.0 0.0 4.0 2.0 0.0027 0.00 0.0 0.0 0.0 4.0 1.7 0.0028 0.00 0.0 0.0 0.0 4.0 2.0 0.0029 0.00 0.0 0.0 0.0 3.0 1.7 0.0030 0.00 0.0 0.0 0.0 4.0 2.0 0.0031 0.00 0.0 0.0 0.0 4.0 2.0 0.0032 0.00 0.0 0.0 0.0 4.0 3.0 0.0033 0.00 0.0 0.0 0.0 3.0 2.0 0.0034 0.00 0.0 0.0 0.0 4.0 2.0 0.0035 0.00 0.0 0.0 0.0 3.0 2.0 0.0036 0.00 0.0 0.0 0.0 4.0 2.0 0.0037 0.00 0.0 0.0 0.0 3.0 2.0 0.00
CEPS = interception storage at the start of the simulation (in)SURS = surface storage at the start of the simulation (in)UZS = upper zone soil storage at the start of the simulation (in)IFWS = interflow storage at the start of the simulation (in)LZS = lower zone soil storage at the start of the simulation (in)AGWS = active groundwater storage at the start of the simulation (in)GWVS = index to groundwater slope at the start of the simulation (in)
98
discharge records report an increase in discharge from 2 to 19 cfs, however rainfall records at the
Corkscrew Swamp Sanctuary report no rainfall on or around that day. This abrupt increase in
discharge may have resulted from opening of stop logs at the weir which was not recorded.
Since groundwater outflow or baseflow is what makes up most of the canal discharge during
the dry season, the HSPF submodel that simulates groundwater inflow, outflow and storage is the
primary means to model dry season flow in the study area. The inflow to groundwater is direct
infiltration plus percolation from the upper zone that does not travel to the lower zone plus an
optional external lateral groundwater inflow. The outflows from groundwater are deep percolation
to inactive groundwater, groundwater outflow to streams and evaporation from groundwater. The
outflow is calculated by:
AGWO = KGW*(1.0 + KVARY*GWVS)*AGWS
where KGW = 1.0 - (AGWRC)**(DELT60/24)
AGWO = active groundwater outflow
KGW = groundwater outflow recession parameter, per
interval
KVARY = parameter which can make active groundwater
storage to outflow relation nonlinear in per
inch
GWVS = index to groundwater slope in inches
AGWS = active groundwater storage at the start of

99
the simulation in inches
AGWRC = daily recession constant of groundwater
flow, if KVARY or GWVS = 0.0
That is, the ratio of current groundwater
discharge to groundwater discharge 24-hr
earlier
DELT60 = hr/interval
The major parameters that affect the modeling of shallow groundwater flow are AGWRC
and KVARY. Minor adjustments to the AGWRC caused significant changes in runoff hydrograph
shapes. The AGWRC was varied from 0.998 to 0.945. With AGWRC = 0.998, active groundwater
storage was high and outflow was slowly released. With high values of AGWRC, groundwater tends
to be retained in storage rather than being released as groundwater outflow. Reasonable runoff
volumes could only be achieved with AGWRC equal to lower values such as 0.945. The runoff
hydrograph shape tended to be fatter and shorter and match better with the observed hydrographs.
With KVARY = 1.0, the modeler has the option to make groundwater recession rates
variable. By making KVARY = 1.0, the GWVS variable is activated. In the model, GWVS is
increased each interval (in this case each day) by the inflow to active groundwater and decreased by
three percent each day. The overall effect of activating the GWVS variable seems to increase
baseflow during wet periods and decrease base flow during drier periods. In this case, with KVARY
= 1.0, wet season flows were greatly over estimated. Spring flows seemed to be better represented
and dry season flows remained unchanged. Overall, it seems that in using the variable recession rate

100
through the KVARY and GWVS parameters, GWVS is highly influenced by the wet season
antecedent conditions and is increased too much and as a result, wet season flows are overestimated.
Dry season flows are not affected because after several days or even months with no significant
rainfall, the GWVS is decreased to zero and ceases to be of any help in producing groundwater
outflow during the dry season. Therefore, KVARY was set to zero for all but PLS No. 1 and the
AGWRC was set to fairly low values ranging from 0.92 to 0.96 with one PLS set to 0.98. By
making AGWRC lower, reasonable runoff volumes were achieved. However, groundwater did not
remain in storage when direct infiltration from precipitation ceased during the dry season and
percolation inflow from soil storage diminished. The groundwater storage decreased to zero and was
no longer able to produce outflow. As a result, dry season runoff tended to be under estimated by
the model.
A study by Caroline Hicks called "Continuous Simulation of Surface and Subsurface Flows
in Cypress Creek Basin, Florida, Using Hydrological Simulation Program-Fortran (HSPF)”
investigated the ability of HSPF to successfully model groundwater flow in Florida. According to
that report (Hicks, 1985), "The physical behavior of the watershed which the model was not
successfully simulating was the depletion of the Surficial Aquifer during successive dry months. If
rainfall is not available to replenish the Surficial Aquifer, ET and leakage to deep groundwater can
reduce the water table level until it drops below the level of the stream bed. When rainfall occurs
after such a depletion, water must fill the surficial storage to the threshold level of the stream bed
before runoff will be observed. The active groundwater storage zone of the model does not
recognize a threshold level of storage below which outflow will not occur. Any water entering the

101
active groundwater storage zone must eventually leave as either evapotranspiration or outflow to a
stream; no minimum level of storage is maintained."
In general, there are two types of calibration parameters in the PERLND module of HSPF;
those whose adjustments affect volume runoff totals and those whose adjustments affect only the
hydrograph shape without affecting total runoff volumes. The following parameters are generally
used to change volume totals: upper zone nominal storage (UZSN), lower zone nominal storage
(LZSN), various evapotranspiration (ET) parameters such as lower zone evapotranspiration
parameter (LZETP), active groundwater evapotranspiration parameter (AGWETP), and baseflow
evapotranspiration parameter (BASETP), and fraction of groundwater to deep aquifer (DEEPFR).
The infiltration parameter (INFILT) affects both runoff volumes and hydrographs. The principal
parameters that affect the hydrograph shape but not volumes are the interflow recession coefficient
(IRC), interflow inflow parameter (INTFLW), active ground water recession coefficient (AGWRC),
and the variable groundwater recession rate coefficient (KVARY).
The effect of AGWRC and KVARY has been previously discussed. With the exception of
DEEPFR, the parameters that influence the runoff volumes are those that also influence the total ET
amounts. The INFILT parameter allows the modeler to shift the water losses from runoff to ET and
vice versa. The LZETP parameter facilitates the modeling of ET by helping to characterize
vegetation type and other factors that determine ET losses from the lower soil storage zone. This
parameter was input on a monthly basis to account for seasonal variation. Higher values increase
ET and decrease runoff. The AGWETP and BASETP have a similar effect. An AGWETP value of
0.7 was suggested for wetland areas. However, through the calibration process, a value of 0.4 was

102
used because higher values caused too much water to be lost to ET and runoff volumes to be too
small. Increasing the LZSN also increases the ET and lowers the runoff. A major portion of the
actual ET comes from the lower soil moisture zone and increasing LZSN will increase simulated ET.
Increasing LZSN also tends to lower runoff peaks. DEEPFR is the fraction of groundwater that is
lost to inactive groundwater and therefore, is not available for runoff or ET. Increasing DEEPFR
will reduce runoff because less groundwater will be available for outflow.
Hydrograph shape of a selected storm can be adjusted with the INTFLW and IRC parameters
and with minor adjustments to UZSN and INFILT parameters. Increasing UZSN will reduce peaks
considerably and will represent watersheds that have significant subsurface and interflow
components. Low UZSN values are indicative of highly responsive watersheds where the surface
runoff component is dominant (Donigian, 1984).
Initially the UZSN and LZSN values were obtained using information from the SCS soil
survey. The upper zone of the soil corresponds somewhat to what the SCS soil survey describes as
the surface layer of the soil which can vary in thickness from two to five inches. This thickness
multiplied by the soil's water holding capacity gave a starting value for UZSN. The final UZSN
parameter was increased slightly to reduce high flows. The LZSN parameter values were obtained
using information about the substratum layer of the soil from the SCS soil survey. This thickness
extended between 35 to 52 inches below the ground surface. The initial values calculated were
raised through the calibration process to increase ET and decrease runoff.
The INFILT parameter governs the division of precipitation into various components
(surface, interflow and groundwater). The initial INFILT parameter was selected on the basis of the

103
permeability of the soil given by SCS soil survey. The typical values for INFILT range from 0.008
to 1.0 and the original value of six was greatly reduced to a calibrated values between 0.04 and 0.10.
High values indicate high infiltration which is the case in the study area where sandy soils
predominate. However, all of the precipitation was rapidly going directly to groundwater flow and
as a result, there was no surface flow component. Although many of the soils found in the study area
have permeabilities of 6 in/hr or greater, the infiltration parameter had to be reduced to allow some
surface flow. Although some parameters such as INFILT are physically meaningful, they may not
correspond on a one to one basis with their physical counterparts (in this case, permeability). The
UZSN and LZSN parameter are also examples of this. Both of these parameters were adjusted after
initial estimates were made based on SCS soils information.
The FTABLES or function tables describe the hydraulic performance of the canals. Initially
the HEC-2 program output and cross section profiles from the Black, Crow and Eidsness study were
used to develop these tables. However, it was observed that large changes in stage elevation were
occurring with relatively small changes in discharge values and summer peak discharges were
consistently under estimated. After several unsuccessful attempts to change this with PERLND
parameter alone, rating curves based on USGS stage and discharge records were used to adjust the
FTABLES. The new FTABLES resulted in better correlation of both discharge volumes and
hydrographs. Additional columns were added to the Faka Union Canal FTABLES to represent the
time variant impediments to flow (both aquatic weeds and flashboards) and groundwater seepage
from the Faka Union Canal near the City of Naples wellfield. The use of multiple columns did
improve the results of the simulation.

104
Changes to the parameters governing surface flow length of overland flow (LSUR) and
Manning’s n for overland flow (NSUR) did not prove to be nearly as sensitive as changes to the
subsurface and groundwater parameters. This could be attributed to the fact that the surface
component of runoff is a much smaller percentage of total runoff than the groundwater outflow
component. Generally the effect of these two parameters diminishes as the simulation time step
increases from hourly to daily and as the watershed areas become larger.

105
3-2.3e Verification of the Model
The model was tested for verification using a seven-year simulation period of 1985 to 1992
with the flow data collected at Faka Union Weir No. 1. This station was used for verification
because it records the outflow from the entire watershed and has continuous records of outflow from
1969. The period 1985 to 1992 was chosen because this period covers a representative cycle of
drought and wet years including the relatively dry years of 1988-1990 and the wet years of 1991-
1992. The results as shown in Figure 25 were similar to the calibration results at weir No. 1 for 1970
to 1984. The overall evaluation of model performance to simulated SGGE is discussed in the next
section.
3-3. EVALUATION OF MODEL PERFORMANCE
3-3.1 Presence of Seasonal Variable High Groundwater Table in South Florida Hydrology
One unique element in South Florida hydrology is a seasonally varying water table with a large
amplitude. During the wet season the piezometric head can come up very close to, or above the land
surface. The parameters that can be varied seasonably in HSPF are interception storage
capability(CEPSC), upper zone soil nominal storage(UZSN), manning’s n for overland flow
(NSUR), interflow parameter(INTFW), interflow recession parameter(IRC) and lower zone soil
evaporation parameter(LZETP). These parameters account for changing evaporation/transpiration
rates from vegetation, leaf cover and agricultural practices such as plowing. A varying groundwater
table is not thought to change surface runoff volumes significantly due to its location a fair distance
below ground. Changing soil moisture levels are considered to affect surface runoff significantly,
although changing soil moisture conditions are usually assumed to result from rainfall events rather

106
than by a rising groundwater table and resulting fully saturated soil conditions. These assumptions
do not hold true for the wetlands in south Florida. Throughout a typical year, the water table may
vary by

107
Figure 25
several feet, rising above the land surface during the wet season and dropping during the dry season.
These cyclic groundwater levels affect such hydrologic processes as soil storages, evapotranspiration
from the upper and lower zones of soil horizon, runoff and direction of shallow groundwater flow.
Some seasonal variation of parameters is allowed in HSPF (i.e. seasonal canopy changes), but not
to the extent that it can model a seasonal high water table.
Head differences between the canal water levels and the adjacent groundwater levels vary
seasonally and as a result, changes in groundwater flow direction can occur. A good example of this
change in flow direction in SGGE occurs in the western portion of the Fakahatchee Strand State
Preserve and in the area east of Faka Union Canal between Faka Union Canal Weir No. 5 and I-75.

108
During the wet season when the groundwater levels are high, groundwater may move in a south to
southwest direction. As dry season progresses, the groundwater movement may shift direction to
an east-west pattern, draining directly into one of the north-south canals. A surficial groundwater
movement vector, based on three dimensional finite difference modeling of western Collier County,
is illustrated in Figure 26. In the HSPF model of SGGE, one direction must be chosen for the entire
simulation period and a seasonal shift in the groundwater flow direction cannot be simulated.
3-3.2 Sheetflow Hydraulics
When the water table rises above the land surface and large land areas are flooded, the
existing Pervious Land (PERLND) module of HSPF does not model the sheetflow characteristics
adequately. The extremely flat slopes and depressional storages stretch the assumptions of the
surface runoff model as flow on an inclined plane. A typical expanse of natural south Florida
wetland has the ability to store an enormous amount of water. The existing overland flow
algorithms do not represent the storage effects of these wetlands and thus over estimate the runoff
peaks. During the calibration process, the parameters were adjusted to increase infiltration and
groundwater flow and runoff peaks were matched better. Also evaporation from overland flow is
not represented in the model, because in a typical non-wetland area, overland flow exists for a brief
time period (hours) during or immediately following a rainfall event. In wetland areas where
overland flow may last weeks, evaporation should be accounted for. Further enhancement to the
PERLND module to account for these unique features of south Florida wetlands has been proposed
in a recently undertaken study by the District. The enhanced program can be applied later to update
the SGGE model.

109

110
3-3.3 Reach-Reservoir (RCHRES) Module of HSPF
The outflow hydrograph is sensitive to the function tables (FTABLES) which represents the
stage-storage-outflow characteristics of the canals. The runoff hydrographs were better matched at
Miller Canal at 26th Avenue SE than at Miller Canal Weir No. 1, a location farther downstream.
As the runoff is routed through the canals, inadequate accounting of storage and discharge
relationships along canal reach and flat topography might have resulted in loss of some accuracy.
The modification of the RCHRES module to dynamically route flows through canals with flat bed
slopes and various control structures should enhance the simulation of flow characteristics in South
Florida canals.
3-3.4 Assumptions in Alternative Analysis
Though the application of the PERLND and RCHRES modules of HSPF provides a fair
representation of the existing SGGE hydrology, the alternatives analysis creates new challenges.
Traditional applications of HSPF have included reservoir operations analysis, stormwater
management plan development and water quality studies related to waste treatment, urban and/or
agricultural management practices. The task of representing alternative measures for restoration of
wetland hydrology of SGGE is a unique application. The spreader channel along the north boundary
of SGGE is simulated as a reach discharging into a land segment as lateral inflows. (Refer to
Chapter 4, Section 4-1.2c) This is not the conventional direction of flow in the runoff hydrologic
cycle. A necessary assumption for representing the spreader channel in this way is that the water
from the spreader is spread out evenly over the entire land segment and not along a "line" as in the
real physical world.

111
As the hydrology of SGGE is restored, one might assume certain HSPF parameters as
infiltration factor (INFILT) and those representing soil storages would be different due to the new
nearly saturated or saturated conditions. However, these are calibrated parameters and it is very
difficult to accurately determine the required modification to these parameters.
HSPF does not simulate hydroperiods directly. Instead it simulates various storage zones,
including soil storages, which represent the water holding capacity of the soil layers. There is not,
however, a clear relationship between soil storages and wetland hydroperiods, particularly when an
area becomes fully saturated and inundated. Consequently, the RCHRES module was used to
provide estimates of hydroperiods given reflooded conditions. A more precise methodology for
analyzing wetland hydroperiods is desirable.
3-3.5 Overall Complexity of Modeling SGGE
The SGGE hydrologic regime is complex in that there are strong interactions between the
surface runoff processes, and high groundwater table levels, areas of surface inundation, and even
canal water levels. The hydraulics in the canals are influenced by backwater effects, unrecorded
structural and canal alterations, well pumpage, and adjacent groundwater levels. The modeling of
these complexities were limited by the current version of HSPF in representing unique South Florida
hydrologic conditions such as the overland runoff and infiltration components for high groundwater
table. It is hoped that the proposed modification to the PERLND and RCHRES modules to simulate
wetland storage characteristics and dynamic flood routing would enhance representation of a
complex hydrologic regime like SGGE.
3-4. ASSESSMENT OF HYDROLOGIC CONDITIONS FOR THE SGGE REGION

112
Based on the detailed investigation and foregoing hydrologic-hydraulic modeling of the
SGGE region, the following observations of the existing hydrologic conditions were made:
1. The canals largely control the present hydrology of SGGE. Any sheetflow that exists
is quickly intercepted by a swale and directed to one of the four main canals. During the dry season,
the canals collect groundwater from the adjacent land and discharge it into the Gulf of Mexico. The
average discharge from the Faka Union Canal at the outlet of the basin is 260 cfs with average wet
season flows of 460 cfs. Using a drainage area of 189 square miles, the runoff amounts to 18.7
inches per year.
2. The surficial groundwater flow directions vary seasonally. During dry periods, the
Faka Union Canal system influences the Surficial Aquifer as far as Stumpy Strand and Fakahatchee
Strand. The surficial groundwater flows west into the Faka Union Canal both at a location just east
of the north Faka Union Canal near Stumpy Strand and also just east of the Faka Union Canal
between weirs No. 2 and 3. Additionally, groundwater flows from the western portion of the
Fakahatchee Strand State Preserve into the Prairie Canal. During the wet season when the
groundwater levels are high and the soils are saturated, the Faka Union Canal system has a smaller
contributory drainage area due to the absence of a gradient for groundwater outflow to the stream.
3. The shallow groundwater flow pattern in the SGGE area behaves somewhat like
surface and interflow in that it peaks similarly. Generally groundwater flow is thought to behave in
a gradually varying way, however, much better calibration results were obtained by having a fairly
low active groundwater recession coefficient (AGWRC) which causes a rapid release of groundwater
and produces noticeable groundwater peaks. However, it was also noticed that groundwater release

113
slows down during the dry season, even somewhat abruptly. HSPF does allow a time varying
groundwater recession rate to be used, although the recession rate cannot be arbitrarily chosen. The
algorithm used is that the amount of groundwater outflow is increased as there is inflow but also
decreased by a set amount each day.
4. As the dry season approaches it appears that the groundwater flow at Faka Union
Canal near Weir No. 1 receded at a faster rate during the early years (1970 to 1975) after the
canals were built than later years (1976 to 1984). This indicates that the construction of the canals
not only increased surface runoff, but also increased the rate of groundwater outflow, perhaps
causing groundwater peaks that were not present before the canals were built.
5. Better calibration results were obtained at Faka Union Weir No. 5 when a higher
value for deep fraction (DEEPFR) was used. DEEPFR represents the fraction of groundwater lost
to the deep aquifer, and also could represent groundwater lost to wellfield pumpage. This indicates
that the City of Naples wellfield located between Weirs No. 5 and 4 is benefitting by recharge from
the Faka Union Canal.

114
4. PLAN DEVELOPMENT
4-1. DEVELOPMENT OF ALTERNATIVE RESTORATION PLANS
4-1.1 Criteria for Plan Development
Within the purview of the developed hydrologic-hydraulic model, alternative
structural/nonstructural measures to modify the existing water management system of SGGE were
evaluated to accomplish the following objectives of the project:
1. Wetland hydroperiod restoration (pre-Golden Gate Estates development),
2. Surface water sheetflow restoration,
3. Replacement of concentrated shock load discharges to estuaries with distributed
sheetflow,
4. Improved water storage and aquifer recharge,
5. Enhanced surface water deliveries to the adjacent Fakahatchee Strand State Preserve,
6. Reduction of over-drainage of Fakahatchee Strand,
7. Reduction of over-drainage of the adjacent Florida Panther National Wildlife Refuge,
8. Maintenance of existing flood protection for areas north of I-75.
The criteria in identifying a set of restoration alternatives were geared toward developing a
hydrologic regime that is compatible with achieving these objectives. Plans were formulated on the
assumption that the entire extent of the lands identified under the CARL Program will be under
public ownership of the State of Florida.
Although it is not listed as one of the objectives, there is an “uplands” criteria which involves
preservation of the hydroperiod of existing uplands. It is important to clarify the definition of

115
uplands and their corresponding hydroperiod regime. This study uses as a reference a study called
“The Big Cypress National Preserve” (Duever et al., 1986) which describes various vegetation
communities found in the Big Cypress National Preserve located nine miles to the east of SGGE.
Much of the vegetation that is found in the Preserve is very similar to that which is found in SGGE.
For the purpose of this study, “uplands” are defined to be “Pine Forests” as described in the above
reference. Pine forests are divided into two primary types, distinguished by their dominant under
story vegetation. The hydroperiod regime for both of these forests is described as follows. “...dry
or only shallowly inundated conditions with a short hydroperiod of about 20-60 days annually
(Duever et al., 1978). Klein et al. (1970) found that maximum water levels usually just reached the
surface of the soil. Pine forests with a saw palmetto under story are generally found on drier sites,
while those with a mixed grass under story are on wetter sites (Duever et al., 1986).” Normal
maximum water depths are shown as less than six inches. This criteria is used to determine whether
upland hydroperiods are preserved (not exceeded) under the restoration scenarios.
In order to quantify the system's response with respect to the hydrologic and hydraulic
evaluation of the alternatives, various model outputs were analyzed. The various storage zones
(upper zone soil, lower zone soil and groundwater storage) were analyzed. Also considered were
the runoff volumes at Faka Union Weir No. 1 and over the entire basin. A simplified approach was
used to estimate general hydroperiods for the SGGE area. The base conditions to which the
alternatives were compared was the current system for which the model is calibrated as well as pre-
development conditions. A 23-year simulation was run (1970-1992) for both the existing system and
the alternatives.

116
4-1.2 Identification of Alternatives
Several previous studies suggested weir type water control structures on the canals as the
primary means for reduction of overdrainage and restoration of the overall hydrology of SGGE.
Weir structures would meet the objectives of increased water storage and aquifer recharge, but they
would not eliminate the freshwater point load discharge into Faka Union Bay and fully restore
wetland hydroperiods. Therefore, they do not meet all the objectives of the project and alternatives
of this type were not investigated further. Five alternative restoration measures were formulated to
accomplish the stated objectives of the project and are described below.
4-1.2a Alternative 1: Diversion Structure
This alternative considers the interim plan investigated earlier by the Big Cypress Basin.
It includes a flow diversion structure with three 48-inch diameter gated culverts and a spreader
channel located approximately one mile north of Faka Union Canal Weir No. 1 (see Figure 27). The
culverts will divert up to 50 percent of the existing base flow to the spreader channel. The
dissipated flows will be conveyed through public lands owned by the Fakahatchee Strand State
Preserve (Florida Department of Environmental Protection) to distribute through the bridges under
U. S. 41. These diverted flows will be dissipated and filtered through wet prairies as sheetflow to
the Faka Union Bay. This is a partial plan, and not expected to achieve the full range of objectives
identified for the SGGE restoration project.
4-1.2b Alternative 2: Spreader Channel and Canal/Road Removal Plan
This alternative, as shown in Figure 28, considers one spreader channel immediately below
I-75 extending from the western boundary of the SGGE study area eastward nearly to the western

117
boundary of the Fakahatchee Strand State Preserve. This plan also considers removal of all roads
and canals south of Alligator Alley with provision of pumps on the Miller, Faka Union and Merritt
Canals for flood control of the NGGE. This alternative is intended to provide insight to
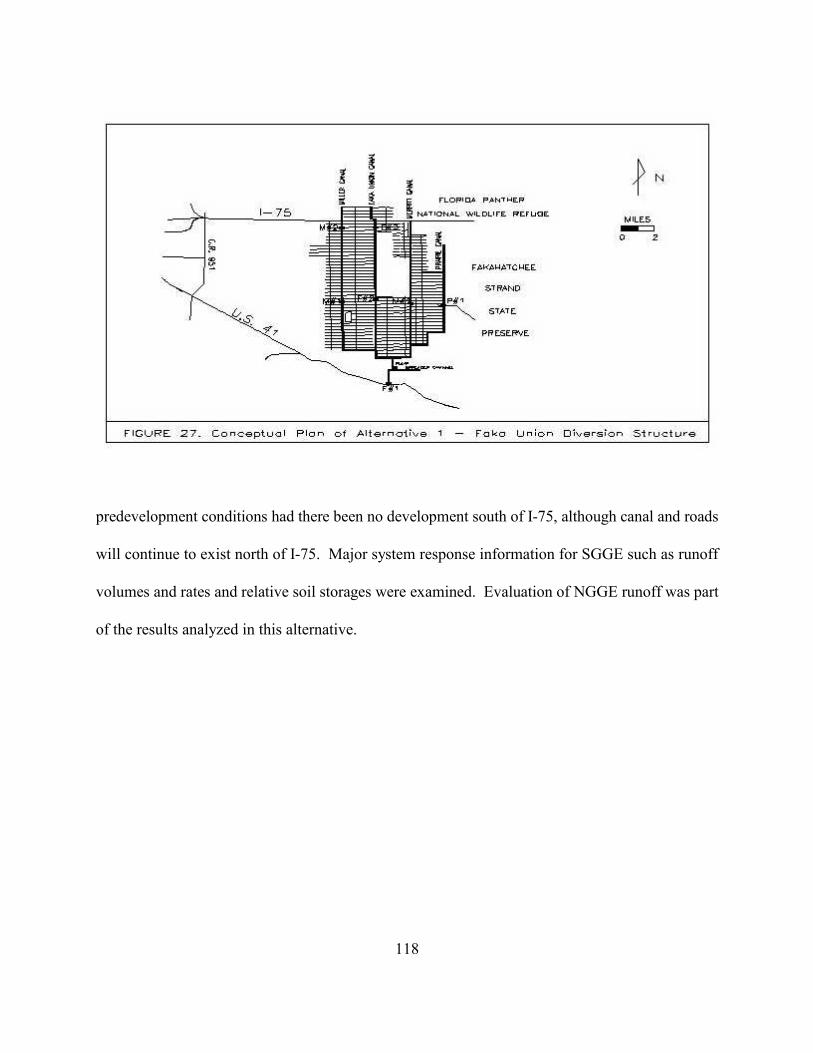
118
predevelopment conditions had there been no development south of I-75, although canal and roads
will continue to exist north of I-75. Major system response information for SGGE such as runoff
volumes and rates and relative soil storages were examined. Evaluation of NGGE runoff was part
of the results analyzed in this alternative.

119

120
4-1.2c Alternative 3: Spreader Channels, Canal Blocks and Selected Road Removal
Plan
Three configurations of structural elements were formulated for Alternative 3, all of which
have some common key components. These are (a) spreader channels, (b) pump stations on each of
the three major north-south canals which contribute drainage from NGGE, © removal or grading
down of selected roads and old tram lines, (d) canal plugs and roadside swale blocks, (e) elimination
of canal maintenance south of the spreader channel locations, and (f) continuation of the
groundwater level monitoring program. These elements are described in detail below.
(a) Spreader Channels
A typical spreader channel, shown in Figure 29, accepts pumped flow from one of the three
main incoming north-south canals and spreads the water over a broad east-west front. The pumps
discharge into a stilling basin to reduce the flow velocities as they enter the spreader.
The purpose of the spreader channel is twofold. First, it must receive flow from the north-
south canals and redirect this flow in an east-west direction. Secondly, it must redistribute the flow
in a broad shallow front across the land surface, usually by overtopping its downstream (in this case
south) bank and discharging onto the land surface. If only the first purpose was important, a channel
cross-section similar to the current GAC canals could be used. However, the backwater effects of
raising the water surface elevation in the spreader channel high enough to allow overtopping and

121
discharge onto the land surface would compromise flood protection for the upstream portions of the
north-south canals. In order to maintain flood protection north of I-75, two water levels must be
maintained and separated in the canal with the downstream or south end at the necessary higher level
(i.e. at or slightly above ground) and the upstream or north end at the lower level.
The proposed spreader is a relatively shallow channel. As shown in Figure 30, the water
surface elevation is “stepped up” by pumping into the spreader channel and the water then flows
by gravity onto the land surface by overtopping the spreader banks. The bed of the spreader
channel is sloped to allow the water to reach the remote ends of the spreader channel. Water is
prevented from backing up to the north by a north berm and by natural topography. A seepage ditch
collects the seepage and returns it to the spreader channel.
Earlier studies of the SGGE canal system suggested possible spreader channels on the Prairie
Canal and near the outlet of the system along U.S. 41. However, the alternatives considered in this

122
study propose complete removal of channelized flow south of I-75. Therefore, any additional
spreader channel located south of the initial spreader channels would be impractical due to lack of
channelized inflow available at these locations. Consequently, restoration elements of that type were
not considered in any of the alternatives.
The spreader channels discharge into the headwaters of several major flowways (or sloughs)
in SGGE. Flood conveyance through the SGGE sloughs is a significant constraint for design of the
spreader channels. These flowways have an optimal water stage (and corresponding conveyance
capacity) with respect to the requirements of local flora and fauna. One must limit design flows to
what the sloughs can convey at a reasonable stage. Higher design flows mean higher water stages
in the sloughs and surrounding areas, which may not meet the criteria of restoring historic

123
(pre-Golden Gate Estates) hydroperiods. This constraint is taken into account in the design of the
pump station/spreader channel system.
(b) Pump Stations
As indicated above, the pump stations are an integral part of the spreader channel system.
With the elimination of the gravity drainage system south of I-75 in the Faka Union basin, pumping
stations are necessary to maintain and possibly enhance flood protection for areas north of I-75
within this basin. It is suggested that these pump stations be located directly upstream of the
spreader channels to minimize the fill required for berm construction and to reduce the friction head
loss as the flow travels form the pump to the spreader channel. The pumps are sized to pass an
average daily discharge equivalent to peak canal discharge of a 10-year return frequency storm event
and increase the head sufficiently to allow discharge from the spreader channels onto the land surface
(design head of 5.5 to 6.5 feet). The size of the pumps required are related to their location in

124
SGGE. The farther south the pumps are placed, the larger the pump must be to accommodate the
larger flows.
The sizing of the pumps is critical to the success of the project, as the pumps will provide
flood protection for a portion of NGGE. Therefore, a careful analysis of the flows from NGGE to
SGGE across I-75 was made. As observed flow data on the canals near I-75 are not available, flood
flow frequency analysis was performed on the simulated flows. A summary of flood flows at this
location from this analysis and also from a few earlier analyses is presented in Table 6. Stage and
flow measurements taken in the vicinity of I-75 would improve the accuracy of flood flow
predictions.
Backpumping capabilities for the pump stations is included in the plan. Backpumping into
the upper reaches of the canal system near the City of Naples’ and County’s wellfield would meet
the project goal of improving water supply storage. Increased canal storage and aquifer recharge
north of the pump stations will also be achieved by maintenance of water levels to within one to two
feet of ground surface during the dry season by adjusting the operation schedule of the pumps. These
levels will be a significant improvement over the existing storage capability of structures Miller No.
2 and Faka Union No. 3, both with a weir crest elevation of 6.2 NGVD.

125
TABLE 6
FLOOD FREQUENCY ANALYSES FOR FLOWS ACROSS I-75
Gulf America CorporationDate of Analysis: 1965Method of Calculation: Rational Formula
Miller Bridge Faka Union Bridge Merritt BridgeDrainage Area(sq. mi.): 7.5 30 4.510- year discharge (cfs): 450 1180 34625-year discharge (cfs): NA NA NA
Black, Crow & EidsnessDate of Analysis: 1974Method: SCS Flood Peak Formula
Miller Bridge Faka Union Merritt BridgeDrainage Area (sq. mi.): 10 62 310-year discharge (cfs): 418 1342 19425-year discharge (cfs): 529 1726 243
Greiner Engineering Sciences, Inc.Date of Analysis: 1983Method: USGS Stream Gage Analysis & Extrapolation
Miller Bridge Faka Union Merritt BridgeDrainage Area (sq. mi.): --------------48------------- 7410-year discharge (cfs): -------------590------------- 41525-year discharge (cfs): -------------800------------- 560
U.S. Army Corps of EngineersDate of Analysis: 1986Method: HEC-1
Miller Bridge Faka Union Merritt BridgeDrainage Area (sq. mi.): NA NA NA10-year discharge (cfs): 550 1540 NA25-year discharge (cfs): 590 1890 NA
This StudyDate of Analysis: 1995Method: HSPF Continuous Simulation
Miller Bridge Faka Union Merritt BridgeDrainage Area (sq. mi.): 10 62 310-year discharge (cfs): 128 417 160

126
25-year discharge (cfs): 180 499 238

127
All configurations of this alternative have three pump stations, one located on each major
north-south canal. The proposed pump stations for the Miller and Merritt Canals include two pumps
each, while the pump station for the Faka Union canal has four pumps. The capacities of the pumps,
however, are dependent on the volumetric rate of flow at that point in the canal. All pump stations
include backup generators and seepage pumps. Additionally, two portable pumps are available for
operation when a pump needs maintenance and is not operational.
(c) Road Removal
Given that there are approximately 290 miles of roads in SGGE, their complete removal is
neither economically feasible nor necessary to achieve reestablishment of sheetflow. The criteria
for selection of a particular segment of road for removal were based on those roads that intercepted
major flowways, those located at the north end of SGGE and those roads having the greatest
environmental impact. The major flowways were determined using information from topographic
maps, soils and vegetation maps, aerial photographs, satellite images and field inspections.
The roads crossing major flowways were considered top priority for removal. Removal of
roads beginning at the north end ensures a flowway from the spreader channels and prevents any
backing up of water. As the water flows south, and farther from development and I-75, the lesser
is the impact from any damming effect of the roads. The paved roads tend to be wider and possibly
higher than the side dirt roads, some of which have overgrown to merely a narrow path. Therefore,
the paved roads were considered to have a greater impact on the environment.
Old logging tram lines are scattered throughout SGGE and are an impediment to sheetflow.

128
Using the road removal as a guide, the tram paths are proposed to be leveled where they intercept
a major flowway.
(d) Canal Plugs/Swale Blocks
The canals in SGGE have been responsible for the overall degradation of the hydrology and
ecology of the area, more so than the roads, due to their ability to intercept the upper part of the
Water Table Aquifer. Therefore, complete elimination of channelized flow south of I-75 is
suggested through placement of canal plugs. Canal locations that intercept major flowways are
considered a top priority location for installation of canal plugs. The suggested material for the plugs
is spoil and crushed limerock which is available from the adjacent canal banks and roads designated
for removal. The mild slopes of the plugs provide stability when overtopping occurs during wet
periods and create both shallow and deep water habitat for wildlife and fish. The configuration of
a typical earthen plug is shown in Figure 31. Much of the open water area in the canals will remain.
Only less than one percent of the 540 acres of open water canals will be filled in for the plugs. Open
stretches of water in the plugged canals will vary in length from 1,320 feet to two miles between
plugs with many reaches of one quarter to one mile in length. Additionally, roadside swales should
be blocked at the point where it enters the canal at each plug site. Without these blocks, flow would
back up into the swale, cross the road to the downstream swale and discharge back into the canal,
bypassing any block in the canal.

129
(e) Elimination of Canal Maintenance South of the Spreader Channels and Removal of
Existing Weir Structures
Elimination of the ongoing aquatic weed control activities for canal maintenance in the major
canals would further restrict the conveyance capacity of the remnant canals and help to reduce
channelized flow. Since the canals south of I-75 would cease to act like canals, the weir structures
would become obsolete. The affected weirs would be Miller No.1, Faka Union No. 2, Merritt No.1
and Prairie No.1. Faka Union No.1 would remain unaffected. The concrete portion and sheet piles
of these structures could be left intact if they pose no environmental problem, however, the steel
walkways and gates may be salvaged.

130
(f) Groundwater Level Monitoring Program
The current groundwater monitoring wells maintained by the USGS and the Fakahatchee
Strand State Preserve staff should be continued and possibly enhanced to provide comparison data
for investigation of the success or efficiency of the restoration efforts relative to the pre-restoration
conditions.
A. Alternative 3A
The configuration of Alternative 3A is shown in Figure 32. Structural elements include two
spreader channels, three pump stations (total of eight pumps), removal of 114 miles of roads, and
installation of 11 canal plugs. Nonstructural elements include elimination of canal maintenance
south of the spreader locations and continuation of a groundwater level monitoring program.
The first spreader channel abuts I-75 and extends 4.85 miles eastward from Everglades
Boulevard to approximately one and a half miles east of Merritt Canal. The inflow to this spreader
would be the discharges from the Faka Union Canal and the north Merritt Canal. The spreader is
located approximately 200 feet south of I-75. The second spreader channel collects flows from the
Miller Canal and extends 1.65 miles from the western boundary of SGGE to Everglades Boulevard
and is located approximately one and a half miles south of I-75. Several upland areas exist just south
of I-75 within a mile of Miller Canal. Locating the spreader south of these uplands would prevent
water from circumventing the islands and backing up to the west. As part of the analysis of this
alternative, a groundwater flow model was developed to evaluate the spreader channel’s influence
on I-75.

131

132
The Miller Canal pump station involves two 90 HP pumps that have the combined capacity
to move the design flow of 200 cfs and raise the head by five and a half feet. The Faka Union Canal
pump station has four 115 HP pumps that together can pass 417 cfs with an increase in head of six
and a half feet. The Merritt Canal pump station has two 85 HP pumps designed to pass a total flow
of 160 cfs with a six and a half feet head. It is expected these pumps will operate approximately four
months of the year. This alternative requires the smallest pumps because they are farthest north.
This alternative also includes 114 miles of road removal and installation of 11 canal plugs.
The concept of this plan originated from earlier studies done by the Golden Gate Estates
Redevelopment Committee and later evaluated by the COE in which a few strategically placed plugs
were suggested. Canal maintenance south of the spreaders would be eliminated in this plan and
groundwater level monitoring would continue.
B. Alternative 3B
The primary structural elements in Alternative 3B are shown in Figure 33. The major
modifications from Alternative 3A are the location of the spreader channels and pump stations, the
number of canal blocks and the miles of road removal.

133

134

135

136
The spreader channels were located farther south, approximately two and a quarter miles
south of Alligator Alley. The main reasons for shifting the spreaders south were (1) concern of the
effects of the groundwater mound generated by the spreader on I-75 and (2) presence of non-hydric
soils near I-75. The spreader channel of the Miller Canal parallels 64th Avenue SE with an east-west
length of one mile. The Faka Union Canal spreader parallels the south side of 66th Avenue SE with
an east-west length of two and a quarter miles. The Merritt Canal spreader parallels 62nd Avenue
SE and equals approximately one and a half miles in length.
The Miller Canal pump station requires two 90 HP pumps to pass the design flow of 200 cfs
with a five and a half feet head increase. The Faka Union Canal pump station has four 135 HP
pumps that together can pass 500 cfs with an increase in head of six and a half feet. The Merritt
Canal pump station has two 90 HP pumps designed to pass 165 cfs with a six and a half feet head.
It is expected these pumps will also operate approximately four months of the year. This
alternative requires the largest pumps because they are farthest south.
Alternative 3B involves removal of 128 miles of road, a slight increase from Alternative 3A.
The number of canal blocks are significantly increased from 11 to 82. Open stretches of water that
are several miles long provide localized drainage, especially during the dry season and early in the
wet season when canal stages are low. Therefore, increased canal blocks would inhibit drainage
notably. Canal maintenance south of the spreaders would be eliminated and groundwater level
monitoring would continue.
C. Alternative 3C

137
Alternative 3C, shown in Figure 34, is very similar to 3B except the pump station and
spreader channel for the Merritt Canal is located farther north. This reduces the size of the pumps

138

139
but requires an additional canal plug and two more miles of road removal.
The Miller Canal spreader channel parallels 64th Avenue SE for a length of 4,488 feet. The
Faka Union Canal spreader parallels the south side of 66th Avenue SE with an approximate east-
west length of one and a third miles. The Merritt Canal spreader parallels 54th Avenue SE and
equals approximately 1,425 feet in length.
The Miller Canal pump station requires two 90 HP pumps to pass the design flow of 200 cfs
with a five and a half feet head increase. The Faka Union Canal pump station has four 135 HP

140
pumps that together can pass 500 cfs with an increase in head of six and a half feet. The Merritt
Canal pump station has two 85 HP pumps designed to pass 160 cfs with a six and a half feet head.
It is expected these pumps will operate approximately four months of the year.
Alternative 3C involves 130 miles of road removal, a slight increase from Alternative 3B,
and installation of eighty-three canal plugs. Canal maintenance south of the spreaders would be
eliminated and groundwater monitoring would continue.
4-1.3 Cost Analysis of Plans
Cost estimates for the implementation of the five alternatives are presented below. All costs
are in 1995 dollars. The unit rate cost values of the construction costs are adapted from the SFWMD
Construction and Land Management Department’s 1995 cost indices for similar construction
projects.
4-1.3a Estimates of First Costs
An estimate of the first costs for each of the alternatives is outlined in Tables 7 through 11.
4-1.3b Estimates of Annual Operation and Maintenance
An estimate of the annual operation and maintenance costs for each alternative is shown in
Table 12.

141
TABLE 7
FIRST COST ESTIMATE IN 1995 DOLLARS FOR ALTERNATIVE 1DIVERSION STRUCTURE WITH THREE 48-INCHGATED CULVERT WITH SPREADER CHANNEL
DESCRIPTION
QUANTITYUNIT
EQUIPMENT
LABOR MATERIAL TOTAL($)
UnitCost
Total
UnitCost
Total UnitCost
Total
1. MOB/DEMOB
L.S. 7,500
2. EquipmentRental
L.S. 5,000
3. CanalExcavation
1500 C.Y. 2 1 4,500
4. Detour Road L.S. 10,000
5. Site Fencing L.S. 2,500
6. Clearing L.S. 5,000
7. General SiteWork
L.S. 5,000
8. Pumpa) 36" (30,000GPM) Pumpb) Motor &Drivec) Piped) Flap Gatee) ServicePlatform
1125 ft.11
1500 300 30 300
1500 700 50 400
40,00010,000 150 4,000
43,000 11,000 5,750 4,700 10,000
9. Electricala) Control Panelb) Float Controls
11
300 100
20001000
10,000 2,000
12,300 3,100

142
DESCRIPTION
QUANTITYUNIT
EQUIPMENT
LABOR MATERIAL TOTAL($)
c) Racewaysd) Testinge) Service
L.S.L.S.L.S. * * *
5,000 2,000
10. Sand CementEndwalls 1000 c.f. 7 7,000
11. Excavation/Backfill forPump
L.S. 3,000
Subtotal 146,350
O&P Bond @18%
26,343
TOTAL 172,693
* Not included at this time.

143
TABLE 8
FIRST COST ESTIMATE IN 1995 DOLLARS FOR ALTERNATIVE 21
SPREADER CHANNEL WITH REMOVAL OF ROADS AND FILLING OF CANALS
ITEM DESCRIPTION QUANTITY
UNIT UNIT COST ESTIMATECOST ($)
1. Canal Plugs & Swale Blocks
a) Fill (including hauling, grading & compaction)2
Prairie Merritt Faka Union Miller Total
931,6271,554,2763,521,5641,645,2097,652,676
C.Y.C.Y.C.Y.C.Y.C.Y. 8.00
Subtotal
61,221,408
61,221,408
2. Spreader Channels
Main Spreader a) Mobilization/Demobilization b) Clearing c) Excavation & Fill (including grading & compaction) d) Riprap 12" layer (large) 6" layer (bedding)
194.54
293,627
276138
L.S.AC.
C.Y.
C.Y.C.Y.
20,000.0014,275.00
4.00
45.0030.00
Subtotal
20,0001,349,559
1,174,508
12,4204,140
2,540,627

144
ITEM DESCRIPTION QUANTITY
UNIT UNIT COST ESTIMATECOST ($)
3. Pump Stations
Main Spreader a) Pumps (Merritt) 80 cfs (85 HP) b) Installation and Sitework c) Backup Generator d) Pumps (Faka) 105 cfs (115 HP) e) Installation and Sitework f) Backup Generator g) Pumps (Miller) 65 cfs (70 HP) h) Installation and Sitework I) Backup Generator j) Portable Pump 500 cfs (530 HP) k) Portable Pump 150 cfs (160 HP) l) Seepage Pump 25 cfs (20 HP)
211411211112
L.S.L.S.L.S.L.S.L.S.L.S.L.S.L.S.L.S.L.S.L.S.L.S.
84,000.0057,600.0075,000.00
103,000.0065,040.00
140,000.0072,500.0057,600.0080,000.00
405,500.00144,500.00
40,000.00
Subtotal
168,00057,60075,000
412,00065,040
140,000145,000
57,60080,000
405,500144,500
80,000
1,830,240
4. Road and Tram Removal
a) Mobilization/Demobilization b) Demolition of Paving (3" thick) c) Excavation of Limerock Road d) Tram line leveling
2539,733954,311
29,630
L.S.S.Y.C.Y.C.Y.
20,000.004.004.003.00
Subtotal
40,0002,158,9323,817,244
88,8906,105,066
5. Weir Structure Removal (gates only,no concrete)
Gated Structure Removal (Prairie #1,Merritt #1, Faka Union #2, & Miller #1) 4 L.S. 5,000.00
Subtotal20,00020,000
SubtotalContingency @ 15%
TOTAL
71,717,34110,757,601
82,474,942
Notes:1. Cost Estimate does not include land acquisition costs, permit fees, and extension of electric utility lines.2. All fill estimates include 20% extra for spills.

145
TABLE 9
FIRST COST ESTIMATE IN 1995 DOLLARS FOR ALTERNATIVE 3A1
TWO SPREADER CHANNELS/ ROAD REMOVAL/CANAL PLUGS
ITEM DESCRIPTION QUANTITY UNIT UNITCOST
ESTIMATECOST ($)
1. Canal Plugs & Swale Blocks
a) Fill (including hauling, grading & compaction)2
Prairie Merritt Faka Union Miller Total b) Dewatering c) Riprap 12" layer (large) 6" layer (bedding) d) Swale Blocks
3,7706,468
17,1744,488
31,90011
3,7841,892
121
C.Y.C.Y.C.Y.C.Y.C.Y.PER
PLUG
C.Y.C.Y.C.Y.
8.001,500.00
45.0030.00
4.00
Subtotal
255,20016,500
170,28056,760
484
499,224
2. Spreader Channels
Main Spreader a) Mobilization/Demobilization b) Clearing c) Excavation & Fill (includinggrading & compaction) d) Riprap 12" layer (large) 6" layer (bedding)
Miller Spreader a) Mobilization/Demobilization b) Clearing c) Excavation & Fill (includinggrading & compaction) d) Riprap 12" layer (large) 6" layer (bedding)
170.54
219,091
18090
124
74,536
9246
L.S.AC.
C.Y.
C.Y.C.Y.
L.S.AC.
C.Y.
C.Y.C.Y.
20,000.0014,275.00
4.00
45.0030.00
20,000.0014,275.00
4.00
45.0030.00
Subtotal
20,0001,006,959
876,364
8,1002,700
20,000342,600
298,144
4,1401,380
2,580,387

146
ITEM DESCRIPTION QUANTITY UNIT UNITCOST
ESTIMATECOST ($)
3. Pump Stations
Main Spreader a) Pumps (Merritt) 80 cfs, 85 HP b) Installation and Sitework c) Backup Generator d) Pumps (Faka) 105 cfs, 115 HP e) Installation and Sitework f) Backup Generator g) Seepage Pump 25 cfs (20 HP)
Miller Spreader a) Pumps - 100 cfs, 90 HP b) Installation and Sitework c) Backup Generator d) Seepage Pump 25 cfs (20HP)
Portable Pumps a) Portable Pump 500 cfs (530 HP) b) Portable Pump 150 cfs (160 HP)
2114111
2111
11
L.S.L.S.L.S.L.S.L.S.L.S.L.S.
L.S.L.S.L.S.L.S.
L.S.L.S.
84,000.0057,600.0075,000.00
103,000.0065,040.00
140,000.0040,000.00
99,000.0057,600.0080,000.0040,000.00
405,500.00144,500.00
Subtotal
168,00057,60075,000
412,00065,040
140,00040,000
198,00057,60080,00040,000
405,500144,500
1,883,240
4. Road and Tram Removal
a) Mobilization/Demobilization b) Demolition of Paving (3" thick) c) Excavation of Limerock Road d) Tram line leveling
2539,733265,956
29,630
L.S.S.Y.C.Y.C.Y.
20,000.004.004.003.00
Subtotal
40,0002,158,9321,063,824
88,890
3,351,646
5. Weir Structure Removal (gates only, noconcrete)
Gated Structure Removal (Prairie #1,Merritt #1, Faka Union #2, & Miller#1)
4 L.S. 5,000.00
Subtotal
20,000
20,000
SubtotalContingency @ 15%
8,334,4971,250,175

147
ITEM DESCRIPTION QUANTITY UNIT UNITCOST
ESTIMATECOST ($)
TOTAL 9,584,672Notes:1. Cost Estimate does not include land acquisition costs, permit fees, and extension of electric utility lines.2. All fill estimates include 20% extra for spills and compaction.
TABLE 10
FIRST COST ESTIMATE IN 1995 DOLLARS FOR ALTERNATIVE 3B1
THREE SPREADER CHANNELS/ROAD REMOVAL/CANAL BLOCKS
ITEM DESCRIPTION QUANTITY UNIT UNITCOST
ESTIMATECOST ($)
1. Canal Plugs & Swale Blocks
a) Excavation & Fill (includinggrading & compaction)2
Prairie Merritt Faka Union Miller Total b) Dewatering c) Riprap 12" layer (large) 6" layer (bedding) d) Swale Blocks
27,06459,92774,16563,633
224,78982
27,30113,651
902
C.Y.C.Y.C.Y.C.Y.C.Y.
PER PLUG
C.Y.C.Y.C.Y.
8.001,500.00
45.0030.00
4.00 Subtotal
1,798,312123,000
1,228,545409,530
3,6083,562,995
2. Spreader Channels
Merritt Spreader a) Mobilization/Demobilization b) Clearing c) Excavation & Fill (includinggrading & compaction) d) Riprap 12" layer (large) 6" layer (bedding)Faka Union Spreader a) Mobilization/Demobilization b) Clearing c) Excavation & Fill (includinggrading
123.27
72,277
9246
132.73
101,640
L.S.AC.
C.Y.
C.Y.C.Y.
L.S.AC.
C.Y.
20,000.0014,275.00
4.00
45.0030.00
20,000.0014,275.00
4.00
20,000332,218
289,109
4,1401,380
20,000467,221
406,560

148
ITEM DESCRIPTION QUANTITY UNIT UNITCOST
ESTIMATECOST ($)
& compaction) d) Riprap 12" layer (large) 6" layer (bedding)Miller Spreader a) Mobilization/Demobilization b) Clearing c) Excavation & Fill (includinggrading & compaction) d) Riprap 12" layer (large) 6" layer (bedding)
9246
114.55
45,173
9246
C.Y.C.Y.
L.S.AC.
C.Y.
C.Y.C.Y.
45.0030.00
20,000.0014,275.00
4.00
45.0030.00
Subtotal
4,1401,380
20,000207,701
180,692
4,1401,380
1,960,061
3. Pump Stations
Merritt a) Pumps - 83 cfs, 90 HP b) Installation and Sitework c) Backup Generator d) Seepage Pump 25 cfs (20 HP)Faka Union - 125 cfs, (135 HP) a) Pumps b) Installation and Sitework c) Backup Generator d) Seepage Pump 25 cfs (20 HP)Miller a) Pumps - 100 cfs (90 HP) b) Installation and Sitework c) Backup Generator d) Seepage PumpPortable Pumps a) Portable Pump 500 cfs (530 HP) b) Portable Pump 150 cfs (160 HP)
211114111
2111
11
L.S.L.S.L.S.L.S.L.S.L.S.L.S.L.S.L.S.
L.S.L.S.L.S.L.S.
L.S.L.S.
87,000.0057,600.0075,000.0040,000.0075,000.00
137,000.0065,040.00
140,000.0040,000.00
99,500.0057,600.0080,000.0040,000.00
405,500.00144,500.00
Subtotal
174,00057,60075,00040,00075,000
548,00065,040
140,00040,000
199,00057,60080,00040,000
405,500144,500
2,066,240
4. Road & Tram Line Removal
a) Mobilization/Demobilization b) Demolition of Paving (3" thick) c) Excavation of Limerock Road d) Tram line leveling
3448,213350,436
29,630
L.S.S.Y.C.Y.C.Y.
20,000.004.004.003.00
Subtotal
60,0001,792,8531,401,742
88,8903,343,485
5. Weir Structure Removal (gates only, no

149
ITEM DESCRIPTION QUANTITY UNIT UNITCOST
ESTIMATECOST ($)
concrete)
Gated Structure Removal (Prairie #1,Merritt #1, Faka Union #2, & Miller#1)
4 L.S. 5,000.00Subtotal
20,00020,000
Sub-totalContingency @ 15%
TOTAL
10,952,7811,642,917
12,595,698
Notes:1. Cost Estimate does not include land acquisition costs, permit fees, and extension of electric utility line.2. All fill estimates include 20% extra for spills and compaction.
TABLE 11
FIRST COST ESTIMATE IN 1995 DOLLARS FOR ALTERNATIVE 3C1
THREE SPREADER CHANNELS/ROAD REMOVAL/CANAL BLOCKS
ITEM DESCRIPTION QUANTITY
UNIT UNITCOST
ESTIMATECOST ($)
1. Canal Plugs & Swale Blocks
a) Fill (including hauling, grading& compaction)2
Prairie Merritt Faka Union Miller Total b) Dewatering c) Riprap 12" layer (large) 6" layer (bedding) d) Swale Blocks
27,06461,56374,16563,633
226,42586
27,50413,753
946
C.Y.C.Y.C.Y.C.Y.C.Y.PER
PLUG
C.Y.C.Y.C.Y.
8.001,500.00
45.0030.00
4.00
Subtotal
1,811,400129,000
1,237,680412,590
3,784
3,594,454

150
ITEM DESCRIPTION QUANTITY
UNIT UNITCOST
ESTIMATECOST ($)
2. Spreader Channels
Merritt Spreader a) Mobilization/Demobilization b) Clearing c) Excavation & Fill (including grading & compaction) d) Riprap 12" layer (large) 6" layer (bedding)
Faka Union Spreader a) Mobilization/Demobilization b) Clearing c) Excavation & Fill (including grading & compaction) d) Riprap 12" layer (large) 6" layer (bedding)
Miller Spreader a) Mobilization/Demobilization b) Clearing c) Excavation & Fill (including grading & compaction)
13.93
32,184
9246
118.76
58,274
9246
112.36
38,397
L.S.AC.
C.Y.
C.Y.C.Y.
L.S.AC.
C.Y.
C.Y.C.Y.
L.S.AC.
C.Y.
20,000.0014,275.00
4.00
45.0030.00
20,000.0014,275.00
4.00
45.0030.00
20,000.0014,275.00
4.00
20,00056,101
128,736
4,1401,380
20,000267,799
233,096
4,1401,380
20,000176,491
153,588

151
ITEM DESCRIPTION QUANTITY
UNIT UNITCOST
ESTIMATECOST ($)
d) Riprap 12" layer (large) 6" layer (bedding)
9246
C.Y.C.Y.
45.0030.00
Subtotal
4,1401,380
1,092,371
3. Pump Stations
Merritt a) Pumps - 80 cfs, 85 HP b) Installation and Sitework c) Backup Generator d) Seepage Pump 25 cfs (20 HP)Faka Union a) Pumps -125 cfs, 135 HP b) Installation and Sitework c) Backup Generator d) Seepage Pump 25 cfs (20 HP)Miller a) Pumps - 100 cfs, 90 HP b) Installation and Sitework c) Backup Generator d) Seepage Pump 25 cfs (20 HP)Portable Pumps a) Portable Pump 500 cfs (530 HP) b) Portable Pump 150 cfs (160HP)
2111
4111
2111
11
L.S.L.S.L.S.L.S.
L.S.L.S.L.S.L.S.
L.S.L.S.L.S.L.S.
L.S.L.S.
84,000.0057,600.0075,000.0040.000.00
137,000.0065,040.00
140,000.0040,000.00
99,500.0057,600.0080,000.0040,000.00
405,500.00144,500.00
Subtotal
168,00057,60075,00040,000
548,00065,040
140,00040,000
199,00057,60080,00040,000
405,500144,500
2,060,240
4. Road Removal & Tram Leveling
a) Mobilization/Demobilization b) Demolition of Paving (3" thick)
3452,906
L.S.S.Y.
20,000.004.00
60,0001,811,624

152
ITEM DESCRIPTION QUANTITY
UNIT UNITCOST
ESTIMATECOST ($)
c) Excavation of Limerock Road d) Tram Leveling
351,31629,630
C.Y.C.Y.
4.003.00
Subtotal
1,405,26488,890
3,365,778
5. Weir Structure Removal (gatesonly, no concrete)
Gated Structure Removal (Prairie#1, Merritt #1, Faka Union #2, &Miller #1) 4 L.S. 5,000.00
Subtotal20,00020,000
SubtotalContingency @ 15%
TOTAL
10,132,8431,519,926
11,652,769
Notes:1. Cost Estimate does not include land acquisition costs, permit fees and extension of electric utility lines.2. All fill estimates include 20% extra for spills and compaction.

153
TABLE 12
COST ESTIMATE OF ANNUAL OPERATION AND MAINTENANCE
($) 1 2 3A 3B 3C
PUMP OPERATION1 25,980 76,005 81,435 93,070 89,973
MAINTENANCE2 3,000 13,000 13,000 9,700 4,800
TOTAL 28,980 89,005 94,435 102,770 94,773
Notes:
1. Pumping Cost:
Alternative 167cfs for 4 mo. equals 5,196 MG/yr x $5/MG = $ 25,980
Alternative 2196cfs for 4 mo. equals 15,201 MG/yr x $5/MG = $ 76,005
Alternative 3A210cfs for 4 mo. equals 16,287 MG/yr x $5/MG = $ 81,435
Alternative 3B240cfs for 4 mo. equals 18,614 MG/yr x $5/MG = $ 93,070
Alternative 3C232cfs for 4 mo. equals 17,995 MG/yr x $5/MG = $ 89,973
2. Maintenance Cost:@ $2,000 per mile of spreader channel

154
4-1.3c Summary of Costs
A summary of the costs involved in the implementation of each alterative is presented in
Table 13.
4-1.3d Phased Implementation Costs and Funding
Due to the large size of this restoration project, it would be cost effective and advantageous
to the ecology of SGGE to implement the plan in phases. This would allow for a more gradual
ecological change of the area and allow for minor adjustments to be made throughout the project.
Alternative 1 is a smaller project and does not involve phases. Alternative 2 requires all three north-
south canals to be altered at one time, however, the Prairie Canal can be plugged in the first phase.
Removal of the roads between the Merritt and Prairie Canals can also be done in this phase. The
remainder of the work would be done in the second phase. Alternative 3A can be split into two
phases. Phase 1 would include plugging the Prairie Canal and removing the road segments between
Merritt and Prairie canals. Phase 2 would involve construction of the remainder of the project.
Alternatives 3B and 3C could be split into three phases. The first phase would involve plugging of
the Prairie Canal and road and tram removal between Merritt and Prairie Canals. It would also
involve removal of part of the Prairie No. 1 structure. No spreader channels would be constructed
in this phase. The second phase involves placement of the Merritt pump station and spreader
channel, canal plugs in the Merritt Canal, road and tram removal between Faka Union and Merritt
Canals. The third and final phase would involve placement of the Faka Union and Miller pump
stations and spreader channels, canal plugs in the Faka Union and Miller Canals and completion

155
of road and tram
TABLE 13
COST SUMMARY
1 2 3A 3A 3C
FIRST COST 172,693 82,474,942 9,584,672 12,595,698 11,652,769
AMORTIZED
FIRST COST1 12,546 5,991,805 696,326 915,077 846,574
ANNUAL O&M 28,980 89,005 94,435 102,770 88,835
TOTAL
ANNUAL
41,526 6,080,810 790,761 1,017,847 935,409
Notes:
1. Amortization based on project life of 30 years with 6 % interest rate.
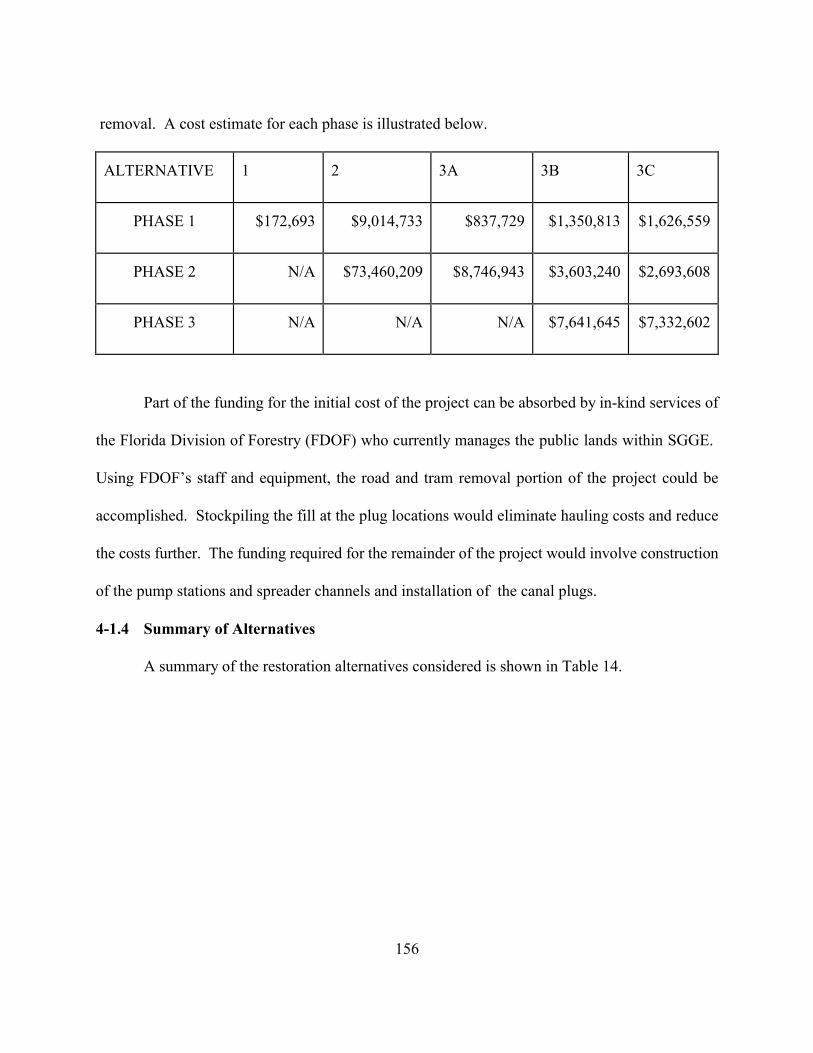
156
removal. A cost estimate for each phase is illustrated below.
ALTERNATIVE 1 2 3A 3B 3C
PHASE 1 $172,693 $9,014,733 $837,729 $1,350,813 $1,626,559
PHASE 2 N/A $73,460,209 $8,746,943 $3,603,240 $2,693,608
PHASE 3 N/A N/A N/A $7,641,645 $7,332,602
Part of the funding for the initial cost of the project can be absorbed by in-kind services of
the Florida Division of Forestry (FDOF) who currently manages the public lands within SGGE.
Using FDOF’s staff and equipment, the road and tram removal portion of the project could be
accomplished. Stockpiling the fill at the plug locations would eliminate hauling costs and reduce
the costs further. The funding required for the remainder of the project would involve construction
of the pump stations and spreader channels and installation of the canal plugs.
4-1.4 Summary of Alternatives
A summary of the restoration alternatives considered is shown in Table 14.

157
TABLE 14
SUMMARY OF RESTORATION ALTERNATIVES
Alternative 1 2 3A 3B 3C
Spreader Channels(Total Miles)
1(1.5)
1(6.5)
2(6.5)
3(4.85)
3(2.4)
Pumps (#)(Total Horsepower)
1(75)
8(770)
8(810)
8(900)
8(890)
Road Removal (miles) None 290 114 128 130
Canal Plugs(Total cu yd earth fill)
None(0)
All Canals(7,652,676)
11(31,900)
82(224,789)
83(226,425)
SGGE CanalMaintenance
Yes No No No No
GroundwaterMonitoring
Yes Yes Yes Yes Yes
Cost Estimate ($) a) Total Contract b) Using FDOF
equipment andlabor
172,693172,693
82,474,94245,759,172
9,584,6726,105,426
12,595,6988,353,057
11,652,7697,381,291

158
4-2. HYDROLOGIC AND HYDRAULIC AND GROUNDWATER FLOW SIMULATION
OF ALTERNATIVES
The final task of the model application process is to simulate the performance of the
previously identified alternatives in order to compare their effectiveness in achieving the desired
objectives of the project. Of critical importance in the alternatives analysis is incorporating all the
effects of the proposed alternatives in the model in terms of specific changes to the model
parameters, inputs and/or system representation and defining the output to be used in the comparison.
The application of the PERLND and RCHRES modules to represent alternative configurations of
pumps, spreader channels, canal blocks and road removal, provided unique challenges different from
the traditional applications of HSPF. The model representation of the alternatives was formulated
in the RCHRES and NETWORK modules of the calibrated HSPF model of SGGE and their
performance was modeled for the entire period of simulation. The detailed description of the
HSPF input modifications is summarized below.
Alternative 1 was represented in HSPF by creating a new reach for the spreader channel and
having this reach discharge into a land segment as a surface lateral inflow. A user defined input time
series represented the flows being diverted from the main channel into the spreader channel.
The major model input to represent Alternative 2 was changed by simulating the single
spreader channel as a RCHRES and routing the outflow to a pervious land segment (PLS). As no
further RCHRES was considered thereafter, the simulation for the downstream segments was
performed only by the PERLND module. The runoff from the land segments was routed from one
PLS to another along the alignments of the historical drainage patterns as surface, interflow and

159
groundwater lateral inflows, until the runoff left the boundary of the basin.
To simulate the elements of Alternative 3A, two new reaches were created to represent the
spreader channels and these reaches discharged into the land segments directly to the south as was
done for Alternative 2. The runoff from the land segments was then routed from one pervious land
segment (PLS) to another as surface, interflow and groundwater lateral inflow until it reached a
historical flowway. The flowways themselves were represented by five newly created reaches as
wide and shallow channels. The plugged canals were represented as "ponds" in the model with
interconnection occurring only when one pond overflowed to another as the water surface rose above
the crest of the canal plugs.
Alternative 3B was represented in HSPF as follows. Instead of routing PLS outflow from
one reach to another, the outflow was directed to the canals as was done for existing conditions. The
canals were represented as the existing canals plus an additional wide shallow floodplain, and the
flows in the canals south of I-75 were permitted to overtop their banks and spill onto the land. The
reaches are actually a combination of the existing canals and large floodplains having the potential
to store substantial amounts of water. It is expected that after the restoration is complete these
canals will still fill up first during the early part of the wet season before sheetflow will occur. Even
with the canal and swale blocks, there will be substantial groundwater movement towards the canals
if a head difference exists, as during the transition period between wet and dry seasons. The
hydroperiods were estimated by observing the duration and depths of the overbank flows. Since PLS
outflows were not routed to downstream PLS, the simulated soil and groundwater storages did not
change. The spreader channels also discharged into reaches rather than into PLS. The plugged

160
canals function again as “ponds”, interconnecting only when the upstream segment fills up.
Alternative 3C is very similar to Alternative 3B, the main difference being the location of
the Merritt spreader channel slightly farther north. The modifications to the HSPF input involve
changes to the northernmost reaches in the system, however, south of these reaches the input is
exactly the same. These slight changes to the input do not produce any noticeable change in the
model output and Alternatives 3B and 3C are modeled in a similar manner. As a result, the
comparison of this alternative with Alternative 3B is mainly a comparison of cost and area of
rehydration. Soil and groundwater storages, hydroperiods and runoff volumes are similar between
Alternatives 3B and 3C.
The model output analysis included the soil and groundwater storages, runoff volumes and
water stages in the reaches. An overall water budget was determined for each alternative. A few
other outputs were examined for a full rehydration of SGGE including flows across U.S. 41 and
Stewart Boulevard, and the time required to fill the plugged canal segments before overtopping
would occur.
A significant amount of research has been done on the natural ecosystems of southwest
Florida and their corresponding hydrology. Information is available from many sources regarding
the hydrology of typical major vegetation communities such as cypress, pinelands, fresh and
saltwater marshes, prairies and hardwood hammocks that are found throughout southwest Florida,
including in SGGE. Using this wealth of information that has been collected over recent years, we
can identify the specific criteria that will define a successful hydrologic restoration of SGGE. This
predetermined criteria is used to compare each alternative’s effectiveness in re-establishing the pre-

161
development hydrology of SGGE and its various ecosystems.
Because HSPF does not model hydroperiods directly, hydroperiods are estimated by
analyzing the duration of stages simulated in the RCHRES module. Some accuracy is lost in the
necessary assumptions made for modeling purposes. For example, the cross sectional area used in
the computation of the overbank flows was approximated and assumed to be of constant cross
section throughout the length of the reach. Additionally, relatively small changes in topography
(inches) result in large changes in hydroperiods and vegetation. Obtaining accurate topographic data
to this scale for such a large area is extremely expensive and time consuming. The time and the
depth of overbank stages were found to be sensitive to both surface roughness (Manning’s n value)
and slope of the overbank.
The purpose of the groundwater flow simulation was to determine the effect of the elevated
water levels in the spreader channels on I-75 which borders SGGE to the north, and specifically, to
determine the distance between I-75 and the spreader channel for which no seepage would occur
under I-75. After examining the hydraulic properties of the aquifer system, it is unrealistic to assume
that no seepage will occur. As long as a head difference exists between the water levels in the
spreader channels and the I-75 ditch, leakage from the spreaders toward the I-75 ditch will occur.
This seepage is collected by a seepage collection ditch and is pumped back into the spreader.
Groundwater flow simulation in HSPF is limited to the upper portion of the shallow aquifer
which has a contribution to streamflow. A more detailed groundwater model needed to be developed
to predict the seepage towards I-75. A two dimensional and three dimensional MODFLOW
groundwater model was constructed based on the Collier County regional groundwater flow model.

162
With an assumption of separation distance between I-75 and the spreader channel being short in
comparison with the lengths of the spreaders and the I-75 ditch, a two dimensional cross-section of
unit width was used to analyze groundwater seepage for scenarios of Alternatives 2 and 3A. The
three separate spreaders in Alternatives 3B and 3C form a typical three dimensional groundwater
flow system, for which a separate analysis was done. Detailed hydrogeologic structures and
hydraulic characteristics of the aquifer system of Collier County have been reported in SFWMD
reports TP 86-1 (Knapp, et. al., 1989) and 92-04 (Bennett, 1992) and input data for the local model
was interpolated from the regional model. Two memoranda describing in detail the task description,
model setup and initial results analysis are included in Appendix E.
4-3. EVALUATION OF ALTERNATIVE PLANS
The formulation of a recommended hydrologic restoration plan is based on the hydrologic
and hydraulic performance of each alternative, as well as the estimate of least cost. An economic
benefit analysis under each alternative scenario to estimate the benefit to cost ratio was beyond the
scope of this study.
4-3.1 Hydrologic Performance of Alternative 1
Area of Rehydration
Alternative 1 is a partial restoration plan to take advantage of presently available public
lands. Alternative 1 was intended as an interim plan and does not achieve all the objectives of the
project. It would rehydrate a small portion of SGGE as shown in Figure 35.
Water Budget and Runoff
The overall basin runoff in Alternative 1 for the study area remains the same as existing

163
conditions, however, point discharge at the Faka Union Weir No.1 is reduced from an average annual
of 260 cfs to 120 cfs. Alternative 1 is intended primarily to reduce the voluminous point discharges
of freshwater to the Faka Union Bay Estuary. Significant flows (average wet season = 460 cfs) will
continue to be discharged at the Faka Union Canal outlet during the wet season. A reduction of 140
cfs of freshwater discharge contributes towards enhancing the ecologic health of the estuary. The

164

165
sheetflow created enhances the functioning of the adjacent wetlands. A runoff hydrograph at Faka
Union Weir No. 1 for this alternative is shown in Figure 36.
Soil and Groundwater Storages/Hydroperiods
The representation of Alternative 1 by routing large volumes of channel outflow to a
relatively smaller PLS results in unreasonable inflow depths and artificially high soil storage and
runoff values. In the subsequent alternatives as the receiving PLS areas become larger, the inflow
depth is more reasonable. As such, the effect on soil storage and hydroperiods for Alternative 1 are
not comparable to the results of the other two alternatives.
Flood Control for Northern Golden Gate Estates (NGGE)
The limited scope of this alternative affects water levels on currently publicly owned land
in SGGE. There will be no impact on upstream flood stages and flood control for NGGE under this
alternative.
Additional Study of This Alternative
The feasibility of this interim plan was further evaluated by the Construction and Land
Management Department (CLM) of the District. Five alternatives for diverting freshwater from the
Faka Union Canal to adjacent wetlands were evaluated. Although the sheetflow created would
enhance the adjacent wetlands and reduce the freshwater shock loads to the estuary, CLM
recommended not to proceed with construction of this alternative due to marginal benefits associated
with relatively high costs. A memorandum updating the feasibility study for this plan is included
in Appendix G.
4-3.2 Hydrologic Performance of Alternative 2

166
Area of Rehydration
Alternative 2 would provide rehydration for all of SGGE, western Fakahatchee Strand and
Figure 36
the eastern portion of Belle Meade, as well as increased aquifer recharge in a portion of NGGE,
while maintaining existing flood protection for NGGE (see Figure 37).
Most of the area that is impacted by the SGGE restoration project is within the boundaries
of two CARL projects. However, an approximately 1.3 square mile area of privately owned land in
eastern Belle Meade, not currently within the Belle Meade or Save Our Everglades CARL project
boundary, intercepts a prominent and well-defined flowway (Figure 37). Inclusion of this property

167
within a CARL boundary would be the optimal solution from a water management perspective. If
this is not feasible, other alternatives should be considered to still ensure water storage, flow and
water treatment as well as habitat values through these lands. Urban and recreational uses that
require any drainage, however, are not recommended for these lands. It would be extremely difficult
and expensive to establish and maintain a lower groundwater table necessary for development. This
would also be in direct conflict with restoring natural hydrology and would nullify the restoration
effort in this area.
Water Budget and Runoff
Evaporation and percolation showed a slight increase of one inch per year while total runoff
decreased by this amount. Although total runoff did not decrease significantly, all the runoff is non-
channelized flow. Runoff at Faka Union Weir No. 1 is zero because all canals are filled in this
alternative.
It should be noted that simulation of Alternative 2 did not show much reduction in runoff.
Runoff was reduced more for Alternative 3B, which proposed a plan involving partial elimination
of the SGGE canal and roadway system. This is mainly due to the way Alternative 2 was simulated
in HSPF. Since all canals south of I-75 were to be removed, the RCHRES module of the program
(the module that simulates canal reaches) was only used for NGGE. The outflows from the land
segments were routed to other land segments as lateral inflows. Evaporation was calculated in the
PERLND module. Alternatives 3A through 3C were modeled using both PERLND and RCHRES
modules since canal segments were maintained in these alternatives. The runoff from the land
segments in Alternatives 3A through 3C was routed to reaches represented by the RCHRES module

168
of the program. Once there, the runoff was subjected to an additional increase in overall evaporation

169

170
and decrease of overall runoff. The reaches used in Alternate 3A were not as extensive as in
Alternatives 3B and 3C.
Soil and Groundwater Storages/Hydroperiods
Figures 38 through 49 show the average daily soil storages in the upper and lower soil zones
and the active groundwater storage zone for existing and Alternative 2 conditions for those land
segments south of I-75 for each month of the simulation period from January 1970 to December
1992. Average daily upper zone soil storage increased by ten percent, lower zone by six percent and
active groundwater storage increased 205 percent. The active groundwater storages for Alternative
2 were extended up to three months longer over existing threshold conditions.
Hydroperiods were determined by observing the duration and depths of the overbank stages
simulated in the RCHRES module of HSPF. As stated before, the RCHRES module was not used
in the simulation of this alternative, so this approach to estimate hydroperiods was not reasonable.
There is a relationship between the storage zones in HSPF and the surficial groundwater levels. A
study involving an application of HSPF on a watershed near Tampa, Florida (Hicks, 1985) concluded
that there is “a significant correlation between the behavior of the HSPF active groundwater zone
and
the actual groundwater behavior represented by the shallow well elevation data.” The relationship

171
Figure 38

172
Figure 39

173
Figure 40

174
Figure 41

175
Figure 42

176
Figure 43

177
Figure 44

178
Figure 45

179
Figure 46

180
Figure 47

181
Figure 48

182
Figure 48

183
Figure 49

184
is not one to one, however. The average increase in active groundwater storage divided by an
average soil porosity of 0.11 gives an increase in active groundwater storage of ten inches, an upper
zone storage increase of 0.3 inches and a lower zone increase of 2.4 inches. This gives a total
increase in water storage of 12.7 inches.
Based on the most current topographic and vegetation maps, average maximum wet season
water depths in the sloughs directly downstream from the main spreader cannot exceed
approximately one foot if historic hydroperiods for wetland and upland areas are to be restored.
Average maximum wet season flows that will discharge from the spreader channels is 286 cfs and
results in a maximum water depth of 0.93 foot. This indicates that the hydroperiod criteria is not
exceeded, that is, the water levels will not be wetter than historical levels.
Flood Control for NGGE
For Alternative 2, as with the other alternatives, the flood protection for the areas north of
I-75 would be maintained by the pumps.
4-3.3 Hydrologic Performance of Alternative 3A
Area of Rehydration
Alternative 3A considers two separate segments of the Main spreader channel and the Miller
Canal spreader is proposed to be moved southward approximately one and a quarter miles south of
I-75 (see Figure 50). The extreme northwest corner of SGGE would be left out of the rehydration
area, although this area would still benefit from increased aquifer recharge due to higher maintained
canal water levels. A portion of NGGE would benefit from increased aquifer recharge if the pumps
were used to maintain water levels with a freeboard of one to two feet, while existing flood

185
protection would continue for NGGE.

186

187
Approximately 1.25 square miles of privately owned land in eastern Belle Meade is within
the rehydration area and is not within a CARL project boundary. As explained previously, these
areas intercept a major flowway which conveys water out of SGGE and are an integral part of the
restoration project. Due to importance of these areas from a water management perspective,
inclusion of these areas into a CARL project boundary is recommended.
Water Budget and Runoff
This alternative produced a slight decrease in runoff (one inch) from existing conditions.
Channelized runoff consists of a small contribution (average annual = 2 cfs) from the Faka Union
Canal near the outlet where approximately the last two miles of canal remain intact. Plugging this
portion of the canal would be cost prohibitive due to its large cross-section and somewhat
inaccessibility by existing roads. Overall basin runoff is comprised mainly by non-channelized
runoff. A runoff hydrograph at Faka Union Weir No.1 for this alternative is shown in Figure 51.
Soil and Groundwater Storages/Hydroperiods
Figures 52 through 63 show the average daily soil storages in the upper and lower soil zones
and the active groundwater storage zone for those land segments south of I-75 under Alternative 3A
scenario for the entire period of simulation. The upper zone soil storage increased by six percent,
lower zone soil storage increased by four percent and active groundwater storage increased by 62
percent. The active groundwater storage under Alternative 3A was extended up to two months
longer than existing conditions. By dividing soil and groundwater storages by an average soil
porosity of 0.11 gives a total increase in water storage of 5.7 inches.
Proper estimation of hydroperiods require accuracy of topographic data in the order of

188
inches. For many areas in SGGE, the soils and topographic data did not correlate well. Typical areas
Figure 51

189
Figure 52

190
Figure 53

191
Figure 54
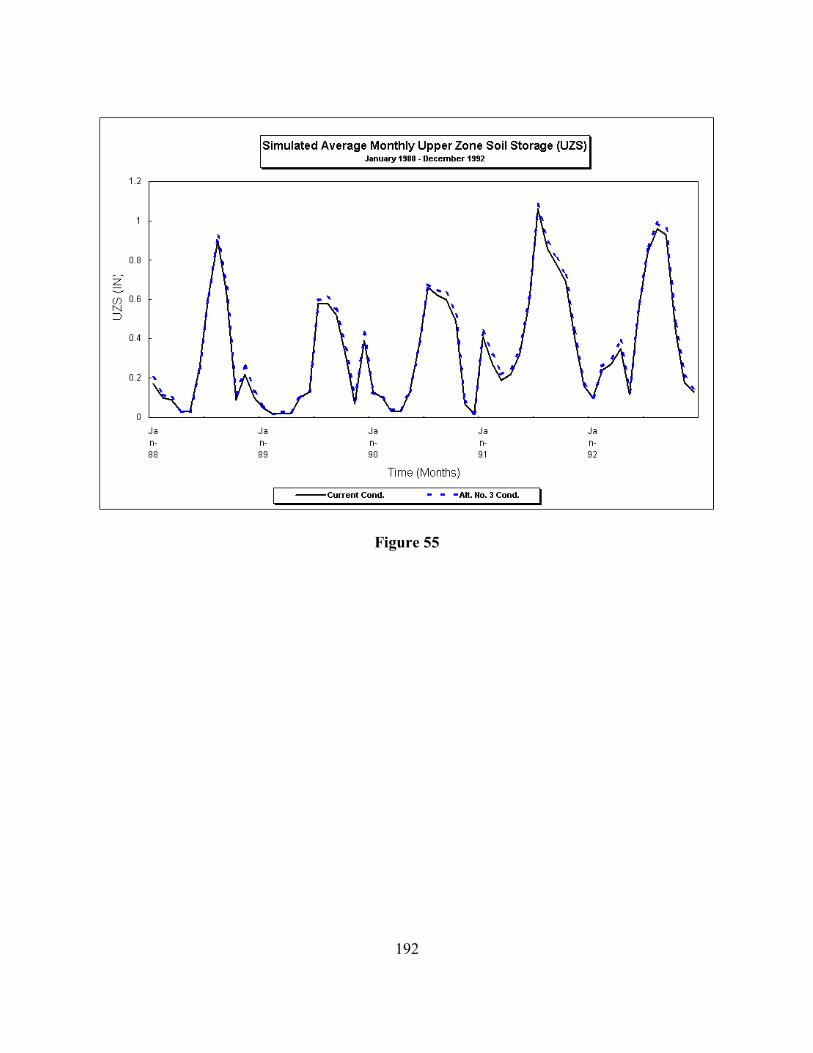
192
Figure 55

193
Figure 56

194
Figure 57

195
Figure 58

196
Figure 59

197
Figure 60

198
Figure 61

199
Figure 62

200
Figure 63
were selected where topographic and soils data agreed and thus were believed to be more
accurate. Although depths and hydroperiods cannot be given for the entire SGGE area, any location
within the area of rehydration, as shown previously in Figure 51, can expect a change in the
hydrologic regime. Results from the RCHRES module show some average hydroperiods for a few
typical areas in SGGE (see Figure 64).
Based on the most current topographic and vegetation maps, average maximum wet season
water depths in the sloughs directly downstream from the Miller spreader cannot exceed

201
approximately one foot if historic hydroperiods for wetland and upland areas are to be restored.
Average maximum wet season water depths in the sloughs directly downstream from the Main
spreader cannot exceed approximately one foot. Average maximum wet season flows that will
discharge from the Miller and Main spreader channels are 69 and 243 cfs, respectively, and result
in maximum water depths of 0.65 and 1.17 feet. This indicates that the hydroperiod criteria is
exceeded downstream from the Main spreader, that is, it will result in wetter and longer hydroperiods
than historical threshold levels in this area.
Flood Control for NGGE
Flood protection for areas north of I-75 would be maintained by the pump stations.
4-3.4 Hydrologic Performance of Alternative 3B
Area of Rehydration
The area of rehydration and aquifer recharge for alternative scenario 3B is shown in Figure
65. Approximately 1.1 square miles of privately owned land in eastern Belle Meade is within the
rehydration area and is not within the Belle Meade CARL project boundary. These areas are an
integral part of the restoration project and are recommended for inclusion in the Belle Meade or Save
Our Everglades CARL project boundary for optimal water management.

202

203

204
Water Budget and Runoff
The water budget for this alternative shows a significant increase in evaporation (5 inches
per year) and corresponding reduction in overall runoff. The channelized runoff amounting to an
annual average of 2 cfs comes solely from the last two miles of the Faka Union Canal at the outlet.
A runoff hydrograph at the Faka Union Weir No. 1 is shown in Figure 66.
Soil and Groundwater Storages/Hydroperiods
The changes in simulated soil and groundwater storages from existing conditions could not
be evaluated by the model because PLS outflow was routed to canals rather than to other land
segments. Soil and active groundwater storage outputs are available only in the PERLND module.
After PLS outflows are routed to a stream reach, the RCHRES simulation does not provide soil
moisture storage output. Hydroperiods were simulated by analyzing the stages of the overbank flows
and typical hydroperiods that can be expected are shown for a few selected areas in Figure 67.
Based on the most current topographic and vegetation maps, average maximum wet season
water depths in the sloughs directly downstream from the Miller and Merritt spreaders cannot exceed
approximately one foot if historic hydroperiods for wetland and upland areas are to be restored.
Average maximum wet season water depths in the sloughs directly downstream from the Faka
spreader cannot exceed approximately 1.5 feet. Average maximum wet season flows that will
discharge from the Miller, Faka Union and Merritt spreader channels are 69, 229 and 59 cfs
respectively and result in maximum water depths of 0.65, 1.44 and 0.89 feet. This indicates that the
hydroperiod criteria is not exceeded for this alternative.

205
Figure 66

206
Flood Control for NGGE
Flood control for NGGE is maintained solely by the pump stations.
4-3.5 Hydrologic Performance of Alternative 3C
Area of Rehydration
The slight shift in the location of the Merritt spreader channel in Alternative 3C resulted in
an increase in the extent of the rehydration area from Alternative 3B as shown in Figure 68.
Approximately 1.1 square miles of privately owned land in eastern Belle Meade is within the
rehydration area and is not within a CARL project boundary. These areas are an integral part of the
restoration project and are recommended for inclusion in the Belle Meade or Save Our Everglades
CARL project boundary for optimal water management.
Water Budget and Runoff

207
The changes in the water budget from existing conditions are similar to those of Alternative
3B. A runoff hydrograph at Faka Union No. is shown in Figure 69.
Soil and Groundwater Storages/Hydroperiods
As in Alternative 3B, the changes in soil and active groundwater storages were not evaluated
by the model because PLS outflows were routed to canals. RCHRES simulation in HSPF does not
provide soil moisture storage output.
Estimates of typical hydroperiod changes computed by stage duration of overbank flows are
illustrated in Figure 67. Typical hydroperiods are similar to Alternative 3B. Based on the most
current topographic and vegetation maps, average maximum wet season water depths in the sloughs
directly downstream from the Miller spreader cannot exceed approximately one foot if historic
hydroperiods for wetland and upland areas are to be restored. Average maximum wet season water

208
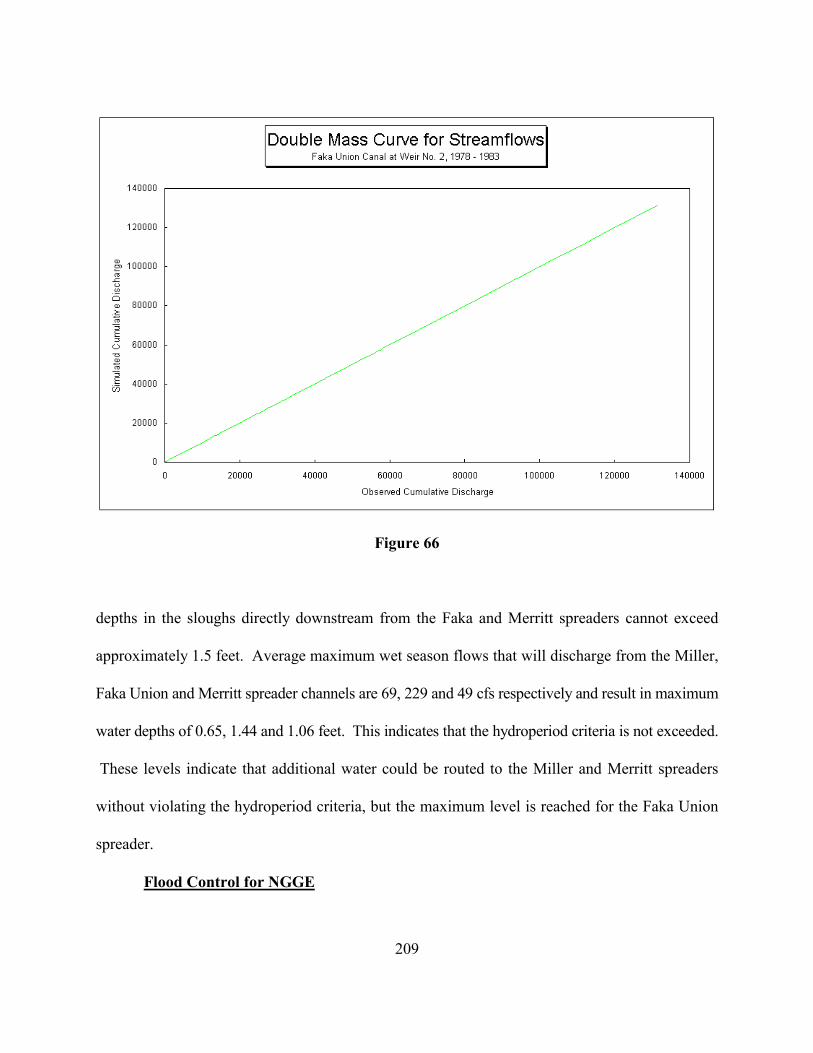
209
Figure 66
depths in the sloughs directly downstream from the Faka and Merritt spreaders cannot exceed
approximately 1.5 feet. Average maximum wet season flows that will discharge from the Miller,
Faka Union and Merritt spreader channels are 69, 229 and 49 cfs respectively and result in maximum
water depths of 0.65, 1.44 and 1.06 feet. This indicates that the hydroperiod criteria is not exceeded.
These levels indicate that additional water could be routed to the Miller and Merritt spreaders
without violating the hydroperiod criteria, but the maximum level is reached for the Faka Union
spreader.
Flood Control for NGGE

210
Flood control for NGGE is maintained by the pump stations.
4-3.6 Additional Hydrologic Analysis
Additional hydrologic analyses were performed for the full-scale rehydration of SGGE. The
remaining canal segments will experience some periods when the canal levels will be lower than the
adjacent groundwater levels. If a gradient exists between the groundwater levels and canal water
levels, water will flow into the canals. Simulation indicated that the canals were filled after a week
of typical wet season rainfall, an extremely quick response time. Three to five days were common.
Even after a drought, canals were filled after 18 days. This indicates the remaining canal segments
will not be a large impediment to sheetflow, and sheetflow will occur early in the wet season.
Flows crossing U.S. 41 through the culverts were also examined under the restoration scenario.
Given the absence of canals, distributed flows across U.S. 41 are expected to increase. The culverts
under U.S. 41, however, have the capacity to pass larger flows than those simulated under the
restoration scenarios. Figure 70 shows the spacial distribution of average annual simulated flows
through the bridge culverts under simulated existing, restored and goal conditions. The flows
contributing to the eastern areas of Faka Union Bay show an average annual increase in sheetflow
discharge from 14 cfs to 68 cfs. This increased sheetflow into the Faka Union Bay will compensate
for the reduced outflow from the Faka Union Canal. It is not desirable to maintain the existing
average annual Faka Union Canal discharge of 260 cfs. Appendix D of the U. S. Army Corps of
Engineer’s report, “Feasibility Study of Golden Gate Estates” (1986), contains a summary of an
environmental report evaluating the effects of a reduction in discharge from the Faka Union Canal
on the productivity of the Faka Union Bay. This study concluded that “reducing canal discharge to

211
approximately 100 to 150 cfs would substantially increase fish abundance and biomass (in the Bay).”
4-3.7 Groundwater Analysis for Alternative Plans
The hydraulic head difference between the elevated water levels in the spreader channels and
any neighboring open water body, including the I-75 ditch will induce movement of groundwater
and cause some seepage to the I-75 ditch. The leakage that occurs from the spreader channels will
have both a horizontal and vertical direction component. Therefore, only part of the leakage reaches
the I-75 ditch and becomes seepage. The remaining leakage percolates downwards into the aquifer
system.
The amount of seepage volume that enters the I-75 ditch varies with both the stages in the

212
spreader channels and the distance between the I-75 ditch and the spreaders. As the stages increase,
the total seepage into the I-75 ditch increases. This relationship is expected. However, this increase
occurs due to two factors. First the higher stages increase the rate of leakage from the spreaders and
secondly they increase the extent of the I-75 ditch seepage zone (the area along the I-75 ditch that

213
is affected by the spreader seepage).
The vertical percolation (that part of the leakage that does not become seepage to the I-75
ditch) plays a more important role as the distance increases. As the distance between the spreaders
Figure 69
and I-75 increases, the seepage zone along the I-75 ditch increases, however, the seepage intensity
decreases. The total seepage may increase or decrease depending on the combined effect of these
two influences. The distance between the spreader channel and the I-75 ditch also affects the model
assumptions which in turn affect the total seepage. When the separation distance is short in
comparison with the lengths of the spreader channel and the ditch, the groundwater flow problem
may be assumed as a two dimensional problem which results in a slightly higher total seepage

214
volume than if analyzed as a three dimensional problem. With the three dimensional groundwater
flow, the flow patterns are more spread out and a greater amount of leakage contributes to the
Surficial Aquifer rather than seepage to I-75. Overall, seepage increases with higher stages, and
shorter distances. The high hydraulic conductivities in this region and the presence of the Lower
Tamiami Confining Unit will contribute seepage to the I-75 ditch. The groundwater analysis showed
approximately 2 million gallons per day (MGD) of seepage from the spreader channels to the I-75
ditch in Alternative 3B. However, the total flow being pumped from NGGE to SGGE during a
10-year storm event is approximately 501 MGD. Therefore, the percentage of recycled water is less
than one percent of the total flow. Even with the two dimensional flow analysis, where the spreader
channel is within a mile of I-75, as in Alternative 3A, the percentage of recycled water is less than
two percent (8 MGD). Practically, the manageable amount of seepage from the spreaders will be

215
intercepted by the I-75 ditch and the seepage collector ditch without rendering any adverse impact
to I-75 and areas north of it.
4-3.8 Summary of Plan Evaluations
Alternatives 2 through 3C would achieve a restoration plan that rehydrates most of SGGE
and increases aquifer recharge in part of NGGE. The City of Naples’ wellfield would benefit from
the increased aquifer recharge in all of the alternative plans except Alternative 1 especially if they
were to expand their wells south of their existing ones. Alternative 2 provides full rehydration and
restoration for the entire study area. Most of the area that is impacted by the SGGE restoration
project is either under public ownership or within the boundaries of two CARL projects. However,
a small area, as outlined previously, of privately owned land in eastern Belle Meade, not currently
within the Belle Meade CARL project boundary, intercepts a prominent and well-defined flowway.
Inclusion of this property within a CARL boundary would be the optimal solution from a water
management perspective. If this is not feasible, other alternatives (such as flow easements, purchase
of development right, etc.) should be considered to still ensure water storage, flow and water
treatment as well as habitat values through these lands. Urban and recreational uses that require any
drainage, however, are not recommended for these lands. It would be extremely difficult and
expensive to establish and maintain a lower groundwater table necessary for residential development.
This would also be in direct conflict with restoring natural hydrology and would nullify the
restoration effort in this area.
Runoff will be reduced in Alternatives 2 through 3C because of the longer retention period
of surface detention storage which allows for increased evaporation and groundwater recharge. The

216
model simulation for Alternative 2 demonstrates the increase in evaporation from the soil storages
due solely to an increase in the upper, lower and groundwater storage zones, while the model
simulation of Alternative 3A through 3C illustrates the evaporation potential of an expansive
wetland system that exists in SGGE. It is expected that runoff will be reduced up to approximately
six inches as a result of the combination of these two factors in any alternative that restores
sheetflows in SGGE. A total reduction in runoff of eight inches is required to achieve the pre-
development criteria. The point load freshwater discharge from Faka Union Canal into the Faka
Union Bay would be significantly reduced from an existing average annual flow of 260 cfs to 2 cfs
in the large scale restoration plans. Alternative 2, with the complete elimination of the canal system,
provides the maximum reduction of point flow. The Faka Union Bay, however, will receive
increased distributed flow from surrounding coastal marshes that were cutoff from sufficient inflow
by the canal system.
Generally, hydroperiods for north SGGE appear to be of sufficient duration and depth.
Neither wetland nor upland hydroperiod regimes will be exceeded, that is, uplands won’t be “flooded
out.” Analysis of hydroperiods of representative sections show the durations of inundation range
from 0 to 300 days with maximum water depths of 14 inches. The higher water depths are confined
to the deeper sloughs and some areas in SGGE would remain dry during an average rainfall year.
Hydroperiods in northeast SGGE, including Picayune Strand, appear long in comparison with their
depth. Larger growth cypress in the Picayune Strand area may require higher water depths. East of
Faka Union Canal, the maximum water depths appear to be shallower than maximum water depths
west of the Faka Union Canal. In the extreme south part of SGGE, maximum water depths are

217
slightly low, however durations appear sufficient. Analysis of these results shows flows should be
routed through historical flowways, especially Picayune Strand, and that road removal is critical to
ensure water movement throughout SGGE. Flood conveyance through the SGGE sloughs is a
significant constraint for design of the spreader channels and one must limit design flows to what
the sloughs can convey at a reasonable stage. Based on the most current topographic and vegetation
maps, historic hydroperiod criteria is not exceeded for the wetlands or uplands for any of the current
scenarios and design flows except Alternative 3A.
The simulation of Alternative 2 is unique in that only the PERLND module was used for
simulation. The routing of PLS outflows to downstream land segments resulted in an increase in soil
and groundwater storages. This modeling strategy shows the change in soil moisture storages but
does not provide an estimation of hydroperiods. Hydroperiods were simulated by analyzing the
stages of the overbank flows for the canal segments in Alternatives 3A through 3C. It is expected
that all alternatives that implement a hydrologic restoration will result in increased soil storages as
modeled in Alternative 2 and hydroperiods similar to those predicted under Alternative 3. That is,
all the alternatives, with the exception of Alternative 1, would provide for additional groundwater
storage amounting to 25 billion gallons.
Alternative 1 is a partial restoration plan to take advantage of presently available public
lands. Alternative 1 was intended as an interim plan and does not achieve all the objectives of the
project. Alternative 2 is the ideal plan to restore the original hydrology of SGGE by filling all four
canals and removing every single road. It meets the restoration goals most closely, however, with
an estimated first cost of over 85 million dollars, this alternative is not economically feasible.

218
Alternatives 3A through 3C are very similar in their ability to meet the project’s hydrologic
restoration goals. Alternative 3A is the least costly of these three, however, it does not meet the
uplands criteria. Alternatives 3B and 3C, of which 3C is the least cost alternative, closely meet all
the objectives of the project.
A summary of the evaluated plans and their performance in meeting the predevelopment
criteria is shown in Table 15. The pre-development criteria is defined as the estimated extent of the
pre-development hydrologic conditions.
TABLE 15
EVALUATION SUMMARY
PRE-DEVELOPMENT CRITERIA
1 2 3A 3B 3C
Area ofRestoration inStudy Area (mi2)
127 3 127 124 111 113
Reduction inBasin Runoff (in) 8 0 6 6 6 6
Average YearlyRunoff @FU1(cfs)
0.7 130 0.7 2 2 2
Increase in WaterStorage (in) 18 - 24 ---- 12.7 12.7 12.7 12.7
PhasedImplementation ---- No Yes (2) Yes (2) Yes (3) Yes (3)
EstimatedHydroperiods -Days ofInundation
0-300---- 0-300 0-300 0-250 0-250
Estimated

219
PRE-DEVELOPMENT CRITERIA
1 2 3A 3B 3C
Hydroperiods -Maximum Depthof Inundation(inches)
0-30 ---- 0-14 0-10 0-14 0-14
Uplands Criteria(non-exceedanceof hydroperiod)
---- Yes Yes No Yes Yes
First Cost ($) ---- 172,693 82,474,942 9,584,672 12,595,698 11,652,769

220
4-3.9 Economic Benefits Evaluation
A quantitative economic benefit analysis under each alternative scenario to estimate the
benefit to cost ratio was beyond the scope of this study. However, on the basis of qualitative
assessment, the following prominent benefits of the project can be identified:
� The implementation of the SGGE restoration plan would improve the water quality of the
coastal estuaries by converting the voluminous freshwater point discharges to the traditional
overland sheetflow along a six-mile wide front into the Ten Thousand Islands Estuaries
Aquatic Preserve, part of the western Everglades. The reintroduction of overland flow
through coastal marshes would increase marsh and mangrove productivity, moderate salinity
fluctuations, provide a desirable mix of fresh and saline water environment conducive to the
survival and protection of juvenile fishes and shellfish beds, and would enhance the
recreational and commercial fishery values of the region.
� Improved groundwater recharge will protect the City of Naples Eastern Golden Gate
wellfield, provide for a long term water supply source and serve as a natural barrier to a
saltwater intrusion.
� Adjacent sensitive lands, including the Fakahatchee Strand State Preserve and the Florida
Panther National Wildlife Refuge, will benefit from this plan with enhanced habitat quality.
� With the implementation of the Picayune Stand State Forest, the overall recreational value
of SGGE will be improved. The Division of Forestry’s forestry management plan for the
area will include specific sites for fishing, camping, hunting and general nature appreciation
by the public. Hiking trails through representative plant communities is proposed. Much of
221
the open water area in the canals will remain. During the wet season, water levels will
overtop the canal plugs causing the open stretches to merge and provide recreationally
navigable waterways for airboats, canoes, etc.
� The SGGE hydrologic restoration project provides an excellent opportunity to increase
environmental awareness about the impacts of land development on the fringe of sensitive
coastal wetlands.
� Continued maintenance of the existing level of service for flood control for northern Golden
Gate Estates is a benefit of this plan.
� Elimination of canal maintenance south of the spreader channels as outlined in the restoration
plans would produce savings for the Big Cypress Basin operation and maintenance program
of approximately $593,000 annually. This is based on a direct proration of the 163 miles of
canals in the 1996 budget. Additionally, the elimination of the need for repair and
replacement of seven aging water control structures would result in annual savings of
approximately $387,000 in 1995 dollars for the Big Cypress Basin capital
improvement/replacement project fund.
� Tremendous costs associated with providing drainage to the urban development on a wetland
environment of SGGE would be avoided.
The Big Cypress Swamp, of which SGGE is a part, is considered to have the best quality
surface water in south Florida. It contains expansive areas of pristine wilderness and some of the
most biologically diverse plant and animal communities on the North American continent. As a part
of the “Save Our Everglades” program, the restoration of SGGE rests on the principles that our

222
quality of life is inextricably linked to the health and viability of natural systems, and that both
economy and the natural resources of south Florida depend on healthy natural systems, (Save Our
Everglades Tenth Anniversary, Governor’s Office of Planning and Budgeting, 1993).

223
5. RECOMMENDED PLAN
On the basis of the above hydrologic-hydraulic, and economic evaluations, and assessment
of impacts of five alternative restoration measures, the Alternative 3C plan involving construction
of three pump stations, three spreader channels, 83 canal blocks and removal of selected segments
of roads is recommended for implementation of the restoration of SGGE. Alternative 3C meets all
of the hydrologic restoration objectives of the project at the least cost. Implementation of this
alternative would accomplish the hydrologic restoration of SGGE by introducing sheetflow in
SGGE, re-establishing the historical flowways (see Figure 71), reducing runoff by increased
evaporation and groundwater recharge, and replacing point flow discharge through the Faka Union
Canal with distributed flow along U.S. 41 into the tidal coastal marshes. In addition to implementing
the structural/nonstructural elements of Alternative 3C, the following recommendations are included
as part of the overall restoration plan for SGGE:
1. To accommodate the Florida Division of Forestry’s (the management entity for the public
lands in SGGE) needs for management of the area, including fire control, as well as to
facilitate public access for recreational use of the area, Alternative 3C can be modified
slightly to maintain a travel corridor through the project area. It is recommended this be
accomplished by utilizing existing road beds combined with Low Water Crossings located
at flowway crossings. A diagram showing the proposed route, which would connect
Everglades Boulevard to Jane’s Scenic Drive in the Fakahatchee Strand State Preserve, is
shown in Figure 72. A drawing of a typical Low Water Crossing consolidated with limerock
base in order to maintain the crossing for vehicular traffic is shown in Figure 73.

224
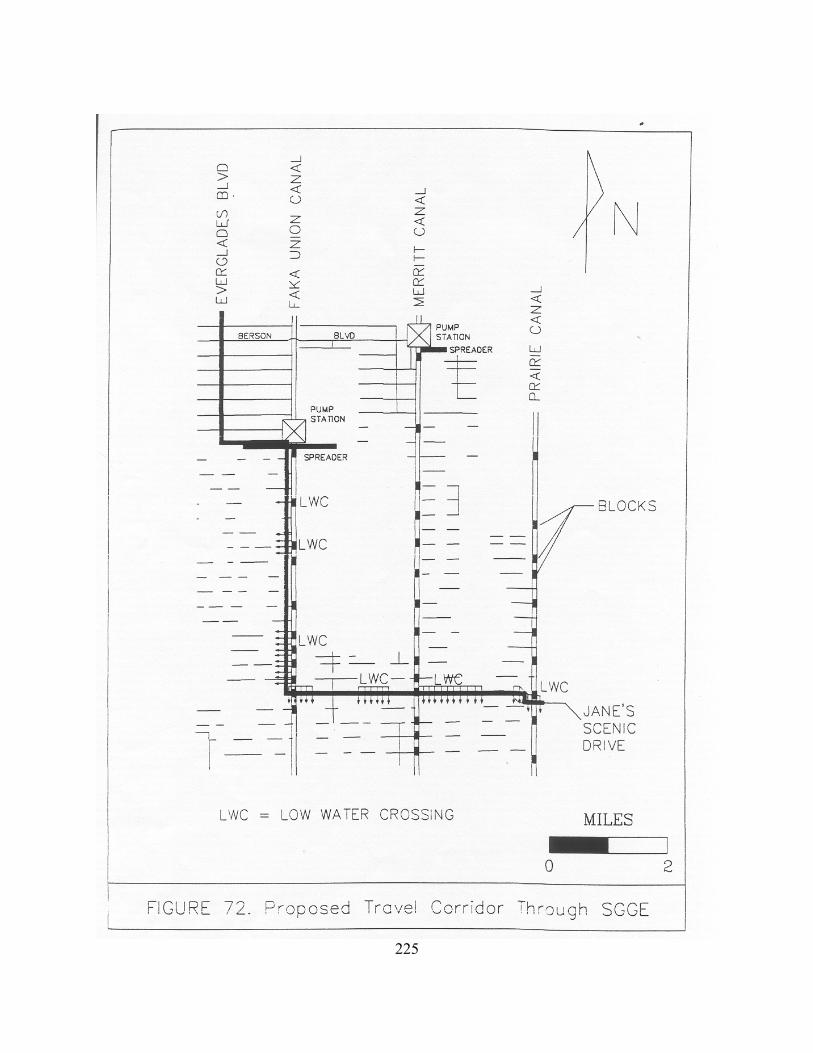
225

226
2. Collection of additional streamflow data is recommended by the installation of surface water
flow monitoring stations on the Miller, Faka Union and Merritt Canals at the three major
inflow points into SGGE at I-75 as soon as possible. Abundant streamflow data improve the
accuracy of flood flow estimation. Since flood protection for the Miller and Faka Union
basins of NGGE will be provided by the pump stations, the sizing of the pumps, which are

227
based on flood flow predictions, is a key element of the plan.
3. Continuation and enhancement of the existing groundwater monitoring program should be
an integral part of the SGGE restoration efforts for evaluating the effects of the overall
restoration project.
4. Success criteria that outline short and long term measurable goals, both quantitatively and
qualitatively, should be determined early in the project. Monitoring should start in the first
phase of the restoration project and help identify if a goal is not being met.
5. The flowways in SGGE have an optimal water stage and corresponding conveyance capacity
requirement with respect to the functioning of local flora and fauna. The design flows for
the structural elements of this plan should be optimal so the stages in the flowways and
associated hydroperiods do not exceed the historical criteria.
6. Restoration of wetlands, especially for a large upland-wetland ecosystem that exists in
SGGE, is a complex process that involves maintaining adequate amounts of water during
appropriate times of the year. In addition to the hydrologic and hydraulic considerations,
other critical components entail soils and geomorphology, structural components, plant
materials and design, monitoring and management. In order for the restoration effort to be
successful, this task should be implemented using an interdisciplinary approach.
7. It is recommended that restoration should be implemented in a phased approach. This would
allow for a more gradual ecological change of the area and allow for minor adjustments to
be made throughout the project.
8. It is recommended that the issue related to the mitigation of impacts on an approximately

228
1.1 square mile area of land within the Belle Meade area be resolved so the restoration of
SGGE can be implemented. This area is presently not included in either of the two CARL
projects. From a water management perspective, the optimal solution is to include this area
within a CARL project boundary.
9. It is recommended that the property that is owned by the Port of the Islands Development
company may be surrounded by a perimeter dike and seepage collection ditch. This area
neighbors the SGGE CARL project but is not within the project boundary. The dike and
ditch will prevent sheetflow from entering this area. Proper drainage design for development
within this property will still be required.

229
6. PLAN IMPLEMENTATION
6-1. PHASED RESTORATION
Phased implementation of the restoration would be financially and ecologically
advantageous. Although the project would be separated into phases, each phase would involve most
of the major “elements” of the plan, that is, pump stations, spreaders, plugs, road removal, etc. The
identification of the phases is based primarily on the connectivity of the canals and their contributing
subbasins. The Merritt and Prairie Canals are obvious first phase choices because they do not
connect to NGGE canals and are fairly isolated. Miller and Faka Union Canals are not isolated
canals as they extend into NGGE. Phased restoration will allow for minor midcourse correction in
the rehydration plan if a certain restoration goal is not being met.
6-2. MANAGEMENT PLAN
The Florida Division of Forestry (FDOF) is responsible for managing the public lands within
SGGE which is being designated as the Picayune Strand State Forest. The implementation of the
SGGE hydrologic restoration plan will enhance the quality of the flora and fauna of the state forest.
The FDOF is currently developing a management plan for the State Forest which will include
recreational uses such as fishing, camping, general nature appreciation and possibly hunting. The
management plan emphasizes conservation, nature appreciation and recreational use consistent with
this diverse and inter-connecting ecosystem and natural resource. Recreational use of publicly
acquired lands is an important objective of the CARL program.

230
7. CONCLUSIONS
The previous studies by the Army COE and others on the feasibility of modifying the
existing water management features of the Faka Union Canal drainage basin for restoring the
hydrology and ecology of the area were based on hydrologic-hydraulic analysis with event-based
models. This study used a state-of-the-art methodology to simulate the continuous process
hydrology of SGGE for a 23-year period and to predict the behavior of the water table and its effect
on soil storage and surface water flow under five alternative scenarios. Although certain refinements
are under study to better simulate south Florida hydrology, this model represents present state of the
art technology for continuous process watershed modeling.
The basic premise of development of this plan rests on the assumption that the entire extent
of the SGGE lands as identified in the State of Florida’s CARL acquisition program will be under
public ownership of the State. This study is, therefore, unique in that a hydrologic restoration plan
is developed for all of SGGE.
Concurrently, development of a regional watershed management plan for Western Collier
County has been undertaken by the Big Cypress Basin. This planning process is conducting a
comprehensive evaluation of the surface water flow characteristics of Western Collier County as a
singular watershed component for developing improved water management strategies for the region.
One of the primary objectives of that plan is to enhance natural system functions and values on
conservation lands. Some modifications of the elements of the SGGE restoration plan may be
required in incorporating to the respective elements of the regional plan so as to achieve homogenous
natural system values for the adjoining publicly owned conservation lands.

231
The hydrologic restoration plan formulated with this study is capable of achieving the
objectives of the project. Restoration of the hydrology of SGGE is of vital importance in protecting
the future water supplies and environmental resources of Collier County and southwest Florida.
After nearly two decades of efforts by many organizations and individuals, this plan coupled with
the land acquisition efforts of the CARL Program sets the stage for an implementable hydrologic
restoration program for SGGE. It is recommended that the Big Cypress Basin Board continue its
support of CARL acquisition efforts undertaken by the State of Florida so that practical restoration
efforts can be implemented soon.

232
REFERENCES
AQUA TERRA Consultants et al, August 1994. Technical and Cost Proposal in Response to RFPNo. C-5365 HSPF Modifications for Southern Florida Hydrology. Mountain View,California.
Bennett, Michael W., April 1992. Technical Publication 92-04, A Three-dimensional FiniteDifference Groundwater Flow Model of Western Collier County, Florida. HydrogeologyDivision. Department of Research and Evaluation. South Florida Water ManagementDistrict. West Palm Beach, Florida.
Black, Crow and Eidsness, Inc., October 1974. Hydrologic Study of the G.A.C. Canal Network.Gainesville, Florida. Project No. 449-73-53.
Black, Crow and Eidsness, Inc. and CH2M Hill, April 1977. Hydrologic Investigations (AnEngineering Report). Project No. 305-74-50. Gainsville, Florida.
CH2M Hill, July 1980. East Golden Gate Well Field Pumping Test Analysis for the City ofNaples, Florida. Project No. NA30506.90. Gainesville, Florida.
--------, November 1978. Proposed Interim Modifications Golden Gate Estates Canal System.Project No. NA44900.75. Naples, Florida.
Connell, Metcalf & Eddy, August 1978. Hydraulic Study of the Lower Golden Gates EstatesDrainage Canal Network in Collier County, Florida. Project No. 7046.00. Coral Gables,Florida.
Crawford, Norman A. Hydrocomp, Inc., Redwood City, California -- Personal communication,1994.
Donigian, Anthony S. et al, June 1984. Application Guide for Hydrological SimulationProgram-Fortran (HSPF). Environmental Research Laboratory, Office of Research andDevelopment, U.S. Environmental Protection Agency, Athens, Georgia, p. 77, 84, 93
Duever, Michael J. Et al, 1986. The Big Cypress National Preserve. National Audubon Society, New York, New York.
Environmental Science and Engineering, Inc., February 1979. Golden Gate Estates Groundwaterand Septic Tank Investigation, Collier County, Florida. Project No. 78503. Gainsville, Florida.
Golden Gate Estates Study Committee, 1977. Golden Gate Estates Redevelopment Study,

233
Collier County, Florida.Gore, Dr. Robert, January 31, 1990. Fire, Rain Plus Man, The Express, Naples, Florida.
Hicks, Caroline N., 1985. Continuous Simulation of Surface and Subsurface Flows in CypressCreek Basin, Florida, Using Hydrological Simulation Program-Fortran (HSPF). Pub. No.86, University of Florida Water Resource Research Center, Gainsville, Florida, p. 141Duever, Michael J. et al, 1986. The Big Cypress National Preserve. Research Report No.8 of the National Audubon Society, New York, New York.
Kenner, W.E., 1966. Runoff in Florida. Map Series No.22, U.S. Geological Survey.
Maloney, Frank E., 1979. Legal Ramifications of Implementation of the Interim Action Programin Golden Gate Estates, Collier County, Florida.
--------, June 1975. Report on Water Resources Problems of Western Collier County, Florida AsAffected by the GAC Corporation's Canal System in its Golden Gate Development Project. University of Florida, Gainsville, Florida.
Nath, Ananta K., Abbott, Gail C. And Gadipudi, Rao, 1995. Evaluation of Wetland RestorationMeasures by Continuous Simulation in Proceedings of the International Conference on WaterResources Engineering, San Antonio, Texas.
Nelson, Jennifer and Tony Venditti, 1992. The Restoration of Golden Gates Estates. Preparedfor Dr. Berrin Tassel, Florida International University, Miami, Florida.
Stanley W. Hole & Associates, June 1977. Report on Acceptance and Flooding Golden GateEstates. Naples, Florida.
Swayze, L. J. and B. F. McPherson, 1977. The Effect of the Faka Union Canal System on Water Levels in the Fakahatchee Strand, Collier County, Florida. Water Resources
Investigation 77-61, USGS, U. S. Government Printing Office, 19 pp.
U.S. Army Corps of Engineers, Jacksonville District, 1986. Golden Gate Estates, CollierCounty, Florida Feasibility Report.
--------, 1980. Reconnaissance Report, Golden Gate Estates. Jacksonville, Florida.
Wang, Flora C., 1977. "Impacts of Drainage Canals on Surface and Subsurface Hydrology ofAdjacent Areas in South Florida." In Cypress Wetlands for Water Management, Recyclingand Conservation, 4th Annual Report.
Wang, Flora C. and Allen R. Overman, 1981. "Impacts of Surface Drainage on Ground Water

234
Hydraulics." Paper No. 80163 of the Water Resources Bulletin.
Wang, John D. and Joan Browder. "Canal Discharge Impacts on Faka Union Bay." InHydraulics and Hydrology in the Small Computer Age, Vol. 1, Ed. Waldrop, W.R. American Society of Civil Engineers, New York, New York, 10017-2398, pp. 141-146.

APPENDIX A

LIST OF HSPF ACRONYMS
AGWETP fraction of ET from active groundwater storageAGWO active groundwater outflowAGWRC daily recession constant of groundwater flow if KVARY or GWVS = 0
the ratio of current groundwater discharge to groundwater 24 hours earlierAGWSactive groundwater storage at the start of the simulationANNIE program by USGS, more interactive and efficient system of time data mgmtARM Agricultural Runoff ModelBASETP fraction of ET from active groundwater outflowCEPSC interception storage capacity (in)CEPS interception storage at the start of the simulationDBHYDRO SFWMD hydrologic databaseDEEPFR fraction of groundwater lost to deep aquiferDELT 60 hr/intervalET EvapotranspirationFOREST fraction of winter forest transpirationFTABLE function table for 6 modules of RCHRESGWVSindex to groundwater slope at the start of the simulationHSPF Hydrologic Simulation Program-Fortran. Developed for EPA to simulate watershed hydrology and water qualityHYDR hydraulic behavior simulationIMPLND Impervious Land ModuleINFEXP exponent in infiltration equationINTFLW interflow inflow parameterIFWS interflow storage (in)INFILD ratio of max/min infiltration rateINFILT index to infiltration capacityINTFW interflow inflow parameterIRC interflow recession rate (1/day)KGW groundwater outflow recession parameter, per intervalKVARY parameter which can make groundwater storage to outflow
relation nonlinear in per inchesLSUR length of overland flow plane in feetLZETPlower zone evapotranspiration parameterLZS lower zone soil storage at the start of the simulationLZSN lower zone soil storage in inchesNETWORK network block of HSPF programNPS non-point sourceNSUR Manning's n for overland flowPERLND pervious land module

A-1PETMAX air temperature which signals a change in ET
calculation only used if snow is consideredPETMIN air temperature which signals a change in ET calculation only used if snow is consideredPLS pervious land segmentPWATER Pervious Land-Water Budget SimulationRCHRES Reach-ReservoirRFAVGM Program that averages daily rainfall at selected stationsRO RunoffSLSUR slope of Overland Flow PlaneSUPY Water SupplySURS surface storage at the start of the simulation (in)TAET total simulated evapotranspirationUZS upper zone soil storage at the start of the simulationUZSN upper zone nominal soil storage (in)WDM Watershed Data Management, program ANNIE file
A-2

APPENDIX B

APPENDIX C

HSPF data input files are available on disk at the Big Cypress Basin office, 6167 Jane’s
Lane, Naples, Florida 33942.