Embed Size (px)
Citation preview

Hydrological and geochemical analyses of the karstic Bobcat Cave watershed: A case study at
Redstone Arsenal, northern Alabama
by
Allen Charles Clements
A thesis submitted to the Graduate Faculty of Auburn University
in partial fulfillment of the requirements for the Degree of
Master of Science
Auburn, Alabama August 5, 2017
Keywords: Geochemistry, Stable Isotopes, Hydrogeology, Karst, Aquifers
Copyright 2017 by Allen Charles Clements
Approved by
Dr. Ming-Kuo Lee, Chair, Professor, Department of Geosciences Dr. Stephanie Shepherd, Assistant Professor, Department of Geosciences
Dr. Lorraine W. Wolf, Professor, Department of Geosciences

ii
Abstract
Hydrologic, geochemical, and stable isotope methods were applied to study karstic carbonate
watersheds of Redstone Arsenical (RSA) in north-central Alabama near Huntsville. Delineation of flow
paths in RSA watersheds near the Bobcat Cave is crucial for the protection of the Alabama Cave Shrimp,
which are listed as a federal endangered species. Encroaching urbanization and continuing industrial
development in the area surrounding Bobcat Cave pose a threat to groundwater quality in the study
area. Sources of groundwater recharge to Bobcat Cave as well as groundwater flow directions
surrounding the cave must be determined to successfully create a scientifically defensible buffer zone
around the cave. Previous dye tracer studies suggest that Indian Creek, the largest body of surface water
in the study area, may serve as a groundwater divide that blocks westward migration of contaminants
from sources east of the creek. Determining the hydrologic connectivity between the east and west side
of the creek is an important aspect of delineation of the watershed.
Results from geochemical analysis and in-situ water quality parameter measurements of
groundwater in the Bobcat Cave indicate that recharge to the cave is largely from surface runoff
entering the cave via conduits during storm events. Groundwater in Bobcat Cave quickly responded to
freshwater inputs during storm events. Groundwater temperature and electrical conductivity show step-
wise drops, and water level and pressure rose quickly following large rainfall events. These results were
consistent with previous water-level studies conducted in the Bobcat Cave.
Water level in carbonate bedrock groundwater monitoring wells were measured periodically
over a one-year time period. Groundwater levels generally fluctuated less than two meters over the

iii
course of the study despite drought conditions that Huntsville experienced during this time period.
These results suggest that drought and precipitation have less pronounced effects on groundwater
levels of relatively deep bedrock as compared to water level inside the Bobcat Cave. Water-level data
indicate a general southward flow in the study area. However, groundwater flow direction locally in the
vicinity of Bobcat Cave was determined to be to northward in February and March of 2017, consistent
with previous dye studies that determined a localized northerly groundwater flow direction in the area
around the Bobcat Cave.
Results of trace elements, major ions, stable oxygen, hydrogen, and carbon isotopes, and
dissolved organic carbon geochemical analyses provide strong evidence of poor hydrologic connection
of groundwater between the eastern and western side of Indian Creek. Elevated concentrations of trace
elements such as arsenic, strontium, rubidium, nickel, selenium, boron, and vanadium were only found
in groundwater to the east of Indian Creek. Major ion geochemistry suggests the occurrence of two
distinct hydrochemical facies in our study area. Groundwater to the east of Indian Creek is dominated by
carbonate/bicarbonate, sodium, potassium, and sulfate ions. Groundwater in Bobcat and Matthews
caves and monitoring wells to the west of Indian Creek is dominated by calcium-bicarbonate ions. The
δ18O and δD isotopic signatures of groundwater samples suggest that precipitation is a major source of
recharge to the groundwater in our study area. The variations in oxygen and hydrogen isotope
composition seem to reflect “the amount effect” in which δ18O values are typically depleted in
precipitation falling during periods of high rainfall. Bobcat and Matthews Caves and the shallow had
more depleted δ13C values compared to deeper groundwater monitoring wells, suggesting that the
shallow well and caves are influenced more by biogenic carbon dioxide in shallow soil. Very depleted
δ13C values (-22 ‰) from a groundwater monitoring well to the east of Indian Creek suggest that this
well is contaminated by organic carbon or hydrocarbons dominated by lighter 12C. GC-MS analysis of
volatile organic compounds in this well were inconclusive. Groundwater in wells near the airfield to the

iv
east of the Indian Creek contain higher dissolved organic carbon concentrations than those in Bobcat
Cave and wells to the west of the Indian Creek. The extent of groundwater contamination near the
airfield requires further investigation. In summary, these results suggest that Indian Creek may serve as
a groundwater divide that blocks westward groundwater migration and contaminant transport from
recharge areas east of the creek, protecting Bobcat Cave and the Alabama Cave Shrimp from sources of
contaminants to the east of Indian Creek.

v
Acknowledgments
Countless people and many societies, associations, and committee board members helped make
this research possible. First and foremost, I would like to thank the faculty members of the Auburn
University Department of Geosciences for believing in me and giving me the opportunity to advance my
academic career. Each and every faculty and staff member played a role in helping me get to where I am
at today.
I owe many thanks to my advisor, Dr. Ming-Kuo Lee. It is rare that you find an advisor that is so
committed to his students and passionate about their research. Dr. Lee’s door was always open when I
had any questions concerning research or other matters. His tireless effort did not go unnoticed; I
cannot hardly recall a day where I did not see him in his office at 8 a.m. working away. Dr. Lee’s work
ethic, dedication, and overall character have been inspiring. These are values that I will carry on with me
after my time is finished at Auburn.
My other committee members also deserve many thanks. The electrical resistivity survey could
not have been possible without Dr. Wolf. I thank her for her help with the geophysical field work and
data processing as well as the many edits to my thesis that she has provided me. I would also like to
thank Dr. Shepherd for her guidance and review of my research as well.
I must thank my family and friends as well. I thank my parents, Chuck and Jenny, for always
supporting me in my endeavors and guiding me in the right direction. To my sister Alison, I thank you for
pushing me to become a better person and for instilling in me an interest in science. I thank my friends
that have been a strong support system throughout this process.

vi
Lastly, I would like to thank all that provided me with financial support: The Auburn Department
of Geosciences Graduate Advisory Board, Spencer Waters and Dan Folse Memorial, the Gulf Coast
Association of Geological Societies, the Geological Society of America, Auburn University Graduate
School, the Alabama Geological Society, and the Charles E. “Chuck” Savrda Award. My research could
not have been possible without their support.
vii
Table of Contents
Abstract ....................................................................................................................................................... ii
Acknowledgments ...................................................................................................................................... v
List of Tables .............................................................................................................................................. ix
List of Figures .............................................................................................................................................. x
Chapter 1: Introduction ............................................................................................................................. 1
Chapter 2: Background .............................................................................................................................. 4
Geologic Setting and Hydrology ................................................................................................... 4
Current Watershed Buffer Zone ................................................................................................11
Previous Research ......................................................................................................................11
Site History .................................................................................................................................20
Chapter 3: Methodology .........................................................................................................................20
Sample Collection and Preservation ..........................................................................................22
Water Table Mapping and Hydrograph Analysis .......................................................................23
Electrical Resistivity Survey ........................................................................................................24
Field Alkalinity Test ....................................................................................................................25
Geochemical Analysis .................................................................................................................26
Stable Isotope Analysis ..............................................................................................................26
Dissolved Organic Carbon (DOC) Analysis ..................................................................................27
Volatile Organic Compounds (VOC) analysis ..............................................................................27
Chapter 4: Results ...................................................................................................................................28

viii
Water Level and Hydrograph Analysis .......................................................................................29
Electrical Resistivity Survey ........................................................................................................36
Q-ICP-MS: Trace Elements .........................................................................................................37
Q-ICP-MS: Major Cations ...........................................................................................................48
Ion Chromatography: Major Anions ..........................................................................................48
Stable Isotope Ratio Mass Spectrometer ...................................................................................49
Dissolved Inorganic Carbon (DIC) ...............................................................................................53
Nondispersive Infrared Analyzer: Dissolved Organic Carbon (DOC) ..........................................53
GC/MS: Volatile Organic Compounds (VOCs) ............................................................................53
Chapter 5: Discussion ..............................................................................................................................55
Water Levels and Hydrographs ..................................................................................................55
Major Ions ..................................................................................................................................60
Dissolved Organic Carbon (DOC) ................................................................................................75
Trace Elements ...........................................................................................................................75
Stable Isotopes ...........................................................................................................................83
Drought ......................................................................................................................................97
Chapter 6: Conclusions ......................................................................................................................... 102
References ............................................................................................................................................ 105

ix
List of Tables
Table 1. Summary of dye traces for GSA 1994 study with respect to Bobcat Cave, Indian Creek, and nearby detection locations ..............................................................................................................13
Table 2. Summary of dye traces for GSA 1996 study with respect to Bobcat Cave ................................14
Table 3. Summary of dye traces for GSA 1997 study (Bulletin 166) with respect to Bobcat Cave ..........15
Table 4. Summary of dye traces for GSA 1997 study (Open File Report) with respect to Bobcat Cave ..17
Table 5. Summary of dye traces for GSA 1999 study with respect to Bobcat Cave and Cow Sump .......18
Table 6. Monitoring well field parameters and USGS Gage Station in Indian Creek ..............................30
Table 7. Measured trace element and major ion concentrations of samples collected in July 8, 2016 ..40
Table 8. Measured trace element and major ion concentrations of samples collected in August 11-12, 2016 ..................................................................................................................................................42
Table 9. Measured trace element and major ion concentrations of samples collected in November 23,
2016 ..................................................................................................................................................44 Table 10. Measured trace element and major ion concentrations of samples collected in December 5-6,
2016 ..................................................................................................................................................46 Table 11. Measured oxygen, hydrogen, and carbon isotope values, dissolved inorganic carbon (DIC), and
dissolved organic carbon (DOC) concentrations of samples collected in July 8, 2016 ....................51 Table 12. Measured oxygen, hydrogen, and carbon isotope values, dissolved inorganic carbon (DIC), and
dissolved organic carbon (DOC) concentrations of samples collected in August 11-12, 2016 .......51 Table 13. Measured oxygen, hydrogen, and carbon isotope values, dissolved inorganic carbon (DIC), and
dissolved organic carbon (DOC) concentrations of samples collected in November 23, 2016 .......51 Table 14. Measured oxygen, hydrogen, and carbon isotope values, dissolved inorganic carbon (DIC), and
dissolved organic carbon (DOC) concentrations of samples collected in December 5-6, 2016 ......52 Table 15. Measured oxygen, hydrogen, and carbon isotope values, dissolved inorganic carbon (DIC), and
dissolved organic carbon (DOC) concentrations of samples collected in February 24, 2017 ..........52 Table 16. Summary of GC/MS results including method detection limits (MDL) ....................................54
Table 17. Average and standard deviation (SD) values of stable isotope ratios calculated from samples to the west and east sides of Indian Creek ...........................................................................................93

x
List of Figures
Figure 1. Location map of study area in north-central Alabama ............................................................... 4
Figure 2. Underlying geology of the Bobcat Cave catchment basin study area ........................................ 8
Figure 3. Generalized stratigraphic column for the study area ................................................................. 9
Figure 4. Dye-trace data summary ............................................................................................................19
Figure 5. Water sample collection locations ............................................................................................22
Figure 6. TROLL 9000 water temperature data from in-situ measurements of Bobcat Cave with precipitation from November 23 – December 5, 2016 ...................................................................32
Figure 7. TROLL 9000 pressure data from in-situ measurements of Bobcat Cave with precipitation from
November 23 – December 5, 2016 ..................................................................................................33 Figure 8. TROLL 9000 electrical conductivity data from in-situ measurements of Bobcat Cave with
precipitation from November 23 – December 5, 2016 ....................................................................33 Figure 9. TROLL 9000 temperature data from in-situ measurements of RS 1781 from July 8-12, 2016 .34
Figure 10. TROLL 9000 pressure data from in-situ measurements of RS 1781 from July 8-12, 2016 .....35
Figure 11. TROLL 9000 electrical conductivity data from in-situ measurements of RS 1781 from July 8-12, 2016 ..................................................................................................................................................35
Figure 12. Electrical resistivity results .....................................................................................................36
Figure 13. Water level map from February and March 2017 sampling measurements with digital elevation model (DEM) overlay ........................................................................................................56
Figure 14. Water levels in Bobcat Cave and monitoring well RS 059 from November 1992 through March
1994 ..................................................................................................................................................59 Figure 15. Water level in Bobcat Cave and local precipitation between November 1995 and November
1996 ..................................................................................................................................................60 Figure 16. Piper Diagram from Ion chromatography (IC) and Q-ICP-MS results .....................................62
Figure 17. IC and Q-ICP-MS results for Bobcat and Matthews Caves .....................................................69
Figure 18. IC and Q-ICP-MS results for Indian Creek and RS 1780 ...........................................................70
Figure 19. IC and Q-ICP-MS results for RS 059 and RS 1781 ....................................................................71

xi
Figure 20. IC and Q-ICP-MS results for RS 1414 and RS P24 .....................................................................72
Figure 21. IC and Q-ICP-MS results for RS 2221 and RS 1278 ..................................................................73
Figure 22. Q-ICP-MS results of major cations .........................................................................................74
Figure 23. Q-ICP-MS results of nickel, selenium, lead ..............................................................................78
Figure 24. Q-ICP-MS results of arsenic, copper, chromium .....................................................................79
Figure 25. Q-ICP-MS results of cadmium, neodymium, thorium, uranium .............................................80
Figure 26. Q-ICP-MS results of aluminum, iron, strontium, rubidium ....................................................81
Figure 27. Q-ICP-MS results of vanadium, boron, barium, manganese ...................................................82
Figure 28. δD and δ18O ratios of water samples and the local meteoric water line .................................85
Figure 29. δ18O and δ13C ratios of water samples .....................................................................................86
Figure 30. δD and δ13C ratios of water samples .......................................................................................87
Figure 31. δD and δ18O ratios plot comparing Bobcat Cave study results to those from the four Tuscumbia Limestone/Fort Payne Chert wells in the Murgulet et al., 2016 Trussville study .........89
Figure 32. δD and δ13C ratios from November 2010 data from Murget et al., 2016 plotted against Bobcat
Cave Study data .................................................................................................................................91 Figure 33. δ18O and δ13C ratios from November 2010 data from eight groundwater wells in
Tuscumbia/Fort Payne (Mtfp) and Bangor Limestone (Mb) aquifers plotted against Bobcat Cave Study data .......................................................................................................................................92
Figure 34. Monthly precipitation δD and δ18O values from the Tuscaloosa, AL (OWL) Station GNIP data 94
Figure 35. Monthly precipitation amount and precipitation δ18O determined in Cancún and Playa del Carmen, México between June 2012 and October 2014 ................................................................95
Figure 36. Monthly precipitation amount and precipitation δ18O from the Tuscaloosa, AL (OWL) Station
GNIP data between June 2005 and May 2008 ..................................................................................97 Figure 37. Groundwater elevation, and precipitation at study site from January 2016 – March 2017 ..99
Figure 38. Drought conditions for Alabama from the week of November 24, 2015 ............................ 100
Figure 39. Drought conditions for Alabama from the week of November 22, 2016 ........................... 101

1
Introduction
The hydrologic properties and geochemistry of fractured karst systems are complex and not as
well understood as other “porous media” aquifer systems (White, 2002, 2006). In the U.S. and globally,
recent development has occurred in areas underlain by karst terrains that provide vital water supply and
ecological services. Karst carbonate aquifers serve as the drinking water source for approximately 20-
25% of the world’s population (White, 2002, 2006). Karst hydrology is of particular concern in water
resource research and management in the southeastern United States where karst terrain is common.
For example, the Floridan Aquifer system comprised of carbonate rocks is one of the most productive
aquifers in the world (Back and Hanshaw; 1970; USGS Groundwater Information, February 2016). The
Valley and Ridge, Piedmont, and Blue Ridge karst aquifers also serve as important water resources in the
southeast, providing water for many towns and cities from northern Alabama to Pennsylvania (USGS
Groundwater Information, February 2016). As population continues to grow in these regions, so too will
be the problems of sustainable water supplies and vulnerability to groundwater contamination.
This project investigates the hydrogeology and geochemistry of the Bobcat Cave catchment
basin located near Huntsville in Madison County, Alabama. Bobcat Cave is home to the Alabama Cave
Shrimp (Palaemonias alabamae) (U.S. Fish and Wildlife Service 1997; McGregor et al., 1997; McGregor
et al., 2013), which became a federally listed endangered species in 1988 (U.S. Fish and Wildlife Service,
1988) due to its small population size, limited geographic distribution, and vulnerability to groundwater
contamination. The shrimp inhabits five caves throughout Madison County, Alabama. The only other
known species in the genus Palaemonias is the endangered Palaemonias ganteri, found in Mammoth
Cave National Park, Kentucky (Cooper and Cooper, 2011). In an attempt to revive the population, the
U.S. Fish and Wildlife Service devised a recovery plan for the shrimp in 1997 with a primary objective to
complete the delineation of groundwater flow paths for the Bobcat Cave watershed (U.S. Fish and

2
Wildlife Service, 1997). This study represents a critical step for accomplishing that task set by the U.S.
Fish and Wildlife Service in 1997.
The Bobcat Cave and associated karst systems are contained in the Tuscumbia Limestone, as
part of a larger Mississippian limestone sequence in northern Alabama (Szabo et al., 1988; Klimchouk et
al., 2000) (Figure 1). This limestone aquifer system serves as an important water source in northern
Alabama, where rapid population growth and increasing industrial and agriculture activities place
significant stress on water quantity and quality. Previous water quality studies show that groundwater in
the watersheds surrounding the Bobcat Cave may locally contain toxic metals such as cadmium,
chromium, and lead, and organic solvents including trichloroethylene (TCE), 1, 1 dichloroethene (DCE),
perchlorate, and benzene, toluene, ethylbenzene, and xylene (BTEX), at concentrations higher than their
respective Maximum Contaminant Level (MCL) (McGregor et al., 1999; Shaw Environmental, 2009). Thus
this study is designed to delineate potential pathways of groundwater flow and contaminant transport
in the watershed using various geochemical and isotope tracers. Stable isotope analysis has been
previously utilized to study karst geochemistry, water sources, and mixing (e.g. Robinson, 2004;
Murgulet et al., 2016). Many studies have implemented large-scale or numerical modeling methods
(based on overly simplistic hydrologic or geochemical models) in attempts to ascertain karst aquifer
hydrology (Murgulet et al., 2016). Stable isotope data can place important constraints on numerical
models due to the complex nature of karst aquifers that can be extremely heterogeneous with respect
to flow rates, hydraulic conductivity, and even localized flow direction (Gunn, 1983; Williams, 1983;
Klimchouk, 2000; White and White, 2001; White, 2002).
In general, the broad theories underpinning karst aquifer studies are (1) isotopic and
geochemical signatures of groundwater in bedrocks and caves reflect water sources and mixing along
major flow conduits, and (2) water-quality parameters, including pH, conductivity, temperature, and

3
alkalinity, are a function of water sources, water-rock interactions, and mixing along major flow conduits.
Specifically for this study, we hypothesize that unique isotopic and geochemical signatures of
groundwater and caves’ water reflect different recharge sources and hydrologic mixing histories. The
goal of this study is to further our understanding of the hydrologic regime and recharge resources of the
karstic Bobcat Cave catchment basin through the deployment and analyses of multiple tracers (stable
isotopes, major ions, trace elements, dissolved organic and inorganic carbon concentrations, volatile
organic compounds, and water-quality parameters).

4
Figure 1. Location map of study area in north-central Alabama. Locations of significance include, from west to east, Bobcat Cave, Indian Creek, Redstone Army Airfield, and Matthews Cave.
Karst aquifers present a number of challenges to environmental management due to their
strong heterogeneity in hydrologic properties. Perhaps one of the largest concerns is the ability for karst

5
conduit networks to transport contaminants rapidly over large distances (> a few kilometers) via
conductive channels. This study will bring the community closer to an understanding of how karst
groundwater systems may impact management decisions, such as delineating a watershed buffer zone
needed for improved water supplies and environmental services. Field and laboratory results
demonstrate the applications of combining hydrometric data and geochemical and isotopic tracers to
identify main components of the water flow in karst aquifers. The spatial and temporal variations of
catchment sources can provide insight into the main recharge sources and transportation characteristics
of karst aquifers. By furthering our knowledge on the dynamics of the complicated fluid flow within karst
aquifers, a better management plan can be implemented not only for the Bobcat Cave watershed, but
for similar systems globally.
Geologic Setting and Hydrology
Typically, there are several factors that affect conduit development and therefore groundwater
flow direction in karstic carbonate bedrocks. Stratigraphy and structure, precipitation, overburden, and
base level hydrology all play a role in controlling groundwater flow, including conduit development and
flow direction.
The underlying geology of the study site consists of a sequence of Mississippian limestones
(approximately 300 meters of total thickness) deposited unconformably atop the Devonian Chattanooga
Shale (Figs. 2, 3). Within the study area, weathering of carbonate bedrock creates an irregular contact
with the overlying Quaternary overburden/residuum that ranges in thickness from 3-26 meters (Shaw
Environmental, 2003). The study area in Redstone Arsenal (RSA) is located on the south-plunging axis of
the Nashville Dome in the Tennessee Valley district of the Highland Rim section of the Interior Low
Plateaus physiographic province (Fenneman, 1946; McGregor, O’Neil, and Campbell 1997). Geologic
units dip an average of four meters per kilometer to the south towards the Tennessee River, which

6
defines the southern hydrologic boundary of the study area as well as the base level discharge location
for groundwater within the arsenal.
Several sedimentary units make up the stratigraphy of the study site. The individual geologic
units that are either present in the subsurface or crop out at the study site, from oldest to youngest are:
Devonian Chattanooga Shale, Mississippian Fort Payne Chert, Mississippian Tuscumbia Limestone,
Mississippian Monteagle Limestone, Mississippian Hartselle Sandstone, and Mississippian Bangor
Limestone. The three primary geologic units of interest are the Chattanooga Shale, Mississippian Fort
Payne Chert, and the Mississippian Tuscumbia Limestone.
The Chattanooga Shale plays an important role in the hydrogeology of RSA despite the fact that
it does not outcrop within the study area. This unit is continuous beneath the study area and acts as an
aquitard for the karst aquifer which is contained in the overlying limestone units (US Army Bobcat Cave
Hydrogeological Assessment, 2014). The shale consists of thinly bedded (17cm to 3m thick), fissile,
pyritic layers with discontinuous, fine-grained sandstone beds at the base (US Army Bobcat Cave
Hydrogeological Assessment, 2014).
The Fort Payne Chert crops out parallel to stream valleys such as Indian Creek in the northern
portion of RSA. This unit is a fossiliferous or dolomitic limestone, comprised of chert nodules, lenses, or
beds ranging from centimeters, to several meters in thickness. The chert ranges in thickness from
approximately 9 to 49 meters (US Army Bobcat Cave Hydrogeological Assessment, 2014).
The Bobcat Cave and associated karst system are contained within the Tuscumbia Limestone,
the dominant unit that crops out within the area as shown in Figure 2. It is a coarse-to-medium-grained
fossiliferous or micritic limestone with discontinuous chert lenses, ranging in thickness from less than
one meter to 3 meters (Rheams et al., 1994). Fracture networks are common in this unit due to massive

7
bedding and discontinuous chert lenses (Rheams et al., 1994; McGregor, O’Neil, and Campbell, 1997;
Shaw Environmental, 2003).

8
Figure 2. Geologic units crop out in the Bobcat Cave catchment basin study area. Modified from the Shaw Environmental (2003) and the U.S. Army Bobcat Cave Hydrogeological Assessment (2014).

9
Figure 3. Generalized stratigraphic column for the study area. Source: the Geology of the Madison 7.5-Minute Quadrangle, Madison County, Alabama (Raymond, 2003).
Previous studies have compared the karst geology of RSA to other karst systems and concluded
that the Mammoth Cave Region in south- central Kentucky serves as an analog to the karst at RSA (US
Army Bobcat Cave Hydrogeological Assessment, 2014). Both systems are characterized by shallow-

10
dipping Mississippian limestones that lack large-scale faulting and folding. Local faults and folds are
found in both systems, but previous research suggests that the faults have limited vertical displacement
(US Army Bobcat Cave Hydrogeological Assessment, 2014). The associated joints and fractures are
contained within bedding planes for the most part as well, with limited vertical and horizontal extent
(Deike, 1989; Palmer, 1989; Worthington, 2004).
Precipitation and its chemical interaction with carbonate bedrocks is necessary for the
development of karst terrain. Chemical weathering results in the formation of karst topography, which is
dominated by sinkholes, caves, disappearing streams, and other underground conduit systems. Karst is
produced by the chemical dissolution of soluble carbonate rock as it interacts with slightly acidic water.
Carbonic acid forms through the carbonation reaction between carbon dioxide and water:
H2O + CO2 H2CO3
Dissolution occurs when soluble rock such as limestone interacts with slightly acidic meteoric water.
Chemical weathering of calcite (CaCO3), a major constituent of carbonate rocks, occurs in the presence
of carbonic acid (H2CO3):
CaCO3 + H2CO3 Ca2+ + 2HCO3-
Acidic water percolates through joints and fractures in the rock created by tectonic deformation
during folding and faulting. Large karst features such as caves take thousands of years to form through
this process.
Strike and dip of beds, as well as thickness can influence conduit formation and groundwater
flow direction in karst (US Army Bobcat Cave Hydrogeological Assessment, 2014). Groundwater flow
direction in the vadose zone typically follows local dip direction along bedding planes in gently-dipping
limestones such as those found in the study area, and groundwater mainly follows dip direction in the

11
phreatic zone right below the water table (Palmer, 1986). Previous geologic surveys suggest that a
majority of the limestone units within the study area are not massively bedded and fractures are
contained within individual beds. A study conducted by Shaw Environmental (2003) concluded that
these fractures are only locally present and would be expected to have little or no controls on conduit
direction for any significant amount of distance within the study area.
CURRENT WATERSHED BUFFER ZONE
The current Bobcat Cave watershed buffer zone was arbitrarily created in the 1990s based on
roads that were easy to delineate (Christine Easterwood; RSA wildlife biologist, personal
communication, 2015). The buffer zone is not sufficient for implementing the watershed protection plan
defined by U.S. Fish and Wildlife Service. In their 1997 recovery plan, U.S. Fish and Wildlife Service
concluded that a scientifically defendable groundwater recharge area where development should be
restricted needs to be established for the Bobcat Cave watershed (U.S. Fish and Wildlife Service, 1997).
PREVIOUS RESEARCH: DYE TRACER TESTS AND WATER QUALITY MONITORING
Previous studies of the area concluded that additional dye tracer tests as well as geochemical
analysis of water samples from the groundwater and surface water in the vicinity of Bobcat Cave need
to be conducted to obtain a better understanding of the Bobcat Cave groundwater basin (Tables 1-5, Fig.
4) (Rheams et al., 1994; Sullivan, 1996; McGregor and O’ Neil, 1996, 2000-2002, 2003, 2004, 2006, 2008,
2010, and 2011-2013; McGregor, O’ Neil, and Campbell, 1997; McGregor et al. 1997; McGregor, O’Neil,
and Gillett, 2005; McGregor, O’Neil, and Wynn, 2008 and 2009).
In a 1994 report, Rheams, Moser, and McGregor from the Geological Survey of Alabama (GSA)
summarized seven dye tracer tests conducted in December 1990 through May 1992 (Table 1). Authors
injected dyes at locations ranging from 2 - 8 miles (3.2 - 12.9 km) to the northeast and southeast of

12
Bobcat Cave. All injection points were located to the east of the Indian Creek (Table 1). Negative results
(Table 1) at Bobcat Cave indicate a localized recharge area for the cave is likely restricted to the west of
the Indian Creek. The results also suggest that Indian Creek may serve as a barrier to westward
groundwater flow (Rheams et al., 1994).
Trace number five from the GSA 1994 study is of particular interest due to the dye injection
location and corresponding monitoring locations. Dye was injected at Matthews Cave, and monitoring
points were located along the eastern side of Indian Creek, Bobcat Cave, at a groundwater monitoring
well near Bobcat Cave along Anderson Road, and at cow sump, which is a low wetland area
approximately 300 meters northwest of Bobcat Cave that is used as livestock water supply (Table 1). No
positive dye detections were obtained from Bobcat Cave or any of the monitoring points located to the
west side of Indian Creek. Positive results, however, were obtained from Indian Creek South, which is
located at the eastern side of the Indian Creek approximately 6 kilometers to the southwest of the
Matthews Cave injection point. This result suggests that groundwater flow direction near Matthews
Cave is approximately to the south and that westward groundwater movement across or under Indian
Creek is improbable (Rheams et al., 1994).
Trace numbers six and seven are also of interest due to the injection points located on the east
side of Indian Creek, and the selected monitoring locations on both sides of Indian Creek (Table 1).
Positive results at Indian Creek South for trace 6 (Table 1) reiterate the generally southerly groundwater
flow direction within the study area to the east of Indian Creek. Positive results obtained at Indian Creek
North and South detection locations for trace 7 (Table 1) also reaffirm that the general groundwater
flow in this area is towards the south (Rheams et al., 1994).

13
Table 1. Summary of dye traces for GSA 1994 study with respect to Bobcat Cave, Indian Creek, and nearby detection locations. Indian Creek North and South monitoring locations are located within the main channel of Indian Creek along its eastern bank. Trace 1 did not have a detector located in the Bobcat Cave or its general vicinity; modified from Rheams et al. (1994). ND = tracer dye not detected.
Trace Number
Injection Point Detector Location
Distance/direction from injection point
Results
2 Drainage well near Rideout Road, 0.5 mile (≈ 0.8 km) N. of I-565 in western Huntsville
Bobcat Cave 3.9 mi. (6.3 km) SW ND
3 Shelta Cave, East Room Bobcat Cave 8.0 mi. (12.9 km) SW ND
4 Shelta Cave, West Room Bobcat Cave 7.8 mi. (12.6 km) SW ND
5 Matthews Cave, South Room Bobcat Cave 2.8 mi. (4.5 km) SW ND
Indian Creek North
1.2 mi. (1.9 km) SW ND
Indian Creek South
3.75 mi. (6.0 km) SW Detected
Cow Sump 2.7 mi. (4.3 km) SW ND
Monitoring Well RSO59
2.9 mi. (4.7 km) SW ND
6 Observation well in abandoned industrial waste treatment facility on E. side of Indian Creek within RSA
Indian Creek North
2.9 mi. (4.7 km) N ND
Indian Creek South
0.1 mi. (0.2 km) S Detected
Bobcat Cave 2.2 mi. (3.5 km) NW ND
7 Same as trace 2 Bobcat Cave 3.9 mi. (6.3 km) SW ND
Indian Creek North
2.3 mi. (3.7 km) SW Detected
Indian Creek South
4.9 mi. (7.9 km) S Detected

14
A 1996 GSA study continued previous works with the addition of two dye tracer tests. Dyes were
injected into three hand-augured holes two to three hundred meters to the west and east of the Bobcat
Cave (Table 2). Dye traces were not detected in the Bobcat Cave, but were detected at Cow Sump
located a few hundred meters to the northwest of the Bobcat Cave. These positive results suggest a
localized northerly flow direction for shallow groundwater in the subsurface east and north of Bobcat
Cave (McGregor and O’Neil, 1996; US Army Bobcat Cave Hydrogeological Assessment, 2014).
Table 2. Summary of dye traces for GSA 1996 study with respect to Bobcat Cave; modified from McGregor and O’Neil (1996). ND = tracer dye not detected.
Trace Number
Injection Point Detector Location Distance/direction from injection point
Results
1 a) Hand-augured holes 800 ft. (244 m) west (Rhodamine) of Bobcat Cave
b) 1,000 ft. (305 m) east (fluorescein) of Bobcat Cave
Bobcat Cave a) 800 ft. (244m) E ND
b) 1,000 ft. (305 m) W ND
Cow Sump a) 1,000 ft. (305 m) N Detected
b) 1,800 ft. (549 m) NW ND
2 Hand-augured hole 700 ft. (213 m) north of Bobcat Cave
Bobcat Cave 700 ft. (213 m) S ND
Cow Sump 500 ft. (152 m) N Detected
A McGregor et al. (1997) GSA Study summarized the results from eleven dye tracer injections
conducted from December 1992 through June 1994 (Table 3). Of the eleven tracers, five directly
included the Bobcat Cave as monitoring points (Table 3). The positive dye-trace data from trace
numbers 8 and 9 indicate localized groundwater flow in the region directly south of Bobcat Cave is to

15
the north. Inconclusive results were obtained from tracers injected to the north of Bobcat Cave (trace 2,
4, 7) (McGregor et al., 1997).
Table 3. Summary of dye traces for GSA 1997 study (Bulletin 166) with respect to Bobcat Cave; modified from McGregor et al. (1997). Indian Creek North and South are located within the main channel of Indian Creek along the eastern bank. The Indian Creek at Old Madison Pike location is located upstream from the northern boundary of RSA. *monitored window ≈ 30 meters inside cave. ND = tracer dye not detected.
Trace Number
Injection Point Detector Location Distance/direction from injection point
Results
2 Abandoned agricultural well CT-60, Research Park West, Madison County, Alabama
Indian Creek, Old Madison Pike
2 mi. (3.2 km) SW ND
Matthews Cave 2 mi. (3.2 km) S ND
Indian Creek North 2.6 mi. (4.2 km) SSW ND
Indian Creek South 5.8 mi. (9.3 km) S ND
Bobcat Cave 4.8 mi. (7.7 km) SSW ND
4 Closed sinkhole south of Madison Pike, Madison County, Alabama
Indian Creek, Old Madison Pike
1.2 mi. (1.9 km) E ND
Indian Creek, U.S.G.S station
1.3 mi. (2.1 km) SE ND
Indian Creek North 1 mi. (1.6 km) SE ND
Indian Creek South 4.6 mi. (7.4 km) SE ND
Bobcat Cave 2.6 mi. (4.2 km) S ND

16
Table 3. Continued
Trace Number
Injection Point Detector Location Distance/direction from injection point
Results
7 Open sinkhole north of Bobcat Cave
Indian Creek South 2.2 mi. (3.5 km) SE ND
Monitoring well 0.4 mi. (0.6 km) ESE ND
*Bobcat Cave, window 0.09 mi. (0.1 km) S ND
Bobcat Cave, entrance 0.09 mi. (0.1 km) S ND
8 Hand-augured hole 500 ft. (152 m) south of Bobcat Cave
Indian Creek South 2 mi. (3.2 km) SE ND
Monitoring well 0.3 mi. (0.48 km) ENE ND
Cow sump 0.2 mi. (0.3 km) N ND
*Bobcat Cave, window 0.09 mi. (0.1 km) N Detected
Bobcat Cave, entrance 0.09 mi. (0.1 km) N Detected
9 same as trace 8 Indian Creek South 2 mi. (3.2 km) SE ND
Monitoring well 0.3 mi. (0.48 km) ENE ND
Cow sump 0.2 mi. (0.3 km) N ND
*Bobcat Cave, window 0.09 mi. (0.1 km) N Detected
Bobcat Cave, entrance 0.09 mi. (0.1 km) N Detected
A 1997 Geological Survey of Alabama (GSA) open file report (McGregor et al., 1997) summarized
the results of dye-tracer tests conducted in four hand-augured holes 1,200 – 1,800 feet (366 – 549
meters) south-southwest of Bobcat Cave from November 1996 through July 1997 (Table 4). The results

17
of the 1997 GSA study (Table 4) showed that (1) groundwater flow in the vicinity south-southwest of
Bobcat Cave is to the north-northeast, and (2) a majority of recharge to the cave is from shallow
groundwater. Inconclusive results were obtained from injection points to the west-southwest of the
cave. Authors recommended additional dye trace studies to better delineate the basin (McGregor et al,
1997).
Table 4. Summary of dye traces for GSA 1997 study (Open File Report) with respect to Bobcat Cave; modified from McGregor et al. (1997). ND = tracer dye not detected.
Trace Number
Injection Point Detector Location
Distance/direction from injection point
Results
1 Hand-augured hole 1,200 ft. (366 m) southwest of Bobcat Cave
Bobcat Cave 1,200 ft. (366 m) NE Detected
Cow Sump 1, upstream
2,250 ft. (686 m) NE Detected
Cow Sump 2, downstream
2,000 ft. (610 m) N ND
2 Hand-augured hole 1,400 ft. (427 m) southwest of Bobcat Cave
Bobcat Cave 1,400 ft. (427 m) NE ND
Cow Sump 1, upstream
2,000 ft. (610 m) NNE Detected
Cow Sump 2, downstream
1,800 ft. (549 m) N Detected
3 Hand-augured hole 1,400 ft. (427 m) west-southwest of Bobcat Cave
Bobcat Cave 1,400 ft. (427 m) N ND
Cow Sump 1, upstream
2,200 ft. (671 m) N ND
Cow Sump 2, downstream
2,300 ft. (701 m) N ND

18
Table 4. Continued
Trace Number
Injection Point Detector Location
Distance/direction from injection point
Results
4 Hand-augured hole 1,800 ft. (549 m) west-southwest of Bobcat Cave
Bobcat Cave 1,800 ft. (549 m) NE ND
Cow Sump 1, upstream
2,600 ft. (792 m) NNE ND
Cow Sump 2, downstream
2,300 ft. (701 m) N ND
The GSA conducted two additional multi-dye tracer studies in 1999 (Table 5). Neither tracer was
detected at Bobcat Cave (McGregor et al., 1999). Positive results obtained from the Cow Sump support
findings from the 1997 GSA open file report that shallow groundwater in the vicinity of Bobcat Cave
flows to the north.
Table 5. Summary of dye traces for GSA 1999 study with respect to Bobcat Cave and Cow Sump; modified from McGregor et al. (1999). ND = tracer dye not detected.
Trace Number
Injection Point Detector Location Distance/direction from injection point
Results
1 Hand-augured hole 1,400 feet southwest of Bobcat Cave
Bobcat Cave 1,400 ft. (427 m) NE ND
Cow Sump 1,800 ft. (549 m) N ND
2 Hand-augured hole 1,800 ft. (549 m) west-southwest of Bobcat Cave
Bobcat Cave 1,800 ft. (549 m) NE ND
Cow Sump 2,300 ft. (701 m) N Detected
Additionally, the Geological Survey of Alabama has continuously conducted water quality and
biological monitoring in Bobcat and Matthews Caves since 1990. These studies have focused primarily
on physical parameters such as temperature, dissolved oxygen, pH, and alkalinity and geochemical
parameters including trace elements and major ions. Annual reports published by the survey provide a

19
detailed trend of the water quality in the caves. These reports serve as additional references for our
geochemistry results obtained from either side of Indian Creek since Bobcat and Matthews Caves are on
opposing sides of Indian Creek.
Figure 4. Summary of GSA 1990s dye-tracer results. Some injection and monitoring locations from the 1994 report are left out due to distance away from Bobcat Cave (BC). Diamonds represent injection points, circles for monitoring locations, arrows represent direction of groundwater flow. Green diamond and arrows represent the 1994 study, yellow represents the 1996 study, magenta represents the 1997 Bulletin 166 study, red represents the 1997 Open File Report (OFR) study, and blue represents the 1999 study. Modified from U.S. Army Bobcat Cave Hydrogeological Assessment (2014).

20
Site Contamination History
The Bobcat Cave watershed is situated in the “Industrial Zone” of Redstone Arsenal. Beginning
in the 1940s, the main mission of RSA was the production of conventional and chemical munitions. After
World War II, the arsenal was responsible for the disposal of excess munitions that were not used, or
were captured by the allies (Shaw Environmental, 2007). Chemical wastes were produced as a result of
the production and disposal of munitions and RSA had difficulties properly handling these wastes. In
1994 EPA added RSA to the National Priorities List (EPA ID AL7210020742) (National Priorities List, EPA,
2017) with known releases of contaminants that warrant further site investigation.
Two contaminants of concern within groundwater in the arsenal are trichloroethylene (TCE),
and perchlorate. The risk for high levels of TCE stems from its use in degreasing operations of heavy
machinery that is commonly found at the base. Perchlorate is one of the main constituents in solid
rocket propellants. The risk of high levels of perchlorate stem from RSA’s role in the development and
testing of missiles and rockets (Shaw Environmental, 2007). The existence of these and other
contaminants justify the need to better delineate groundwater flow paths and identify sources of water
inputs of Bobcat Cave.
Methods
We hypothesize that unique isotopic and geochemical signatures of groundwater and caves’
water reflect different recharge sources and hydrologic mixing histories. To test this hypothesis, 21
water samples were collected from ten locations (Figure 5), including seven groundwater monitoring
wells, Bobcat Cave, Matthews Cave and Indian Creek. In addition, two meteoric samples were collected
from a rain gauge at one of the monitoring wells (RS 1278) for a total of 21 samples. Sampling was
conducted during five site visits over the course of an eight-month time period. The first two rounds of
sampling were conducted during July and August of 2016, when precipitation was minimal and the creek

21
was near base-level conditions. Third and fourth rounds of sampling were conducted in November
(during extreme drought conditions) and December (directly after storm events, severe drought
conditions) of 2016. The fifth round of sampling was conducted in February 2017 after main rainfall
events. One sample was collected in July, five samples in August, three in November, ten in December,
and two in February. All wells except RS P24 are bedrock wells with a screened interval within the
Tuscumbia limestone. RS P24 is located in a well house, its casing is sealed and thus cannot be used for
monitoring purposes. Various geochemical and stable oxygen, hydrogen, and carbon isotope analyses
were conducted on the samples to trace the potential sources of water such as meteoric water in soil,
shallow epikarst water, carbonate matrix groundwater, and potential deep groundwater.

22
Figure 5. Water sample collection locations. USGS Stream Gage Station in Indian Creek where precipitation data was collected is also shown.
Sample collection and preservation: In order to collect a fresh and representative formation
groundwater sample for geochemical and isotopic analysis, wells were purged of at least three well

23
volumes prior to sampling. Samples were passed through a 0.45 μm pore-size filter, stored in
polyethylene bottles, and placed in a cooler for transportation. Samples for cation and trace element
analyses were acidified with 5% trace grade HNO3. Nine bottles of sample were collected at each
location: three 150 ml unfiltered bottles, and six 30 ml bottles for analyses including
nitrate/orthophosphate, dissolved organic carbon, oxygen/hydrogen isotopes, carbon isotopes, trace
elements/cations, and anions. It should be noted that, due to clogged well screens, RS 059 and RS 1278
require re-development to obtain better presentative formation water samples. The water chemistry
data for these two old wells are presented in this report only for reference and documentation purpose.
Re-analysis of water chemistry after well re-development is strongly recommended.
Task 1: Water table mapping and hydrograph analysis: Depth to water was measured in each
monitoring well (except RS P24 with well casing closed) a minimum of four times over a 12 month time
period from March 2016 to March 2017. Well casing heights were also measured and depth to water
was adjusted to known ground surface elevation accordingly. Water level elevations were also
calculated relative to sea level for each well. Time series data of stream discharge, precipitation, and
gage height were obtained from the “USGS 03575830 Indian Creek near Madison AL” stream station.
This station is located in Indian Creek directly north of the study area. Streams such as the Indian Creek
have the potential to either gain or lose water via groundwater discharge (gaining stream) or outflow via
streambed infiltration to groundwater (losing stream). Flow direction between groundwater and surface
water can change seasonally as the elevation of the water table fluctuates with respect to stream water
stage and storm events. The data allow us to determine the general flow direction and hydraulic
gradient between wells.
Water quality data collected in groundwater monitoring wells and the Bobcat Cave also allows
us to construct hydrographs during major storm events. These data and hydrographs may provide

24
additional constraints for geochemical data interpretation and identify main groundwater inputs to the
cave during a storm event. An automated data logger, TROLL 9000, was used to measure in-situ changes
in various water quality parameters including temperature, pressure, ORP, pH, and conductivity in RS
1781 from July 8-12, 2016 and in Bobcat Cave from November 23-December 5, 2016. Combination of
water quality data and daily or hourly precipitation can provide insight into the sources and internal
structure and transportation characteristics of karst aquifers (Ryan and Meiman, 1996). Sharp and
peaked hydrographs or water quality changes with quick response to storm events indicate the
occurrence of highly permeable conduits in carbonate bedrocks, while smooth hydrographs that lack
storm-impulse peaks indicate slow diffuse infiltration of water through relatively impermeable matrix.
Water quality parameters in conjunction with geochemistry (major ions, trace elements, and stable
isotopes) data can indicate a difference in water origin and water-rock interactions occurring along
subsurface flow paths.
Task 2: Electrical Resistivity Survey: To locate a potential injection location for future dye tracer
test, an electrical resistivity survey was conducted over a small portion of the study site with subsidence
features between Bobcat Cave and Indian Creek, approximately 100 meters east of RS P24 on January
25, 2016. An Advanced Geosciences, INC. SuperSting single channel resistivity system was utilized, with
a 24 electrode system configured in a dipole-dipole geometry with two meter electrode spacing. The
dipole-dipole geometry consists of paired electrode sets called a dipole. These sets contain a pair of
current electrodes and a pair of potential electrodes and each set functions independently from one
another. This array allows for high-resolution imaging of near surface features. Electrical resistivity (ER)
is a common geophysical survey technique used in shallow subsurface exploration, particularly in
groundwater studies. This method involves applying direct current (dc) or low-frequency alternating
current (ac) at the surface and measuring the potential difference (∆𝑉) between two points. Variations
in the resistance to current flow in the subsurface causes distinct variances in the potential difference

25
measurements. These differences are what allow researchers to make interpretations pertaining to the
subsurface (Burger et al., 2006).
The study of shallow karst features is a common application of electrical resistivity surveys. This
technique can be used to identify various features such as dissolution conduits and sinkholes. Water-
filled conduits may display as areas of lower resistivity in contrast to the surrounding higher resistivity
bedrock. Air-filled conduits are difficult to distinguish from the surrounding bedrock because the high
resistivity (infinite resistivity) of air does not contrast well against the surrounding high resistivity
bedrock (Zhu et al., 2011). Sinkholes can be identified when there is a “dip” or trough in a horizontal
layer showing uniform resistivity (Andrej and Uros, 2012).
Once data have been collected in the field, they were processed into an interpretable format
using AGI EarthImager 2-D Software developed by Advanced Geosciences, INC. The processing produces
various models based on forward and inverse modeling (AGI, 2016). The forward modeling begins with a
set of parameters, or a model, and works towards predicting the outcome of the data (i.e., the electrical
resistivity) in this case. Inverse modeling is the opposite, in which one begins with data (electrical
resistivity) and works towards a model (Sneider and Trampert, 1999).
Task 3: Field alkalinity test: Phenolphthalein as carbonate, and total alkalinity as bicarbonate
(HACH Method 8203) were measured either directly in the field or within 48 hours of sampling using a
HACH digital titrator. A sample volume of 100 mL was titrated with 1.600 ± 0.008 N sulfuric acid.
Phenolphthalein indicator powder and bromcresol green-methyl red indicator powder were used for
detection for color change at tritration points. These data were used along with major ion
concentrations to construct the Piper and Stiff diagrams for assessing geospatial variations in water
chemistry (Fetter, 2001). Piper diagrams were used to identify the various hydrochemical facies of

26
groundwater that occur throughout the study area. Stiff diagrams were constructed to visualize the
spatial change or shift in hydrochemical facies in the direction of groundwater flow.
Task 4: Geochemical analysis: Anion (SO42-, NO3
-, HCO3-, Cl-,) composition of samples were
analyzed using Ion Chromatography (IC) at TestAmerica Laboratories, Inc. in Pensacola, FL. Quadrupole
Inductively Coupled Plasma Mass Spectrometer (Q-ICP-MS) instrument at Auburn University was used to
analyze concentrations of cations (Na+, K+, Ca2+, Mg2+) and trace elements (Fe, Mn, Al, Rb, Sr, Ba, Cd, Cr,
Pb, As, and U, etc.) of groundwater samples.
Q-ICP-MS can rapidly measure trace elements at very low detection limits (at ug/L or ppt levels)
as well as major elements (at mg/L or ppm levels). Quantitative determination of elemental
concentrations relative to standard solutions was performed on PC-based ICP-MS MassHunter Software.
These data assist in characterizing groundwater geochemistry to delineate sources and major
hydrochemical facies.
Task 5: Stable isotope analysis: Analysis of stable isotope ratios of oxygen (18O/16O), hydrogen
(2H/1H), and carbon (13C/12C) were conducted using a Finnigan MAT delta PLUS XP stable isotope ratio
mass spectrometer at Florida State University. A carbonate core sample from groundwater monitoring
well RS 2221 was also collected for analysis of stable isotope ratios of oxygen (18O/16O) and carbon
(13C/12C). Oxygen and hydrogen isotope data were used to determine the source and potential mixing of
water within the watershed. Groundwater with long residence time in aquifers has the potential to
obtain heavy isotopes (18O, 2H) through water-rock interactions. If heavy isotopes are obtained over long
periods of time, water from deep formations would have the greatest abundance of heavy isotopes. In
contrast, younger meteoric water would have an abundance of lighter isotopes (16O, 1H) resembling
those of meteoric water. If samples are similar to that of the rainwater, it can be inferred as little water-
rock interaction and rapid transport before the water enters the aquifer (Penny et al., 2003). Carbon

27
isotope signatures were used to trace the source of carbon in the water. Samples with carbon derived
from the inorganic carbonate bedrock are expected to have higher concentrations of 13C, while those
affected by organic sources in shallow soil tend to have lighter 12C signatures (Faure, 1997; Natter et al.,
2012).
Task 6: Dissolved organic carbon (DOC) analysis: Degradation of organic matter in shallow
soil/aquifers represents the main input sources of DOC. DOC levels in groundwater may be used to trace
the changes in total organic loading in groundwater (organic compounds < 0.45 µm in diameter) derived
from natural or anthropogenic sources. Samples were sent to the Feed and Environmental Water
Laboratory, an extension of the University of Georgia in Athens for DOC analysis using a nondispersive
infrared analyzer. Standard Method (SM 5310B) and Environmental Protection Agency, EPA-415.1: Total
Organic Carbon in Water methods were used to carry out the analysis (Eaton et al., 1998; U.S.
Environmental Protection Agency, 1999).
Task 7: Volatile Organic Compounds (VOC) by GC/MS: Samples were sent to TestAmerica
Laboratories, Inc. in Pensacola, Florida for analysis of Benzene, Ethylbenzene, Toluene, Xylenes,
Tetrachloroethylene (PCE), and trichloroethylene (TCE). Due to limited funding, only two samples
collected from contaminated zone to the east of Indian Creek and one “control” sample were analyzed.
RS 1278 is located near an active air field, has relative high DOC contents, and we suspect that
groundwater from this well might be contaminated with navigation fuel or machine-degreasing organic
solvents. A groundwater sample from RS 2221 was also analyzed due to its proximity to the air field and
strong organic solvent odor and higher DOC contents. Groundwater sample of well RS 1780, collected
from the west side of Indian Creek, was also analyzed to compare if there were any differences in VOC
content on either side of the creek. EPA Method 8260C: Volatile Organic Compounds by Gas

28
Chromatography/Mass Spectrometry (GC/MS) was used for analysis (U.S. Environmental Protection
Agency, 2006).
Results
Hydrologic data and results of water sample geochemical analyses of trace elements, major
ions, stable isotopes, dissolved organic carbon concentrations, dissolved inorganic carbon
concentrations are organized and presented in Tables (7-15) based on sampling dates (July, August,
November, and December, 2016, and February, 2017). Samples with measured parameters collected
during “dry weather” and “wet weather” conditions are separated and grouped in all figures. Dry
weather samples include those collected during summer months of July and August, and November
when the study area was impacted by an extended period of drought. Wet weather samples were
collected in December and February after the study area received substantial rainfall.

29
Water Level and Hydrograph Analysis:
Table 6 shows water-level measurement results in the groundwater monitoring wells that were
selected for water sampling. Parameters including ground elevation, depth to bedrock, total well depth,
sample zone, and screened interval were taken from boring log data sheets obtained from the
Environmental Management Division of Redstone Arsenal. Groundwater levels were measured between
March 2016 and March 2017 (Table 6). Groundwater levels ranged from 172.37 meters above mean sea
level (amsl) (RS 059 on 11/23/16) to 181.34 meters above mean sea level (RS 1278 on 12/5/16). All wells
with the exception of RS 059 are considered deep wells. RS 059 was considered a shallow well in this
study because it is the only wells with a total depth of < 20 meters (Table 6). Water level fluctuation in
most wells was minimal during the entirety of the study. Water level fluctuation in RS 2221 was < 1 m
during the study. Water level fluctuated approximately 2 m in RS 1780, RS 1781, and RS 1414. Water
levels in RS 1278 and RS 059 fluctuated by almost 5 meters (Table 6). As mentioned earlier, these two
wells have clogged wells screens which more than likely affected our measurements.
Two complete water level data sets were collected during this study (Table 6). On February 24
and March 23, 2017, water levels were measured for all six groundwater monitoring wells. Groundwater
levels in the wells ranged from 175. 90 m amsl (RS 1781) to 178.28 m amsl (RS 2221) on February 24 and
from 176.3 m amsl (RS 1781) to 178.66 m amsl (RS 1414) on March 23. Water level fluctuation in each
well during this time period was < 1 meter. During this month time span, the study area received
approximately 11.4 cm of precipitation (National Water Information System, USGS, 2017), no significant
water level changes were observed in deep wells.

30
Ta
ble
6. M
on
ito
rin
g w
ell f
ield
par
amet
ers
and
USG
S G
age
Stat
ion
in In
dia
n C
reek
. *G
age
hei
ght
(sta
ge)
is t
he
hei
ght
of
the
wat
er in
th
e st
ream
ab
ove
a r
efer
ence
po
int.
Gag
e h
eigh
t re
fers
to
th
e el
evat
ion
of
the
wat
er s
urf
ace
in t
he
spec
ific
po
ol a
t th
e st
ream
-gag
ing
stat
ion
, no
t al
on
g th
e en
tire
str
eam
. Gag
e h
eigh
t al
so d
oes
no
t re
fer
to t
he
dep
th o
f th
e st
ream
. Mea
sure
men
ts o
f ga
ge h
eigh
t ar
e co
nti
nu
ally
rec
ord
ed
by
equ
ipm
ent
insi
de
a ga
geh
ou
se o
n t
he
stre
amb
ank
(So
urc
e: N
atio
nal
Wat
er In
form
atio
n S
yste
m, w
ater
dat
a.u
sgs.
gov)
. N
WS
flo
od
sta
ge is
7.5
ft.
(2
.29
m)
for
this
gag
e st
atio
n.
We
ll ID
M
eas
ure
me
nt
dat
e
Gro
un
d
Ele
vati
on
(m
am
sl)
de
pth
to
b
ed
rock
(m
bgs
)
tota
l w
ell
de
pth
(m
bgs
) sa
mp
le
zon
e
scre
en
ed
in
terv
al (
m
bgs
)
We
ll ca
sin
g h
eig
ht
(m)
De
pth
to
W
ate
r (m
b
toc)
Ad
just
ed
d
ep
th t
o
wat
er
fro
m
gro
un
d-
leve
l (m
)
Wat
er
leve
l e
leva
tio
n
(m a
msl
)
RS
12
78
8
/12
/20
16
1
95
.19
1
7.0
7
26
.64
B
edro
ck
21
.95
-26
.52
0
.80
1
9.2
3
18
.43
1
76
.77
1
2/5
/20
16
1
4.6
6
13
.86
1
81
.34
2
/24
/20
17
1
8.6
4
17
.84
1
77
.35
3
/23
/20
17
1
8.9
3
18
.13
1
77
.06
RS
22
21
8
/12
/20
16
1
92
.37
1
4.9
4
21
.18
B
edro
ck
17
.98
-21
.03
0
.69
1
4.7
3
14
.05
1
78
.33
1
2/6
/20
16
1
4.9
4
14
.25
1
78
.13
2
/24
/20
17
1
4.7
8
14
.10
1
78
.28
3
/23
/20
17
1
4.5
8
13
.89
1
78
.48
RS
17
80
3
/29
/20
16
1
78
.24
4
.88
2
1.6
4
Bed
rock
1
8.2
9-2
1.3
4
0.9
9
1.3
0
0.3
1
17
7.9
3
8
/12
/20
16
3
.15
2
.16
1
76
.08
1
2/5
/20
16
3
.51
2
.51
1
75
.73
2
/24
/20
17
2
.77
1
.78
1
76
.46
3
/23
/20
17
2
.12
1
.13
1
77
.11

31
RS
17
81
3
/29
/20
16
1
87
.92
7
.92
2
1.9
5
Bed
rock
1
6.7
6-2
1.3
4
NA
1
1.3
8
11
.38
1
76
.53
8
/11
/20
16
1
3.0
0
13
.00
1
74
.91
1
2/5
/20
16
1
3.3
4
13
.34
1
74
.58
2
/24
/20
17
1
2.0
1
12
.01
1
75
.90
3
/23
/20
17
1
1.6
2
11
.62
1
76
.30
RS
05
9
3/2
9/2
01
6
17
7.9
1
7.3
2
10
.36
In
terf
ace
5
.79
-10
.36
0
.56
1
.04
0
.48
1
77
.43
1
1/2
3/2
01
6
6.1
0
5.5
4
17
2.3
7
1
2/5
/20
16
4
.78
4
.22
1
73
.70
2
/24
/20
17
1
.24
0
.69
1
77
.23
3
/23
/20
17
0
.91
0
.35
1
77
.56
RS
14
14
1
1/2
3/2
01
6
19
6.0
8
21
.34
2
5.9
1
Bed
rock
2
2.8
6-2
5.9
1
0.6
6
20
.04
1
9.3
8
17
6.7
0
1
2/5
/20
16
1
9.7
1
19
.05
1
77
.03
2
/24
/20
17
1
8.8
5
18
.19
1
77
.89
3
/23
/20
17
1
8.0
8
17
.42
1
78
.66
lo
cate
d in
we
ll h
ou
se, c
asin
g is
sea
led
an
d t
hu
s n
ot
suit
able
fo
r d
ye in
ject
ion
or
mo
nit
ori
ng
RS
P2
4
*Gag
e h
eig
ht
(m)
USG
S
03
57
58
30
3/2
9/2
01
6
18
3.1
9
1.0
3
8/1
1/2
01
6
0
.77
8/1
2/2
01
6
0
.77
11
/23
/20
16
0.8
3
12
/5/2
01
6
0
.94
12
/6/2
01
6
1
.66
2/2
4/2
01
7
0
.95
3
/23
/20
17
1
.01

32
Figures 6-8 show results from in-situ water quality measurements taken within a pool of
groundwater in the Bobcat Cave between November 23 and December 5, 2016. Fluctuations in
temperature (Fig. 6), pressure (Fig. 7), and electrical conductivity (Fig. 8) were measured in response to
large rainfall events (shown as vertical bars) from November 29 – 30. Step-wise drops of temperature
and conductivity and rises of pressure were observed almost immediately following the main rainfall
events.
Figure 6. TROLL 9000 water temperature data from in-situ measurements of Bobcat Cave with precipitation from November 23 – December 5, 2016. Both temperature and precipitation measurements were collected on a 15 minute time interval. A rapid decrease in water temperature correlated with several major storm events (> 2 cm rainfall in 15 minutes) from November 29-30.

33
Figure 7. TROLL 9000 pressure data from in-situ measurements of Bobcat Cave with precipitation from November 23 – December 5, 2016. Both pressure and precipitation measurements were collected on a 15 minute time interval. A rapid increase in pressure (increase in water depth) correlated with the several major storm events (> 2 cm rainfall in 15 minutes) from November 29-30.
Figure 8. TROLL 9000 electrical conductivity data from in-situ measurements of Bobcat Cave with precipitation from November 23 – December 5, 2016. Both conductivity, and precipitation measurements were collected on a 15 minute time interval. A rapid decrease in conductivity correlated with several major storm events (> 2 cm rainfall in 15 minutes) from November 29-30.

34
Figures 9-11 show results from in-situ water quality measurements taken in groundwater
monitoring well RS 1781 from July 8 – 12, 2016. Changes in temperature (Fig. 9), and pressure (Fig. 10)
were consistent with expected daily fluctuations given the insignificant amount of rainfall while the
increase in conductivity (Fig. 11) was unexpected and may have been caused by sensor malfunction. The
data show a trend with slow drop in pressure and water level during this dry summer period.
Figure 9. TROLL 9000 temperature data from in-situ measurements of RS 1781 with total daily precipitation (vertical bars) from July 8-12, 2016. Temperature measurements were collected on a 15 minute time interval. Daily temperature fluctuation expected during a 24 hour period was recorded. Significant rainfall did not occur during this time period to affect groundwater temperature.

35
Figure 10. TROLL 9000 pressure data from in-situ measurements of RS 1781 with total daily precipitation (vertical bar) from July 8-12, 2016. Pressure measurements were collected on a 15 minute time interval. Daily pressure fluctuation expected during a 24 hour period was recorded. Significant rainfall did not occur during this time period to affect pressure reading. The data show a trend with slow drop in pressure and water level during this dry summer period.
Figure 11. TROLL 9000 electrical conductivity data from in-situ measurements of RS 1781 with total daily precipitation (vertical bars) from July 8-12, 2016. Electrical conductivity measurements were collected on a 15 minute time interval. Significant rainfall did not occur during this time period. It is unclear why conductivity increased after July 10, it may be caused by instrument problems with conductivity sensor during deployment.

36
Electrical Resistivity Survey Results:
Figure 12 shows results from our January 25, 2016 electrical resistivity survey. Blue colors
represent areas of low resistivity likely associated with saturated soils or water-filled conduits, green
colors represent areas of intermediate resistivity such as unconsolidated regolith or epikarst, and areas
of red colors represent areas of high resistivity perhaps occupied by either carbonate bedrock or air-
filled conduits. The vertically-extending blue-colored area at the 28 meter mark along Line 1 suggests
the potential presence of a water-filled conduit system leading from the surface to the bedrock (Fig. 12).
Hand augering or overburden excavation would be required to further verify this potential dye injection
location.
Figure 12. Electrical resistivity results from four transects arranged west-east approximately 100 meters east of RS P24 between Bobcat Cave and Indian Creek. The blue-color area of low resistivity along Line 1 suggests there is a possible conduit system present surrounded on either side by areas of high resistivity (red-color). Results could not be confirmed because the presence of unexploded ordnances (UXOs) prohibited using a hand auger to dig at the site.
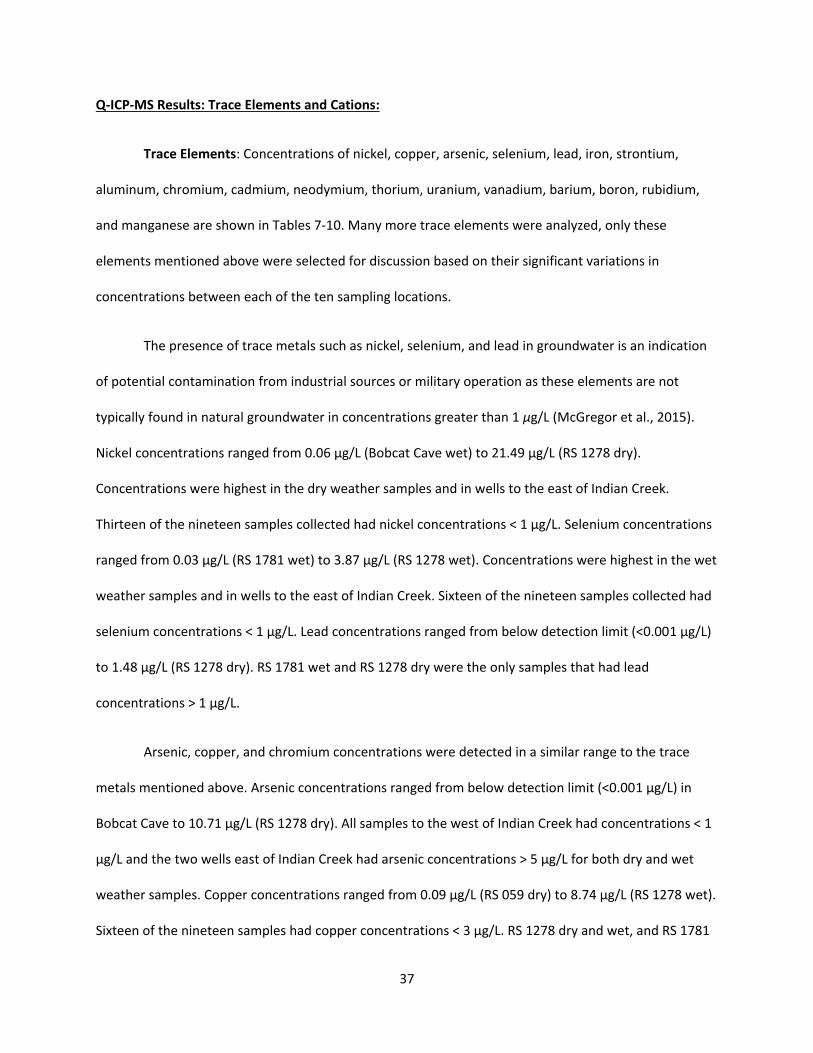
37
Q-ICP-MS Results: Trace Elements and Cations:
Trace Elements: Concentrations of nickel, copper, arsenic, selenium, lead, iron, strontium,
aluminum, chromium, cadmium, neodymium, thorium, uranium, vanadium, barium, boron, rubidium,
and manganese are shown in Tables 7-10. Many more trace elements were analyzed, only these
elements mentioned above were selected for discussion based on their significant variations in
concentrations between each of the ten sampling locations.
The presence of trace metals such as nickel, selenium, and lead in groundwater is an indication
of potential contamination from industrial sources or military operation as these elements are not
typically found in natural groundwater in concentrations greater than 1 μg/L (McGregor et al., 2015).
Nickel concentrations ranged from 0.06 µg/L (Bobcat Cave wet) to 21.49 µg/L (RS 1278 dry).
Concentrations were highest in the dry weather samples and in wells to the east of Indian Creek.
Thirteen of the nineteen samples collected had nickel concentrations < 1 µg/L. Selenium concentrations
ranged from 0.03 µg/L (RS 1781 wet) to 3.87 µg/L (RS 1278 wet). Concentrations were highest in the wet
weather samples and in wells to the east of Indian Creek. Sixteen of the nineteen samples collected had
selenium concentrations < 1 µg/L. Lead concentrations ranged from below detection limit (<0.001 µg/L)
to 1.48 µg/L (RS 1278 dry). RS 1781 wet and RS 1278 dry were the only samples that had lead
concentrations > 1 µg/L.
Arsenic, copper, and chromium concentrations were detected in a similar range to the trace
metals mentioned above. Arsenic concentrations ranged from below detection limit (<0.001 µg/L) in
Bobcat Cave to 10.71 µg/L (RS 1278 dry). All samples to the west of Indian Creek had concentrations < 1
µg/L and the two wells east of Indian Creek had arsenic concentrations > 5 µg/L for both dry and wet
weather samples. Copper concentrations ranged from 0.09 µg/L (RS 059 dry) to 8.74 µg/L (RS 1278 wet).
Sixteen of the nineteen samples had copper concentrations < 3 µg/L. RS 1278 dry and wet, and RS 1781

38
wet had copper concentrations > 8 µg/L. Chromium concentrations ranged from 0.02 µg/L (RS 1780 dry)
to 10.41 µg/L (RS 1414 wet). RS 1414, located near RSA’s north boundary next to I-565, displayed a spike
in chromium levels in both dry and wet samples compared to all other samples. Both RS 1414 samples
had chromium concentrations > 10 µg/L and all other samples had concentrations < 3 µg/L.
Aluminum concentrations also fluctuated spatially within the study area. Concentrations ranged
from below detection limit (<0.001 µg/L) in RS P24 dry to 1405.67 µg/L in RS 1278 dry. Both dry and wet
weather samples for RS 2221, RS 1278, and RS 1414, and Indian Creek wet weather had aluminum
concentrations > 600 µg/L. The twelve other samples all had aluminum concentrations < 160 µg/L.
Iron, strontium, and rubidium had similar variations in concentrations across the study area.
Iron concentrations ranged from 0.67 µg/L (RS 1780 dry) to 369.90 µg/L (Indian Creek dry). Iron
concentrations were < 75 µg/L in sixteen of the nineteen samples collected. Indian Creek wet, and RS
1278 wet and dry had iron concentrations ranging from 304-369 µg/L. Strontium concentrations ranged
from 22.04 µg/L (RS P24 dry) to 245.87 µg/L (RS 2221 wet). Three of the four samples collected from
wells to the east of Indian Creek had concentrations > 200 µg/L, and all samples to the west of Indian
Creek has concentrations < 110 µg/L. Concentrations of individual wells did not fluctuate significantly
from dry to wet weather. Rubidium concentrations ranged from 0.41 µg/L (RS 059 wet) to 471.87 µg/L
(RS 1278 dry). Concentration levels are elevated in samples on the east side of Indian Creek. All samples
west of Indian Creek have concentrations < 7 µg/L and all samples east of the creek have concentrations
> 70 µg/L.
Cadmium, neodymium, thorium, and uranium concentrations displayed similar variations to one
another in concentrations across the study area. Cadmium concentrations ranged from below detection
limit (<0.001 µg/L) to 0.18 µg/L (RS 1781 wet). RS 1781 wet and dry were the only samples with
concentration > 0.1 µg/L. Neodymium concentrations ranged from 0.01 µg/L (RS 2221 dry) to 0.82 µg/L

39
(RS 1278 dry). RS 1278 dry and wet, and Indian Creek wet were the only samples with concentrations >
0.3 µg/L. Thorium concentrations ranged from below detection limit (<0.001 µg/L) in RS 1414 wet to
0.29 µg/L (RS 1278 dry). A small spike in concentration is displayed in RS 1278 dry and wet, as well as
Indian Creek dry samples, similar to neodymium concentrations. Uranium concentrations ranged from
0.001 µg/L (RS 1414 wet) to 0.63 µg/L (RS 059 dry). Dry weather samples from each location have higher
concentrations than their wet weather sample.
Vanadium, boron, barium, and manganese concentrations displayed similar variations to one
another in concentrations across the study area. Vanadium concentrations ranged from 0.21 µg/L (RS
1280 dry) to 74.91 µg/L (RS 1278 wet). Both dry and wet weather samples for RS 1414, RS 2221, and RS
1278 had vanadium concentrations > 9 µg/L and all other samples had concentrations < 2 µg/L. RS 1278
wet concentration was three times greater than any of the other samples. Boron concentrations ranged
from 1.97 µg/L (RS 1414 wet) to 88.16 µg/L (RS 1278 wet). RS 1278 dry and wet were the anomalies with
concentrations > 80 µg/L. The seventeen other samples had concentrations < 12 µg/L. Barium
concentrations ranged from below detection limit (<0.001 µg/L) to 23.23 µg/L (Indian Creek dry). Dry
weather concentrations for Indian Creek, RS 1781, RS 1780, RS 2221, and RS 1278 were significantly
higher than their wet weather samples. Manganese concentrations ranged from 0.10 µg/L (RS 2221 dry)
to 142.69 µg/L (RS 1781 dry). Indian Creek wet and dry, RS 1781 wet and dry, and RS 1780 dry all
displayed spikes in concentration. RS 1781 and RS 1780 dry had concentrations > 100 µg/L while no
other sample had a concentration > 35 µg/L.

40
Table 7. Measured trace element and major ion concentrations of samples collected in July 8, 2016. Star (*) represents data from ICP-MS semi-quantitative “quickscan” analysis. These data can only be used as reference, not quantitative analysis due to the lack of standard samples. “BD” indicates value was below detection limit.
Parameter unit Indian Creek
Be µg/L 0
B µg/L 3.69
NO3- µg/L 1200
Na+ µg/L 2434.79
Mg2+ µg/L 4886.15
Al µg/L 8.63
PO43- µg/L BD
Cl- µg/L 4410.33
K+ µg/L 943.46
Ca2+ µg/L 50498.62
V µg/L 0.37
Cr µg/L 0.34
Mn µg/L 35.73
Fe µg/L 25.41
Co µg/L 0.05
Ni µg/L 0.63
Cu µg/L 0.27
Zn µg/L BD
As µg/L 0.42
Se µg/L 0.05
Rb µg/L 1.44
Sr µg/L 58.54
Ag µg/L BD
Cd µg/L 0.03
Ba µg/L 23.23
Nd µg/L 0.01
Pb µg/L 0.03
Th µg/L BD
U µg/L 0.23
SO42- µg/L 2948.64
HCO3- µg/L 82200
CO32- µg/L 0
Li* µg/L 0.53
Ti* µg/L 0.24
Y* µg/L 0.19
Zr* µg/L 0
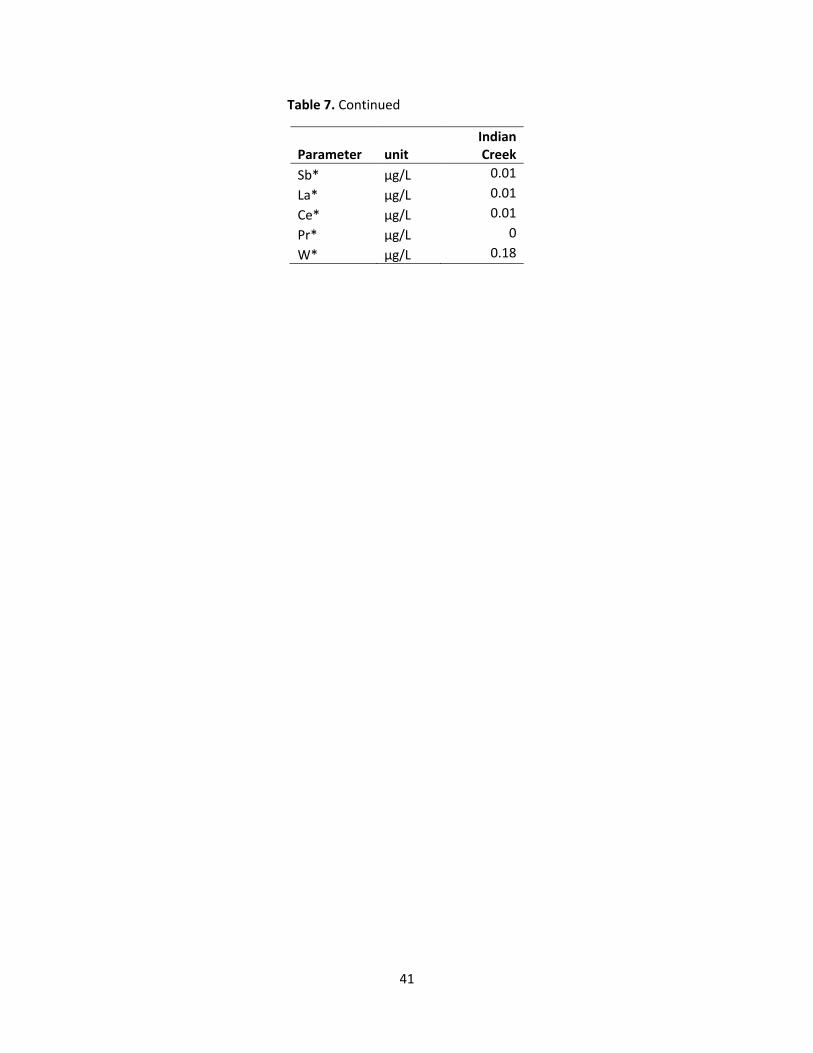
41
Table 7. Continued
Parameter unit Indian Creek
Sb* µg/L 0.01
La* µg/L 0.01
Ce* µg/L 0.01
Pr* µg/L 0
W* µg/L 0.18

42
Table 8. Measured trace element and major ion concentrations of samples collected in August 11-12, 2016 sampling event. *represents data from ICP-MS “quickscan” semi-quantitative analysis. These data can only be used as reference, not quantitative analysis due to the lack of standard samples. “BD” indicates value was below detection limit.
Parameter unit RS 1781 RS 1780 RS P24 RS 2221 RS 1278
Be µg/L 0 0 0 0 0
B µg/L 7.22 5.89 3.42 11.27 84.01
NO3- µg/L 340 120 470 27 350
Na+ µg/L 3550.76 4077.72 652.25 121638.65 93851.04
Mg2+ µg/L 1437.79 13126.84 4127.49 4.22 44.09
Al µg/L 2.31 1.98 1.97 1375.72 1405.67
PO43- µg/L BD BD BD 360 BD
Cl- µg/L 1531.52 2849.98 680.54 10015.04 3848.85
K+ µg/L 643.23 942.97 165 46153.31 189542.63
Ca2+ µg/L 45239.47 38817.1 30985.16 25957.93 6807.68
V µg/L 0.43 0.21 0.35 4.87 12.84
Cr µg/L 0.04 0.02 1.07 1.02 2.2
Mn µg/L 142.69 102.2 0.56 0.1 1.99
Fe µg/L 2.17 0.67 8.93 13.16 344.76
Co µg/L 0.17 0.12 0 0.07 1.1
Ni µg/L 0.83 2.16 0.16 17.67 21.49
Cu µg/L 0.23 0.93 0.39 0.71 8.19
Zn µg/L 0.43 2.51 6.76 BD 1.38
As µg/L 0.93 0.9 0.6 5.16 10.71
Se µg/L 0.05 0.16 0.05 0.91 2.91
Rb µg/L 1.41 3.02 0.48 123.57 471.87
Sr µg/L 58.85 79.96 22.04 220.96 202.69
Ag µg/L BD BD BD BD BD
Cd µg/L 0.16 0.06 0.03 0.02 0.03
Ba µg/L 20.99 11.39 3.4 16.69 12.58
Nd µg/L 0.02 0.02 0.02 0.01 0.82
Pb µg/L 0.08 0.32 0.01 0.85 1.48
Th µg/L 0.02 0.01 0.01 0.01 0.29
U µg/L 0.35 0.3 0.04 0 0.18
SO42- µg/L 2655.42 15083.95 427.55 116767.96 30513.56
HCO3- µg/L 57600 79200 53400 0 70200
CO32- µg/L 0 0 0 165600 177000
Li* µg/L 0.92 0.68 0.23 9.16 6.29
Ti* µg/L 0.03 0.11 0.11 0.42 8.89
Y* µg/L 0.05 0.03 0 0.01 0.9
Zr* µg/L 0 0 0 0.01 0.41
Sb* µg/L 0.02 0.15 0.02 0.4 0.97

43
Table 8. Continued
Parameter unit RS 1781 RS 1780 RS P24 RS 2221 RS 1278
La* µg/L 0 0 0 0 0.22
Ce* µg/L 0.01 0 0 0 0.36
Pr* µg/L 0 0 BD 0 0.09
W* µg/L 0 0.01 BD 0.88 1

44
Table 9. Measured trace element and major ion concentrations of samples collected in November 23, 2016 sampling event. Star (*) represents data from ICP-MS “quickscan” semi-quantitative analysis. These data can only be used as reference, not quantitative analysis due to the lack of standard samples. “BD” indicates value was below detection limit.
Parameter unit Bobcat
Cave RS 059 RS 1414
Be µg/L 0 0.05 0
B µg/L 6.33 3.25 4.35
NO3- µg/L 270 160 370
Na+ µg/L 913.9 1182.52 2644.12
Mg2+ µg/L 1784.43 2529.3 187.89
Al µg/L 6.1 160.42 991.47
PO43- µg/L BD BD BD
Cl- µg/L 1880 1310 1570
K+ µg/L 493.23 78.24 1605.14
Ca2+ µg/L 58074.97 70263.13 42119.53
V µg/L 0.27 0.67 9.9
Cr µg/L 1.19 0.87 10.14
Mn µg/L 0.27 1.67 0.44
Fe µg/L 1.61 58.64 6.1
Co µg/L 0 0.04 0.08
Ni µg/L 0.09 0.28 0.52
Cu µg/L 0.29 0.09 0.76
Zn µg/L 0.31 2.63 BD
As µg/L BD 0.07 0.64
Se µg/L 0.07 0.07 0.11
Rb µg/L 0.66 0.49 4.16
Sr µg/L 57.22 107.53 58.52
Ag µg/L 0.21 0.08 0.13
Cd µg/L 0.02 0.01 BD
Ba µg/L 7.46 10.32 3.58
Nd µg/L 0.05 0.22 0.01
Pb µg/L BD BD BD
Th µg/L 0.01 0.03 0
U µg/L 0.31 0.63 0
SO42- µg/L 5740 4790 9060
HCO3- µg/L 64800 11400 117600
CO32- µg/L 0 0 51600
Li* µg/L <3.44 <3.19 <3.20
Ti* µg/L <0.42 4.41 <0.39
Y* µg/L 0.30 0.34 0.05
Zr* µg/L <0.01 0.15 <0.005

45
Table 9. Continued
Parameter unit Bobcat
Cave RS 059 RS 1414
Sb* µg/L 0.02 0.02 0.10
La* µg/L 0.08 0.17 0.03
Ce* µg/L 0.04 0.31 0.02
Pr* µg/L 0.04 0.04 0.01
W* µg/L 0.01 0.02 1.37

46
Ta
ble
10
. Me
asu
red
tra
ce e
lem
ent
and
maj
or
ion
co
nce
ntr
atio
ns,
in µ
g/L,
of
sam
ple
s co
llect
ed in
Dec
emb
er 5
-6, 2
01
6. “
BD
”: b
elo
w d
etec
tio
n
limit
.
Par
ame
ter
Bo
bca
t C
ave
M
atth
ew
s C
ave
In
dia
n
Cre
ek
Rai
nw
ate
r 1
R
S 0
59
R
S 1
78
1
RS
17
80
R
S 1
41
4
RS
22
21
R
S 1
27
8
Be
0
0
0.0
5
0
0
0
0
0.0
5
0
0
B
6.3
8
5.6
6
9.7
B
D
1.9
8
6.3
4
5.5
1
.97
1
1.2
4
88
.16
NO
3-
31
0
14
20
6
00
-
19
0
66
0
13
40
3
70
<
40
<
40
Na+
10
09
.53
2
34
7.9
6
18
84
.54
2
86
.52
1
19
2.5
1
33
89
.75
2
51
8.3
6
27
14
.01
1
10
49
6.2
5
80
64
7.5
7
Mg2
+
17
86
.07
3
12
6.7
4
19
50
.64
1
20
.43
2
25
4.9
5
14
56
.04
1
43
59
.21
1
18
.38
1
7.4
9
58
.09
Al
11
.76
4
3.1
2
81
9.1
6
4.2
2
49
.28
1
38
.65
4
4.0
8
69
4.7
9
10
16
.09
1
16
9.5
7
PO
43
- B
D
BD
B
D
- B
D
BD
B
D
BD
<
80
<
80
Cl-
19
20
5
27
0
31
30
-
18
30
2
83
0
40
70
1
66
0
95
20
4
75
0
K+
52
9.9
1
94
4.0
2
24
30
.28
6
53
.6
12
0.5
2
18
1.9
9
56
8.8
1
17
09
.81
2
70
73
.83
1
47
89
4.5
4
Ca2
+ 5
42
05
.34
4
87
85
.73
1
90
89
.71
5
81
.32
7
38
69
.52
4
80
11
.06
4
26
58
.69
3
59
36
.05
2
92
17
.69
1
89
0.7
8
V
0.2
8
0.2
2
1.8
4
0.1
3
0.3
8
0.7
2
0.3
6
10
.16
2
0.6
3
74
.91
Cr
1.4
3
0.6
1
0.9
9
0.0
1
0.7
3
0.6
7
0.3
1
10
.41
0
.34
2
Mn
0
.41
0
.44
2
4.2
0
.9
1.4
4
35
.36
1
.9
1.2
8
0.4
4
2.1
8
Fe
3.6
3
18
.81
3
69
.89
1
.41
2
0.5
7
72
.17
1
5.2
6
3.8
1
15
.43
3
04
.92
Co
B
D
0.0
1
0.5
5
0.0
2
0.0
1
0.1
7
0.0
2
0.0
8
0.0
4
0.8
1
Ni
0.0
6
0.7
9
0.8
1
0.0
7
0.2
5
1.6
3
0.8
2
0.8
8
10
.35
1
8.8
7
Cu
0
.35
0
.17
1
.2
0.4
7
0.6
5
8.1
8
1.7
3
2.3
5
0.5
8
8.7
4
Zn
0.2
2
.7
1.2
2
1.2
1
2.8
7
17
.39
3
.77
0
.95
B
D
0.8
8
As
BD
0
.06
0
.83
B
D
0.0
3
0.4
5
0.2
7
0.6
6
5.2
5
9.7
6
Se
0.0
5
0.1
3
0.0
7
0.0
4
0.0
5
0.0
3
0.2
2
0.0
5
1.3
3
3.8
7
Rb
0
.68
1
.44
2
.55
0
.99
0
.41
6
.05
0
.88
4
.01
7
1.6
8
43
9.7
6
Sr
55
.13
5
9.7
2
34
.48
1
.29
9
9.1
9
62
.18
7
9.5
8
57
.8
24
5.8
7
12
0.9
8
Ag
0.0
6
0.0
5
0.0
1
0.0
3
0.0
3
0.0
3
0.0
2
BD
B
D
0.1
3
Cd
0
0
.02
B
D
BD
0
.05
0
.18
0
.05
B
D
BD
0
Ba
7.2
3
5.8
9
11
.2
BD
9
.49
8
.22
B
D
4.1
9
8.9
B
D
Nd
0
.04
0
.07
0
.42
0
.02
0
.05
0
.11
0
.03
0
.01
0
.01
0
.65

47
Ta
ble
10
. Co
nti
nu
ed
Par
ame
ter
Bo
bca
t C
ave
M
atth
ew
s C
ave
In
dia
n
Cre
ek
Rai
nw
ate
r 1
R
S 0
59
R
S 1
78
1
RS
17
80
R
S 1
41
4
RS
22
21
R
S 1
27
8
Pb
B
D
BD
B
D
BD
0
.17
1
.43
0
.71
0
.28
B
D
0.8
7
Th
0
0
0.1
0
0
.01
0
.02
0
B
D
0
0.2
6
U
0.2
6
0.2
3
0.0
8
0
0.4
9
0.2
3
0.1
9
0
0.0
1
0.2
3
SO4
2-
20
00
4
97
0
81
00
-
42
60
1
75
0
10
00
0
90
90
1
17
00
0
30
90
0
HC
O3
- 8
04
00
6
66
00
2
76
00
-
97
80
0
69
60
0
82
20
0
78
00
1
62
00
8
46
00
CO
32
- 0
0
0
-
0
0
0
43
80
0
11
28
00
1
56
00
0
Li*
<3.1
4
<3.4
1
<2.9
9
<3.2
5
<3.1
1
9.6
2
8.9
0
9.1
6
37
.30
4
3.4
9
Ti*
1
.09
1
.18
1
4.5
2
0.3
9
7.5
4
4.6
5
<0.3
8
<0.3
9
<0.3
9
15
.01
Y*
0.2
3
0.8
5
0.4
9
0.0
1
0.1
0
0.2
3
0.1
3
0.0
5
<0.0
1
0.8
6
Zr*
<0.0
05
0
.03
0
.96
0
.03
0
.09
0
.22
0
.00
5
<0.0
05
0
.01
1
.24
Sb*
0
.08
<0
.01
0
.18
0
.04
<0
.01
0
.14
0
.14
0
.23
1
.50
1
.62
La*
0.0
3
0.1
3
0.5
0
0.0
5
0.1
0
0.2
0
0.0
2
0.0
3
0.0
2
0.9
3
Ce*
0
.03
0
.05
0
.99
0
.02
0
.06
0
.22
0
.03
0
.01
0
.03
1
.88
Pr*
0
.03
0
.00
8
0.1
4
0.0
1
0.0
1
0.0
3
0.0
3
<0.0
01
0
.01
0
.26
W*
0.0
3
0.1
2
29
.26
5
.18
0
.09
1
.16
0
.05
1
.30
1
0.1
2
14
.54

48
Major Cations: Concentrations of cations including magnesium, calcium, sodium, and potassium
are shown in Tables 7-10. The spatial variation in sodium, potassium, and calcium concentrations
throughout the study area were quite pronounced. Sodium concentrations ranged from 652 µg/L (RS
P24 dry) to 121,638 µg/L (RS 2221 dry). There was a significant difference in concentration levels
between samples from the west and east sides of Indian Creek. Samples to the west of the creek are less
than 5,000 µg/L for both dry and wet weather, while samples to the east of the creek had
concentrations > 80,000 µg/L for both dry and wet weather. Potassium concentrations showed similar
trends to that of sodium with concentrations that ranged from 78 µg/L (RS 059 dry) to 189,542 µg/L (RS
1278 dry). Samples to the west of the creek had potassium concentrations < 2,500 µg/L for both dry and
wet weather, and samples to the east of the creek had concentrations > 27,000 µg/L for both dry and
wet weather. Calcium concentrations ranged from 1,890 µg/L (RS 1278 wet) to 73,869 µg/L (RS 059
wet). Concentrations were consistent from well to well and from dry to wet weather samples. RS 1278
dry and wet weather samples had significantly lower calcium concentration levels than the other
samples.
Magnesium concentrations ranged from 4 µg/L (RS 2221 dry) to 14,359 µg/L (RS 1780 wet). Both
dry and wet samples of RS 1780 had concentrations > 13,000 µg/L and all other samples had
concentrations < 5,000 µg/L. Magnesium concentrations for both dry and wet weather for samples west
of Indian Creek were higher than concentrations of samples collected to the east of Indian Creek.
Ion Chromatography Results
Major Anions: Concentrations of chloride, sulfate, bicarbonate, carbonate, nitrate, and
orthophosphate are shown in Tables 7-10. Sulfate concentrations range from 430 µg/L (RS P24 dry) to
117,000 µg/L (RS 2221 wet). RS 2221 wet and dry sulfate concentrations are significantly greater than all
other samples. Both RS 2221 sample concentrations were > 100,000 µg/L and all other samples had

49
concentrations < 31,000 µg/L. Chloride concentrations ranged from 680 µg/L (RS P24 dry) to 10,020 µg/L
(RS 2221 dry). RS 2221 dry and wet had spiked concentration levels with respect to the other samples.
Bicarbonate (HCO3-) concentrations ranged from 0 µg/L (RS 2221 dry) to 117,600 µg/L (RS 059 dry).
Carbonate (CO32-) was only detected at one location (RS 1414) to the west of Indian Creek, and in both
groundwater wells (RS 2221, RS 1278) to the east of Indian Creek. Concentrations ranged from 43,800
µg/L (RS 1414 wet) to 177,000 µg/L (RS 1278 dry). Twelve of the eighteen samples have dominant
bicarbonate alkalinity. Dry and wet samples for RS 1414, RS 2221, and RS 1278 were the only samples
that had carbonate-dominated alkalinity, indicating that these samples have CO32- dominated carbonate
compared to the twelve samples that were HCO3- bicarbonate dominated water. At a pH range from
6.35 to 10.33, HCO3- is predominant, and accounts for nearly 100% of total carbonate (Drever, 1997). At
pH > 10.33, CO32- becomes the dominant carbonate species. Nitrate (NO3
-) as nitrogen concentrations
(Tables 7-10) ranged from 27 µg/L (RS 2221 dry) to 1,420 µg/L (Matthews Cave wet). Nitrate
concentrations were higher to the west of Indian Creek with respect to sampling locations to the east of
the creek. Matthews Cave, Indian Creek, and RS 1780 showed elevated levels of nitrate with respect to
the other sampling locations. Orthophosphate (PO4-3) as phosphorus concentrations were below
detection limit in all samples west of Indian Creek, including Indian Creek, and Matthews Cave to the
east of the creek. Phosphorus concentrations ranged from < 80 µg/L (RS 2221, and RS 1278 wet) to 360
µg/L (RS 2221 dry).
Stable isotope ratio mass spectrometer results:
13C/12C ratios (δ13C) values of dissolved inorganic carbon (DIC) are expressed in parts per
thousand (per mil, ‰) with reference to the standard Vienna Pee Dee Belemnite (VPDB). δ13C values
(Tables 11-15), of water samples ranged from -6.82 ‰ (RS 1278 wet) to -22 ‰ (RS 2221 wet). The core
carbonate rock sample from RS 2221 had a δ13C value of 1.70 ‰, significantly higher than those in the

50
groundwater and surface water samples. Samples from Bobcat Cave, RS 059, and Indian Creek had
notably lower δ13C values compared to those of deep wells RS 1780 and RS 1781. RS 2221 and RS 1278
had significantly different carbon isotope signatures compared to those of Bobcat Cave. RS 2221 dry and
wet values indicated very depleted δ13C signatures. RS 1278 samples had the heaviest δ13C signatures.
18O/16O ratios (δ18O) values for water samples are expressed in parts per thousand (per mil, ‰)
with reference to Vienna Standard Mean Ocean Water (VSMOW) (Tables 11-15). δ18O values ranged
from -3.71 ‰ (Matthews Cave wet) to -7.59 ‰ (Indian Creek wet). RS 2221 and RS 1278 dry samples
showed depleted δ18O signatures compared to the other well samples. The core sample from RS 2221
had a δ18O value of 24.55 ‰, significantly higher than those of water samples. The original value for the
core sample was expressed with respect to standard Vienna Pee Dee Belemnite (VPDB) as -5.30 ‰ and
converted to VSMOW using the following equation from Coplen et al., 1983 and Rollinson, 1993.
δ18OVSMOW = 1.03091 δ18OPDB + 30.01 (1)
2H/1H ratios (δD) values are expressed in parts per thousand (per mil, ‰) with reference to
Vienna Standard Mean Ocean Water (VSMOW) (Tables 11-15). δD values ranged from -22.65 ‰
(Matthews Cave wet) to -49.06 ‰ (Indian Creek wet). These are the same samples that make up the
highest and lowest δ18O signatures.

51
Table 11. Measured oxygen, hydrogen, and carbon isotope values, dissolved inorganic carbon (DIC), and dissolved organic carbon (DOC) concentrations of samples collected in July 8, 2016.
Parameter unit Indian Creek
δ18O ‰, VSMOW -4.96
δD ‰, VSMOW -27.93
δ13C ‰, VPDB -9.92
DIC % C 0.004
DOC mg/L 6.06
Table 12. Measured oxygen, hydrogen, and carbon isotope values, dissolved inorganic carbon (DIC), and dissolved organic carbon (DOC) concentrations of samples collected in August 11-12, 2016.
Parameter unit RS 1781 RS 1780 RS P24 RS 2221 RS 1278
δ18O ‰, VSMOW -5.86 -5.50 -5.70 -6.73 -6.75
δD ‰, VSMOW -32.68 -31.92 -30 -32.76 -28
δ13C ‰, VPDB -9.59 -9.06 -8.80 -22.38 -8.59
DIC % C 0.003 0.003 0.003 0.001 0.003
DOC mg/L 3.43 4.32 2.09 12.40 24.60
Table 13. Measured oxygen, hydrogen, and carbon isotope values, dissolved inorganic carbon (DIC), and dissolved organic carbon (DOC) concentrations of samples collected in November 23, 2016. * indicates sample with signal too low for accurate result.
Parameter unit Bobcat Cave RS 059 RS 1414
δ18O ‰, VSMOW -5.03 -5.11 -5.42
δD ‰, VSMOW -28.1 -26.91 -30.25
δ13C ‰, VPDB -11.12 -11.74 -20.06*
DIC % C 0.004 0.005 < 0.000*
DOC mg/L 3.26 5.09 1.58

52
Ta
ble
14
. Me
asu
red
oxy
gen
, hyd
roge
n, a
nd
car
bo
n is
oto
pe
valu
es, d
isso
lved
ino
rgan
ic c
arb
on
(D
IC),
an
d d
isso
lved
org
anic
car
bo
n (
DO
C)
con
cen
trat
ion
s o
f sa
mp
les
colle
cted
in D
ecem
ber
5-6
, 20
16
. * in
dic
ates
sam
ple
wit
h s
ign
al t
oo
low
fo
r ac
cura
te r
esu
lt.
Par
ame
ter
un
it
Bo
bca
t C
ave
M
atth
ew
s C
ave
In
dia
n
Cre
ek
Rai
nw
ate
r 1
RS
05
9
RS
17
81
R
S 1
78
0
RS
14
14
R
S 2
22
1
RS
12
78
δ1
8O
‰
, VSM
OW
-5
.22
-3
.71
-7
.59
-4
.75
-5
.03
-5
.43
-5
.29
-5
.19
-5
.09
-5
.06
δD
‰
, VSM
OW
-2
8.6
7
-22
.65
-4
9.0
6
-25
.63
-2
8.6
5
-31
.78
-3
0.6
2
-32
.63
-2
9.3
8
-33
.74
δ1
3C
‰
, VP
DB
-1
1.2
4
-10
.16
-1
0.6
8
- -1
2.0
1
-11
.3
-8.9
8
-19
.15
* -2
2.4
4
-6.8
2
DIC
%
C
0.0
03
0
.00
4
0.0
01
<
0.0
00
*
0.0
05
0
.00
3
0.0
03
<
0.0
00
*
< 0
.00
0*
0
.00
3
DO
C
mg/
L 7
.42
4
.8
5.7
1
- 4
.49
1
2.8
3
.94
2
.38
1
0.1
2
7.4
Tab
le 1
5. M
eas
ure
d o
xyge
n, h
ydro
gen
, an
d c
arb
on
iso
top
e va
lues
, d
isso
lved
ino
rgan
ic c
arb
on
(D
IC),
an
d d
isso
lved
org
anic
car
bo
n (
DO
C)
con
cen
trat
ion
s o
f sa
mp
les
colle
cted
in F
ebru
ary
24
, 20
17
.
Par
ame
ter
un
it
Rai
nw
ate
r 2
R
S 1
41
4
Co
re s
amp
le:
RS
22
21
δ1
8O
‰
, VSM
OW
-0
.69
-4
.84
2
4.5
5
δD
‰
, VSM
OW
-5
.71
-2
7.9
5
-
δ1
3C
‰
, VP
DB
-
- 1
.70
DIC
%
C
- -
-
DO
C
mg/
L -
- -

53
Dissolved Inorganic Carbon (DIC):
Dissolved inorganic carbon concentrations (Tables 11-15) were expressed as percent carbon of
each water sample. The DIC-C (mg) was estimated using the CO2 peak intensity and only for reference
and therefore is not discussed in further detail (Dr. Yang Wang, Florida State University, personal
communication 2017). This value was calculated by the following equation:
𝐸𝑠𝑡𝑖𝑚𝑎𝑡𝑒𝑑 %𝐶 = (𝑒𝑠𝑡𝑖𝑚𝑎𝑡𝑒𝑑 𝐷𝐼𝐶−𝐶 (𝑚𝑔)
𝑠𝑎𝑚𝑝𝑙𝑒 𝑣𝑜𝑙𝑢𝑚𝑒 (𝑚𝑙)) ∗ 100 (2)
Estimated dissolved inorganic carbon values ranged from 0.00065% (RS 2221 dry) to 0.0051%
(RS 059 dry and wet). Indian Creek samples had the greatest fluctuation between dry and wet samples
(Indian Creek dry 0.0038%, Indian Creek wet 0.0011%).
Nondispersive infrared analyzer results: Dissolved organic carbon (DOC):
Dissolved organic carbon concentrations (Tables 11-15) are expressed in mg/L. DOC values
ranged from 1.58 mg/L (RS P24 dry) to 27.4 mg/L (RS 1278 wet). DOC content of the Bobcat Cave
significantly increased from 3.26 mg/L in its dry weather sample, to 7.42 mg/L in the wet weather
sample. A similar trend occurred in RS 1781: DOC content increased from 3.43 mg/L in the dry sample,
to 12.8 mg/L in the wet sample. Deep wells RS 2221 and RS 1278 to the east of Indian Creek had
significantly higher DOC concentrations compared to the Bobcat Cave and wells to the west of Indian
Creek.
Volatile Organic Compounds (VOCs):
GC-MS results for VOC concentrations are shown in μg/L (Table 16). Wells RS 1780, RS 2221, and
RS 1278 were the only sampling locations for this analysis. Benzene, toluene, tetrachloroethylene (PCE),
54
and trichloroethylene (TCE) concentrations were below the method detection limit (MDL) for all three
samples. Ethylbenzene and xylenes total were below MDL in RS 1278.
Table 16. Summary of GC/MS results including method detection limits (MDL). Units are in μg/L.
Analyte RS 1780 RS 2221 RS 1278 MDL (RS 1780, RS
2221) MDL (RS 1278)
Benzene <0.38 <0.38 <0.76 0.38 0.76
Ethylbenzene 2.4 2.8 <1.0 0.5 1
Toluene <0.70 <0.70 <1.4 0.7 1.4
Xylenes, total 11 13 <3.2 1.6 3.2
Tetrachloroethylene <0.58 <0.58 <1.2 0.58 1.2
Trichloroethylene <0.50 <0.50 <1.0 0.5 1

55
Discussion
New and existing hydrologic and geochemical data collected from wells, caves, and Indian Creek
were used to assess the hydrochemical facies, fluid (and contaminants) source, fluid mixing, and flow
pathways in the study watersheds. This study and previous ones provide evidence that water quality and
water chemistry in a watershed is controlled by one or a combination of three conditions:
1) The type, chemical quality, and composition of the regolith and rock with which the water
comes in contact with over time;
2) The amount of time the water remains in contact with the regolith and the rocks (Richter, 1984;
Rheams et al., 1994). and
3) Anthropogenic inputs to the watershed.
Water Levels and Groundwater Flow Directions: Figure 13 shows results from two complete
water level data sets collected on February 24 and March 23, 2017. These results suggest that during
this time period, localized groundwater flow direction in the vicinity of the Bobcat Cave was to the
north, consistent with previous dye tracer studies.

56
Figure 13. Water level map from February and March 2017 sampling measurements with digital elevation model (DEM) overlay. Ground elevation is generally higher to the north and low near the Indian Creek.

57
Through geochemical, hydrological, and geological studies, previous work has determined that
the Tuscumbia and Fort Payne aquifers crop out near surface, and are primarily unconfined or
semiconfined, only locally covered by residuum (McGregor et al., 1997). In unconfined systems, shallow
groundwater levels are typically gravity or topographically controlled. Therefore we expect groundwater
with higher hydraulic potential to be near topographic highs such as the area around Bobcat Cave and
groundwater level lows located in stream channels such as Indian Creek (Table 6, Fig. 13). Table 6 and
Figure 13 show the ground elevation, in meters above mean sea level (m amsl) of our monitoring wells
and corresponding water level measurements. RS 1414 (196.08 m amsl) is almost 20 meters higher in
ground elevation than RS 059 (177.91 m amsl). Water level in RS 1414 is slightly higher (177.89 m in
February and 178.66 m in March, 2017) than those in RS 1781 (175.90 m and 176.30 m) or RS 1780
(176.46 m and 177.11 m), suggesting a southward hydraulic gradient between RSA’s northern boundary
(near RS 1414) and the area just north of Bobcat Cave (near RS 1781). The southward hydraulic gradient
is consistent with local topography, indicating local groundwater flow is topographically driven. Overall,
the minor fluctuation in groundwater levels in the deep wells suggest that precipitation and drought
have minimal effect on water level in deep aquifers. Clogged deep well (RS 1278) and shallow well RS
059 had stronger responses to the variation in precipitation throughout the time period of the study.
Data from our water level data (Table 6, Fig. 13) also depict a hydraulic gradient toward the
north near the Bobcat Cave, with groundwater flowing from RS 059 and RS 1780 towards RS 1781 during
February and March of 2017 (Fig. 13). This interpretation of a locally north flow is consistent with
previous dye tracer tests which suggest that groundwater flow direction in the vicinity of Bobcat Cave is
towards the north (Fig. 4). This same northerly gradient can be inferred from data collected on March of
2016 between RS 059 and RS 1781 (Table 6). Groundwater levels only differed by a maximum of

58
approximately 2.5 meters in February and March of 2017. This suggests generally gentle hydraulic
gradient towards any one specific well in the study area.
We attempted to measure how groundwater level and quality fluctuated in a groundwater
monitoring well during storm events. Figures 9-11 depict an attempt to track changes in monitoring well
RS 1781 in July 2016 using TROLL 9000. However insignificant rainfall occurred during the selected time
period. Nevertheless we were able to record the daily temperature and pressure fluctuation and gradual
decline of pressure (decrease in water level) during this dry period of the year (Figs. 9, 10).
Our attempt to monitor water level and water quality fluctuations in the Bobcat Cave during
storm events in December 2016 show almost immediate hydrologic response (Figs. 6-8). Sharp, step-
wise decreases in temperature and electrical conductivity (Figs. 6, 8) and a concurrent increase in
pressure (increase in water depth) (Fig. 7) were observed during this same time period of heavy rainfall.
These data suggest that Bobcat Cave is highly connected to surface runoff. Rapid response to storm
events also indicates the presence of conduits or fracture networks that hydrologically connect the
surface to the cave and quickly transports surface runoff. Thus potential contaminant inputs to the cave
may come from surface runoff within its watershed. We suspected that Bobcat Cave is well connected
to surface runoff or shallow groundwater, this interpretation is consistent with historical hydrologic data
(see discussion below) collected inside the cave and near-by monitoring well RS 059 (Figs. 14, 15).
Previous water level investigations in Bobcat Cave and monitoring well RS 059 indicate that the
hydrology of Bobcat Cave is controlled by two distinct factors: 1) the shallow groundwater stored in the
soils around the cave, and 2) the degree of connectivity between the cave and the land surface, which
provides direct conduits of surface runoff during precipitation events (McGregor et al., 1997). Figure 14
shows that Bobcat Cave responded rapidly to precipitation events during winter (periods A, C) and
summer (period B) time periods. During the winter months the water level responds quickly to rainfall

59
events when precipitation levels were high and the surrounding soil was well saturated with excellent
hydrologic connections. By contrast, water table in well RS 059 shows slow and much smaller response
to precipitation events in the winter months (time periods A, C, Fig. 14). During those winter months
most of the precipitation became surface runoff above saturated soil and did not enter the deeper
groundwater zone. Due to the rapid rise of water level in the cave during these months, it can be
implied that this surface water enters the cave via a conduit system (McGregor et al., 1997). These
results also suggest that precipitation enters the groundwater system of RS 059 only during dry summer
months (time period B), as shown by the spike in groundwater elevation in RS 059 during the B time
period (Fig. 14).
Figure 14. Water levels in Bobcat Cave and monitoring well RS 059 from November 1992 through March 1994. Figure 12 from (McGregor et al., 1997).

60
Similar results were obtained from a 1995-1996 water level investigation (Fig. 15) (McGregor
and O’Neil, 1996). Rapid response to rainfall events was recorded in winter/spring months that had high
amounts of precipitation leaving the soil saturated around Bobcat, causing much of the precipitation to
become surface water that infiltrated into the cave via a conduit network.
Figure 15. Water level in Bobcat Cave and local precipitation between November 1995 and November 1996. Figure C-2 from McGregor and O’Neil (1996).
Major ions
Two distinct hydrochemical facies were identified in the study area (see Piper diagram, Fig. 16)
based on major ion geochemistry. Groundwater samples from RS 2221 and RS 1278 to the east of the
Indian Creek are dominated by carbonate/bicarbonate, sodium, potassium, and sulfate ions, while
groundwater from sampling locations west of Indian Creek (RS 1781, RS P24, RS 1780, RS 059, RS 1414)
61
and water from Indian Creek, Bobcat Cave, and Matthews Cave is dominated by calcium-bicarbonate
ions. This result suggests poor hydrologic connection of groundwater residing to the east and west of
the Indian Creek.
Stiff diagrams were constructed for each of the ten groundwater sampling locations (Figs. 17-
21). Quick visual comparison between different sources of water can be made by analyzing patterns in
the stiff diagrams (Fetter, 2001). The larger the area of the polygonal shape, the higher the
concentrations of the various ions (Figs. 17-21) (Fetter, 2001). Major ion concentrations in the caves and
groundwater monitoring well samples showed minimal variation from dry to wet weather samples (Figs.
17-21). Major ion concentration in Indian Creek decreased significantly from dry to wet weather
samples due to precipitation dilution (Fig. 18). Sodium, magnesium, potassium, and calcium
concentrations varied significantly between groundwater samples from each side of the creek (Fig. 22).
These results again suggest groundwater from each side of the creek has its own distinct geochemistry
and is poorly connected hydrologically.

62
Figu
re 1
6.
Ion
ch
rom
ato
grap
hy
(IC
) an
d Q
-IC
P-M
S re
sult
s su
gges
t th
at t
her
e ar
e t
wo
dis
tin
ct h
ydro
chem
ical
fac
ies
pre
sen
t in
th
e ca
rbo
nat
e aq
uif
er. R
S 2
22
1 a
nd
RS
12
78
are
do
min
ated
by
carb
on
ate/
bic
arb
on
ate,
so
diu
m, p
ota
ssiu
m, a
nd
su
lfat
e io
ns
wit
h r
esp
ect
to m
on
ito
rin
g sa
mp
ling
loca
tio
ns
wes
t o
f In
dia
n C
reek
. RS
17
81
, RS
P2
4, R
S 1
78
0, R
S 0
59
, RS
14
14
, In
dia
n C
reek
, Bo
bca
t C
ave,
an
d M
atth
ews
Cav
e ar
e d
om
inat
ed
by
calc
ium
-bic
arb
on
ate
gro
un
dw
ater
. Op
en s
ymb
ols
rep
rese
nt
dry
wea
ther
sam
ple
s, f
illed
sym
bo
ls f
or
we
t w
eath
er s
amp
les.
Tr
ian
gles
re
pre
sen
t d
eep
wel
ls, d
iam
on
ds
shal
low
wel
ls, a
nd
sta
rs u
nd
ete
rmin
ed t
ypes
of
wel
ls (
RS
P-2
4),
sq
uar
e fo
r cr
eeks
, an
d c
ircl
es f
or
cave
s.

63
Major Cations:
Sodium in the most abundant member of the alkali-metal group in natural waters (Barksdale
and Moore, 1976; Hem, 1985). Normal weathering of carbonate bedrock is typically the primary source
of sodium in natural groundwater (Rheams et al., 1994). Groundwater to the east of Indian Creek had
sodium concentrations in excess of 80,000 µg/L, which is significantly higher than what is expected in
carbonate groundwater waters, suggesting an anthropogenic source. Groundwater samples from both
caves, and monitoring wells to the west of Indian Creek have Na concentrations < 5,000 µg/L (Fig. 22).
Results from Rheams et al. (1994) show that sodium concentrations did not exceed 3,000 µg/L in Bobcat
or Matthews Caves from September 1990 through May 1992, consistent with our study.
Calcium is present in many soluble minerals and is a major constituent of earth’s crust. Primary
sources of calcium in natural groundwater include input from the process of solution of calcite, gypsum,
and dolomite in carbonate bedrock (Barksdale and Moore, 1976; Hem, 1985). Calcium concentrations
were consistent throughout the study site in dry to wet weather samples (Fig. 17-22). Calcium
concentrations in the caves ranged from approximately 55,000 – 60,000 µg/L with Matthews Cave
having a slightly lower concentration than in Bobcat Cave (Fig. 22). These results are consistent with the
Rheams et al., 1994 study. Between September 1990 and May 1992, calcium concentrations in Bobcat
Cave ranged from approximately 45,000 – 60,000 µg/L and concentrations in Matthews Cave ranged
from approximately 40,000 – 51,000 µg/L (Rheams et al., 1994). Dissolution rate of the carbonate
bedrock can fluctuate as groundwater flow varies, thus causing a large range in calcium concentrations
in the caves (Rheams et al., 1994).
Magnesium is another major ion commonly found in natural waters. Weathering and dissolution
of carbonate bedrock serves as a primary source of magnesium input into groundwater, similar to that
of calcium. Magnesium is typically found in lower concentration in natural waters compared to calcium

64
even though it is the more soluble ion of the two due to a greater abundance of calcium in earth’s crust
(Barksdale and Moore, 1976; Hem, 1985). Magnesium concentrations were below 6,000 µg/L in all
samples except RS 1780 wet and dry which had concentrations > 120,000 µg/L (Fig. 22). Both Bobcat
Cave samples had concentrations < 3,000 µg/L and the Matthews Cave sample had a concentration of
approximately 3,000 µg/L. Our results were consistent with Rheams et al. (1994). Between September
1990 and May 1992 magnesium concentration in Bobcat Cave ranged from approximately 1,300 µg/L to
4,100 µg/L and concentrations in Matthews Cave ranged from approximately 2,700 µg/L to 3,100 µg/L
(Rheams et al., 1994).
Potassium is a major ion in natural groundwater, commonly associated with sedimentary rocks.
Potassium concentration is expected to be low in natural waters though due to its resistance to
weathering (Barksdale and Moore, 1976; Hem, 1985). Potassium concentrations in samples to the west
of Indian Creek followed this trend, with no sample having a concentration > 2,500 µg/L (Fig. 22).
Concentrations were significantly elevated in samples to the east of Indian Creek (> 27,000 µg/L for all
samples), suggesting a potential anthropogenic source. Potassium is a common constituent in fertilizers
and elevated concentrations indicate the potential of runoff from farmland upstream. Rural Madison
County has an abundance of farmland which could potentially explain the elevated potassium
concentrations in the wells to the east of Indian Creek (Rheams et al., 1994). Our results showed slightly
higher potassium concentrations in Bobcat and Matthews Cave compared to the Rheams et al. (1994)
study. Between September 1990 and May 1992 potassium concentration in Bobcat Cave ranged from
approximately 500 – 1,000 µg/L and concentration in Matthews Cave ranged from approximately 600 –
1,100 µg/L.

65
Major anions:
The alkalinity of a solution is defined as its capacity to react with and neutralize acid, or the total
amount bases that are titratable with acids (Stumm and Morgan, 1996; Drever, 1997). In a carbonate
aquifer, the dissolved carbon dioxide species bicarbonate and carbonate, are the primary constituents
controlling alkalinity. Bicarbonate (HCO3-) ions in groundwater are derived from carbon dioxide in the
atmosphere, soil, and the solution of carbonate rocks as precipitation percolates through the regolith
and fractured bedrock to the water table (Barksdale and Moore, 1976). Carbonate (CO32-) concentration
is a result of the normal dissolution of the parent material (regolith, soil, bedrock) that interacts with the
groundwater (Barksdale and Moore, 1976). Carbonic acid (H2CO3) forms through the carbonation
reaction between carbon dioxide and water.
Bicarbonate is the dominant form of dissolved carbon dioxide contributing to alkalinity in
groundwater monitoring wells to the west of Indian Creek as well as the Indian Creek itself (Figs. 16-21).
RS 1414 (51.6 mg/L dry weather, 43.8 mg/L wet weather) was the only well west of Indian Creek with
significant carbonate (CO32-) concentrations of 43.8 mg/L (Tables 7-10). Our field titration results show
that bicarbonate is the dominant dissolved carbon dioxide species in water samples from Bobcat and
Matthews Caves (Tables 7-10). The two monitoring wells east of Indian Creek (RS 2221, RS 1278), and RS
1414 were the only monitoring locations in which carbonate was the dominant contributor to alkalinity.
Contrast in dominate carbonate species in groundwater suggests the presence of different
hydrochemical facies to the east and west of the Indian Creek.
Chloride occurs in virtually all waters in varying concentrations and is the ion state of chlorine
that is of significance in water exposed to the atmosphere (Barksdale and Moore, 1976; Hem, 1985;
Hem, 1989). Small quantities of chloride present in the atmosphere enter the groundwater via
precipitation. Compared to other major constituents of natural fresh carbonate water such as calcium or

66
magnesium, chloride is present in relatively low concentrations (McGregor et al., 2016). Thus the
presence of elevated levels of chloride, a common component of animal waste and fertilizer, may
indicate groundwater contamination from anthropogenic sources (Barksdale and Moore, 1976; Hem,
1985; Rheams et al., 1994).
Chloride concentrations for Bobcat Cave and Matthews Cave are consistent with median 2015-
2016 concentration results from McGregor et al. (2016). Groundwater west of Indian Creek had a similar
median concentration of chloride as Bobcat Cave, suggesting a similar source of chloride for both the
cave and groundwater. The two wells to the east of the Indian Creek (RS 2221 and RS 1278) have
notably higher chloride concentrations (4.75 to 9.52 mg/L) than those to the west (Tables 7-10),
suggesting that watersheds to the east of Indian Creek are exposed to more anthropogenic pollutants.
According to McGregor et al. (2016), the median chloride concentration in Matthews Cave was about
1.5 to 2 mg/L greater than the median concentration in Bobcat Cave over the period 1991 through 2000.
The difference in median chloride concentration between the caves has only increased since then. The
difference in median chloride concentration between the caves on the opposing side of Indian Creek is
on a magnitude of 3.0 to 3.5 mg/L from data collected from 2006 until present. This widening gap
suggests that Matthews Cave has a greater connection to polluted surface runoff and groundwater
compared to Bobcat Cave (McGregor et al., 2016).
Sulfate (SO42-) could be derived naturally from the dissolution of sulfate or sulfide-bearing
minerals in sedimentary rocks, from dust particles containing sulfate minerals, from the oxidation of
sulfide minerals, or from the oxidation of hydrogen sulfide or sulfur dioxide gases (Barksdale and Moore,
1976; Rheams et al., 1994). Elevated concentration of sulfate can be an indicator of groundwater
contamination from anthropogenic sources such as fertilizers or chemicals. Bobcat Cave samples from
our study had sulfate concentrations of 5.74 mg/L (dry weather), and 2.0 mg/L (wet weather) (Tables 9,

67
10). Our Matthews Cave sample had a concentration of 4.97 mg/L (wet weather) (Table 10), consistent
with the McGregor et al. (2016) values.
Median sulfate concentration for groundwater samples collected west of Indian Creek during
our study was 4.79 mg/L. By contrast, samples east of Indian Creek had a median value of 73.83 mg/L,
significantly elevated compared to samples west of Indian Creek, suggesting possible groundwater
contamination from anthropogenic sources. Moreover, median sulfate concentrations have been
greater in Matthews Cave than in Bobcat Cave since 2006 (McGregor et al., 2016), suggesting increased
anthropogenic contamination of sulfate in watersheds to the east of the Indian Creek.
The nitrogen cycle involves complicated aspects of biological and chemical processes (Galloway,
1998). Nitrogen in natural water occurs as the anions nitrite (NO2-) and nitrate (NO3
-), as cations
ammonium (NH4+), and as organic solutes. Nitrate is stable in water over a variety of conditions,
specifically in groundwater, and can be readily transported over long distances (McGregor et al., 2016).
Nitrate is a major constituent of fertilizer and animal waste, thus elevated concentrations in
groundwater can be indicative of contamination.
Nitrate as N concentrations for our Bobcat Cave (0.27 and 0.31 mg/L) and Matthews Cave (1.42
mg/L) samples (Tables 9, 10) are consistent with McGregor et al. (2016). Median Nitrate as N
concentration for groundwater samples collected west of Indian Creek was 0.37 mg/L, median value for
groundwater east of Indian Creek was 0.04 mg/L, and median value for Indian Creek was 0.90 mg/L.
Groundwater samples west of Indian Creek had a similar median value to the Bobcat Cave samples,
suggesting a similar nitrate source of water for the cave and groundwater. Elevated concentration in
Indian Creek and Matthews Cave suggests that nitrate is entering the stream from surface runoff
associated with agriculture upstream from the Redstone Arsenal.

68
Orthophosphate as P was not detected in any sample west of Indian Creek including Bobcat
Cave (Tables 9, 10). The two monitoring wells east of Indian Creek (RS 2221, RS 1278) were the only
samples that had detectable concentrations of orthophosphate as P, suggesting that watersheds to the
east of Indian Creek are exposed to more anthropogenic pollutants. According to data collected by
McGregor et al. (2016), the long-term trend in both caves has shown a decrease in nitrate. From 1991 –
2016, the median nitrate concentrations in Bobcat Cave have ranged from near 0.17 to just over 1.22
mg/L, whereas the median concentrations in Matthews Cave are higher and have ranged from 2.00 to
near 3.45 mg/L. Median yearly nitrate concentration has dropped nearly 0.11 mg/L in Matthews Cave
and 0.50 mg/L in Bobcat Cave since 1996 (McGregor et al., 2016).

69
Figu
re 1
7. I
C a
nd
Q-I
CP
-MS
resu
lts
for
Bo
bca
t an
d M
atth
ews
Cav
es
in d
ry a
nd
wet
sea
son
s. S
tiff
dia
gram
s sh
ow
litt
le v
aria
tio
n in
maj
or
ion
co
nce
ntr
atio
ns
of
the
cav
es b
etw
een
wet
an
d d
ry s
easo
ns.
Dry
wea
ther
Mat
thew
s C
ave
sam
ple
was
no
t co
llect
ed
.

70
Figu
re 1
8. I
C a
nd
Q-I
CP
-MS
resu
lts
for
Ind
ian
Cre
ek
and
RS
17
80
in d
ry a
nd
we
t se
aso
ns.
Sti
ff d
iagr
ams
sho
w v
aria
tio
n in
maj
or
ion
co
nce
ntr
atio
ns
of
Ind
ian
Cre
ek b
etw
een
wet
an
d d
ry s
easo
ns
(hig
her
maj
or
ion
co
nce
ntr
atio
ns
du
rin
g d
ry c
on
dit
ion
s). I
n c
on
tras
t, d
eep
wel
ls
RS
17
80
sh
ow
s lit
tle
vari
atio
n in
maj
or
ion
co
nce
ntr
atio
ns.
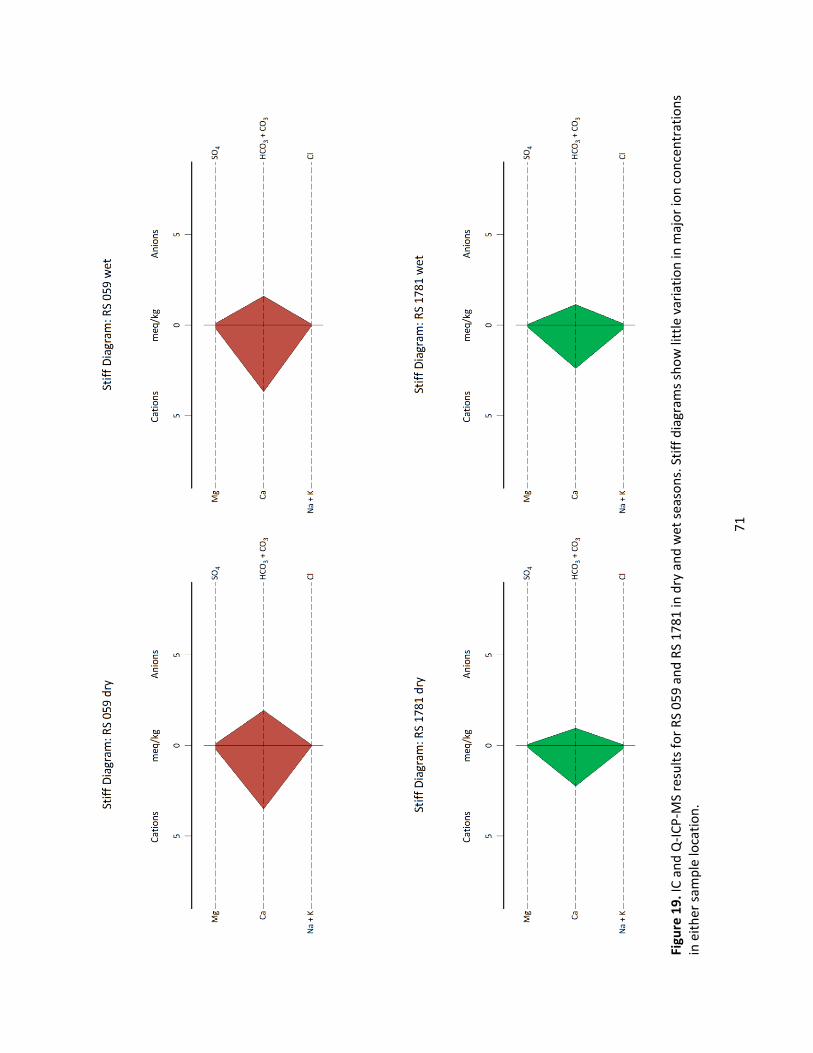
71
Figu
re 1
9. I
C a
nd
Q-I
CP
-MS
resu
lts
for
RS
05
9 a
nd
RS
17
81
in d
ry a
nd
wet
sea
son
s. S
tiff
dia
gram
s sh
ow
litt
le v
aria
tio
n in
maj
or
ion
co
nce
ntr
atio
ns
in e
ith
er s
amp
le lo
cati
on
.

72
Figu
re 2
0. I
C a
nd
Q-I
CP
-MS
resu
lts
for
RS
14
14
an
d R
S P
24
in d
ry a
nd
wet
sea
son
s. S
tiff
dia
gram
s sh
ow
litt
le v
aria
tio
n in
maj
or
ion
co
nce
ntr
atio
ns
of
RS
14
14
. Wet
wea
ther
RS
P2
4 s
amp
le w
as n
ot
colle
cte
d.

73
Figu
re 2
1. I
C a
nd
Q-I
CP
-MS
resu
lts
for
RS
22
21
an
d R
S 1
27
8 (
east
of
Ind
ian
Cre
ek)
in d
ry a
nd
wet
sea
son
s. S
tiff
dia
gram
s sh
ow
litt
le v
aria
tio
n in
m
ajo
r io
n c
on
cen
trat
ion
s o
f ei
ther
wel
l. G
rou
nd
wat
er c
on
cen
trat
ion
s o
f m
ajo
r io
ns
wer
e h
igh
er o
n t
he
east
sid
e o
f In
dia
n C
reek
wit
h
dis
tin
ctiv
ely
hig
her
Na
and
su
lfat
e c
on
cen
trat
ion
s co
mp
ared
to
th
e w
est.

74
Fi
gure
22
. Q-I
CP
-MS
resu
lts
of
maj
or
cati
on
s co
mp
osi
tio
ns
sho
w e
leva
ted
leve
ls o
f so
diu
m a
nd
po
tass
ium
in g
rou
nd
wat
er
to t
he
east
of
Ind
ian
C
reek
co
mp
ared
to
gro
un
dw
ater
to
th
e w
est
of
the
cree
k. M
agn
esiu
m a
nd
cal
ciu
m c
on
cen
trat
ion
s ar
e h
igh
er in
co
nce
ntr
atio
n t
o t
he
wes
t o
f In
dia
n C
reek
co
mp
ared
to
gro
un
dw
ater
to
th
e ea
st o
f th
e c
reek
.
0
20
00
0
40
00
0
60
00
0
80
00
0
10
00
00
12
00
00
Sodium conc. (µg/L)
Sam
plin
g Lo
cati
on
s
dry
wea
the
r
wet
wea
ther
0
30
00
60
00
90
00
12
00
0
15
00
0
Magnesium conc. (µg/L)
Sam
plin
g Lo
cati
on
s
dry
wea
the
r
wet
wea
ther
0
40
00
0
80
00
0
12
00
00
16
00
00
20
00
00
Potassium conc. (µg/L)
Sam
plin
g Lo
cati
on
s
dry
wea
the
r
wet
wea
ther
0
15
00
0
30
00
0
45
00
0
60
00
0
75
00
0
Calcium conc. (µg/L)
Sam
plin
g Lo
cati
on
s
dry
wea
the
r
wet
wea
ther

75
Dissolved organic carbon (DOC): DOC measurements were fairly consistent except for spikes
seen in RS 1781 wet, and both wet and dry samples for the groundwater monitoring wells east of Indian
Creek (RS 2221, RS 1278) (Tables 11-15). We suspected that wells to the east of Indian Creek are
contaminated with hydrocarbons and perhaps other organic contaminants due to their proximity to the
air field. However, our GC-MS analysis (Table 16) suggest that these contaminants exclude benzene,
ethylbenzene, toluene, xylenes, tetrachloroethylene, or trichloroethylene (TCE), which are primary
contaminants of concern previously reported in the study area. Higher DOC contents and distinct
chemical odors only appear in wells located to the east of the Indian Creek, suggesting that the organic
contaminants have not migrated westward across the Indian Creek.
Trace Elements: The trace metal lead is typically found in low concentrations naturally. Lead
concentrations were below detection limits for all three samples collected from Bobcat and Matthews
Caves (Table 9, 10. Fig. 23). Lead was detected in 7 of the 9 groundwater samples collected west of
Indian Creek (Tables 7-10). Median lead concentration was 0.28 µg/L. Lead was detected in 3 of 4
groundwater samples collected east of Indian Creek with higher median lead concentration of 0.87 µg/L.
Lead was detected in one of two samples collected in Indian Creek (0.03 µg/L). Lead was detected in 7 of
12 samples from Bobcat Cave in 2015-2016, ranging from <0.9 to 44.0 µg/L (median 3.9 µg/L). Lead was
detected in 7 of 12 samples from Matthews Cave, ranging from <0.9 to 36.1 µg/L (median 6.0 µg/L)
(McGregor et al., 2016). These results suggest that lead exists in the watersheds and may occasionally
enter in the caves’ water through karst conduits.
Chromium is another trace metal found in low concentration naturally. It is often associated
with vanadium and occurs naturally as the result of bedrock weathering (Hem, 1985). Our Bobcat Cave
samples had concentrations of 1.19 (dry weather), and 1.43 µg/L (wet weather), consistent with
McGregor et al. (2016) values. Our Matthews Cave sample (0.61 µg/L) was also consistent with previous

76
results. The median chromium value for groundwater samples west of Indian Creek was 0.73 µg/L and
Indian Creek median value was 0.67 µg/L. Groundwater samples east of Indian Creek has a higher
median value of 1.51 µg/L, suggesting slightly higher Cr inputs from anthropogenic sources.
The trace metal cadmium occurs in concentrations typically < 1.0 µg/L in natural waters that
have not been impacted by contamination. Cadmium may be naturally derived from metal sulfide such
as sphalerite (ZnS) and pyrite (FeS), which is not known to occur in the carbonate units in Madison
County (Rheams et al., 1994). Therefore, high concentrations in our study area can be indicative of
groundwater pollution. Cadmium concentrations for our Bobcat Cave samples were 0.02 µg/L (dry
weather) and below the detection limit (wet weather) (Tables 9, 10. Fig. 25), consistent with McGregor
et al. (2016). Our Matthews Cave sample data (0.02 µg/L) was also consistent with the previous data.
Cadmium concentrations for groundwater samples are in a similar range throughout the study area
(Tables 7-10). Cadmium concentrations in 2015-2016 from Bobcat Cave ranged from < 0.09 to 3.83 µg/L
(median, 0.26 µg/L). Concentrations from Matthews Cave ranged from < 0.09 to 0.61 µg/L (median, 0.20
µg/L) (McGregor et al., 2016). Bobcat Cave has had a consistent level of cadmium for the last 15 years,
with a notable increase in 2016, and Matthews Cave concentrations have occasionally spiked during the
same time period (McGregor et al., 2016). The sources of these occasional increases are not known.
Trace elements including nickel, selenium, arsenic, strontium, rubidium, vanadium, and boron
were found in significantly greater concentrations in samples east of Indian Creek compared to samples
west of Indian Creek (Figs. 23, 24, 26, 27). Nickel concentrations were nearly 10-20 times higher in
groundwater samples to the east of Indian Creek (Fig. 23). Selenium was only detected at concentrations
> 1 µg/L in groundwater to the east of the creek (Fig. 23). Arsenic concentrations ranged from 5-10
times higher in groundwater samples east of Indian Creek (Fig. 24). Arsenic concentration in RS 1278
were above the 10 µg/L maximum contaminant level (MCL) for drinking water (National Primary

77
Drinking Water Regulations, EPA, 2017). Strontium concentrations east of the creek were nearly twice as
high as samples to the west (Fig. 26). Rubidium concentrations were 100-500 times higher east of the
creek (Fig. 26). Vanadium and boron concentrations were nearly 75-90 times greater in RS 1278
compared to samples west of the creek (Fig. 27). These elevated trace element concentrations indicate
that watersheds to the east of Indian Creek receive greater anthropogenic inputs. Much lower
concentrations of these trace elements in groundwater to the west the Indian Creek imply that these
heavy metal plumes have not migrated westward across the Indian Creek.

78
Figu
re 2
3. Q
-IC
P-M
S an
alys
is s
ho
ws
elev
ated
co
nce
ntr
atio
ns
of
trac
e m
etal
s n
icke
l, an
d s
elen
ium
in g
rou
nd
wat
er o
n t
he
east
sid
e o
f In
dia
n C
reek
co
mp
ared
to
gro
un
dw
ater
to
th
e w
est
of
the
cre
ek, a
nd
hig
her
co
nce
ntr
atio
ns
of
lead
in g
rou
nd
wat
er t
o t
he
east
of
the
cre
ek a
nd
ove
rall
hig
her
co
nce
ntr
atio
n o
f le
ad in
gro
un
dw
ater
sam
ple
s ex
clu
din
g th
e ca
ves.
* r
epre
sen
ts s
amp
les
that
wer
e o
nly
co
llect
ed in
eit
her
wet
or
dry
wea
ther
.

79
Figu
re 2
4. Q
-IC
P-M
S an
alys
is s
ho
ws
elev
ated
co
nce
ntr
atio
ns
of
trac
e m
etal
s ar
sen
ic, a
nd
co
pp
er in
gro
un
dw
ater
on
th
e ea
st s
ide
of
Ind
ian
Cre
ek
com
par
ed t
o g
rou
nd
wat
er t
o t
he
wes
t o
f th
e cr
eek
, an
d e
leva
ted
co
nce
ntr
atio
ns
of
chro
miu
m in
RS
14
14
wit
h r
esp
ect
to a
ll o
ther
sam
plin
g lo
cati
on
s. *
rep
rese
nts
sam
ple
s th
at w
ere
on
ly c
olle
cted
in e
ith
er w
et o
r d
ry w
eath
er.

80
Figu
re 2
5. Q
-IC
P-M
S an
alys
is s
ho
ws
slig
htl
y el
evat
ed c
on
cen
trat
ion
s o
f n
eod
ymiu
m a
nd
th
ori
um
in g
rou
nd
wat
er o
n t
he
east
sid
e o
f In
dia
n C
ree
k co
mp
ared
to
gro
un
dw
ater
to
th
e w
est
of
the
cre
ek, s
ligh
tly
elev
ate
d c
on
cen
trat
ion
s o
f ca
dm
ium
in R
S 1
78
1, a
nd
slig
htl
y el
evat
ed c
on
cen
trat
ion
s o
f u
ran
ium
in R
S 0
59
wit
h r
esp
ect
to a
ll o
ther
sam
plin
g lo
cati
on
s. T
ho
se c
on
cen
trat
ion
s ar
e al
l lo
wer
th
an 1
pp
b, n
ear
the
det
ecti
on
lim
it o
f IC
P-
MS
and
no
t co
nsi
der
ed s
ign
ific
ant.
* r
ep
rese
nts
sam
ple
s th
at w
ere
on
ly c
olle
cted
in e
ith
er w
et o
r d
ry w
eath
er.

81
Figu
re 2
6. Q
-IC
P-M
S an
alys
is s
ho
ws
elev
ated
co
nce
ntr
atio
ns
of
trac
e m
etal
s al
um
inu
m, i
ron
, str
on
tiu
m, a
nd
ru
bid
ium
in g
rou
nd
wat
er o
n t
he
east
sid
e o
f In
dia
n C
ree
k co
mp
ared
to
gro
un
dw
ater
to
th
e w
est
of
the
cree
k, a
nd
ele
vate
d c
on
cen
trat
ion
s ir
on
an
d a
lum
inu
m in
In
dia
n C
reek
w
ith
res
pec
t to
sam
plin
g lo
cati
on
s w
est
of
the
cree
k. *
rep
rese
nts
sam
ple
s th
at w
ere
on
ly c
olle
cted
in e
ith
er w
et o
r d
ry w
eath
er.

82
Figu
re 2
7. Q
-IC
P-M
S an
alys
is s
ho
ws
elev
ated
co
nce
ntr
atio
ns
of
van
adiu
m a
nd
bo
ron
in R
S 1
27
8 w
ith
res
pe
ct t
o o
ther
sam
ple
s. B
ariu
m
con
cen
trat
ion
s w
ere
elev
ated
in d
ry w
eat
her
sam
ple
s o
f In
dia
n C
reek
, RS
17
81
, RS
22
21
, an
d R
S 1
27
8. M
anga
nes
e co
nce
ntr
atio
ns
wer
e h
igh
in
Ind
ian
Cre
ek, R
S 1
78
1, a
nd
RS
17
80
sam
ple
s. *
rep
rese
nts
sam
ple
s th
at w
ere
on
ly c
olle
cted
in e
ith
er w
et o
r d
ry w
eath
er.

83
Stable Isotopes: Figure 28 shows the stable oxygen and isotopic compositions of all water
samples. In general most groundwater samples are plotted along or near the local meteoric water line
(Fig. 28), suggesting minimal shifts of isotope signatures of meteoric water (i.e., via water-rock
interaction or mixing) since it entered the aquifer. Our local meteoric water line in Fig. 28 was
constructed using two data points from rainwater collected at a rain gauge at RS 1278 on December 5,
2016 and February 24, 2016. The dry weather samples from the two wells east of Indian Creek (RS 2221,
RS 1278) have depleted δ18O values compared to the other groundwater samples. The Indian Creek wet
sample deviates from the local meteoric water line, a strong indication that this sample received water
inputs beyond local precipitation. This sample is depleted in both 18O and 2H (Fig. 28, 29, 30). Depletion
of δ18O and δD isotope signatures has been linked to latitude, altitude, and distance from coast, and
seasonal changes in temperature and humidity (Dansgaard, 1964; Cook and Murgulet, 2012). Due to
preferred lifting of lighter 16O during evaporation, the amount of 18O in an air mass decreases with
increasing distance from its source, such as the ocean (Rollinson, 1993). The Indian Creek wet sample
reflects input from precipitation that travelled farther from its source and at a higher elevation or
latitude than the study area. Since the deeper groundwater represents a mixture of all entering
precipitation from different sources or seasons, thus the groundwater isotopic signature likely reflects
an average composition of meteoric water.
Rainwater sample 2, collected in February 2017, shows the effects of evaporation on δ18O and
δD values (Fig. 28, 31, 34). Rainwater 2 is enriched in 18O and 2H with respect to our other samples. Field
notes and rain fall data indicate that evaporation had occurred prior to collection of the water sample.
Approximately 35 cm of rainfall occurred between two precipitation collection dates and our rain gauge
showed only 15 cm of total water height, much less than of total precipitation. Theoretically the 35 cm
of rainfall should have been more than enough to fill the rain gauge if no evaporation had occurred.

84
All but two samples had δ13C signatures similar to each other (Fig. 29, 30). Monitoring well RS
2221 showed extremely depleted δ13C values with respect to all other samples (Fig. 29, 30). This well is
located west-southwest down gradient from the airfield (Fig. 15). Hydrocarbons in jet fuel or other
organic solvents used at the airfield could potentially be the source of such depleted δ13C values.
Organic carbons associated with hydrocarbons are typically depleted in 13C since lighter 12C are
preferred used in photosynthesis processes of plants and microbes. Very depleted δ13C values (-22 ‰)
from RS 2221 suggest that this well is likely contaminated by hydrocarbon-based organic carbon. Based
on our GC-MS analysis (Table 16), the type of organic solvent in RS 2221 is still unknown and requires
further investigation. Bobcat and Matthews Caves and shallow well RS 059 had notably depleted δ13C
values compared to deeper groundwater monitoring wells, suggesting that the shallow wells and caves
are influenced more by biogenic organic carbon produced in shallow soil. The lighter carbon isotope
signatures, along with quick hydrologic response to rainfall events (Figure 14), suggest that caves are
well connected to surface water or shallow groundwater in soil.

85
Figu
re 2
8. T
he
δD
an
d δ
18O
rat
ios
of
wat
er s
amp
les
and
th
e lo
cal m
eteo
ric
wat
er li
ne
der
ive
d f
rom
tw
o r
ain
wat
er s
amp
les
colle
cte
d in
De
cem
ber
2
01
6, a
nd
Fe
bru
ary
20
17
. Maj
ori
ty o
f sa
mp
les
hav
e is
oto
pic
co
mp
osi
tio
ns
rese
mb
ling
that
of
loca
l met
eori
c w
ater
. In
dia
n C
reek
wet
, an
d R
S 1
27
8 a
nd
RS
22
21
dry
sam
ple
s d
evia
te t
he
mo
st f
rom
th
e lo
cal m
eteo
ric
wat
er li
ne.
Op
en s
ymb
ols
rep
rese
nt
dry
wea
ther
sam
ple
s, f
ille
d s
ymb
ols
re
pre
sen
t w
et
wea
ther
sam
ple
s. C
ircl
es r
epre
sen
t ca
ves,
sq
uar
es f
or
cree
ks, d
iam
on
ds
for
shal
low
wel
ls, t
rian
gles
fo
r d
eep
we
lls, s
tars
fo
r u
nkn
ow
n w
ells
, an
d X
’s f
or
rain
wat
er s
amp
les.
Rai
nw
ater
2 w
as a
nal
yzed
at
the
Au
bu
rn U
niv
ersi
ty D
epar
tmen
t o
f G
eosc
ien
ce’s
Pre
cisi
on
Sta
ble
Is
oto
pe
(PSI
) la
b u
sin
g a
PIC
AR
RO
L2
13
-I h
igh
pre
cisi
on
iso
top
e w
ater
an
alyz
er. S
amp
le r
epro
du
cib
ility
bas
ed o
n in
tern
al s
tan
dar
d P
ICA
RR
O Z
ero
(p
oo
l sta
nd
ard
dev
iati
on
sam
ple
s an
d s
tan
dar
ds,
n=
11
1)
is ±
0.0
2 p
er m
il.

86
Figu
re 2
9. T
he δ
18O
an
d δ
13C
rat
ios
of
wat
er s
amp
les.
Maj
ori
ty o
f sa
mp
les
hav
e s
imila
r is
oto
pic
co
mp
osi
tio
ns
to o
ne
an
oth
er. R
S 2
22
1 w
et a
nd
d
ry s
amp
les
are
dep
lete
d in
δ1
3C
co
mp
ared
to
oth
er s
amp
les.
Op
en
sym
bo
ls r
ep
rese
nt
dry
wea
ther
sam
ple
s, f
illed
sym
bo
ls r
epre
sen
t w
et
wea
ther
sam
ple
s. C
ircl
es r
epre
sen
t ca
ves,
sq
uar
es f
or
cree
ks, d
iam
on
ds
for
shal
low
wel
ls, t
rian
gles
fo
r d
eep
we
lls, s
tars
fo
r u
nkn
ow
n w
ells
, an
d
X’s
fo
r ra
inw
ater
sam
ple
s.

87
Figu
re 3
0. T
he δ
D a
nd
δ1
3C
rat
ios
of
wat
er s
amp
les.
Maj
ori
ty o
f sa
mp
les
hav
e s
imila
r is
oto
pic
co
mp
osi
tio
ns
to o
ne
an
oth
er. R
S 2
22
1 w
et a
nd
dry
sa
mp
les
are
dep
lete
d in
δ1
3C
co
mp
are
d t
o o
ther
sam
ple
s. O
pen
sym
bo
ls r
epre
sen
t d
ry w
eath
er s
amp
les,
fill
ed s
ymb
ols
rep
rese
nt
wet
wea
ther
sa
mp
les.
Cir
cles
rep
rese
nt
cave
s, s
qu
are
s fo
r cr
eeks
, dia
mo
nd
s fo
r sh
allo
w w
ells
, tri
angl
es f
or
dee
p w
ells
, sta
rs f
or
un
kno
wn
wel
ls, a
nd
X’s
fo
r ra
inw
ater
sam
ple
s.

88
We compared our stable isotope data to two additional data sets collected in Alabama: (1)
oxygen, hydrogen, and carbon stable isotope data collected from four groundwater wells in a karst
aquifer comprised of undifferentiated Tuscumbia Limestone/Fort Payne Chert (Mftp) and from four
groundwater wells in a Bangor Limestone (Mb) aquifer approximately 110 km south of our study site
near Trussville, AL (Murgulet et al., 2016), and (2) a three-year data set (June 2005 – May 2008) of stable
oxygen and hydrogen isotope analysis of rainwater collected at the University of Alabama OWL Station
located in Tuscaloosa, Alabama. The OWL station is operated and maintained by the International
Atomic Energy Agency (IAEA) Global Network of Isotopes in Precipitation (GNIP) Water Resources
Programme.
Our oxygen and hydrogen stable isotope signatures were similar to the results from the four
Tuscumbia Limestone/Fort Payne Chert (Mftp) wells from Murgulet et al., 2016 (Fig. 31). In that study,
researchers collected two rounds of samples; once in June and once in November 2010 for a total of
eight samples from the four groundwater wells. δ18O values ranged from -5.3 to -4.8 ‰ and δD values
ranged from -27.3 to -25.0 ‰ from the Mftp wells.

89
Figure 31. Plot comparing Bobcat Cave study results to those from the four Tuscumbia Limestone/Fort Payne Chert wells in the Murgulet et al., 2016 Trussville study. Our groundwater samples plot similarly to those from the Trussville study. Indian Creek wet is considered an outlier.
-55
-50
-45
-40
-35
-30
-25
-20
-15
-10
-5
-10 -8 -6 -4 -2 0
δD
(p
er m
il, V
SMO
W)
δ18O (per mil, VSMOW)
Bobcat Cave dry
Bobcat Cave wet
Matthews Cave wet
Indian Creek dry
Indian Creek wet
RS 059 dry
RS 059 wet
RS 1781 dry
RS 1781 wet
RS 1780 dry
RS 1780 wet
RS 1414 dry
RS 1414 wet
RS 2221 dry
RS 2221 wet
RS 1278 dry
RS 1278 wet
RS P24 dry
Rainwater 1
Rainwater 2
Trussville Study

90
Stable carbon isotope data were also collected from four groundwater wells in a Bangor
Limestone (Mb) aquifer in the Trussville, AL, area during the Murgulet et al., 2016 study (Figs. 32, 33).
Carbon isotope data for each aquifer type was only collected during the fall (November 2010) sampling
period. Values for δ13C in the Bangor Limestone groundwater samples ranged from -11.9 to -10.2 ‰ and
from -13.4 to -10.2 ‰ (Murgulet et al., 2016). Our calculated δ13C ratio averages and standard
deviations (Table 17) fall within the expected δ13C values from this study. This study suggests that the
change in hydrostratigraphic unit (Bangor vs. Tuscumbia Fort-Payne) has minimal effect on isotopic
ratios of carbon, hydrogen, and oxygen (Figs. 32, 33). The extremely depleted δ13C values from well RS
2221 (-22 ‰) in our study area show the largest deviation from all natural water samples due to
anthropogenic contamination.

91
Figure 32. November 2010 data from eight groundwater wells in Tuscumbia/Fort Payne (Mtfp) and Bangor Limestone (Mb) aquifers plotted against Bobcat Cave Study data. This plot indicates there is minimal variation of δD and δ13C values between Tuscumbia Limestone/Fort Payne Chert, and Bangor Limestone groundwater samples.
-50
-45
-40
-35
-30
-25
-20
-25 -20 -15 -10 -5
δD
(p
er m
il, V
SMO
W)
δ13C (per mil, VPDB)
Bobcat Cave dry Bobcat Cave wet Matthews Cave wet
Indian Creek dry Indian Creek wet RS 059 dry
RS 059 wet RS 1781 dry RS 1781 wet
RS 1780 dry RS 1780 wet RS 2221 dry
RS 2221 wet RS 1278 dry RS 1278 wet
RS P24 dry Trussville Mftp Nov. 2010 Trussville Mb Nov. 2010

92
Figure 33. November 2010 data from eight groundwater wells in Tuscumbia/Fort Payne (Mtfp) and Bangor Limestone (Mb) aquifers plotted against Bobcat Cave Study data. This plot indicates there is minimal variation of δ18O and δ13C values between Tuscumbia Limestone/Fort Payne Chert, and Bangor Limestone groundwater samples.
In addition, we compared our data to the local Tuscaloosa meteoric water line (TLMWL)
constructed using the 36 data points collected from GNIP Tuscaloosa OWL Station (Lambert and Aharon,
2009). Weighted annual (n = 4 year) mean values for δ18O and δD of OWL data are -4.70 ± 0.85‰ and -
24.58 ± 7.69‰ (IAEA, 2017). Our calculated δ18O and δD isotopic ratio averages and standard deviations
(Table 17) fall within the expected δ18O and δD values of the weighted annual mean values from the
Tuscaloosa OWL GNIP data. This close correlation of these meteoric water lines (Figure 34) confirmed
that precipitation is a major source of recharge to the groundwater in our study area. It should be noted
that the evaporation effects on meteoric water samples may slightly affect the meteoric water line
drawn for our RSA study area. Overall, those data reflects the fluctuating isotopic signature of
-8
-6
-4
-2
-25 -20 -15 -10 -5
δ1
8O
(p
er
mil,
VSM
OW
)
δ13C (per mil, VPDB)
Bobcat Cave dry Bobcat Cave wet Matthews Cave wet
Indian Creek dry Indian Creek wet RS 059 dry
RS 059 wet RS 1781 dry RS 1781 wet
RS 1780 dry RS 1780 wet RS 2221 dry
RS 2221 wet RS 1278 dry RS 1278 wet
RS P24 dry Trussville Mftp Nov. 2010 Trussville Mb Nov. 2010

93
groundwater as the isotopic signature and the amount of precipitation and evaporation fluctuates on a
seasonal and interannual time scale.
Table 17. Average and standard deviation (SD) values of stable isotope ratios calculated from samples to the west (W.) and east (E.) sides of Indian Creek (IC). Values are calculated for all samples on either side (total), only for dry weather samples (Dry), and only for wet weather samples (Wet). One sample was collected at Matthews Cave, therefore average and SD values were not calculated.
Location DIC δ13C (‰ vs. VPDB) δ18O (‰ vs. VSMOW) δD (‰ vs. VSMOW)
W. of IC total ave. -10.21 -5.39 -30.6
E. of IC total ave. -15.06 -5.91 -30.97
Bobcat total ave. -11.18 -5.13 -28.38
Matthews Cave -10.16 -3.71 -22.65
Ind. Crk. Total ave. -10.3 -6.27 -38.5
W. of IC total SD 1.42 0.27 1.92
E. of IC total SD 8.52 0.96 2.72
Bobcat total SD 0.08 0.13 0.41
Matthews total SD NA NA NA
Ind. Crk. Total SD 0.53 1.86 14.94
W. of IC dry ave. -9.79 -5.52 -30.35
E. of IC dry ave. -15.49 -6.74 -30.38
Bobcat Cave dry -11.12 -5.03 -28.1
Matthews Cave dry NA NA NA
Ind. Crk. Dry -9.92 -4.96 -27.93
W. of IC wet ave. -10.76 -5.23 -30.92
E. of IC wet ave. -14.63 -5.07 -31.56
Bobcat Cave wet -11.24 -5.22 -28.67
Matthews Cave -10.16 -3.71 -22.65
Ind. Crk. Wet -10.68 -7.59 -49.06
W. of IC dry SD 1.35 0.28 2.23
E. of IC dry SD 9.76 0.01 3.36
W. of IC wet SD 1.58 0.17 1.72
E. of IC wet SD 11.04 0.02 3.08

94
Figure 34. Monthly precipitation δD and δ18O values from the Tuscaloosa, AL (OWL) Station GNIP data collected between June 2005 and May 2008 (TLMWL) plotted against Bobcat Cave Study and Trussville data.
Previous studies have found that he amount of precipitation that an area receives can be the
primary control on the isotopic signatures of rainwater samples. This “amount effect” occurs in the
tropics while local temperature typically controls isotopic ratios in mid-to-high latitude regions
y = 4.9081x - 2.3079R² = 1
y = 3.4815x - 8.6259R² = 0.2899
y = 7.0156x + 8.9019R² = 0.9098
-60
-50
-40
-30
-20
-10
0
-10 -8 -6 -4 -2 0
δD
(p
er m
il, V
SMO
W)
δ18O (per mil, VSMOW)
Bobcat Cave dry
Bobcat Cave wet
Matthews Cave wet
Indian Creek dry
Indian Creek wet
RS 059 dry
RS 059 wet
RS 1781 dry
RS 1781 wet
RS 1780 dry
RS 1780 wet
RS 1414 dry
RS 1414 wet
RS 2221 dry
RS 2221 wet
RS 1278 dry
RS 1278 wet
RS P24 dry
Rainwater 1
Rainwater 2
Trussville Study
Tuscaloosa

95
(Dansgaard, 1964; Rozanski et al., 1993, Schmidt et al., 2007). δ18O values are typically depleted in fresh
precipitation samples collected during periods of high rainfall. If a data set expresses this trend, it is a
good indication that the amount effect controls isotopic ratios for that region. Medina-Elizalde et al.
(2016) characterized the amount effect between precipitation amount (P) and precipitation δ18O in the
Yucatan Peninsula and determined that precipitation δ18O in the Yucatan Peninsula is controlled by the
amount effect on seasonal scales (δP/ΔP = -0.0137 ± 0.0031‰ per mm, r = 0.9) (Fig 35).
Figure 35. Monthly precipitation amount and precipitation δ18O determined in Cancún and Playa del Carmen, México, between June 2012 and October 2014. Precipitation δ18O was determined from samples of each precipitation even during a month, combined. The slope of the relationship between precipitation amount and precipitation δ18O representing the amount effect is shown (δP/ΔP = -0.0137 ± 0.0031‰ per mm). Fig. 2 from Medina-Elizalde et al., 2016.
The GNIP data collected from the Tuscaloosa OWL station consists of 36 precipitation samples
collected on a monthly basis between June 2005 and May 2008. By removing 3 atypical data points, this
dataset suggests that precipitation δ18O in Tuscaloosa, AL, is controlled by the amount effect on seasonal
scales (δP/ΔP = -0.0132‰ per mm) (Fig 36), similar to the slope value from Medina-Elizalde et al. (2016)

96
(δP/ΔP = -0.0137 ± 0.0031‰ per mm). Two of the removed data points were from November and
December 2005 when δ18O values were depleted (-8.3 and -7.8 ‰) during months with little rainfall
(55.1 and 99.7 mm). The other data point that was removed occurred in August 2007 when rainfall was
high for the month (204.4 mm) but the δ18O value (-2.9 ‰) did not reflect the spike in precipitation. This
spike in precipitation without a drop in δ18O value is typically associated with tropical storms (Martin
Medina-Elizalda, personal communication, 2017). Remnants of Hurricane Humberto swept through
central Alabama during this time and we suspect that the spike in precipitation is associated with this
storm (NOAA, 2017).
Groundwater, especially at depth, represents mixing of recharge from different precipitation
which affects groundwater isotope signature. Based on the GNIP data, we determined that the
groundwater at our study site had similar isotopic signature to that of the rainwater from the Tuscaloosa
OWL station. Therefore, groundwater isotope signature, in particular δ18O values, should reflect the
seasonal variation of precipitation amount.

97
Monthly Precipitation (mm)
Figure 36. Monthly precipitation amount and precipitation δ18O from the Tuscaloosa, AL (OWL) Station GNIP data between June 2005 and May 2008. The slope of the relationship between precipitation amount and precipitation δ18O representing the amount effect is shown (δP/ΔP = -0.0132‰ per mm).
Effects of Droughts on Water Level: The RSA study site experienced fluctuating levels of drought
severity during the course of this study (Figs. 37-39). Drought conditions are tracked and mapped on a
weekly basis by the U.S. Drought Monitor, established in part by the National Oceanic and Atmospheric
Administration, the U.S. Department of Agriculture, and the National Drought Mitigation Center (NDMC)
at the University of Nebraska-Lincoln (UNL) (NDMC-UNL, 2017). The U.S. Drought Monitor Classification
Scheme has five categories (abnormally dry, moderate, severe, extreme, and exceptional drought)
ranging from D0-D4. At the beginning of 2016, 100 percent of Alabama was under “none” for drought
conditions (NDMC-UNCL, 2017). Abnormally dry conditions (D0) began in north-central Alabama
beginning the week of April 26, 2016 and by the week of May 17, our study area was under moderate
drought (D1) conditions. Moderate drought conditions continued until the week of May 31 when our
study area entered the severe drought (D2) category and conditions remained the same until the week
y = -0.0132x - 2.9095R² = 0.3206
-10
-9
-8
-7
-6
-5
-4
-3
-2
-1
0
0 50 100 150 200 250
Pre
cip
itat
ion
δ1
8O
(p
er m
il, V
SMO
W)

98
of August 30 when drought severity decreased to D1 conditions. By the week of October 4, drought
severity had increased again to the D2 category and by the following week (October 11), our study site
was under extreme drought (D3) conditions. The site remained under D3 conditions until the week of
December 6, 2016, when severity decreased to D2 (severe) conditions. Severe drought conditions
persisted until the week of January 24, 2017, when severity decreased again to D1 (moderate).
Moderate drought conditions persisted until the week of April 25, 2017, when for the first time in about
one year, our study site was no longer in drought conditions, but in abnormally dry (D0) conditions. All
sampling efforts in 2016 occurred during times of either severe or extreme drought conditions. In the
week of November 22, 2016, 82 percent of Alabama was experiencing extreme drought conditions (D3)
in comparison to the week of November 24, 2015, when no area in Alabama was experiencing drought
conditions and only 6 percent of the state was experiencing abnormally dry (D0) conditions (Figs. 38,
39). Most groundwater wells show various amounts of water level declines during severe, extreme, and
exceptional drought conditions. Shallow wells (e.g., RS 059) with better connection to surface water
show the greatest water level drops (greater than 10 m). Future sampling efforts should be attempted
during periods of time when the study area receives normal or above-normal amounts of precipitation
and under which some shallow karst conduits may be better connected by rising water table surface.

99
Figu
re 3
7. D
rou
ght
seve
rity
incr
ease
d f
rom
th
e b
egi
nn
ing
to e
nd
of
20
16
. A d
ecre
ase
in p
reci
pit
atio
n c
orr
ela
ted
wit
h lo
wer
gro
un
dw
ater
el
evat
ion
s (e
xcep
t in
RS
12
78
wh
ich
has
a c
logg
ed
wel
l scr
een
). O
bta
ined
via
per
son
al c
om
mu
nic
atio
n w
ith
Am
and
a Le
mle
r, P
ELA
G
eoEn
viro
nm
enta
l, 2
01
7.

100
Figure 38. Drought conditions for Alabama from the week of November 24, 2015. Study area highlighted by gray box. The U.S. Drought Monitor is jointly produced by the National Drought Mitigation Center at the University of Nebraska-Lincoln, the United States Department of Agriculture, and the National Oceanic and Atmospheric Administration. Map courtesy of NDMC-UNL, 2017.
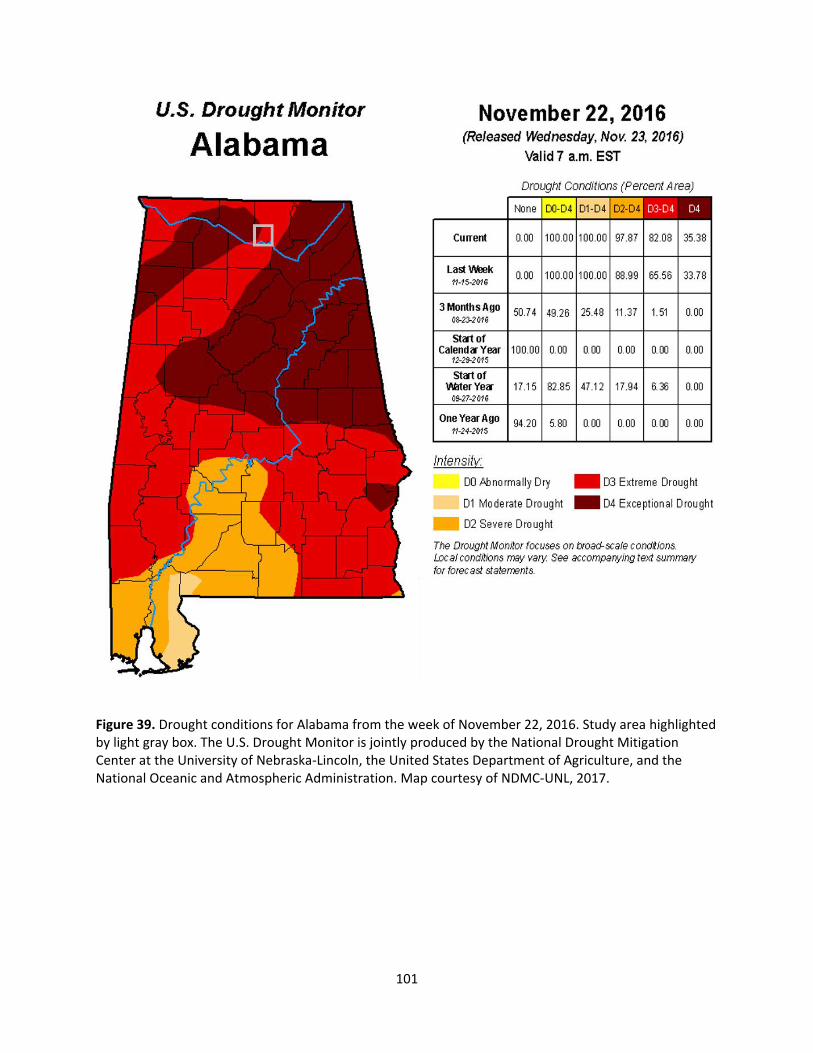
101
Figure 39. Drought conditions for Alabama from the week of November 22, 2016. Study area highlighted by light gray box. The U.S. Drought Monitor is jointly produced by the National Drought Mitigation Center at the University of Nebraska-Lincoln, the United States Department of Agriculture, and the National Oceanic and Atmospheric Administration. Map courtesy of NDMC-UNL, 2017.

102
Conclusions
This study investigated groundwater flow paths and geochemistry of a karst carbonate aquifer
system near the Bobcat Cave watershed at Redstone Arsenal in northern Alabama. New geochemical
and stable isotope data of groundwater, surface water, and precipitation were collected between July
2016 and February 2017 near the Bobcat Cave. Hydrologic analyses including water-level measurements
in groundwater wells and hydrograph analyses were also conducted and included in the report. New
water-level data and previous dye tracer studies conducted near Bobcat Cave suggest that the localized
groundwater flow direction near the cave is to the north, while the general flow direction in the area
follows the southerly dip of the carbonate bedrock towards the Tennessee River. The southward
hydraulic gradient is consistent with local topography, indicating local groundwater flow is gravity or
topographically driven.
Water levels in most deep monitoring wells fluctuated less than two meters during the course of
this study despite the severe and extreme drought conditions that prevailed during the majority of the
study period (Table 6, Fig. 13). The small fluctuation in groundwater levels suggests that precipitation
and drought have minimal effect on groundwater levels in the deep wells in the study area. More
pronounced water level changes are in shallow wells RS 059 and deep well RS 1278 which have clogged
well screens.
Despite the drought conditions, we were able to successfully demonstrate that Bobcat Cave is
quickly recharged by rainfall events and thus highly connected to surface runoff via conduits or sinkholes
above the cave. Our TROLL 9000 results show that Bobcat Cave reacts rapidly to main rainfall events
(i.e., step-wise drops in water temperature and electrical conductivity, and rises in pressure or water
level) (Figs. 6-8). These results complement previous water level studies that suggest that the main

103
water inputs to the Bobcat Cave is controlled by shallow groundwater stored in soil around the cave,
and direct conduits connecting the cave to surface runoff during storm events (Figs. 14, 15).
Trace element and major ion results indicate a significant difference in concentrations of various
elements and major ions in groundwater to the west and east of Indian Creek (Tables 7-10). Elevated
concentrations of trace elements such as arsenic, strontium, rubidium, nickel, selenium, boron, and
vanadium were measured in groundwater samples to the east of Indian Creek. Major ions including
sodium, potassium, and sulfate concentrations were also elevated in groundwater to the east of the
creek. Major ion results suggest the occurrence of two distinct hydrochemical facies in our study area,
one on either side of Indian Creek (Fig. 16). Groundwater to the east of Indian Creek is dominated by
carbonate/bicarbonate, sodium, potassium, and sulfate ions. Groundwater in both caves and monitoring
wells to the west of Indian Creek is dominated by calcium-bicarbonate ions.
Stable isotope results show less variation in isotopic ratios of δD and δ18O when comparing each
side of the creek with respect to the large variation in trace element and major ion concentrations (Figs.
28-30). Most of the water samples have oxygen and hydrogen isotope signatures resembling those of
meteoric water. During the dry weather sampling, the two wells east of Indian Creek (RS 2221, RS 1278)
had depleted δ18O values compared to the other samples, suggesting these deep wells were less
impacted by evaporation with respect to the other wells. The Indian Creek wet sample also had a
depleted δ18O value (Figs. 28, 29) with large deviation from the meteoric water line, this outlier sample
likely reflect input from precipitation that travelled farther from its source and at a higher elevation or
latitude than the study area.
Our measured δ18O and δD isotopic ratio averages of groundwater from our study fall within the
range of δ18O and δD values of meteoric water collected from the same RSA study area as well as the
Tuscaloosa OWL GNIP station (Table 17). This correlation suggests that precipitation is a major source of

104
recharge to the groundwater in our study area. Therefore, fluctuations of groundwater isotope
signatures, in particular δ18O values, should reflect the seasonal variation of precipitation amount.
Our δ13C results were similar to the values obtained from previous studies conducted in a similar
Tuscumbia/Fort Payne Chert aquifer in northern Alabama (Figs. 32, 33). Bobcat and Matthews Caves and
shallow well RS 059 had more depleted δ13C values compared to deeper groundwater monitoring wells,
suggesting that the shallow wells and caves are influenced more by biogenic organic carbon produced in
shallow soil and aquifer. This interpretation is consistent with rapid changes of water quality (decreases
in temperature and conductivity and increase in water level) inside the cave in response to major rainfall
events. Very depleted δ13C values (-22 ‰) from RS 2221 suggest that this well is contaminated by
organic carbon/hydrocarbons (Tables 12, 14). Based on results of our GC-MS analysis of volatile organic
compounds, the type of organic solvent present in RS 2221 is still unknown (Table 16) and requires
further investigation. RS 1278, also to the east of Indian Creek had the most enriched δ13C values.
Trace element, major ions, stable oxygen, hydrogen, and carbon isotopes, and dissolved organic
carbon concentration analysis results provide strong evidence of poor hydrologic connection on either
side of Indian Creek. These results suggest that Indian Creek may serve as a groundwater divide that
blocks westward groundwater migration and contaminant transport from recharge areas east of the
creek during our study conducted in relatively dry conditions. Further hydrologic and geochemical
investigations should be conducted during normal and wet conditions to confirm whether this
hydrologic barrier will protect the Bobcat Cave and the Alabama Cave Shrimp from sources of
contaminants to the east of Indian Creek regardless of the hydrologic conditions. Our data also
confirmed that Bobcat Cave is primarily recharged by water stored in the shallow soils around the cave
and from precipitation quickly entering the cave via a conduit network connected to the surface.

105
References
AGI USA, AGI EarthImager 2-D Inversion Modelling Software: https://www.agiusa.com/agi-earthimager-2d (accessed February 2016).
Andrej, M., and Uros, S., 2012, Electrical resistivity imaging of cave Divas¡ka jama, Slovenia: Journal of
Cave and Karst Studies JCKS, v. 74, p. 235–242, doi: 10.4311/2010es0138r1. Back, William, and Hanshaw, B.B., 1970, Comparison of chemical hydrogeology of the carbonate
peninsulas of Florida and Yucatan: Journal of Hydrology, v. 10, p. 330-368. Barksdale, H.C., and Moore, J.D., 1976, Water content and potential yield of significant aquifers in
Alabama: Alabama Geological Survey open-file report, 449 p. Burger, H.R., Sheehan, A.F., Jones, C.H., 2006, Introduction to applied geophysics: exploring the
shallow subsurface: W.W. Norton & Co., New York. Cook, M.R., and Murgulet, D., 2012, Groundwater hydrogeologic characterization, preservation, and
development in the Trussville area, Jefferson and St. Clair counties, Alabama. Open-File Report 1205. Geological Survey of Alabama.
Cooper, J.E. and M.R. Cooper, 2011. Observations on the biology of the endangered stygobiotic shrimp
Palaemonias alabamae, with note on P. ganteri (Decapoda: Atyidae). Subterranean Biology 8: 9-20.
Coplen, T.B., Kendall, C., and Hopple, J., 1983, Comparison of stable isotope reference standards.
Nature, v. 302, p. 236-238. Dansgaard, W., 1964, Stable isotopes in precipitation: Tellus, v. 16, p. 436-468. Deike H.G., 1989 – Fracture controls on conduit development. In: White W.B. & White E. L. (Eds.),
Karst Hydrology: Concepts from the Mammoth Cave Area. Van Norstrand Reinhold, NY: 259-291.
Drever, J.I., 1997, The Geochemistry of Natural Waters, third ed. Prentice-Hall, Upper Saddle River, NJ. Eaton, Andrew D., Lenore S. Clesceri, Arnold E. Greenberg, and Mary Ann H. Franson. “5301B”.
Standard Methods for the Examination of Water and Wastewater. 20th ed. Washington, DC: Amerian Public Health Association. 1998. N. pag. Print.
Faure, G., 1997, Principles of Isotope Hydrology, John Wiley and Sons, New York. Fenneman, N.M., 1946. Physical Divisions of the United States, United States Geological Survey Map,
Scale 1:7,000,000.

106
Fetter, C.W., 2001, Applied hydrogeology: Prentice Hall, Upper Saddle River, NJ. Galloway, J.N., 1998, The global nitrogen cycle: changes and consequences: Environmental Pollution,
v. 102, p. 15-24. Gunn, J., 1983, Point recharge of limestone aquifers: a model from New Zealand karst. Journal of
Hydrology 61: 19-29. Hem, J.D., 1985, Study and interpretation of the chemical characteristics of natural water, third
edition: U.S. Geological Survey Water-Supply Paper 2254, 263 p. Hem, J.D., 1989 (reprint), Study and interpretation of the chemical characteristics of natural water,
third edition: U.S. Geological Survey Water-Supply Paper 2254, 263 p. Global Network of Isotopes in Precipitation (GNIP), Water Resources Programme, International
Atomic Energy Agency: http://www-naweb.iaea.org/napc/ih/IHS_resources_gnip.html (accessed March, April 2017).
Klimchouk, A.B., Ford, D.C., Palmer, A.N., and Dreybrodt, W., 2000, editors, Speleogenesis: Evolution of
karst aquifers: Hunstville, Alabama, National Speleological Society, 527 p. Lambert, W.J., and Aharon, P., 2009, Radiocarbon deficiencies of US Gulf Coast lakes compromise
paleo-hurricane records: Quaternary Research, v. 71, p. 266-270. McGregor, S.W. and P.E. O’Neil. 1996. Investigations of the source and fate of ground water in the
vicinity of Bobcat Cave, Redstone Arsenal, Alabama, and initiation of a management plan for Bobcat Cave. Geological Survey of Alabama Report.
McGregor, S.W. and P.E. O’Neil. 2000. Investigations of physical and biological conditions in the vicinity
of Bobcat Cave, Redstone Arsenal, Alabama, relative to the Alabama cave shrimp (Atyidae: Palaemonias alabamae): 1999-2000. Geological Survey of Alabama Report.
McGregor, S.W. and O’Neil, P.E., 2001. Water Quality and Biological Monitoring in Bobcat and
Matthews Caves, Redstone Arsenal, Alabama, 1990-2001. Geological Survey of Alabama Report.
McGregor, S.W., O’Neil, P.E., Burnett, K.F., and Blackwood, R., 2002. Water Quality and Biological
Monitoring in Bobcat and Matthews Caves, Redstone Arsenal, Alabama, 1990-2002. Geological Survey of Alabama Report.
McGregor, S.W. and O’Neil, P.E., 2003. Water Quality and Biological Monitoring in Bobcat and
Matthews Caves, Redstone Arsenal, Alabama, 1990-2003. Geological Survey of Alabama Report.
McGregor, S.W. and O’Neil, P.E., 2004. Water Quality and Biological Monitoring in Bobcat and
Matthews Caves, Redstone Arsenal, Alabama, 1990-2004. Geological Survey of Alabama

107
Report. McGregor, S.W. and O’Neil, P.E., 2006. Water Quality and Biological Monitoring in Bobcat and
Matthews Caves, Redstone Arsenal, Alabama, 1990-2006. Geological Survey of Alabama, Open-File Report 0620.
McGregor, S.W. and O’Neil, P.E., 2008. Water Quality and Biological Monitoring in Bobcat and
Matthews Caves, Redstone Arsenal, Alabama, 1990-2007. Geological Survey of Alabama Open-File Report 0801.
McGregor, S.W. and O’Neil, P.E., 2010. Water Quality and Biological Monitoring in Bobcat and
Matthews Caves, Redstone Arsenal, Alabama, 1990-2010. Geological Survey of Alabama, Open-File Report 1007.
McGregor, S.W. and O’Neil, P.E., 2011. Water Quality and Biological Monitoring in Bobcat and
Matthews Caves, Redstone Arsenal, Alabama, 1990-2011. Geological Survey of Alabama, Open-File Report 1115.
McGregor, S.W. and O’Neil, P.E., 2012. Water Quality and Biological Monitoring in Bobcat and
Matthews Caves, Redstone Arsenal, Alabama, 1990-2012. Geological Survey of Alabama, Open-File Report 1216.
McGregor, S.W. and O’Neil, P.E., 2013. Water Quality and Biological Monitoring in Bobcat and
Matthews Caves, Redstone Arsenal, Alabama, 1990-2013. Geological Survey of Alabama, Open-File Report 1313.
McGregor, S.W. and O’Neil, P.E., 2015. Water Quality and Biological Monitoring in Bobcat and
Matthews Caves, Redstone Arsenal, Alabama, 1990-2015. Geological Survey of Alabama, Open-File Report 1513.
McGregor, S.W., O’Neil, P.E., and Bearden, R.A., 2016. Water Quality and Biological Monitoring in
Bobcat and Matthews Caves, Redstone Arsenal, Alabama, 1990-2015. Geological Survey of Alabama, Open-File Report 1513.
McGregor, S.W., P.E. O’Neil, and C.W. Campbell, 1997. Investigations of factors related to the
occurrence of the Alabama cave shrimp in Bobcat Cave, Redstone Arsenal, Alabama. Geological Survey of Alabama Report.
McGregor, S.W., P.E. O’Neil, and C.W. Campbell, 1999. Ground-water and biological investigations in
the vicinity of Bobcat Cave, Alabama, relative to the Alabama cave shrimp (Atyidae: Palaemonias alabamae): 1998-99. Geological Survey of Alabama Report.
McGregor, S.W., P.E. O’Neil, and B. Gillett. 2005. Water Quality and Biological, Monitoring in Bobcat
and Matthews Caves, Redstone Arsenal, Alabama, 1990-2005. Geological Survey of Alabama, Open-File Report 0528.
McGregor, S.W., P.E. O’Neil, K.F. Reams, P.H. Moser, and R. Blackwood, 1997. Biological, Geological,
and Hydrological Investigations in Bobcat, Matthews, and Shelta Caves and Other Selected

108
Caves in North Alabama. Geological Survey of Alabama, Bulletin 166. McGregor, S.W., P.E. O’Neil, and E.A. Wynn. 2008. Water Quality and Biological, Monitoring in Bobcat
and Matthews Caves, Redstone Arsenal, Alabama, 1990-2008. Geological Survey of Alabama Open-File Report 0813.
McGregor, S.W., P.E. O’Neil, and E.A. Wynn. 2009. Water Quality and Biological, Monitoring in Bobcat
and Matthews Caves, Redstone Arsenal, Alabama, 1990-2009. Geological Survey of Alabama Open-File Report 0919.
Medina-Elizalde, M.C.A.D., Burns, S.J., Polanco-Martínez, J.M., Beach, T., Lases-Hernández, F., Shen,
C.-C., and Wang, H.-C., 2016, High-resolution speleothem record of precipitation from the Yucatan Peninsula spanning the Maya Preclassic Period: Global and Planetary Change, v. 138, p. 93–102, doi: 10.1016/j.gloplacha.2015.10.003.
Murgulet, D., Cook, M., and Murgulet, V., 2016, Groundwater mixing between different aquifer types in
a complex structural setting discerned by elemental and stable isotope geochemistry: Hydrological Processes, v 30, no. 3, p. 410-423, doi: 10.1002/hyp.10589.
National Centers for Environmental Information, National Oceanic and Atmospheric Administration
(NOAA), https://www.ncdc.noaa.gov/sotc/tropical-cyclones/200709 (accessed April, 2017). Natter, M., J. Keevan, A. S. Keimowitz, B.Okeke, Y. Wang, A. Son, M.-K. Lee, 2012, Level and
degradation of Deepwater Horizon spilled oil in coastal marsh sediments and pore- water, Environmental Science and Technology, 46, 5744-575.
Palmer, A.N., 1986. Prediction of contaminant paths in karst aquifers. In: Environmental Problems in Karst Terranes and Their Solutions Conference. National Water
Well Association, Eastern Kentucky University, Friends of the Karst, Kentucky Division of Water, Western Kentucky University, and National Park Service. National Water Well Association, Dublin, Ohio. pp 32-51.
Palmer, A.N., 1989. Stratigraphic and structural control of cave development and groundwater flow in
the Mammoth Cave region. In: White, W.B and E.L. White, eds., Karst Hydrology – Concepts from the Mammoth Cave Area. pp 293-316.
Penny, E., Lee, M.-K., and Morton, C., 2003, Groundwater and microbial processes of Alabama coastal
plain aquifers: Water Resources Research, v. 39, no. 11, doi: 10.1029/2003WR001963. Raymond, D.E., 2003, Geology of the Madison 7.5-Minute Quadrangle, Madison County, Alabama.
Geological Survey of Alabama Rheams, K.F., P.H. Moser, and S.W. McGregor, 1994. Hydrogeologic and biologic factors related to the
occurrence of the Alabama Cave Shrimp (Palaemonias alabamae), Madison County, Alabama. Geological Survey of Alabama, Bulletin 161.
Richter, K.E., 1984, Water in Alabama, 1982 water year: Alabama Geological Survey Circular 140, 97 p.
109
Robinson JL. 2004. Age and source of water in springs associated with the Jacksonville Thrust Fault Complex, Calhoun County, Alabama: USGS Scientific Investigations Report 2004-5145; 34.
Rollinson, H.R., 1993, Using Geochemical Data: Evaluation, Presentation, Interpretation: Longman
Scientific & Technical, Harlow, Essex, England. Rozanski, K., Araguás- Araguás, L., and Gofiantini, R., 1993, Isotopic patterns in modern global
precipitation, in Climate Change in Continental Isotopic Records, edited by P. K. S., et al., no. 78 in Geophys. Monogr. Ser., AGU, Washington, D. C.
Ryan, M., and Meiman, J., 1996, An examination of short-term variations in water quality at a karst
spring in Kentucky: Ground Water, v. 34, no. 1, p. 23-30. Schmidt, G.A., Legrande, A.N., and Hoffman, G., 2007, Water isotope expressions of intrinsic and forced
variability in a coupled ocean-atmosphere model: Journal of Geophysical Research, v. 112, no. D10, doi: 10.1029/2006jd007781.
Shaw Environmental, 2003. Sitewide Karst Hydrogeologic Investigation, Phase I Report of Findings,
Redstone Arsenal, Madison County, Alabama. EPA ID Number AL 7 210 020 742, Volumes I and II. Report Prepared for the United States Army Corps of Engineers, Savannah District. Delivery order number 0004, contract number DACA2196-D-0018, project number 772650.
Shaw Environmental, 2007. Interim Remedial Action for Installation-Wide Groundwater, Redstone
Arsenal, Madison County, Alabama. Report prepared for the United States Army Corps of Engineers, Savannah District. Delivery order number 0022, contract number DACA2196-D-0018, project number 109774.
Shaw Environmental, 2009. Final Northern Boundary Groundwater Investigation, Report of Findings,
Redstone Arsenal, Madison County, Alabama. Report prepared for the United States Army Corps of Engineers, Savannah District. Delivery order number 0022, contract number DACA2196-D-0018, project number 109774.
Snieder, R., and Trampert, J., 1999, Inverse Problems in Geophysics: CISM International Centre for
Mechanical Sciences Wavefield Inversion, p. 119–190, doi: 10.1007/978-3-7091-2486-4_3. Stumm, W., and Morgan, J.J., 1996, Aquatic Chemistry: Chemical Equilibria and Rates in Natural
Waters, third ed. Wiley, New York. Sullivan, S., 1996. Dissolutional chemical kinetics of karst terranes, augmented study related to
hydrologic modeling of Bobcat Cave. Unpublished master’s research paper, Department of Civil and Environmental Engineering, the University of Alabama in Huntsville.
Szabo, M.W., W.E. Osborne, and C.W. Copeland, Jr., 1988. Geologic Map of Alabama, Northwest
Sheet. Geologic Survey of Alabama, Special Map 220. U.S. Army Institute of Public Health, 2014. Bobcat Cave Hydrogeological Assessment No. S.00023603-14.

110
U.S. Drought Monitor, 2017. United States Department of Agriculture, National Oceanic and Atmospheric Administration.
U.S. Environmental Protection Agency. 1999. “Method 415.1: Determination of Total Organic Carbon
in Water using Combustion or Oxidation” U.S. Environmental Protection Agency. 2006. “Method 8260C (SW-846): Volatile Organic Compounds
by Gas Chromatography/Mass Spectrometry (GC/MS),” Revision 3. U.S. Environmental Protection, 2017, National Primary Drinking Water Regulations. U.S. Environmental Protection Agency, 2017, National Priorities List (NPL) Sites U.S. Fish and Wildlife Service, 1988. Endangered and threatened wildlife and plants. Endangered
status for the Alabama cave shrimp, Palaemonias alabamae. Federal Register 53: 34696-34698.
U.S. Fish and Wildlife Service, 1997. Recovery Plan for the Alabama Cave Shrimp (Palaemonias
alabamae). Atlanta Georgia. 59pp. U.S. Geological Survey, National Water Information System:
https://waterdata.usgs.gov/nwis/uv?site_no=03575830 U.S. Geological Survey, Principal Karst Aquifers of the United States:
http://water.usgs.gov/ogw/karst/aquifers (accessed February 2016). White, W.B., White, W.L., 2001, Conduit fragmentation, cave patterns, and the localization of karst
groundwater basins: the Appalachians as a test case. Theoretical and Applied Karstology. ISSN: 2333-9721; 13-14: 9-23
White, W.B., 2002, Karst hydrology: Recent developments and open questions, Engineering Geology,
65, 85-105. White, W.B., 2006. Fifty years of karst hydrology and hydrogeology: 1953-2003, Geological Society of
America Special Paper 404, 139-152. Williams, PW., 1983, The role of the subcutaneous zone in karst hydrology. Journal of Hydrology 61:
45-67. Worthington, S.R.H., 2004. Hydraulic and geological factors influencing conduit flow depth. Cave and
Karst Science 31(3): 123-124. Zhu, J., Currens, J.C., and Dinger, J.S., 2011, Challenges of using electrical resistivity method to locate
karst conduits—A field case in the Inner Bluegrass Region, Kentucky: Journal of Applied Geophysics, v. 75, p. 523–530, doi: 10.1016/j.jappgeo.2011.08.009.


![Underground Water Observation in Wari-ishi Hot Spring ... · IMC, Gifu Univ.; [4] GSJ, AIST; [5] ERI, Univ. Tokyo 7th Japan-Taiwan International Workshop on Hydrological and Geochemical](https://img.pdfslide.net/doc/110x75/5fd21ff908ca392893191d68/underground-water-observation-in-wari-ishi-hot-spring-imc-gifu-univ-4-gsj.jpg)