Embed Size (px)
Citation preview

HYDROLOGY AND EFFECTS OF MINING IN THE UPPER RUSSELL FORK BASIN, BUCHANAN AND DICKENSON COUNTIES, VIRGINIA
By J.D. Larson and John D. Powe
U.S. GEOLOGICAL SURVEYWater-Resources investigations Report 85-4238
Richmond, Virginia 1986

UNITED STATES DEPARTMENT OF THE INTERIOR
DONALD PAUL HODEL, Secretary
GEOLOGICAL SURVEY
Dallas L. Peck, Director
For sale by the Distribution Branch, 604 South Pickett Street
U.S. Geological Survey, Alexandria, VA 22304

ACKNOWLEDGMENTS
Personnel from several mining companies provided data and advice to the authors In the course of the study. Special thanks Is given to personnel of United Coal Company, Jewell Smokeless Coal Company, and Island Creek Coal Company for providing- well information, maps, and access to core-hole data. Noah Horn Drilling Company, Keen Mountain Drilling Company, and Barton Drilling Company also provided well information. James Henderson, Jeremy Grantham, Martin Mitchell, Michael Morris, and Jack Nolde of the Virginia Division of Mineral Resources provided geologic information. John Pierce, Mike Dale, and Lynn Haynes of the Virginia Division of Mine Land Reclamation provided files on mine permits, water-quality data, maps, and well and spring information. The authors thank the people of Buchanan County who allowed access to their property, wells, and springs.
Personnel of the Virginia Office of the U.S. Geological Survey deserve special recognition. James Gemmell, Curtis Barrett, and Peter Hufschmidt assisted in the collection of the streamflow, water-quality, and well data and assisted in aquifer testing. Richard Ahlin assisted the authors in data reduction and analysis.

FACTORS FOR CONVERTING INCH-POUND UNITS TO INTERNATIONAL SYSTEM (SI) UNITS
The following factors may be used herein to the International System
Multiply Inch-pound units
inch (in.) foot (ft) mile (mi)
square mile (mi2 )
gallon (gal) gallon (gal)
cubic foot per second (ft3 /s)
cubic foot per second per square mile [(ft3 /s)/mi2 ]
gallon per minute (gal/min)
to convert the inch-pound units published of Units (SI):
by To obtain SI units
Length
25.40 millimeter (mm) 0.3043 meter (m) 1.609 kilometer (km)
Area
2.590 square kilometer (km2 )
Volume
3.785 liter (L) 0.003785 cubic meter (m3 )
Flow
0.02832 cubic meter per second (m3 /s)
0.01093 cubic meter per second per square kilometer [(m3 /s)/km2 ]
0.06308 liter per second (L/s)
Tr ansmi s s i v i t y
foot squared per day (ft2 /d) 0.09290 meter squared per day (m2 /d)
IV
TABLE OF CONTENTS
ACKNOWLEDGMENTS...................................................... ill
FACTORS FOR CONVERTING INCH-POUND UNITS TO INTERNATIONAL SYSTEM(SI) UNITS.......................................................... iv
ABSTRACT............................................................. viii
1.0 INTRODUCTION......................................................... 11.1 Purpose, scope, and methods of study.. ........................... 21.2 Location of area ................................................. 4
2.0 GEOLOGIC SETTING..................................................... 72.1 Geology.......................................................... 82.2 Linear features. ................................................. 10
3.0 SURFACE-WATER HYDROLOGY............................................... 133.1 Water budget. .................................................... 143.2 Streamflow....................................................... 16
3.2.1 Correlation between gaged and ungaged sites............... 163.2.2 Flow duration............................................. 183.2.3 Flow recession............................................ 20
4.0 GROUND-WATER HYDROLOGY............................................... 234.1 Observation wells................................................ 25
4.1.1 Description............................................... 254.1.2 Water-level fluctuations.................................. 29
4.2 Aquifer hydraulic properties..................................... 334.2.1 Aquifer tests of valley wells............................. 334.2.2 Aquifer tests of ridgetop wells........................... 364.2.3 Aquifer properties from streamflow........................ 38
4.3 Conceptual ground-water flow system. ............................. 40
5.0 WATER QUALITY.................c...................................... 435.1 Ground-water and surface-water quality........................... 445.2 Relation between quality of ground and surface water............. 46
6.0 HYDROLOGIC EFFECTS OF MINING......................................... 496.1 Effects of mining on surface water............................... 50
6.1.1 Flow duration............................................. 506.1.2 Streamflow recession...................................... 526.1.3 Diffusivity............................................... 54
6.2 Effects of mining on ground water................................ 56
7.0 SUMMARY AND CONCLUSIONS.............................................. 59
8.0 SELECTED REFERENCES.................................................. 61

LIST OF ILLUSTRATIONS
Figure1.1-1
1.2-1
2.1-1
2.2-1
3.1-1
3.1-2
3.2.1-1
3.2.3-1
4.1.1-1
4.1.2-1
4.2.1-1
4.2.1-2
4.2.2-1
4.2.3-1
4.3-1
5.1-1
5.2-1
6.1.1-16.1.2-1
6.1.2-2
6.1.3-1
6.2-1 6.2-2
Map showing physiographic provinces Fork basin.........................Map showing study area and location
and location of upper Russell
of data-collection sites
Page
35
Section across upper Russell Fork basin showing stratigraphic positions of sandstone, siltstone, uhale, and major coal beds..... 9 Map showing major linear features in upper Russell Fork basin..... 11
Graph showing base-flow and total runoff from the Russell Forkbasin, 1971-1980, 1982 and 11-year average........................ 15Graph showing average monthly base :low and total runoff from the Russell Fork basin, 1971-1980, and L982........................... 15Graph of streamflow correlation of lussell Fork at Haysi, Va. and Hurricane Creek................................................... 17Streamflow hydrograph for Barton Fork near Council, Va. showing recessions........................................................ 21
Diagram showing construction features and location of observation wells............................................................Graphs showing water-level fluctuation in observation wells and precipitation,Graph showing aquifer-test analysis for valley wells by straight-line method.......................Graph showing aquifer-test analysis for valley wells by type- curve method.....................................................Graphs of slug-test results from ridgetop wells and type curves used in the analysis.............................................Graph of streamflow hydrograph for Grissom Creek showing a recession period and diffusivity.................................Diagram showing conceptual ground-water flow system in the study area..............................
Trilinear diagram showing ground-water and surface-water quality in the Grissom Creek and Barton For 'it basins......................Scatter diagram showing comparison of calcium and sodium activities for well, spring, and stream water in Grissom Creek basin.............................
Graph of flow duration curves for Russell Fork and Clinch River... Graph showing composite winter recessions before and after 1950 for Russell Fork at Haysi, Va.....................................Graph showing streamflow recessions for Russell Fork at Haysi, Va., April 19 to June 3, 1934 and March 3 to May 19, 1976.........Graph showing relation of diffusivity to extent of surface mining in the upper Russell Fork basin...................................Diagram showing ground-water flow in an underground-mined area....Diagram showing ground-water flow in a surface-mined area.........
27
31
35
35
37
39
41
45
47
51
53
53
555757

TABLES
Table Page3.2.2-1 Estimated streamflow statistics for 28 miscellaneous
measurement sites in the upper Russell Fork basin............ 19
4.2.1-1 Aquifer test data for valley material........................ 34
6.1.3-1 Selected physical and hydraulic characteristics of basinsabove five gaging stations in the Russell Fork basin......... 55
VII

HYDROLOGY AND EFFECTS OF MINING IN THE UPPER RUSSELL FORK BASIN,
BUCHANAN AND DICKENSON COUNTIES, VIRGINIA
By J. D. Larson and John D
ABSTRACT
Aquifer transmissivities estimated from pumping and slug tests at six observation wells in the Russell Fork basin decrease greatly with depth. Transmissivities also differ significantly between ridgetop and valley settings. Transmissivity (T) values at a ridge site range from about 0.30 feet squared per day (ft2 /d) near land surface to about 0.008 ft2 /d at a depth of 500 feet. T values in valley wells ranged from about 270 ft2 /d in alluvial material to about 0.15 ft2 /d in unweathered material below a depth of 60 feet. Estimated storage- coefficient (S) values of 0.00040 and 0.00048 were obtained from a weathered rock zone between 14 and 60 feet below land surface in a valley well. Aquifer tests suggest that the major aquifer system in the Russell Fork basin consists of the alluvial material and a veneer of weathered and highly fractured rock in the basin.
Powell
Flow-duration statistics obtained from a stream gage at Haysi, Virginia indicate a change in flow at the 95-percent exceedence level since the start of surface mining; flow increased from 4.0 (1928-50) to 8.9 cubic feet per second (1951-80).
Base-floi» recessions for the Russell Fork at Haysi stream gage indicate a change in ground-water depletion rate from 34 to 59 days per log cycle of discharge for the pre-1950 (0-percent mined) to the post-1950 (5-percent mined) period. This change produced a cnange in diffusivity from 28,500 ft2 /d (pre-1950, negligible surface mining) to 16,500 ft2 /d (post-1950, 5 percent of basin mined). Based onanalysisfive gaging stations, diffusivity ranges lirom 28,500 ft2 /d for RussellFork at Haysi before mining, to 10,100
Virginia its area
of individual recessions for
ft2 /d for Barton Fork near Council, which has 19.5 percent of
disturbed by surface mining.
VIII

1.0 INTRODUCTION

1.0 INTRODUCTION
1.1 Purpose, Scope, and Methods of Study
EVALUATING THE IMPACTS OF SURFACE COAL WATER RESOURCES OF AN AREA REQUIRES AM OF THE HYDROLOGIC FRAMEWORK-Hydrologic data from the upper Russell Fork basin provide information for development of a conceptual model of thelocal flow system and the hydrologicwater levels, water-quality data, precipitation data,streamflow data, and selected basin
MINING ON THE UNDERSTANDING
framework. Ground-
characteristics areused to define the total hydrologic system in the upper Russell Fork basin.
Petroleum shortages in the early 1970's produced an upsurge in coal production as an alternative source of energy. These production in creases occurred simultaneously with changes in environmental regulations governing mining activities. Industry and regulatory agencies need to know both the local hydrologic framework and basic hydrologic concepts in order to understand the natural and man-made factors affecting the hydro- logic system.
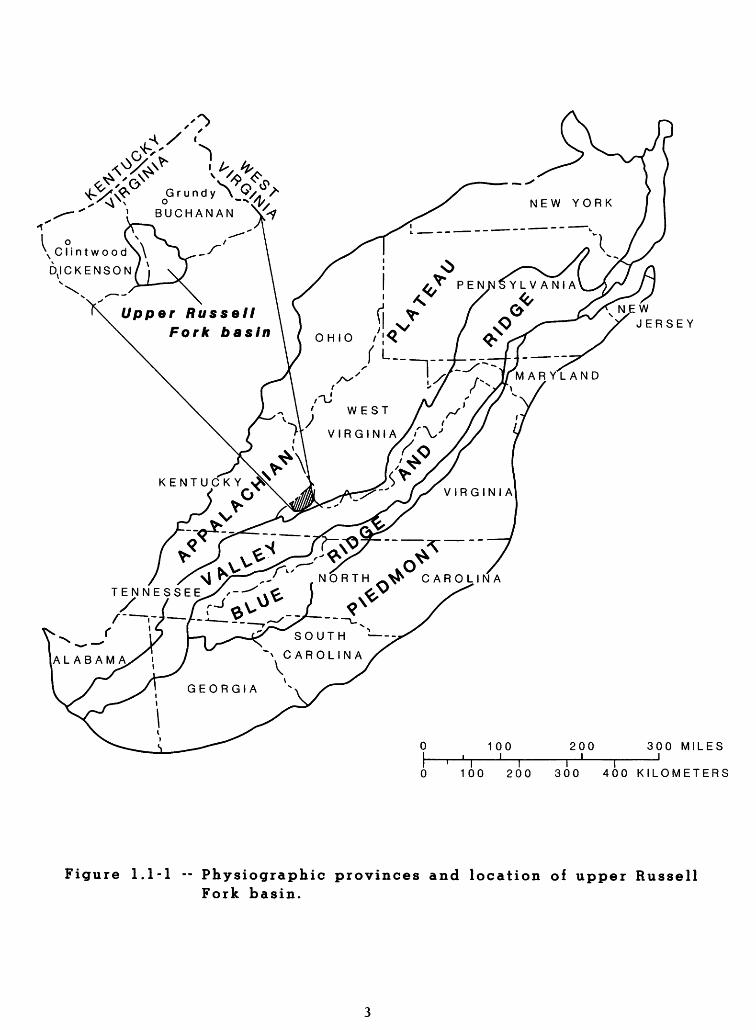
This report presents the results of a study of the upper Russell Fork basin of the Appalachian Plateau Province (fig. 1.1-1) a typical coal-area basin. The report (1) describes the ground-water and surface-water hydrology and water quality in a river basin draining a coal-producing area in southwestern Virginia; (2) describes the effects of mining on the hydrologic system; and (3) provides a conceptual under standing of the hydrologic system.
Ground-water levels, aquifer tests, water-quality data, precipita tion data, and streamflow data (pre- and post-mining), are evaluated in order to understand the hydrologic
system and possible impacts of sur face mining. Methods of determining aquifer properties from streamflows are shown.
The: Virginia Division of Mineral Resources, as part of this study, mapped the geology in the Prater and Vansant: quadrangles to complete the geologic framework for the area. Virginia Polytechnic Institute and State University, Department of Fisheries, provided data on basin characteristics. Field studies began in December of 1980. Eight obser vation wells were drilled (June- October 1981) and four gaging stations were constructed (July 1981). Data for the observation wells and " short-term gaging stations are analyzed for October 1981 through September 1982. Records for the Russel". Fork gaging station at Haysi are analyzed for 1926 to 1982. Dis charge and water-quality data were obtainetd at 28 surface-water sites. Streamj ;low, precipitation, and water- qualit^ data for sites included in this report are published by the U.S. Geological Survey (1982), and ground- water quality is discussed (Rogers and Powell, 1983).
N.EWJERSEY
1 00 I
200 I
300 MILES _I
0 100 200 300 400 KILOMETERS
Figure 1.1-1 -- Physiographic provinces and location of upper Russell Fork basin.

1.0 INTRODUCTION (continued)
1 . 2 Location of Area
UPPER RUSSELL FORK BASIN REPRESENTS SETTING IN A COAL-PRODUCING
A TYPICAL HYDROGEOLOGIC AREA OF VIRGINIA
A part of the upper Russell Fork Dickenson Counties, Virginia, was because It meets the criteria needed ground-water and surface-water hydr draining a coal-producing area In
latin of Buchanan and selected for study
to evaluate the logy of a river baa in
southwestern Virginia*
The Russell Fork basin Is located within Buchanan and Dickenson Counties in southwestern Virginia (fig. 1.2-1). This drainage basin was selected for study because it is a typical hydro- geologic basin in a coal area and meets the criteria for evaluating ground-water and surface-water hy drology.
The criteria considered for selection of the study area were (1) availablity of long-term streamflow data (USGS gaging station 03208500 at Haysi, 1926-present); (2) adequate data concerning geologic framework (access to recently drilled core holes); (3) mixture of mined and unmlned subbaslns (0 to 56 percent of basin areas disturbed by surface
mining); (4) geologic and topographic similarity to other stream basins in the coal-producing area of south western Virginia; and (5) low popula tion density.
the drainage area of the Russell Fork above the gaging station at Haysi, Virginia, is 296 mi2 (square mileii). Study emphasis was on the following subbasins: upper Russell Fork (86.5 nd.2) above the gaging sta tion near Birchleaf; Russell Fork above the gaging station at Council (10.2 mi2), and detailed studies of Grlssom Creek (2.83 mi?) and Barton Fork (1.23 mi2). Gaging-station locations, miscellaneous measurement sites, and two well-cluster sites are shown on figure 1.2-1.

EX
PL
AN
AT
ION
Dra
inag
e ba
sin
boun
dary
Co
ntin
ou
s-re
cord
gag
ing
sta
tion a
nd n
umbe
r
Mis
cella
neou
s surf
ace-w
ate
r an
d qualit
y-w
ate
r si
te
and
num
ber
q c
H A
^^^II
y-
xx
:
V>T<
: j-^
K
\A^
-V '^
X
C '
^
AV
\
\ 1^ ^
^
S^
\
Bas
e fr
om U
.S.
Geo
logi
cal
Su
rve
y B
ig
A M
ou
nta
in,
.' D
uty
, P
rate
r an
d V
an
san
t 1:2
4,0
00
(
Fig
ure
1
.2-1
--
S
tud
y
are
a
and
locati
on
of
data
-co
llecti
on
sit
es.

2.0 GEOLOGIC SETTING

2.0 GEOLOGIC SETTING
2.1 Geology
THE UPPER RUSSELL FORK BASIN Is UNDERLAIN BY GENTLY DIPPING BEDS OF SANDSTONE, SIIJTSTONE, AND COAL
The upper Russell Fork basin Is underlain primarily by gently dipping beds of sandstone, siltstone, and coal of Early and Middle Pennsylvanian age. A small outlier of sedimentary rocks of Early Cambrian to Early Pennsylvanian age is exposed at the eastern edge of the basin. Holocene alluvium and col- luvium commonly overlie older rocks in valley bottoms and on hillsides.
Most rocks of the upper Russell Fork basin are included in the Norton Formation of Early and Middle Penn sylvanian age. This formation lies stratigraphically between the under lying Lower Pennsylvanian Bee Rock Sandstone Member of the Lee Formation, and the overlying Middle Pennsylvanian Gladeville Sandstone. The Norton Formation is predominantly sandstone (over 50 percent) in the study area with siltstone, shale, and coal beds comprising the remainder. Small out liers of Middle Pennsylvanian Wise Formation which overlie the Glade ville Sandstone are found on the higher ridgetops. Small outcrops of the underlying Lee Formation are found where extensive faulting has brought this formation to the sur face. The oldest rocks exposed in
the basin are Early Cambrian to Early Pennsylvanian age. These crop out on the eastern edge of the basin where the Appalachian Plateau Province is in contact with the adjoining Valley and Ridge Province. The youngest
material present (Quaternaryrock age)toms
is alluvium in the valley bot- and colluvium on hillsides.
Thicknesses of these deposits range from 0 to 30 feet.
Figure 2.1-1 shows a geologic section across the northern part of the Russell Fork basin prepared by the Virginia Division of Mineral Resources. Rock identifications are based on samples from exploratory core holes. Strata dip gently to the northwest at about 50 feet per mile.

1800-
1600-
1400-
-2000
-1800
-1600
-1400
.. .....I I I I T I I I012 34567 KILOMETERS
VERTICAL SCALE GREATLY EXAGGERATED
DATUM IS SEA LEVEL
EXPLANATION
Eagle
Top of formation
Coal bed and name
Sandstone
Siltstone and shale
LOCATION OF CROSS SECTION
Figure 2.1-1 -- Section across upper Russell Fork basin showing stratigraphic positions of sandstone, siltstone, shale and major coal beds.

2.0 GEOLOGIC SETTING (continued)
2.2 Linear Features
RUSSELL FORK FAULT Is MAJORFEATURE IN UPPER RUSSELL FORK BASIN
The Russell Fork Fault is the major upper Russell Fork basin. Additional present.
The major linear feature in the Russell Fork basin is the Russell Fork Fault (fig. 2.2-1). This feature extends southeastward from Bee, Virginia to the headwaters of the basin, parallel to the mainstream of the Russell Fork. It is a strike- slip fault with the northern section of the fault displaced about 4 miles to the east of the southern section
LINEAR
linear feature in the linear features are
(England, 1971). The Virginia Division of Mineral Resources de lineated additional linear features within the basin as shown on the figure. Only the most prominent lineaments as seen from various high altitude and satellite photographs of the area are shown. Most tributarystreamfeatures.
valleys appear as minor linear
10

P
82
° 15'
Lin
ear
fea
ture
s
mapped
by
Virgin
ia
Div
isio
n
of
Min
era
l R
esourc
es
EX
PL
AN
AT
ION
Dra
inage
basin
boundary
Majo
r lin
ea
me
nt
Fault
with
dire
ctio
n
of
rela
tive
m
ovem
ent
Fig
ure
2
.2-1
--
M
ajo
r li
near
featu
res
in u
pp
er
Russ
ell
F
ork
b
asi
n.

3.0 SURFACE-WATER HYDROLOGY
13

3.0 SURFACE-WATER HYDROLOGY
3.1 Water Budget
A WATER BUDGET INDICATES THAT OF TOTAL RUNOFF Is GROUND-'
ABOUTWATER
Streamflow hydrographs for Russell fork at Haysi were separated into direct runoff and base-flow for 1971-1980and 1982. These separations indicatecent of total runoff is derived from the ground-water system. Monthly averages indicate that maximum runoff occurs in March, and minimum runoff occurs in September for both runoff components. Based on the water budget, about 50 percent of precipitation evapotranspirates.
ONE THIRD DISCHARGE
that about 35 per-
Total water gain and loss for a basin may be estimated using a water budget. Assuming that ground-water and surface-water divides coincide and that precipitation is the only source of water, a water budget may be stated as P=Q + E, where P is pre cipitation, Q is total basin runoff, and E is evapotranspiration. This equation assumes no changes in ground- water and surface-water storage for several years of record. Precipita tion averaged about 40 inches per year in 1971-1980 and 1982. Average streamflow at the Haysi gage repre sented about 19.5 inches of runoff per year; thus, 20.5 inches or about 50 percent of total precipitation on the basin is lost to evapotranspira tion.
The streamflow hydrograph for Russell Fork at Haysi, which measurestotal basin runoff above the gagingstation, was subdivided by inspection into direct overland runoff and base- flow runoff (ground-water discharge to the stream) for 1971-1980 and 1982. Figure 3.1-1 shows base flow and total runoff on an annual basis and the 11-year average. Figure 3.1-2 shows the average monthly values for base flow and total runoff for the same period of record. The average base-flow runoff for the 11- year period was about 7 inches peryear,19.5 j.nches of total runoff per year,
which equals 35 percent of the
14

CO LLJ X O
30
25
20
± 15
LL?LL
OZ 10
-
"I
_
1 I 1
1 i 1F^
!
( 1
^§5 §^ ^
11'///////////////////////////////////A
1 1W//////////////////M.
-
-
1971 72 73 74 75 76 77 78 79 80 82 AVG.
Base-flow runoff n Total runoff
Figure 3.1-1 -- Base flow and total runoff from the Russell Fork basin, 1971-80, 1982 and 11-year average.
COLLJ X O
r_ _,_, p
LL.
O
OCT NOV DEC JAN FEB MAR APR MAY JUN JUL AUG SEP
Base-flow runoff D Total runoff
Figure 3.1-2 -- Average monthly base flow and total runoff from the Russell Fork basin, 1971-80 and 1982.
15

3.0 SURFACE-WATER HYDROLOGY (continued)
§.2 Streamflow
3.2.1 Correlation between gaged and ungaged sites
STATISTICS FROM A GAGED STATION! ARE USED To DEVELOP STREAMFLOW STATISTICS FOR ENGAGED BASINS
Graphs that correlate streamflow data from ungaged stream- flow sites with data from concurrent continuous-record gaging stations provide a method for obtaining flow statistics. Six streamf low measurements were used to develop streamflow statistics In ungaged basins.
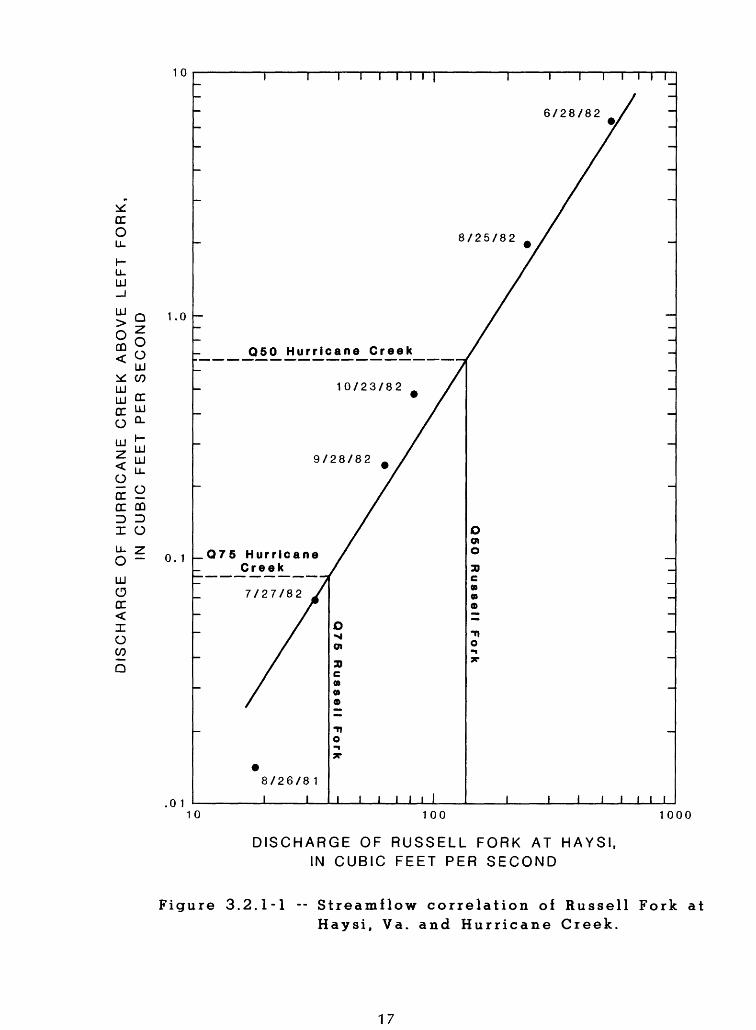
Streamflow measurements were made at selected sites and correlated with concurrent flow at a continuous- record gaging station located within the same basin in order to estimate streamflow statistics for subbasins not having continuous-record gaging stations. Figure 3.2.1-1 shows this type of correlation for Hurricane Creek above left Fork and Russell Fork at Haysi. Six measurements (August 1981 to October 1982) at each site are correlated with flows at the Haysi gage.
The Q5Q streamflow for Russell
Fork ^it Haysi is 135 cubic feet per second (ft^/s). This statistic means that 50 percent of the time, the Russell Fork streamflow is greater than or equal to 135 ftVs. Horizon tally across from where the Russell Fork (150 line intersects the correla tion line is the Q$Q value for the ungagctd site. The estimated Q5Q streamflow for Hurricane Creek isabout gives
_ _..0.67 ft3 /s. This correlationestimated flow statistics for
a stream, as shown on the figure. Caution must be used when obtaining flow statistics beyond the range of measurements for an ungaged basin.
16
1 0
oc O
LU_J
1.0
CO
LUCCo
OC COID DX O
u. z O ~
LLJ O OC<I oC/)
Q
0. 1
.0 1
I I I I I I I iiIiiTTr
6/28/82
8/25/82
Q50 Hurricane Creek
10/23/82 _
9/28/82
_Q75 Hurricane Creek
7/27/82
8/26/81
J_____I I I I I I I I
10 100 1000
DISCHARGE OF RUSSELL FORK AT HAYSI, IN CUBIC FEET PER SECOND
Figure 3.2.1-1 -- Streamflow correlation of Russell Fork atHaysi, Va. and Hurricane Creek.
17

3.0 gURFACE-WATER HYDROLOGY (continued)
3.2 Str>eamflow
3.2.2 Flow duration
ESTIMATED FLOW-DURATION STATISTICS FOR UNGAGED SITES OBTAINED BY STREAMFLOW CORRELATION
Flow-duration statistics were estimated sites using flow data from the Russell Haysl.
for 28 small ungaged ork gaging station at
A flow-duration curve Is a cumu lative-frequency curve that indicates the percentage of time specified dis charges were equaled or exceeded during a given time period. The low- or base-flow segments of these curves are useful in assessing the effects of geology and man's activities on the hydrologic system.
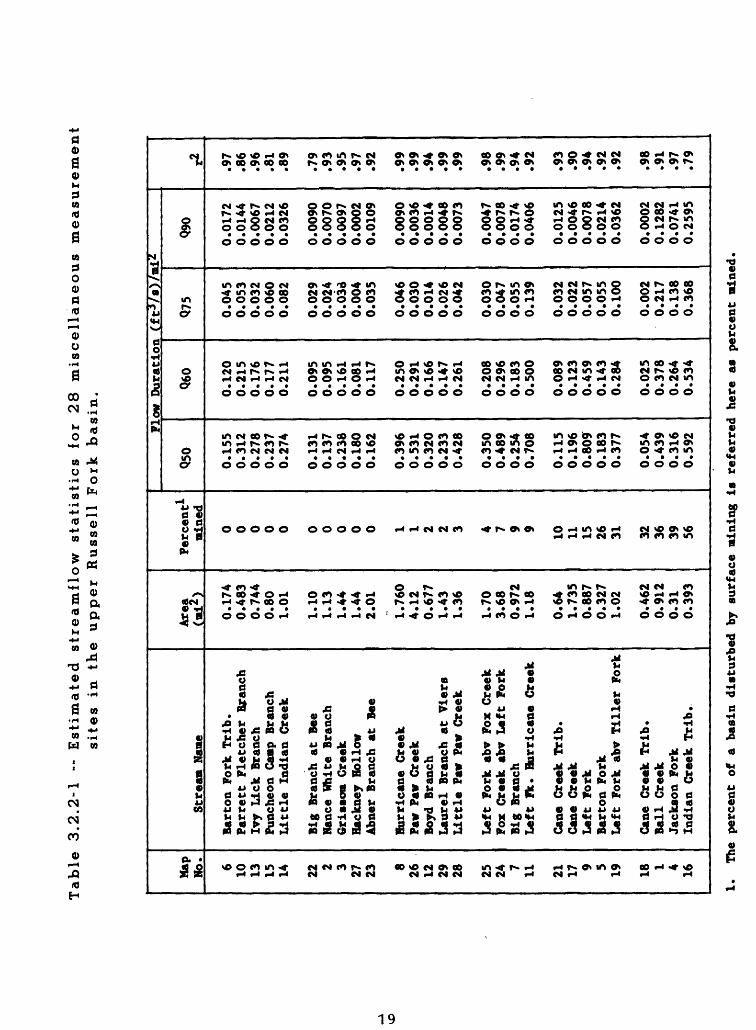
Flow-duration statistics (Q5Q» Q£Q» Qy5» and Qgg) are estimated for 28 ungaged streamflow sites draining the upper Russell Fork basin uti lizing data from the gage on Russell
Fork at Haysi. Table 3.2.2-1 lists flow st4tistics, basin area, and per cent otf area disturbed by surface mining. The table is sorted into increasing mining and basin size. In the table, estimated flow statistics compare flow data for basins of dif fering areal extent. The r^ value on the table is a correlation coef ficient, which statistically shows the closeness of fit of the measure ments with the correlation curve. The closer the r2 value is to 1.0, the clofier the data points are to the curve.
18
Table
3.2
.2-1
--
E
stim
ate
d
str
eam
flow
sta
tisti
cs
for
28
m
iscell
aneous m
easu
rem
en
tsit
es
in th
e
upper
Ru
ssell
F
ork
basin
.
Map
Mo. 6 10 13 15 14 22 2 3 27 23 8 26 12 29 28 25 24 7 11 21 17 9 5 19 18 1 4 16
Stre
am Nam
e
Bart
on For
k Trib.
Parr
ett
Flet
cher
Br
anch
Ivy Lick B
ranc
hPu
nche
on C
amp
Bran
chLi
ttle
In
dian
Cre
ek
Big
Bran
ch a
t Be
eNance
White
Bran
chGr
isso
m Cr
eek
Hack
ney Hollow
Abner
Bran
ch a
t Bee
Hurr
ican
e Cr
eek
Paw Pa
w Cr
eek
Boyd Br
anch
Laur
el Br
anch
at
Viers
Litt
le Paw
Paw Cre
ek
Left
Fo
rk a
bv F
ox C
reek
Fox
Cree
k abv Left Fo
rkBi
g Br
anch
Left
Ik
. Hu
rric
ane
Cree
k
Cane
Creek
Trib
.Ca
ne C
reek
Left Fork
Bart
on For
kLeft Fo
rk a
bv T
ille
r Fo
rk
Cane
Creek
Trib.
Ball
Creek
Jack
son Fo
rkIn
dian
Creek
Trib.
Area
(mi2
)
0.174
0.483
0.744
0.80
1.01
1.10
1.13
1.44
1.44
2.01
1.760
4.12
0.677
1.43
1.36
1.70
3.68
0.972
1.18
0.64
1.735
0.887
0.327
1.02
0.462
0.912
0.31
0.393
Percent*-
mined
0 0 0 0 0 0 0 0 0 0 1 1 2 2 3 4 7 9 9 10 11 15 26 31 32 36 39 56
Flow Duration
(ftj
/s)/mi2
Q50
0.155
0.312
0.278
0.237
0.274
0.131
0.137
0.23
80.180
0.162
0.396
0.531
0.32
00.233
0.428
0.350
0.489
0.254
0.708
0.115
0.196
0.80
90.183
0.377
0.054
0.439
0.316
0.592
Q60
0.120
0.215
0.176
0.177
0.211
0.095
0.095
0.161
0.081
0.117
0.250
0.291
0.166
0.147
0.261
0.208
0.296
0.183
0.500
0.089
0.123
0.459
0.143
0.284
0.025
0.378
0.264
0.534
Q75
0.045
0.053
0.032
0.060
0.082
0.029
0.024
0.038
0.004
0.035
0.046
0.030
0.014
0.026
0.042
0.03
00.047
0.055
0.139
0.032
0.022
0.057
0.055
0.100
0.002
0.217
0.138
0.368
090
0.0172
0.0144
0.0067
0.0212
0.0326
0.00
900.
0070
0.0097
0.00
020.
0109
0.00
900.0036
0.00
140.
0048
0.00
73
0.0047
0.0078
0.01
740.
0406
0.01
250.0046
0.00
780.
0214
0.03
62
0.00
020.1282
0.07
410.
2595
r2 .97
.86
.96
.81
.89
.79
.93
.95
.97
.92
.99
.99
.94
.99
.99
.98
.99
.94
.92
.93
.90
.94
.92
.92
.98
.91
.97
.79
1.
The
percent
of a
basin
dist
urbe
d by s
urfa
ce m
ining
is referred h
ere
as pe
rcen
t mined.

3.0 SURFACE-WATER HYDROLOGY (continued)
3.2 StveamfioD
3.2.3 Flow recession
BASE-FLOW RECESSION CURVES SHOW GROUND-WATER DISCHARGE AND SEASONAL VARIATION DUE To EVAPCITRANSPIRATION
A base-flow recession curve from a a measure of the rate of decline in within a basin.
streamflow hydrograph is {round-water storage
Flow recession is the rate of streamflow decrease; during base-flow periods, it approximates the decline in ground-water storage in a basin. Recession curves are developed by selecting straight-line segments of stream hydrographs that show flow after storm events and transposing these segments onto a straight line through the range of discharges observed.
Figure 3.2.3-1 is a streamflow hydrograph for Barton Fork near
Council, Va., for the period October 1981 ito September 1982. As shown in the figure, the recession lines are drawn when the hydrograph changes slope after a peak. The April and June-July recession lines illustrate the change in slope of recessions due to seasonal losses due to evapotrans- plratlon. The June-July recession line is steeper, indicating loss of water from evapotranspiration. The April recession line is flatter, indicating minimal effects from evapotranspiration.
20

Barton Fork near Council, Va.
PERIOD OF RECORD : Oct. 1, 1981 to Sept. 30, 1982
AREA : 1.23 square miles
SURFACE MINING DISTURBANCE : 29%
AVERAGE DISTANCE FROM STREAM TO DIVIDE : 940 feet
DECAY RATE PER LOG CYCLE : 81 days
100
.0 1OCT NOV DEC
1981
JAN FEB MAR APR MAY JUN
1982
JUL AUG SEP
Figure 3.2.3-1 -- Streamflow hydrograph for Barton Fork nearCouncil, Va., showing recessions.
21

4.0 GROUND-WATER HYDROLOGY

4.0 GROUND-WATER HYDROLOGY
4.1 Observation Wells
4.1.1 Description
OBSERVATION WELLS WERE INSTALLED IN A VALLEY BOTTOM AND ON A RIDGETOP To EVALUATE DIFFERENT HYDROLOGIC ENVIRONMENTS
Eight observation wells were installed in the Grissom Creek subbasin to evaluate the various hydrogeologic environments present in the area. Three wells were installed in a valley bottom to monitor water levels and to conduct aquifer tests in alluvium, weathered rock, and unweathered rock. Five wells were drilled on a ridgetop to monitor water levels and to conduct aquifer tests on the weathered material and unweathered rock to the depth of the first coal bed, a sandstone-siltstone contact, and three coal-bed zones.
Eight observation wells were drilled in the Grissom Creek basin. Three wells are located in the valley bottom near the mouth of Grissom Creek and five wells are located on a ridgetop between Grissom Creek and Nance White Branch. The observation wells were constructed so that water levels and aquifer properties at specific-depth intervals below the ridgetop, and in the alluvium, weathered bedrock, and unweathered bedrock in the valley could be deter mined. Construction features and locations of the observation wells are shown in figure 4.1.1-1.
Two wells (14E40, 14E41) were drilled and one well point (14E44) was installed near the gaging station at the mouth of Grissom Creek. Well 14E40 was drilled and cased through the alluvium to a depth of 14 feet using an 8-inch diameter bit. Water inflow to the hole increased with depth in the alluvium. After 6-inch diameter casing was installed and grouted, drilling continued to a depth of 60 feet with a 6-inch bit. A gradual increase in water inflow was encountered to the Jawbone coal bed of the Norton Formation. A minor
increase in water inflow occurred below the Jawbone coal bed. Well 14E41 was similarly drilled to a depth of 60 feet; after 6-inch casing was installed and grouted, drilling continued with a 6-inch diameter bit to a depth of 125 feet. Very little water was encountered below the cased section of the hole. Well 14E44 is a 2-Inch diameter well point driven into alluvium near the bank of Grissom Creek; the water level was 2 feet below land surface. An unused well (14E42) at the site also was used as an observation well; the well is 60 feet deep and has 4-inch casing to a depth of 14 feet.
Five wells were drilled in a cluster on a ridgetop between Grissom Creek and Nance White Branch to moni tor differences in water levels bet ween major coal beds in the Norton Formation and to determine the hy draulic properties of the rocks. No measurable amount of water was pro duced during the drilling of any of the ridgetop wells. Two 8-inch diameter holes (14E25 and 14E26) were drilled to depths of 56 and 101 ft, respectively, and were cased with 4-inch diameter PVC pipe. In well
25

4.0 GROUND-WATER HYDROLOGY (continued)
4.1 Observation Wells (continued)
4.1.1 Description (continued)
14E25, casing was slotted from the bottom of the well (in the Upper Banner coal bed) to the bottom of the soil zone at a depth of two feet, a gravel pack was installed, and, the casing was grouted in with a 2-foot cement cap to the surface. Well 14E26 had slotted PVC casing in stalled from 56 feet (below the Upper Banner coal bed) to the bottom, and a gravel pack was installed. The annu lar space between the casing and drilled hole was grouted with ben- tonite and cement from the top of the gravel pack to land surface. Well 14E26 does not reach the Lower Banner coal bed but is finished just below a sandstone-siltstone contact. Three additional 8-inch diameter holes
(14E37,
annulus
14E38 and 14E39) were drilledto the tottorn of coal beds* Six-inch casing was installed to the bottom of each. Cement grout was injected into the well and forced up the outside
to the surface. Drilling wascontinued into the next coal bed. The lower section of each well is an Open hoLe. Well 14E39 is open from the botl:om of the Lower Banner coal bed into the Kennedy coal bed at a depth of 243 ft. Well 14E38 is open from th<» bottom of the Kennedy coal bed into the Aily coal bed at 423 ft. and Well 14E37 is open from the bot tom of the Aily coal bed through the Raven iL 2, and 3 coal beds, to a depth of 582 ft.
26

I I1/2
I1 MILE I
1/2n
1 KILOMETER
CONTOUR INTERVAL 100 (-EET DATUM IS SEA LEVEL
LU
LU
<LU CO
LU QD
FEET
2500
2400
2300
2200
2100
2000
1900
1800
RIDGETOP WELL CLUSTER
14E25 14E37 14E26 14E38
VALLEY WELL CLUSTER
< 1 '.i\t°- °^ Upper
TD 56 teet
Lower
Kennedy
Ally
Raven 3Raven 2Raven 1
_
\ Banner \
TD 101 E
Banner
c
c
C(
cC(
| \ coal
J- teet
coal
aal
Dal
TD 4
331
331
33l
23
bed
bed
bed
TD 2
bed
teet
bedbedbed
43 tee
TD 582 teet
25I
FEET
1900
1800
1700
1600 L
14E44 14E40GRISSOM CREEK
TD 125 teet
50 FEET
I I 10 15 METERS
EXPLANATIONGrout8-inch hole4-inch perforated casingGravel pack
2-inch well point
- 8-inch hole
-6-inch casing
- Grout
- 6-inch open hole
TD Total depth ot well
Figure 4.1.1-1 -- Construction features and location ofobservation wells.
v\27
4.0 GROUND-WATER HYDROLOGY (continued)
4.1 Observation Wells
4.1.2 Water-level fluctuations
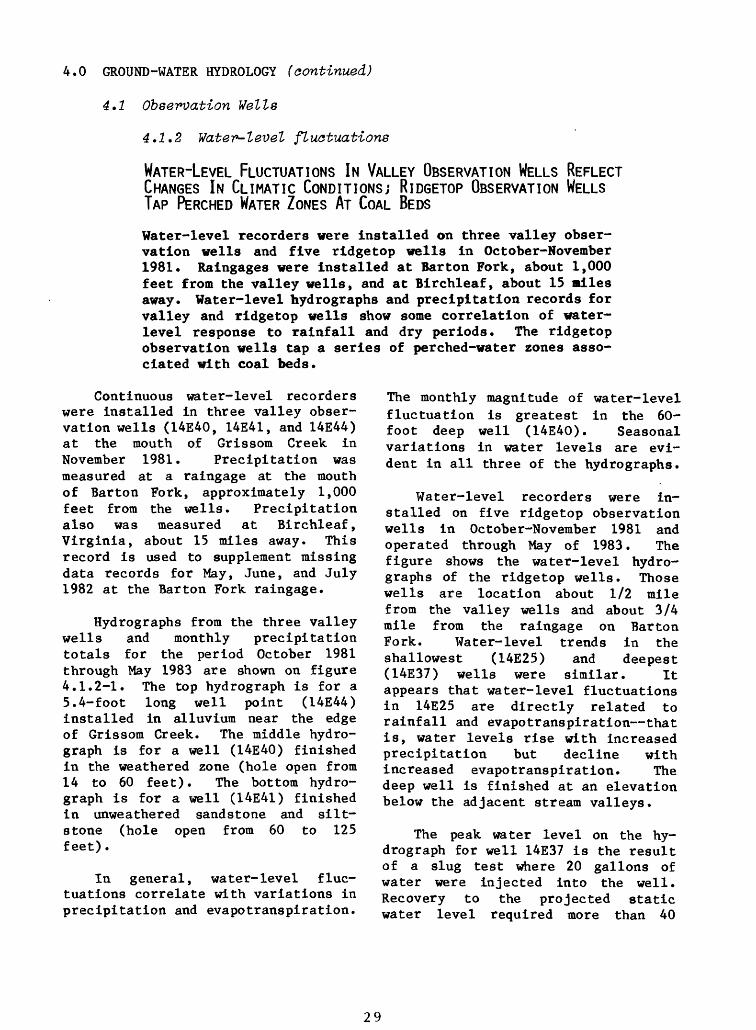
WATER-LEVEL FLUCTUATIONS IN VALLEY OBSERVATION WELLS REFLECT CHANGES IN CLIMATIC CONDITIONS; RIDGETOP OBSERVATION WELLS TAP PERCHED WATER ZONES AT COAL BEDSWater-level recorders were installed on three valley obser vation wells and five ridgetop wells in October-November 1981. Raingages were installed at Barton Fork, about 1,000 feet from the valley wells, and at Birchleaf, about 15 miles away. Water-level hydrographs and precipitation records for valley and ridgetop wells show some correlation of water- level response to rainfall and dry periods. The ridgetop observation wells tap a series of perched-water zones asso ciated with coal beds.
Continuous water-level recorders were installed in three valley obser vation wells (14E40, 14E41, and 14E44) at the mouth of Grissom Creek in November 1981. Precipitation was measured at a raingage at the mouth of Barton Fork, approximately 1,000 feet from the wells. Precipitation also was measured at Birchleaf, Virginia, about 15 miles away. This record is used to supplement missing data records for May, June, and July 1982 at the Barton Fork raingage.
Hydrographs from the three valley wells and monthly precipitation totals for the period October 1981 through May 1983 are shown on figure 4.1.2-1. The top hydrograph is for a 5.4-foot long well point (14E44) installed in alluvium near the edge of Grissom Creek. The middle hydro- graph is for a well (14E40) finished in the weathered zone (hole open from 14 to 60 feet). The bottom hydro- graph is for a well (14E41) finished in unweathered sandstone and silt- stone (hole open from 60 to 125 feet).
In general, water-level fluc tuations correlate with variations in precipitation and evapotranspiration.
The monthly magnitude of water-level fluctuation is greatest in the 60- foot deep well (14E40). Seasonal variations in water levels are evi dent in all three of the hydrographs.
Water-level recorders were in stalled on five ridgetop observation wells in October-November 1981 and operated through May of 1983. The figure shows the water-level hydro- graphs of the ridgetop wells. Those wells are location about 1/2 mile from the valley wells and about 3/4 mile from the raingage on Barton Fork. Water-level trends in the shallowest (14E25) and deepest (14E37) wells were similar. It appears that water-level fluctuations in 14E25 are directly related to rainfall and evapotranspiration that is, water levels rise with increased precipitation but decline with increased evapotranspiration. The deep well is finished at an elevation below the adjacent stream valleys.
The peak water level on the hy drograph for well 14E37 is the result of a slug test where 20 gallons of water were injected into the well. Recovery to the projected static water level required more than 40
29

4.0 GROUND-WATER HYDROLOGY (continued)
4.1 Observation Wells (continued)
4.1.2 Water-level fluctuations (continued)
days, which Indicates a very low transmissivity. The peaks on the hydrographs for wells 14E25, 14E26, and 14E39 recovered from similar slug injections in 1 to 5 days.
Each ridgetop well is open to a different coal bed or contact, and
waterdifferentzonesbeds,seriesthe coal
levels in each well stand at altitudes. Unsaturated
were encountered between coal indicating the presence of a of perched water zones above beds.
30

RIDGETOP WELL CLUSTER
VALLEY WELL CLUSTER
14
E2
51
4E
44
48
50
52
54
W
<
92
«
94
W
96
Q
98
T?
§ «
£>
-!
2
30
"^
s,
w
c i
E-1
vo
w
^ ^
£
4
17
_\
"
IP
5
4
19
S~
J
421
£ >
4
23
W hJ
£
49
4
<
496
£
49
8
500
502
50
4
50
6
50
8
RI
n
s
/X^*--
> s^
*>-
/^
^-
»^
*^^
*^
/~V
^^-^
H-^
'^"
14E
26
Depth
of
w
ell
-
101
feet
- ^
s^^-*
^^H
O!
^
o:-
^-~
.
^^^
^^^^
* '
14E
39
D
epth
of
w
ell
- 243 fe
et
-~~-
. "
\ JV
14
E3
8
.^ _-
- -*
^ -- ^
^-~-
^ -
-^
..^
-
Dep
th
of
wel
l^*- ~
_--
-
42
3 fe
et
L4E
37
Dep
th
of
wel
l -
582 fe
et
s^-
"/
f*^f
^--
\ \
^
^s
\ V
1mij
e
=
-~ ,
cti
_y o n
s~ tee
t
_ «^^
/
s*"
^~
RFPTPTTATTONTnr.oirnA
iiyiN, WATER
LEVEL, IN
FEET
BELOW
LAND
SURFACE IN
INCHE
S
__
U1&&.&.&&UIM
»-
H-
M
3CO4^0>OOO
OCDO)4itOOCDO) 4^COOOOO)4^CO 4^COC
J
-^
^-_/f^
L.
V , ^K
1 1
L^A
qu
ifer
te
st1 /
^
^"^
-^
14E
40
Depth
of
well
-
60
feet
r^-f
r^s
|\ vlrv
^i V^
UVM \j
1^J
- r ^
14E
41
^r
» ^V
vf
^ /
'V
/ ^
r/
/
/X
^NC
Aq
^^N rifi
A^
[rt
A
-^ v= 8
8t
L / V/v
v/]/
' rV
Dep
th
of w
ell
-
125
feet
/S1
r^
ug ,iT r
wi
-^/
hd
VA
-raw i 3-ra
l \-tee
-S \
t ^ J
/ /
ON
DJ
FM
AM
J
JA
SO
ND
J
FM
AM
1981
19
82
1
98
3
PR
EC
IPIT
AT
ION
:»,,.
,fe
«i
11
m ijiSl
iIl
i^ s
s^
ii:i©f
mm i|l
11iS
isSi
111
Bis
mm
ONDJ
1981
FMAMJ JASONDJ FMAM
1982
1983
Fig
ure
4.1
.2-1
--
W
ate
r-le
vel
flu
ctu
ati
on
in
observ
ati
on
well
s and p
recip
itati
on
.

4.0 GROUND-WATER HYDROLOGY (continued)
4.2 Aquifer* Hydraulic Properties
4.2.1 Aquifer tests of valley wells
AQUIFER TESTS IN VALLEY INDICATE A WIDE RANGE OF TRANSMISSIVITIES
Aquifer tests of the valley observation wells at the mouth of Grlssom Creek were conducted during the week of August 23-27, 1982. Estimated transmlsslvltles ranged from 270 ft2 /d In the alluvial material, 120 to 140 ft^/d In the weathered- bedrock zone, and about 0.15 ft2 /d In the unweathered bed rock. Storage coefficients from 4.0 x 10~* to 4.8 x 10~* were determined for the weathered-bedrock zone.
The movement of water within an aquifer depends, in part, on the hydraulic properties of the aquifer. Two principal hydraulic properties of an aquifer are storage coefficient and transmissivity.
Two techniques for determining aquifer hydraulic properties were used. The most common and widely used technique for determining aquifer properties is an aquifer test. It involves pumping a well for a period of time and measuring the changes in water levels in both the pumped well and adjacent observation wells. The other technique rapidly injects or withdraws a measured volume of water; this is followed by measurements of the water-level response to this change in volunse over time. This latter procedure i . known as a slug test.
Aquifer tests were conducted at wells in the bottom of the valley (14E40, 14E41, and 14E44) August 23- 27, 1982. Pumping rates, length of tests, total drawdowns, and other pertinent information on the wells tested are provided in table 4.2.1-1. Two methods of analysis are used. One method (Cooper-Jacob, 1946, p. 529), consists of plotting water- level drawdown as a function of time
on semilogarithmic graph paper (time is plotted on the logarithmic scale, as shown in fig. 4.2.1-1). This method was applied to a pumped well (14E40) and to an observation well (14E42) 35 feet away. Transmissivity values obtained were about 130 ft 2 /d for the observation well and the ptimped well. Both wells are finished in weathered bedrock and the Jawbone coal bed. A pumping test of the 'shallow 5.4 foot well point (14E44) wa^ conducted, and the transmissivity w.js estimated to be about 270 ft2 /d for the alluvial material.
Another method of aquifer data analysis is the type curve matching technique. This method involves plotting time (t) and drawdown (s) on log-IC-R; paper (fig. 4.2.1-2) and ror«tohJn£ f'hts plot with type curves. ''r-- 1 lyslp of the shape of the curves ior the Aouifer test in the weathered bedrock in well 14E40 and 14E42, in dicates a delayed yield from aquifer storage (Boulton, 1963, fig. 1). The curve for well 14E42 also fits the dimensionless type curves for non- dimension response to pumping a fully penetrating well in an unconfined aquifer (Stallman, 1965, figures 10 and 12). Transmissivities of about 120 ft2 /d for well 14E42 and about 140 ft2 /d for well 14E40 using the
33

4.0 GROUND-WATER HYDROLOGY (continued)
4.2 Aquifer Hydraulic Properties (continued)
4.2.1 Aquifer teete of valley Delia {continued)
Boulton equation, and about 120 ft2/d for 14E42 using the Stallman equation were determined. Storage values for 14E42 were 4.0 X 10~^ by the Boulton method (where S = 4Tt/r2 ) and 4.8 x 10~~4 by the Stallman equation (where S = Tt/r2 ). T is transmissivity in ft2 /d from the above equation, t is the time at the match point, and r is the radius from the pumping well to the observation well.
Well 14E41, which is finished in unweathered bedrock, was pumped for 9 minutes at 10 gal/min at which time the water level declined 95 feet. Analysis of the water-level recovery data using a slug test analysis
method! (Cooper and others, 1967, p. 267) provides an estimated trans missivity of 0.15 ft2 /d.
Analysis of aquifer- and slug- test data shows a rapid decline in the transmissive properties of the bedrock with depth. Drill cuttings from the wells indicate the presence of a cone of weathered bedrock that is conducive to the transmission and storage of ground water. The weathered zone is more highly frac tured in addition to having openings create! by the weathering process. The additional openings and voids allow for greater storage and move ment of ground water.
Table 4.2.1-1. Aquifer test data for valley material.
Well no.Pumping rate (gal/min)
Length of test (minutes)
Total drawdown (feet) Remarks
14E40
14E41
14E42
14E44
11.5
10.0
11.5
0.18
320
9
320
6.89
54.0
6.79
3.5
Slug-test analysis
Observation well for well 14E40
34

u
l
r\W 2W fa
5X- 3
CO>i -'
S£O 4Q£< tf RQ 5
6
7
A A D D n A A °DDQ D Well !4£42
A A A Dn A Well 14E40A'-'D
ADAD
ADAAD^
-14E40As - 3.11
-
T _ 35.2Q~ As
Q= 11.5 gal/min
LJ
AD AD
A °D
ADA
D
ADAD
AA
DA
DAA°
D 1
-
-
14E42As = 3.17
-
]
AD AD
NOTE: I4E42 \s an observation well AI4E40 is a pumping well &
SoI A
0.1 1.0 10 100 1000TIME (t), IN MINUTES
Figure 4.2.1-1 -- Aquifer-test analysis for valley wells bystraight-line method.
o2
O"
1331 N
& &OQ 1.0£< (3 Q
D Well 14E40
A Well 14E42
Match point
IBou | ton T = 12^5
Stallman T = 1-^?
Q=11.5 gal /min
s = s at match point
TYPE CURVES
Boulton r/b = 2.0
Theis
- Boulton r/b = 3.0
Stallman S* = 1.47
1.0 1000 10,00010 100
TIME (t), IN MINUTES
Figure 4.2.1-2 -- Aquifer-test analysis for valley wells bytype-curve method.
35

4.0 GROUND-WATER HYDROLOGY (continued)
4.2 Aquifer Hydraulic Properties
4.2.2 Aquifer tests of ridgetop wells
AQUIFER TESTS OF RIDGETOP A DECREASE IN TRANSMISSIVITY
UELLS INDICATE WITH DEPTH
Instantaneous injections (slugs) of water were used to evaluate the aquifer properties of three ridgetop wells, (14E26, 14E39, and 14E37). Analysis of water-level responses, after injection, yield estimated transmissivity values of 0.29 ft2 /d at well 14E26 (101 feet deep), 0.088 ft*/d at tfell 14E39 (243 feet deep), and 0.008 ft2/d at well 14E37 (582 feet deep). Estimated storage coefficients are 1.0xlO~2 for well 14E26, 1.0 x 10~5 for well 14E39, and 1.0 x 10"4 for well 14E37.
The volume of water in each well and absence of water encountered during drilling necessitated the use of slug tests to obtain transmissi vity (T) and storage coefficient (S) for the ridgetop observation-well cluster. Slug-test data were ana lyzed using a curve-matching method presented by Cooper and others (1967, p. 267). This method involves plotting H/HQ as a function of time on semilogarithmic graph paper where H is the head of water at time t after injection and HQ is initial head at the time of injection (figure 4.2.2-1). Plots of these values are matched to a type curve of H/HQ as a function of Tt/rQ2 at the point where Tt/rc2 = 1.0 (T is transmissivity (ft2 /d), t is time in days and rc is the radius of the well, in feet). The time (t) where Tt/rQ2 - 1.0 is used to calculate transmissivity (ft^/d). Each type curve used in the analysis has a relative storage coef
ficient (S) for the aquifer as determined by the equation that definesthe curve. According to Cooper and others (1967), this coefficient has questionable reliability because the curves differ only slightly with an order-of-magnitude change in storage. The result is presented here as a relative storage value.
Wells 14E26, 14E39, and 14E37 were injected with 3, 5, and 20 gallons of water, respectively, on April i 8, 1982. As shown on the figure, well 14E26 has an estimated T of O.:i9 ft 2 /d and an S of 0.01, well 14E39 has an estimated T of 0.088 ft2 /diand an S of 0.00001, and well 14E37 has an estimated T of 0.008 ft2 /d and an S of 0.0001. Water encountered during drilling of the observation wells was restricted to coal beds and a thin (generally less than |-foot thick) shale zone above the coal beds.
36

14E261 . U
.9
.7
o I s
I.4
.2
.1
n
\\\\- is
« ,/''. .
/ ' =\l r° :
T =
\ T =
\
\
\
= 1.0
: 10' 2
: .33 days
: .33ft.
= .56 ft.
2
= .29ft?/d.
' Ay
14E39
oI
10 100 1000
t, IN HOURS
14E37u
9
8
7
6
5
4
3
2
1
0 0.
^V
AX\
li = i.o/ rl0 = 1
- t =7
rc = .2
o-4
5ft.
£ = -65ft.MO
1r 2T = -
_ T = .0
t
08ft?/d.
\-
\
\
\N
V__1 1.0 10 100 10
oI
u
9
7
5
4
2
1
0 .0
"V
Tt _ 1 "T ~r l
a = 1
t = .
rc = .:
H-*"\T = -
T = .
1 0
\
\
\
/o/
D' 5
M days
ZSft.
rsft.,2'c
tD88ft?/d.
1 1
\\\\\\\
0 1
V0 10
t, IN DAYS TYPE CURVES
oI
1 .0
.9
.8
.7
.6
.5
(After Cooper. Bredehoeft and Popadopulos, 1967)
o.00 1 .0 1 0.1 1 .0 1 0 100
t, IN DAYS Tt/rc2
Figure 4.2.2-1 -- Slug-test results from ridgetop wells and typecurves used in the analysis.
37

4.0 GROUND-WATER HYDROLOGY (continued)
$.2 Aquifer Hydraulic Properties
4.2.3 Aquifer properties from strearnflow
ANALYSIS OF STREAMFLOW DATA YIELDS GENERALIZED AQUIFER PROPERTIES OF A BASIN
Streamflow recessions may be used toproperties for a basin. Diffusivity (transmissivity divided by storage), can be determined from stream hydrographs. The
obtain average aquifer
technique of estimating diffusivity f is shown.
rom stream hydrographs
Base flow Is essentially ground water that discharges to a stream; thus, base-flow recession is a measure of declining ground-water storage in a basin. Rorbaugh (1964) derived an equation that estimates diffusivity for a basin by means of base-flow recessions. The Rorbaugh equation is T/S * .933a2 /At, where T is transmissivity, S is the storage coefficient, a is the average dis tance in feet from a stream to the divide in a basin, and At is the time required for discharge to decrease through one log cycle on the graph. The value of "a" is determined from the equation a=A/2L, where A is the basin area, in square feet; and L is the total length of stream channels in the basin, in feet.
Aquifer diffusivity values esti mated from recession curves are approximate values because of the effects of the short recession periods observed in this study, eva-
potraftspiration, and nonhomogeneity withiji the aquifers. According to Rorbajigh (1964), the rate of re- cessi<m approaches a straight line 0.2At days after a storm. Observed recession stabilization times support this estimate.
Figure 4.2.3-1 shows a hydrograph for Grissom Creek for the period October 1, 1981 through September 30, 1982. A period during late March and early April 1982 shows a good re cession and is used to illustrate the method of obtaining diffusivity from streajnflow. A straight line is drawn along the slope of the hydrograph line |as shown in the figure. In this case, the number of days for the line to decline from 1.0 . (ft3 /s)/mi2 to 0.1 ^ft3 /s)/mi2 is determined to be 56 days. Diffusivity in this case is then determined from the equation to be 24,800 ft2 /d, using 56 days for At and 1,220 feet for "a".
38

DIS
CH
AR
GE
, IN
C
UB
IC
FE
ET
P
ER
S
EC
ON
D
PE
R
SQ
UA
RE
M
ILE
CO
00 CO
a 5-
p a. c CD
CO
H)_
>
M-
<J
COM
. "
r*
O
^
3 O H (D
(D co cr
o
m 33 I O
D O
O
O
m
m
D W
)
> z o m
O O
O C/3 )
C
33
03 O
m
T) m 33 O D 33 m
O
O
33
D O o
O ^ en
en
O 3
O ^
CD
CD CD
0} ^ O
O c D o

4.0 GROUND-WATER HYDROLOGY (continued)
4.3 Conceptual Ground-Water Flow System\
RESULTS FROM AQUIFER TESTS INDICATE MAJOR AQUIFERS ARE ALLUVIUM AND WEATHERED BEDROCK
A conceptualization of the ground-water system shows that ground-water flow occurs primarily within the colluvium- alluvlum cover on the hlllslopes an< valley floor, and within the coal beds and weathered bedrock. Results of aquifer tests indicate that these materials are the major aquifers in the study area. The tests indicate that transmlsslvlty decreases with depth. The principal com ponent of flow in the ridge top and hlllslope areas is primarily downward. Seeps associated with coal beds are a result of lateral flow within the beds toward the edge of the hills lope. Most ground water flows laterally and upward toward the valley floor.
A conceptualization of the ground-water system in the study area is shown in figure 4.3-1. Ground- water flow primarily is within the colluvium-alluvium cover on the hill- slopes and valley floor, and within the coal beds and weathered bedrock. Results of aquifer tests indicate that these units are the major aquifers. The same tests indicate the estimated transmlsslvlty of colluvium-alluvium and weathered bedrock to be about 270 and 130 ft2 /d respectively, as compared to less than 1.0 ft2 /d for underlying unweathered bedrock. Flow in the ridgetop and hillslope areas pri marily is downward through weathered bedrock. Small amounts of ground water move downward through fractures and interstlcial openings in the unweathered bedrock to coal beds.
Seeps are associated with coal beds that lie between shale and an under clay.
iThe higher transmissivity of
coal beds results In some lateral ground-water flow within the coal beds toward the edges of hillslopes. Seeps along the edges of hlllslopes and perched zones of ground water within the ridge result from this lateral flow. Water moving downward along ! hillslopes discharges locally to a stream in the valley floor. Groundj-water flow is either to or from the stream, depending on the hydraulic gradient between the stream and aquifer material. Ground-water flow that does not discharge directly to the stream continues downgradient as underflow beneath the stream.
40

EXPLANATION
Colluvlum and alluvium
Weathered bedrock
Unweathered bedrock
Coal bed
Ground-water flow direction
Water table
Spring or aeep
Fracture
Figure 4.3-1 - Conceptual ground-water How system in the
study area.
4 1
5.0 WATER QUALITY
43

5.0 WATER QUALITY
5.1 Ground-Water and Surface-Water Quality
WATER QUALITY DURING Low FLOW Is DIRECTLY RELATED To GROUND-WATER QUALITY
In the Barton Fork basin (mined), surface water is a calcium- sulfate type at both high and low flows. In the Grissom Creek basin (unmined), water at high flow is also a calcium- sulfate type, but, during low flow 1st a calcium-bicarbonate type very similar to the quality of ground water in obser vation wells.
Chemical analyses from the five ridgetop observation wells (see sec tion 4.1) plot in the calcium- bicarbonate field on a trilinear diagram (fig. 5.1-1). Data for well 14E37 (the deepest well, 582 ft) plot in the sodium-bicarbonate field. These data are consistent with data of Rogers and Powell (1983) that indicate that wells 50 to 150 feet deep throughout the area yield calcium-bicarbonate water.
Water-quality data for streams are also plotted on figure 5.1-1. Data for Grissom Creek samples, collected during high flows, plot in the calcium-sulfate field, whereas data collected during low flows plot in the calcium-bicarbonate field. Data representing water quality in Barton Fork at both high flow and low flow plot in the calcium-sulfate field. These data are consistent with the findings of Rogers and Powell (1983) who observed that stream water in unmined basins is a sulfate type at high flows and a bicarbonate type at low flows,
whereas stream water from mined basins is a sulfate type at high and low flows.
A relationship between surface water, ground water, and mining in the (study area can be seen in the trilinear diagram. Water-quality data representing low flows in the unmined Grissom Creek basin plot near water-quality data representing ground water from observation wells; high flows in this basin plot in the calcium-sulfate field. These plots may result from flushing of the weathered-rock zone where sulfides are oxidized to sulfates by precipi tation. The plot of the Barton Fork low-flow data in the calcium-sulfate
demonstrates the effect of sur- mining on the quality of ground
field facewater and, therefore, stream-water quality. Water-quality data repre senting low flows plot closer to the bicarbonate field than do water- quality data representing high flows, demonstrating a trend similar to that seen in the Grissom Creek basin data.
44

100
100Ca
1 00 1000 0
Cl100
D
EXPLANATION
Wells
High flow
Low flow
Trend in water quality
Figure 5.1-1 -- G*ound-water and surface-water quality in theGrissom Creek and Barton Fork basins.
45

5.0 WATER QUALITY (continued)
5.2 Relation "between Quality of Ground and Surface Water
WATER QUALITY OF GRISSOM CREIIK CHANGES WITH CHANGES IN SOURCE OF GROUND WATER
In Grlssom Creek, quality of stream miter at very low flow indicates the primary source of stream-water Is ground- water outflow from bedrock. At higher flows, water quality indicates the primary source of stream water is ground-water outflow from weathered overburden. At itven higher flows, the water quality indicates the primary source of stream water is overland runoff.
Calcium and sodium in water from wells and springs in the Grissom Creek basin are plotted in figure 5.2-1. Data from wells finished in bedrock, dug wells finished in weathered overburden, and springs draining from fractures near the ridgetop, plot in separate groups showing that water from each source has a slightly different chemical character resulting from a different history of movement through weathered material and rock. Water-quality analyses from Grissom Creek at dif fering fl-'ws also are plotted on the figure and indicate a relation bet ween discharge and sources of ground water.
Activities of calcium and sodium in a very low stream discharge (0.02 ft3 /s) plot similarly with those from
drilled wells, indicating that the main source of water at very low flows is water that drains bedrock aquifers tapped by these wells. Calcium and sodium activities from somewhat higher flows (between about 0.1 fl:3 /s and 1.0 ft3/«) generally plot similarly with those from dug wells, indicating that stream water at this discharge has as its primary source the weathered overburden tapped by these wells; these flows occur during storm recessions. Activities of calcium and sodium from even higher discharge (above 12 ft3 /s) plot near those from the dilute waters found in springs. This indicates that the primary source of stream water at high discharge is probatily overland runoff, which wouldalsosodium.
be very low in calcium and
46

&.\J
O R
H
>H -3-0O
OCDO
* -3.5
^^QO
-4.0
A R
*~*~
*~
i
Bo.c
2.80 1.30^" /A3- 7<> J
A 20 16
t
A
A0.02
i i
0.40A*0.53
. A 1.304A A0.82
31 A BA 1-10
0.51
-5.0 -4.5 -4.0 -3.5 -3.0 -2.5
CALCIUM, LOG OF ACTIVITY
EXPLANATIONA Surface-water data
0.53 Discharge, in cubic feet per second
Drilled well
Dug well
' Spring
Figure 5.2-1 -- Comparison of calcium and sodium activities for well, spring, and stream water in Grissom Creek basin.
47

6.0 OLOGIC EFFECTS OF MINING
49
6.0 HYDROLOGIC EFFECTS OF MINING
* 6.1 Effects of Mining on Surface Water
6.1.1 Flow duration
FLOW DURATION FOR RUSSELL FORK AT HAYSI INDICATE SURFACE MINING INCREASES BASE FLOW
Flow duration curves are developed for the Russell Fork at Haysi and Clinch River at Cleveland covering pre-surface mining and surface-mining periods. The Russell Fork shows a significant increase in base flow since surface mining started, while the Clinch River, which has little mining activity in its basin, shows very little change.
Flow duration curves for the Russell Fork at Haysi for the two periods: 1927 to 1950 (prior to any significant surface mining in the drainage basin), and 1951 to 1980 (during and after substantial surface mining within the basin), are com pared in figure 6.1.1-1 along with curves for approximately the same periods for the Clinch River at Cleveland. The Clinch River basin lies immediately to the east of the Russell Fork basin and has similar climatic conditions. Many areas in
the Russell Fork basin have been disturbed by mining activities but few areas within the Clinch River basin above Cleveland have been affected. Data from the Clinch River site were analyzed to assess the possibility that observed changes in flow characteristics of the Russell Fork are due to changes in climatic conditions between the two periods. The figure shows little difference between the flow duration curves for the Clinch River in the pre-mining and post-mining periods in the basin.
50

1000
Qz o oUJ CO
QC UJa.
UJ UJ Li.
oCOD O
UJoQC< XoCO
100
10
1 I
Clinch River at Cleveland, Va
-1922-1950
1951-1980
Russell Fork at Haysi, Va.
1927-1950
1951-1980
10.01 0.1
I_I1 10 50 90 95 9899
RECURRENCE INTERVAL, IN PERCENT
99.9 99.99
Figure 6.1.1-1 -- Flow duration curves for Russell Fork andClinch River.
51

6.0 HYDROLOGIC EFFECTS OF MINING (continued)
6.1 Effects of Mining on Surface Water
6.1.2 Streamflow recession
BASE FLOW RECESSION CURVES INDICATE THAT INCREASES IN SURFACE MINING HAVE INCREASED GROUND-WATER
CONTRIBUTION To TOTAL RUNOFFA base-flow recession curve from a streamflow hydrograph is a measure of the rate of decay of ground-water storage within a basin. Composite curves from individual recessions for the Russell Fork basindecay rate of about 34 to 59 days per log cycle of discharge for pre-1950 and post-1950
show a change in the
Btreamflows. A comparison of two individual recession periods starting with identical discharges (April 19, 1934 and March 30, 1976) illustrates the change in decay rate for the two periods of time.
Flow recession is a rate of streamflow decrease; during base-flow periods, it approximates the decay of ground-water storage in a basin. Recession curves are developed by selecting straight-line segments of stream hydrographs that show flow after storm events and transposing these segments onto a straight line through the range of discharges observed.
Figure 6.1.2-1 shows recession curves for two time periods for the Russell Fork gage at Haysi. Winter recession curves are used to minimize the effects of losses due to evapo- transpiration. The figure shows a significant flattening of the curve during the post-1950 period and a time of 59 days per log cycle of discharge compared to 34 days per log
cycle 1950 time in su
of discharge during the pre- period. This increase in decay Ls attributed to greater storage face-mine spoil banks.
^ technique requiring fewer data to determine the recession rate uses individual recession periods. Two nearly identical peak flows and their subsequent recessions (April 19 to June 3, 1934 and March 30 to May 19, 1976) are shown in figure 6.1.2-2. The hydrographs are overlain, and a straight line is drawn through one log cycle along straight line seg ments of each. The time change per log cycle of discharge for the 1934 perioc is 36 days and for the 1976 perioc , 57 days. These values com pare very closely to rate changes of 34 days and 59 days using long-term composite curves.
52
to i to
s o» H O tf CO I-*-
0 s 0* *< 1 '
CO *" 1 '
CO
O5
as & *< CO M- < & - >
t3 HI I-J- 1 '
1 '
CO I-*-
0 <_l
CO I-*-
H( (D 0» 3 M-> o ^ HI
(D o (D CO CO I-"-
0 CO M-.
0c (D
SO
CO
co CO
- 1
CO
CO ^
DIS
CH
AR
GE
, IN
C
UB
IC
FE
ET
P
ER
S
EC
ON
D
to
- o
CO
Oen £
«
ffi
p,
(D M-.
<
O»
H
I (D
DIS
CH
AR
GE
, IN
C
UB
IC
FE
ET
P
ER
S
EC
ON
D
oo
o
o

6.0 HYDROLOGIC EFFECTS OF MINING (continued)
6.1 Effects of Mining on Surface Water
6.1.3 Diffueivity
AQUIFER DIFFUSIVITIES INDICATE A MAJOR HYDROLOGIC IMPACT OF SURFACE MINING
Aquifer diffusivities calculated for five streamflow gaging stations indicate significant changes :.n aquifer hydraulic properties due to surface-mining activities. Diffusivity
per day (ft2 /d) for no surface mining),
values range from 28,500 feet squared Russell Fork at Haysi (pre-1950, withto 10,100 ft2 /d for Barton Fork near Council (19.5 percent of drainage area surface mined).
Aquifer diffusivities (T/S) were determined from data at five gaging stations in the Russell Fork basin, using the Rorabaugh equation (see section 4.5). Recessions following single storm events and pre-1950 and post-1950 composite recessions based on several recession segments are used to determine diffusivity. Table 6.1.3-1 lists the physical charac teristics used in the analysis of base-flow recessions and summarizes the calculated hydraulic charac teristics. Diffusivity values for Russell Fork at Haysi declined from 27,000-28,500 ft2 /d (pre-1950) to 15,400-17,000 ft2 /d (post-1950).
Figure 6.1.3-1 is a plot of dif- fusivities as a function of percen tage of mined area for the five gages in the Russell Fork basin during the
Aprilperioddualatwereinverseof
Haysi
1982 base-flow recession Five composite and Indlvl-
ecessions for the Russell Forkduring selected time periods
ilso used. The graph shows anrelationship between percentmined and diffusivity.bag in
The decrease in diffusivities caused by surface mining indicates an increase in ground-water storage within the spoil material on the strip benches. The relatively flat strip benches retain precipitation for percolation into the spoils creating small ground-water reser voirs. These reservoirs slowly release the ground water in storage by seepage at the base of the spoil piles, which causes higher flows during; dry periods.
54

Table 6.1.3-1 -- Selected physical and Hydraulic characteristics ofbasins above five gaging stations in the Russell Fork basin.
Gaging Station
Grissom Creek near Council
Barton Fork near Council
Russell Fork at Council
Russell Fork at Birchleaf
Russell Fork at Hay si
Drainage Area (mi2)
2.82
1.23
10.2
86.5
286
Surface Mine Disturbance (percent)
0.0
19.5
6.3
3.9
0.0 0.0 5.0 5.0 5.0
Distance from stream to divide
(ft)
1220
936
1180
1023
1020 1020 1020 1020 1020
Recession Period Analyzed (month/year)
4/82
4/82
4/82
4/82
3-5/34 1927-1950
3-5/76 1951-1980
4/82
Time for one log cycle change
in discharge (days)
56
81
78
56
36 34 57 59 63
Diffuaivity T/s
(ft2/day)
24,800
10,100
16,700
17,400
27,000 28,500 17,000 16,500 15,400
Time for recession rate to stabilize
(day*)
11
16
16
11
7 7
11 12 13
30,000 I Russell Fork at Haysi
(I 927-1950) (I 934)
.Grissom Creek ( I 982)
Composite recessions
O Individual recession
Russell Fork at Birchleaf (1982)
Russell Fork at Haysi-(I 976)
XI95 I-I 980)-(I 982)
Russell Fork at Council (1982)
10,000
PERCENTAGE OF BASIN DISTURBED BY SURFACE MINING
Figure 6.1.3-1 -- Relation of diffusivity to extent of surface miningin the upper Russell Fork basin.
55

6.0 HYDROLOGIC EFFECTS OF MINING (continued) 6.2 Effects of Mining on Ground Water*
SURFACE AND UNDERGROUND MINING OF COAL ALTER THE NATURAL GROUND-WATER SYSTEM
A conceptualized ground-water flow system indicates the majority of ground-water movement is within the thin veneer of soil, colluvium-alluvium, and weathered bedrock. Any surface-mine activity will intercept this shallow ground water and alter its natural iiovement. Underground mining intercepts the small quantities of ground water moving within fractures in the unweathered bedrock. The ground water will then flow to the surface along the mined- out areas or is stored in t-he void left after mining.
The effects of mining on the ground-water system have been subtle but can be seen at mines in the basin. Underground mining of coal creates a drain, where water moving through the rock materials is inter cepted and flows out through the mine opening. Water may also be ponded in the void left by the coal-mining operation, which creates a subsurface storage reservoir, as shown in figure 6.2-1.
Surface-mine operations create large flat strip benches that act as catchment areas for precipitation. The precipitation percolates into the unconuolidated and weathered material creatud by the mining operation creating a ground-water reservoir. Seep areas found at the toe of strip benches are the discharge points for the (ground water. Figure 6.2-2 illustrates the ground-water flow system in a surface-mined area.
56

Seasonal dry well
iMHMH Coal bedmmmmam Mined out coal bed-^ Ground-water flow
direction
Figure 6.2-1 -- Effects of underground mining on the ground-watersystem.
Ground-water flow direction
Highwall
Spring or seep
Mine spoils
Colluvium and alluvium
Unweathered bedrock
Weathered bedrock
vmW^T' '
1%
Figure 6.2-2 -- Effects of surface mining on the ground-water system
fo M57

7.0 SUMMARY AND CONCLUSIONS
59

7.0 SUMMARY AND CONCLUSIONS
STUDY OF UPPER RUSSELL FORK BASIN INDICATES SHALLOW GROUND-WATER AQUIFER SYSTEM AND
IN THE HYDROLOGIC CYCLE WITH
PRESENCE OF A SIGNIFICANT CHANGES IINING
Results from aquifer tests con ducted in the upper Russell Fork basin indicate that transmissivity decreases with depth. Saturated materials in the valley bottoms constitute the major aquifer system with estimated transmissivities of about 270 ft2 /d in alluvium, 120-140
0ft^/d in the weathered bedrock zone and about 0.15 ft2 /d in unweathered bedrock below the valleys. Aquifer tests using ridgetop wells indicate transmissivities of about 0.3 ft^/d near land surface and less than 0.01 ft2 /d at a depth of 500 feet. The data suggest that most ground water moves through a shallow aquifer system., and that little water moves at depth.
Flow-duration analysis of gaging- station data indicate that base flows of streams have increased since the start of surface mining. At the 95- percent flow duration, flows have increased from 4.0 ft3 /s (1928-50) to 8.9 ft3 /s (1951-80). Changes in flow duration indicate infiltration and storage of precipitation have in creased and that this water drains more gradually during base-flow periods.
Analysis of a composite base-flow recession curve for the Russell Fork at Haysi gage indicates that the time required for the stream to decline in flow through one log cycle of dis charge :.ncreased from 34 days (pre- 1950) to 59 days (post-1950). The slope of recession was used to calcu late dilfusivity. The pre-1950 dif- fusivity value is 28,500 ft2 /d, and the posl:-1950 diffusivity is 16,500 ft2/d .
analyzedthevariedFork atminingft2/dWhichdisturbed
bas In
for te.s
Individual recession periods were at five gaging stations in
Diffusivities obtained from 27,000 ft2 /d for Russell Haysi before major surface- ctivities started, to 10,100
Barton Fork near Council, 19.5 percent of its area
by surface mining.
Coal mining affects ground-water and surface-water quality. Sulfate concentrations are higher in mined basins than in unmined basins. The sulfate concentrations in surface water within a mined area are greater at high flow when water is most dilute than in an unmined basin at low flow when concentrations of constituents are highest.
60

8.0 SELECTED REFERENCES
61

8.0 SELECTED REFERENCES
Barr, A. J., Goodnight, J. H., Sail, J. P., Helwig, J. T., 1976, Statis tical analysis system: SAS Insti tute Inc., Raleigh, N.C., 329 p.
Boulton, N. S., 1963, Analysis of data from non-equilibrium pumping tests allowing for delayed yield from storage: Institute of Civil Engineers Proceedings (London), v. 26, p. 469-482.
Cooper, H. H., Jr., and Jacob, C. E., 1946, A generalized graphical method for evaluating formation constants and summarizing well- field history: American Geo physical Union Transactions, v. 27, no. 4, p. 526-534.
Cooper, H. H., Jr., Bredehoeft, J. D., and Papadopulos, I. S., 1967, Response of a finite-diameter well to an instantaneous charge of water: Water Resources Research v. 3, no. 1, p. 263-269.
Daniel, J. F., 1976, Estimating ground- water evaporation from streamflow records: Water Resources Research, v. 12, no. 3, p. 360-264.
Englund, K. J., 1971, Displacement of the Pocahontas Formation by the Russell Fork fault, southwest Virginia: U.S. Geological Survey Professional Paper 750-B, p. B13- B16.
Epps, S. R., 1978, Buchanan County groundwater: Virginia State Water Control Board Planning Bulletin No. 311.
Ferris, J. G., and Knowles, D. B. 1954, Slug test for estimating transmissibility: U.S. Geological Survey Ground Water Note 26.
Ferris, J. G., Knowles, D. B., Brown, R. H., and Stallman, R. W., 1962, Theory of aquifer tests: U.S. Geological Survey Water-Supply Paper 1536-E, p. 69-174.
Hall, F. R., 1968, Baseflow recession review: Water Resources Re search, 4, p. 973-983.
Hely, A. G., and Olmsted, F. H.,1963, Some relation between streamflow characteristics and the environment in the Delaware River region: U.S. Geological Survey Professional Paper 417-B,
B1-B25.
Jacob, C.E., 1943, Correlation of ground-water levels and precipi tation on Long Island, New York: American Geophysical Union Trans actions, v. 24, pp. 564-573.
Lohman, S. W., 1979, Groundwater hy draulics: U.S. Geological Survey Professional Paper 708
Meissner, C. R., Jr., 1978, Geologic map of the Duty quadrangle, Dicken- soa, Russell and Buchanan counties, Virginia: U.S. Geological Survey Geologic Quadrangle Map GQ-1458, scale 1:24000.
Miller , R.L., and Meissner, C.R., Jr.,1977, Geologic map of the Big A Mountain quadrangle, Buchanan and Russell Counties, Virginia: U.S. Geological Survey Geologic Quadrangle Map GQ-1350, scale 1:24000.
Riggs, H. C., 1964, The base-flow recession curve as an indicator of ground water: International Association of Scientific Hy drology Publication 63, p. 352- 363.
62

8.0 SELECTED REFERENCES (continued)
____, 1968a, Some statistical tools in hydrology: U.S. Geological Survey Techniques of Water- Resources Investigations book 4, Chap. Al, 39 p.
______, 1973, Regional analysis of streamflow characteristics: U.S. Geological Survey Techniques of Water-Resources Investigations, Book 4, Chapter B3, 15 p.
Rogers, S. M. and Powell, J. D., 1983, Quality of ground water in southern Buchanan County, Virginia: U.S. Geological Survey Water-Resources Investigation 82-4022, 36 p.
Rorbaugh, M. I., 1960, Use of water levels in estimating aquifer con stants: International Association of Scientific Hydrology, Publi cation 52, p. 314-323.
_____, 1964, Estimating changes in bank storage and ground-water con tribution to streamflow: Inter national Association of Scientific Hydrology, Publication 63, p. 432- 441.
_____, and Simons, W.D., 1966, Ex ploration of methods of relating ground water to surface water, Columbia River basin-second phase: U.S. Geological Survey Open-File Report, 62 p.
Searcy, James K., 1959, Flow-duration curves: U.S. Geological Survey Water Supply Paper 1542-A.
Stallman, R. W., 1963, Electric ana log of three dimensional flow to wells and its application to un- confined aquifers: U.S. Geo logical Survey Water-Suppy Paper 1536 H, 38 p.
_____, 1965, Effects of water-table conditions on water-level changes near pumping wells: Water Re sources Research, v. 1, no. 2, p. 295-312.
* U.S. Government Printing Office: 1986 626-398
63