Embed Size (px)
Citation preview
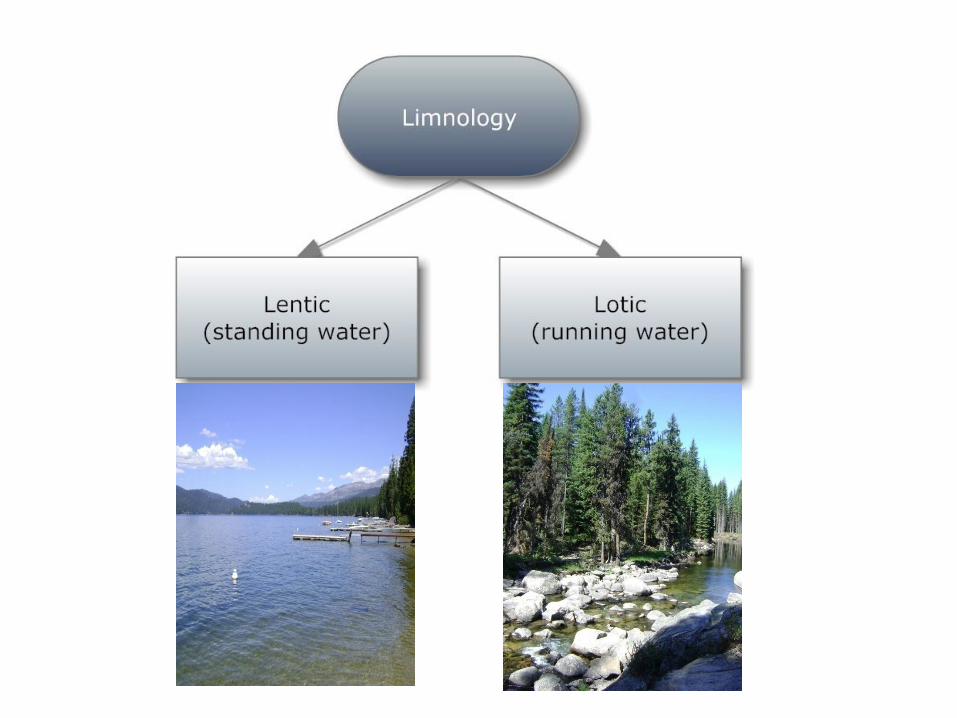
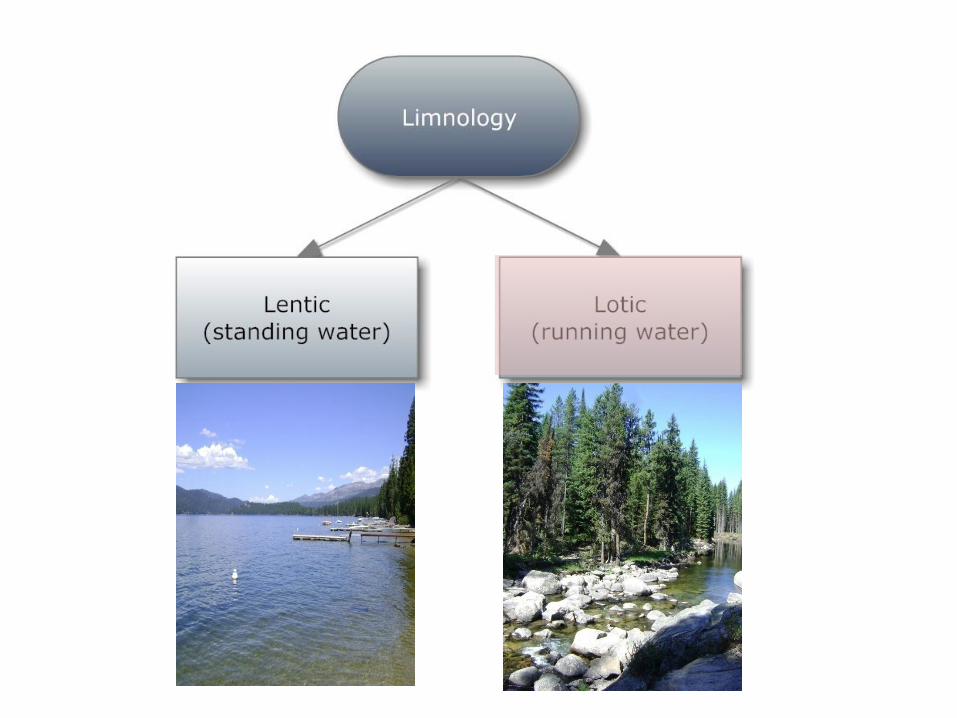
Hydrology and Limnology
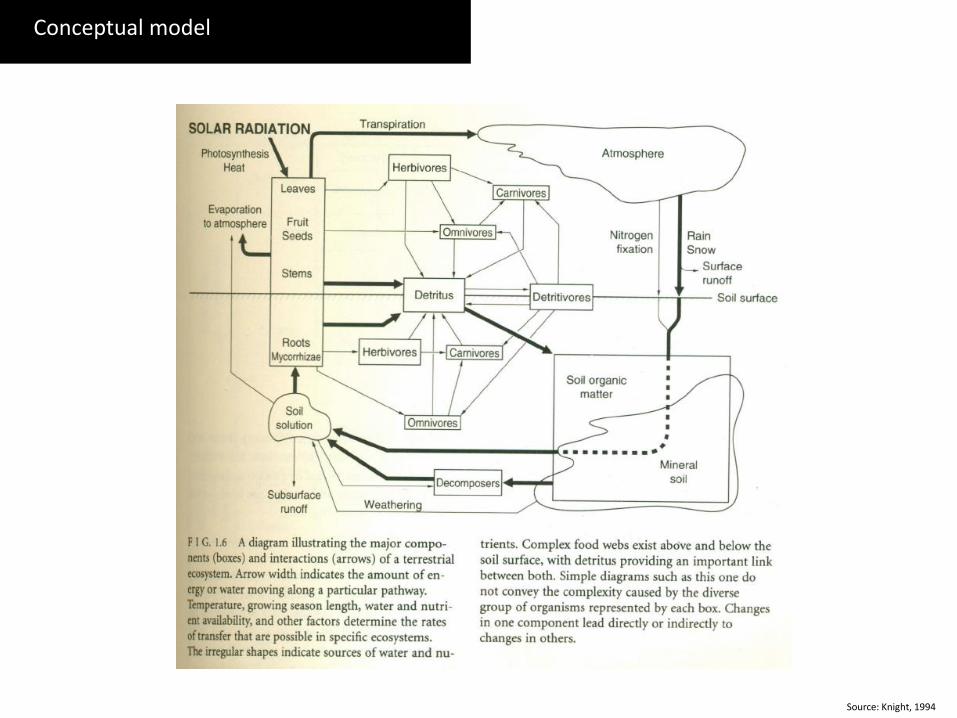
Conceptual model
Source: Knight, 1994
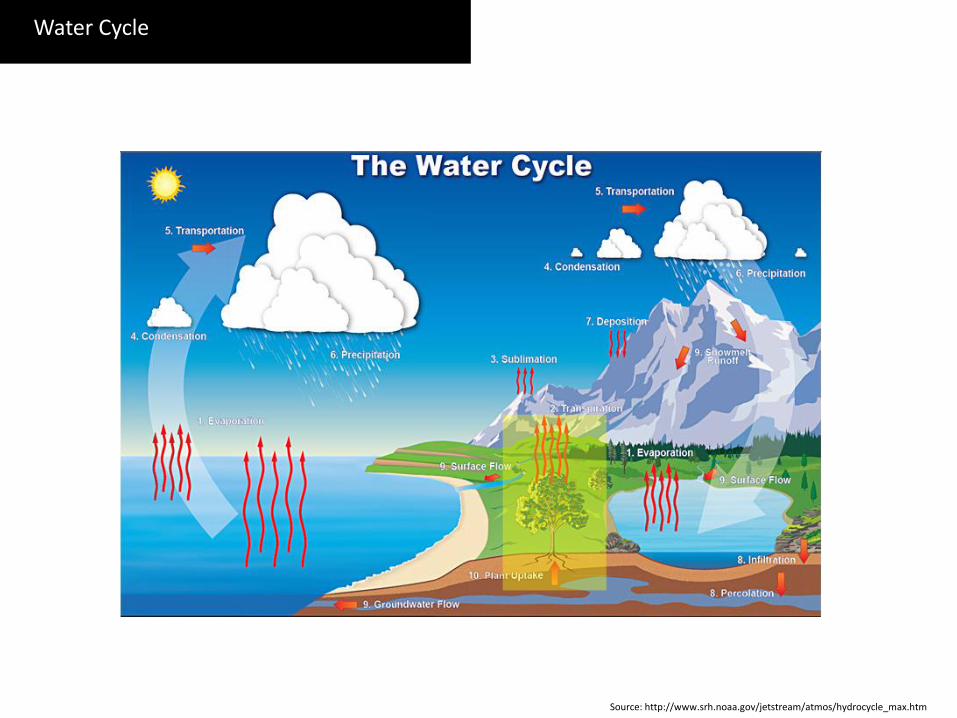
Source: http://www.srh.noaa.gov/jetstream/atmos/hydrocycle_max.htm
Water Cycle
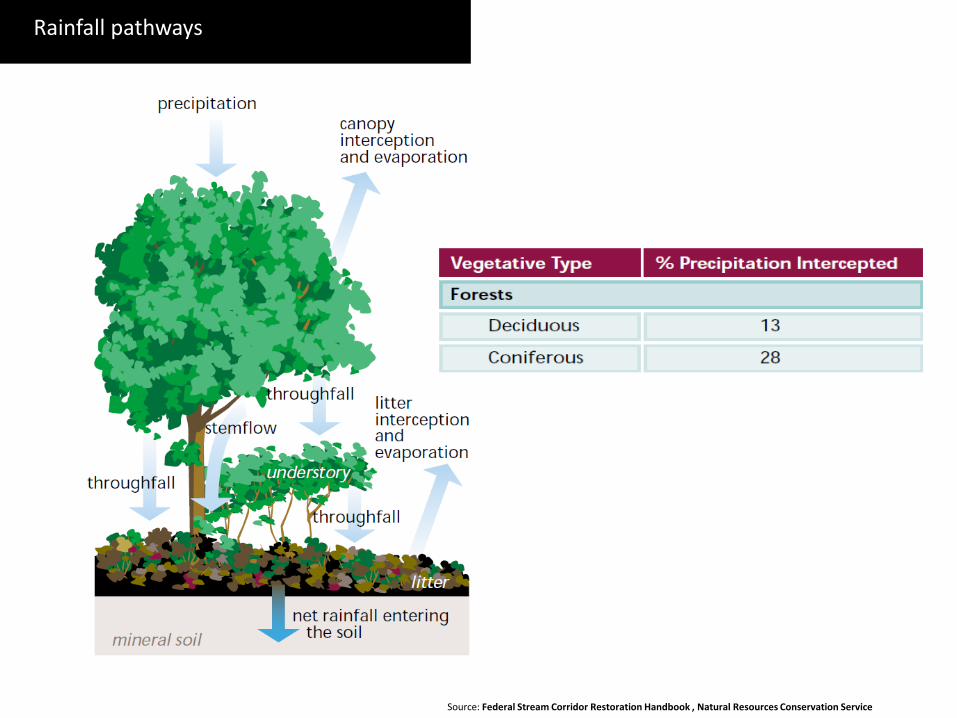
Rainfall pathways
Source: Federal Stream Corridor Restoration Handbook , Natural Resources Conservation Service
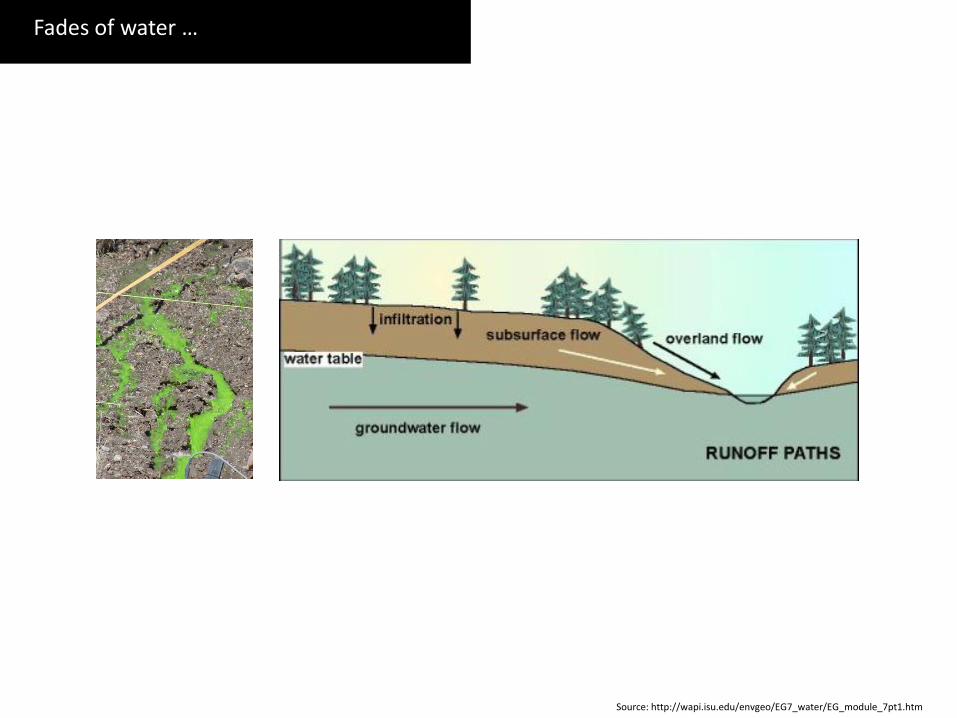
Source: http://wapi.isu.edu/envgeo/EG7_water/EG_module_7pt1.htm
Fades of water …

Chemical factors affecting biota
?
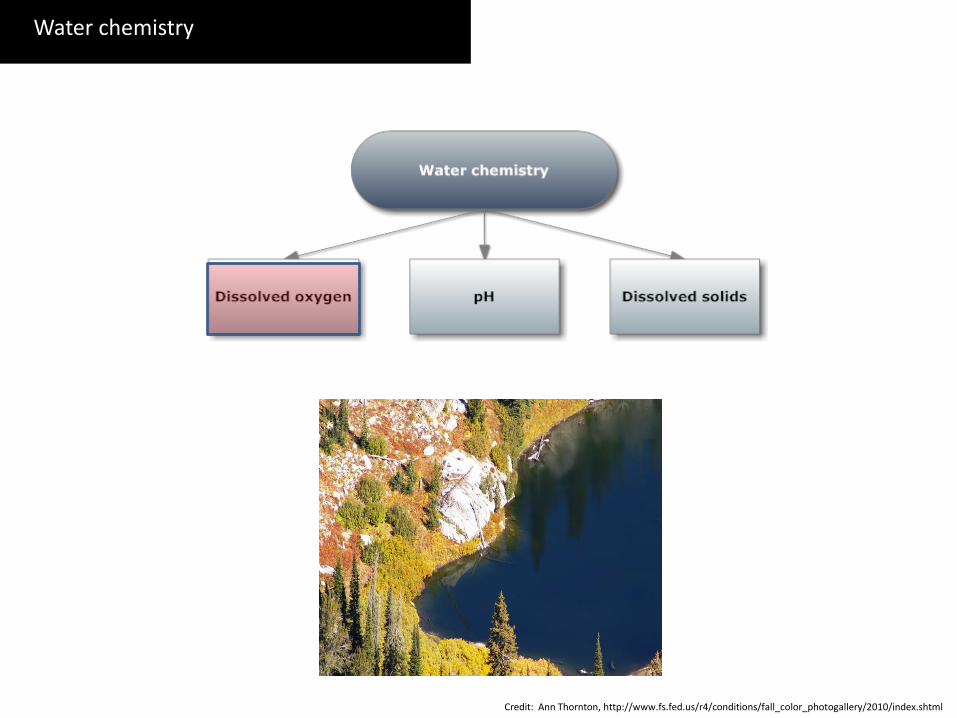
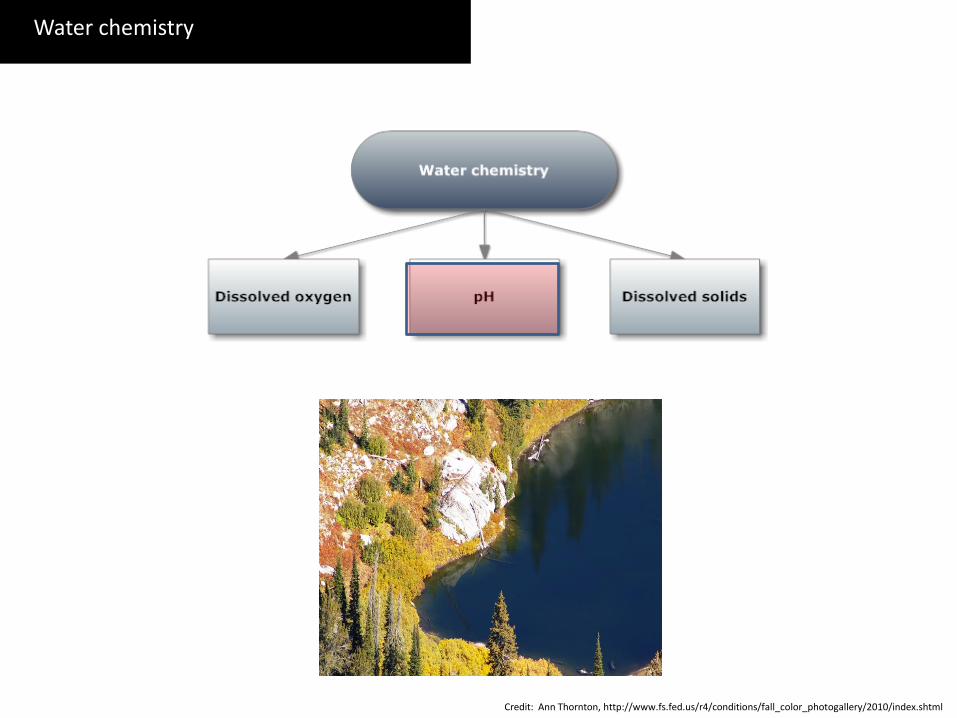
Water chemistry
Credit: Ann Thornton, http://www.fs.fed.us/r4/conditions/fall_color_photogallery/2010/index.shtml
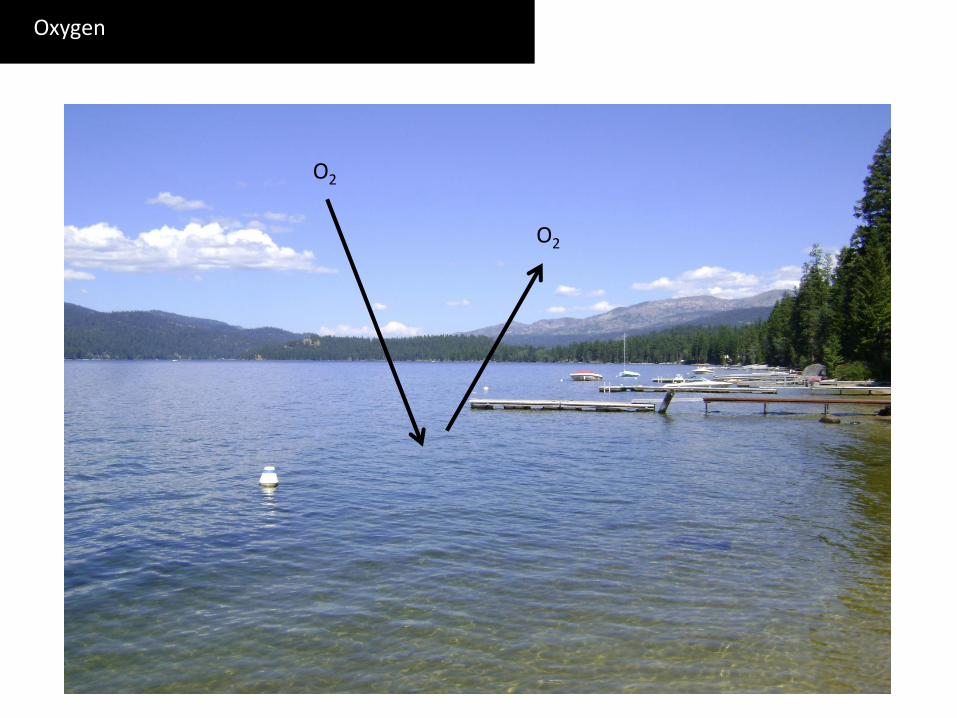
Oxygen
O2
O2
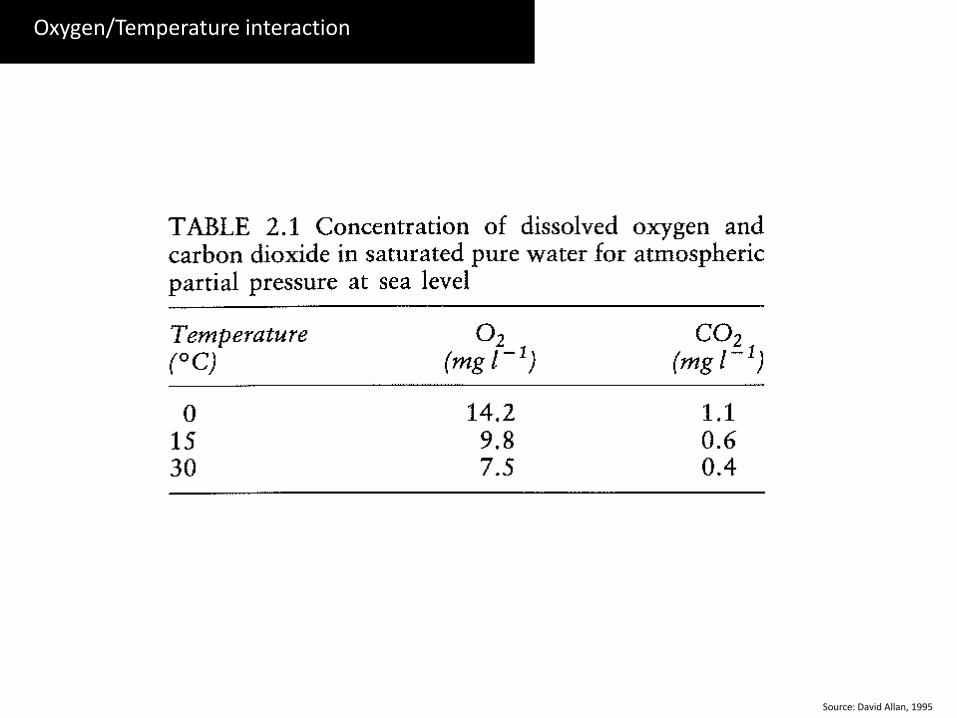
Oxygen/Temperature interaction
Source: David Allan, 1995
Source: http://www.water-research.net/Watershed/dissolvedoxygen.htm
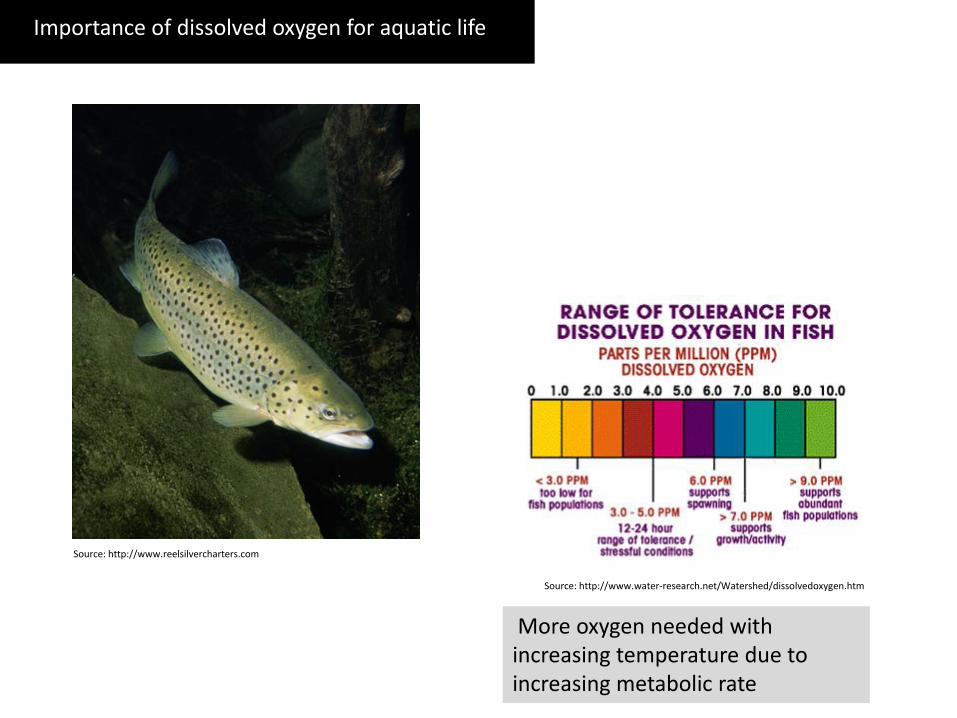
Importance of dissolved oxygen for aquatic life
Source: http://www.reelsilvercharters.com
More oxygen needed with increasing temperature due to increasing metabolic rate
Water chemistry
Credit: Ann Thornton, http://www.fs.fed.us/r4/conditions/fall_color_photogallery/2010/index.shtml
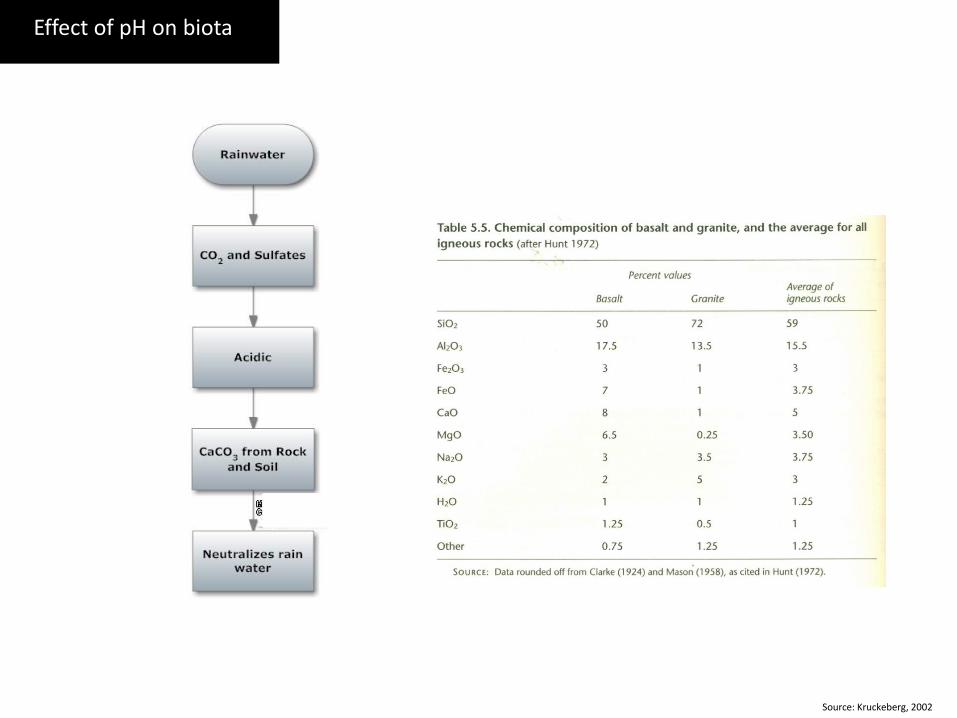
Source: Kruckeberg, 2002
Effect of pH on biota
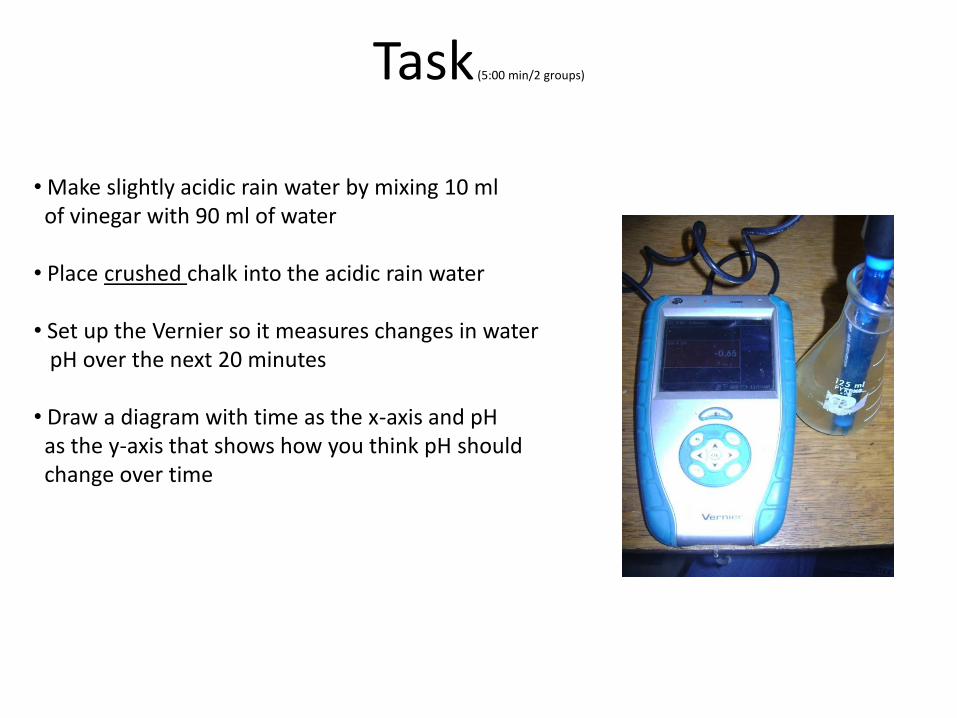
Task (5:00 min/2 groups)
• Make slightly acidic rain water by mixing 10 ml of vinegar with 90 ml of water • Place crushed chalk into the acidic rain water • Set up the Vernier so it measures changes in water pH over the next 20 minutes • Draw a diagram with time as the x-axis and pH as the y-axis that shows how you think pH should change over time
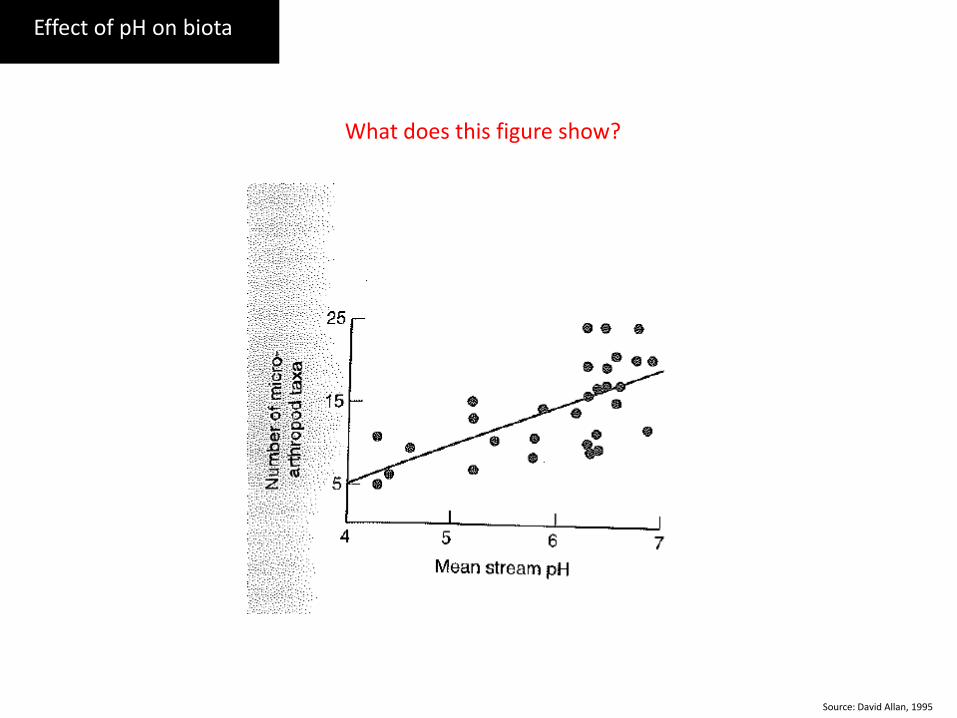
Effect of pH on biota
Source: David Allan, 1995
What does this figure show?
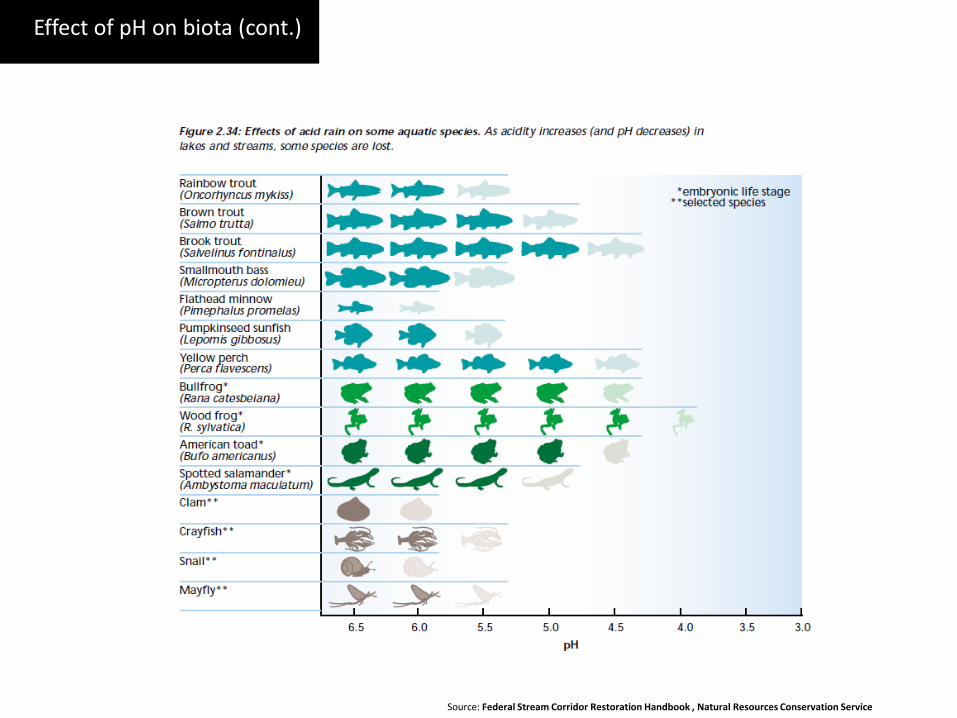
Effect of pH on biota (cont.)
Source: Federal Stream Corridor Restoration Handbook , Natural Resources Conservation Service
“Of course, the susceptibility of streams of a region to acidification depends greatly on geology and soils.” Explain this statement to a kid.
Task (5:00 min/each)
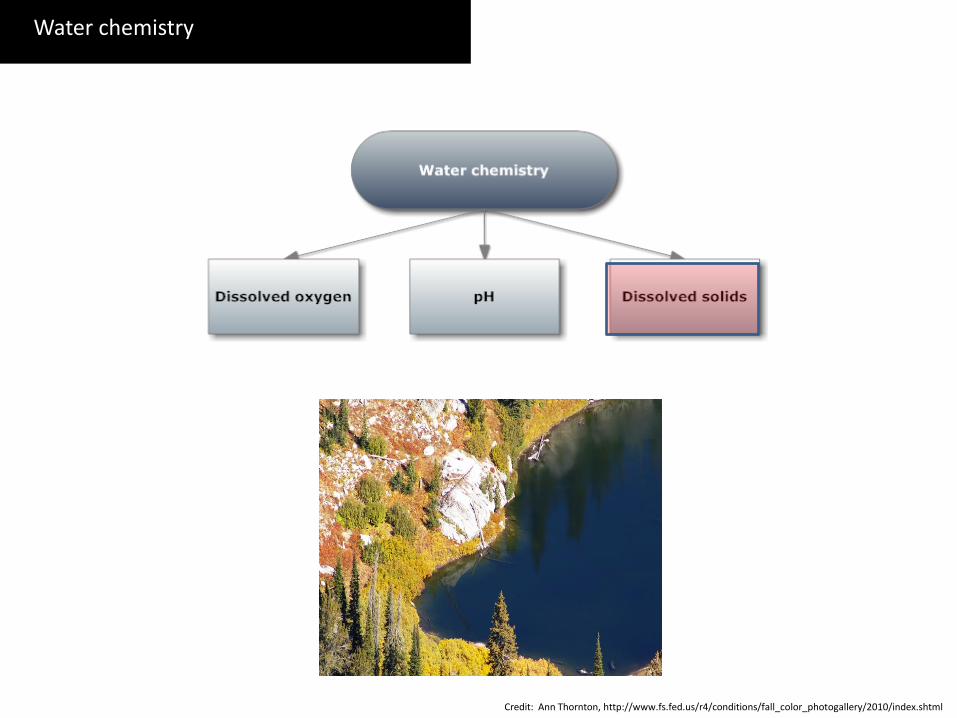
Water chemistry
Credit: Ann Thornton, http://www.fs.fed.us/r4/conditions/fall_color_photogallery/2010/index.shtml
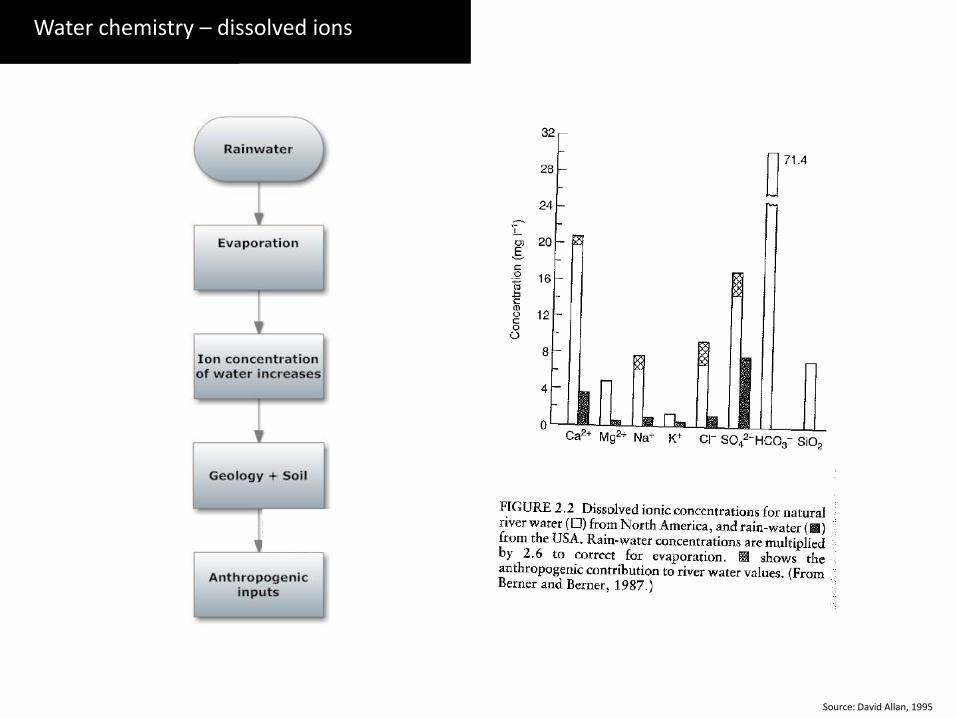
Water chemistry Water chemistry – dissolved ions
Source: David Allan, 1995
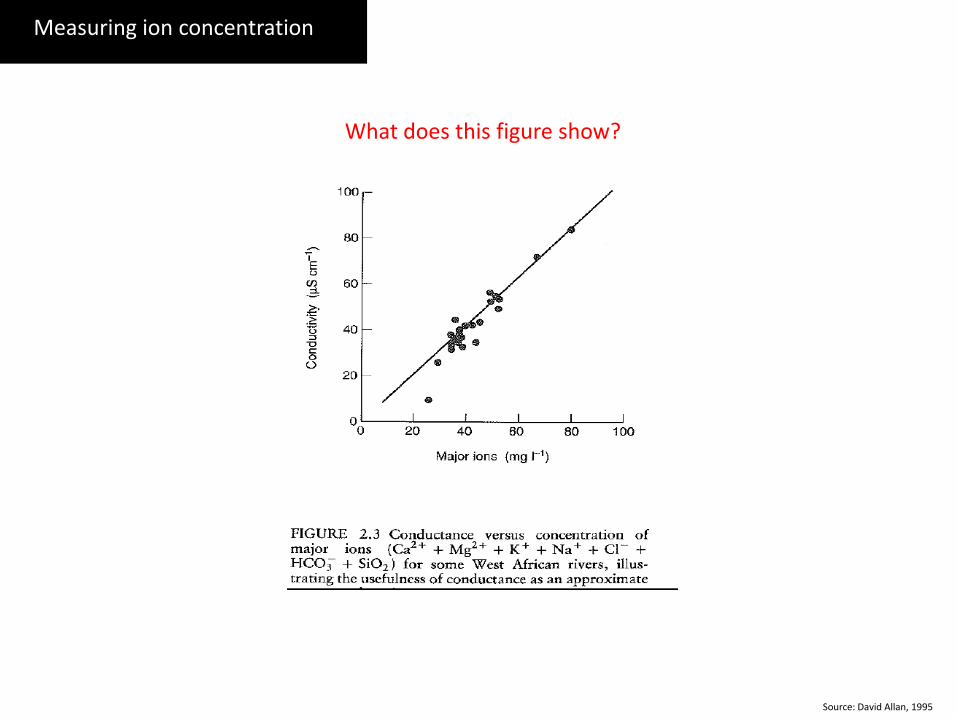
Measuring ion concentration
Source: David Allan, 1995
What does this figure show?
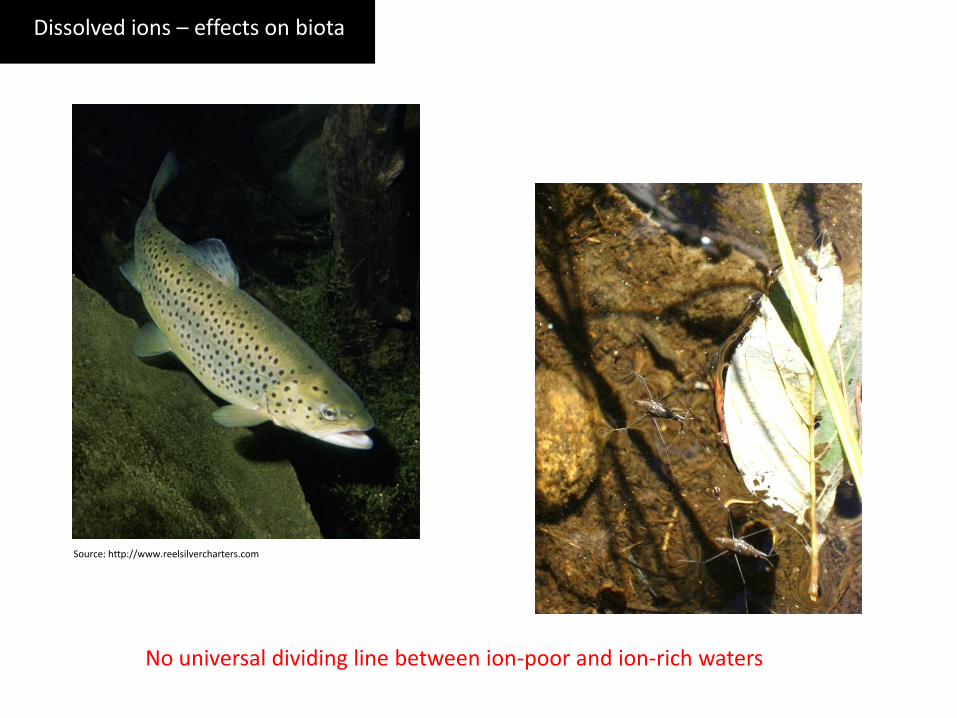
Dissolved ions – effects on biota
Source: http://www.reelsilvercharters.com
No universal dividing line between ion-poor and ion-rich waters
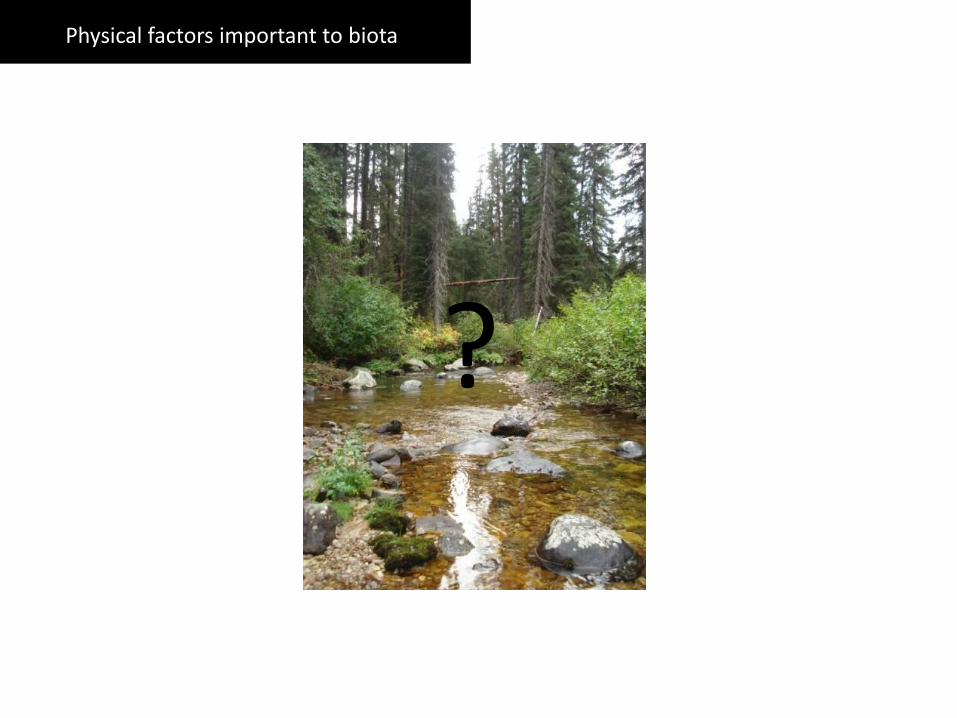
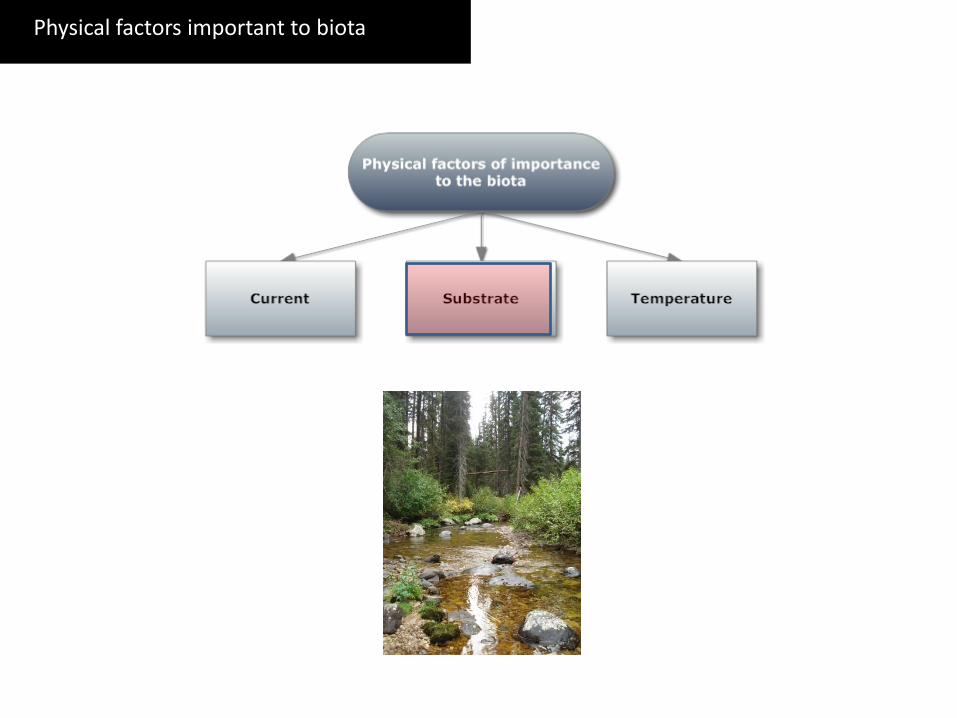
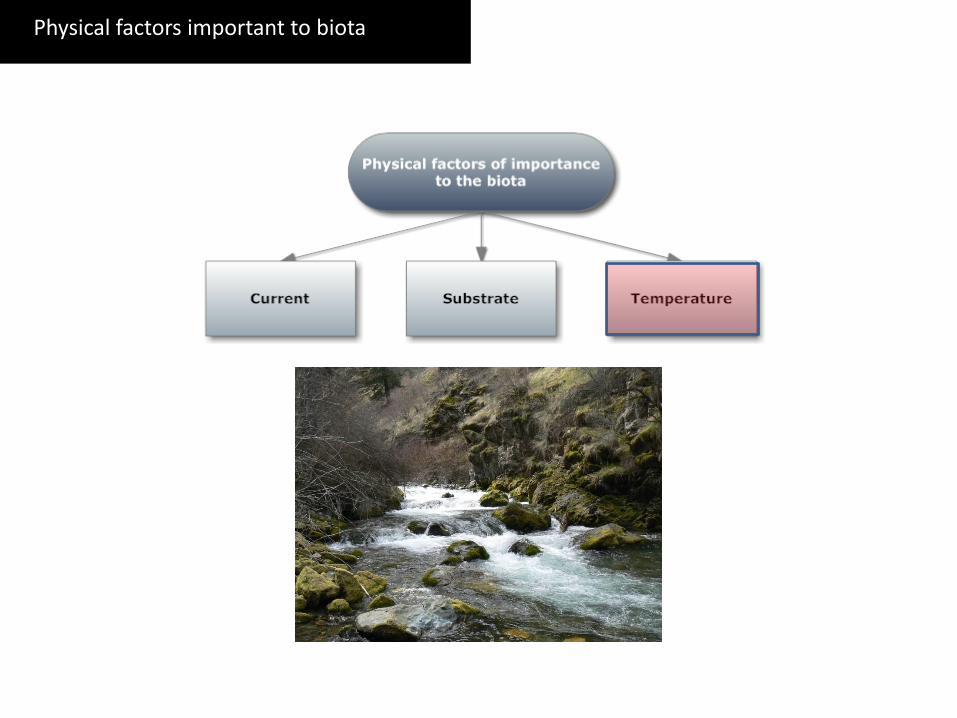
Physical factors important to biota
?
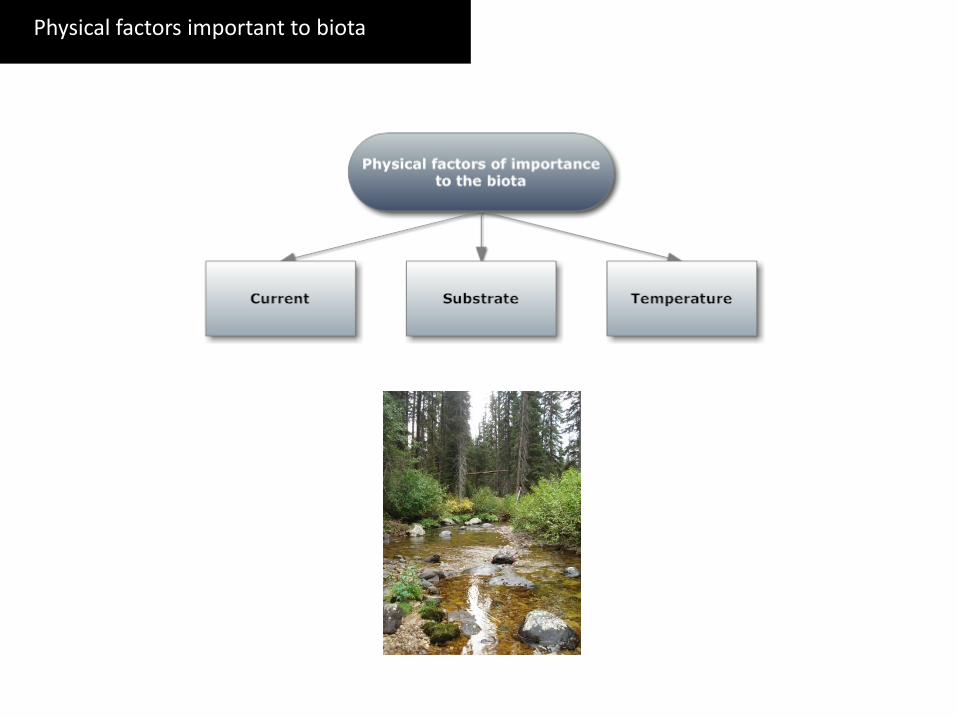
Physical factors important to biota
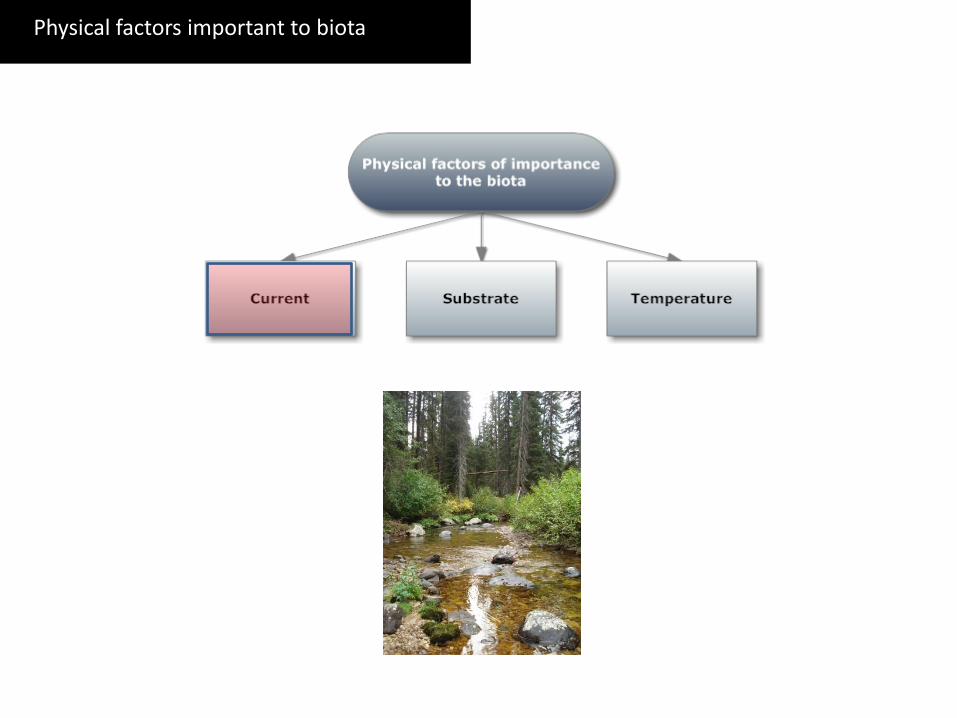
Physical factors important to biota
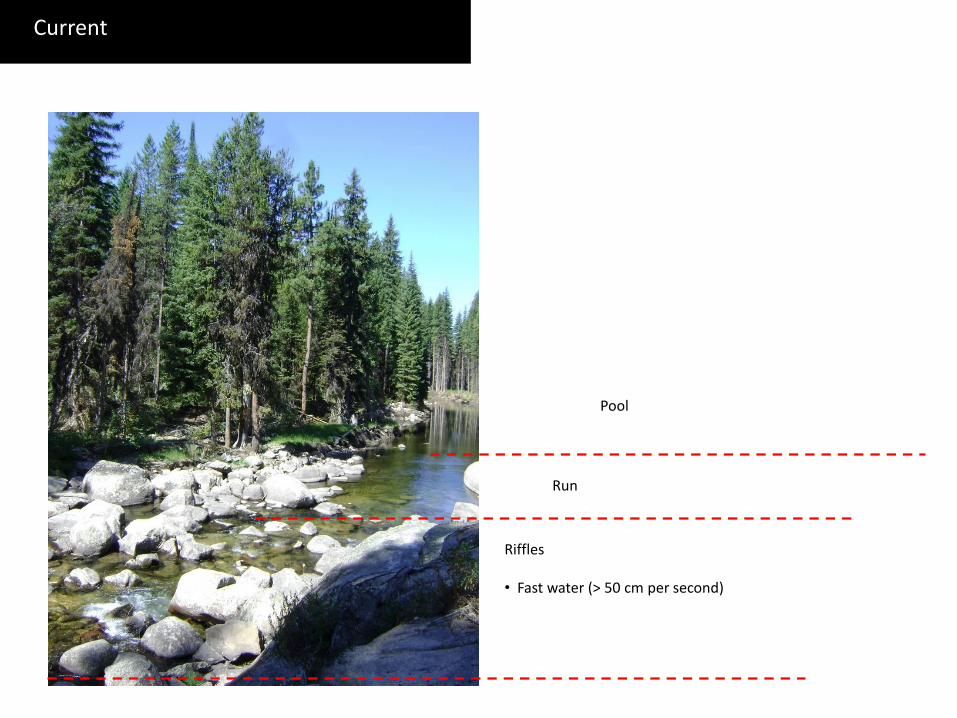
Current
Riffles • Fast water (> 50 cm per second)
Pool
Run
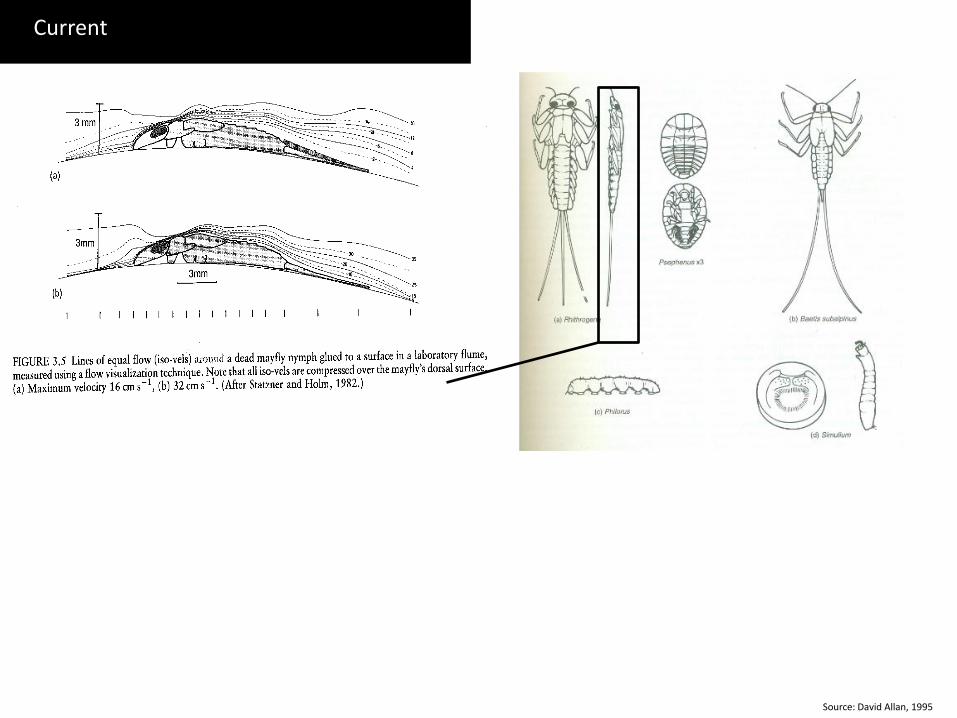
Current
Source: David Allan, 1995
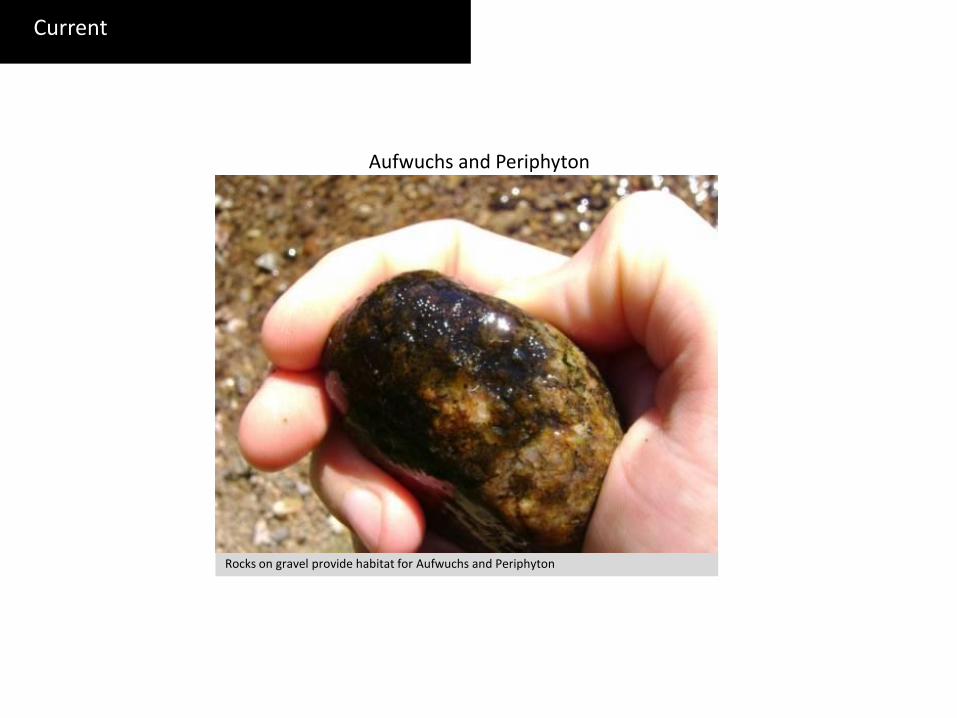
Current
Rocks on gravel provide habitat for Aufwuchs and Periphyton
Aufwuchs and Periphyton
Physical factors important to biota
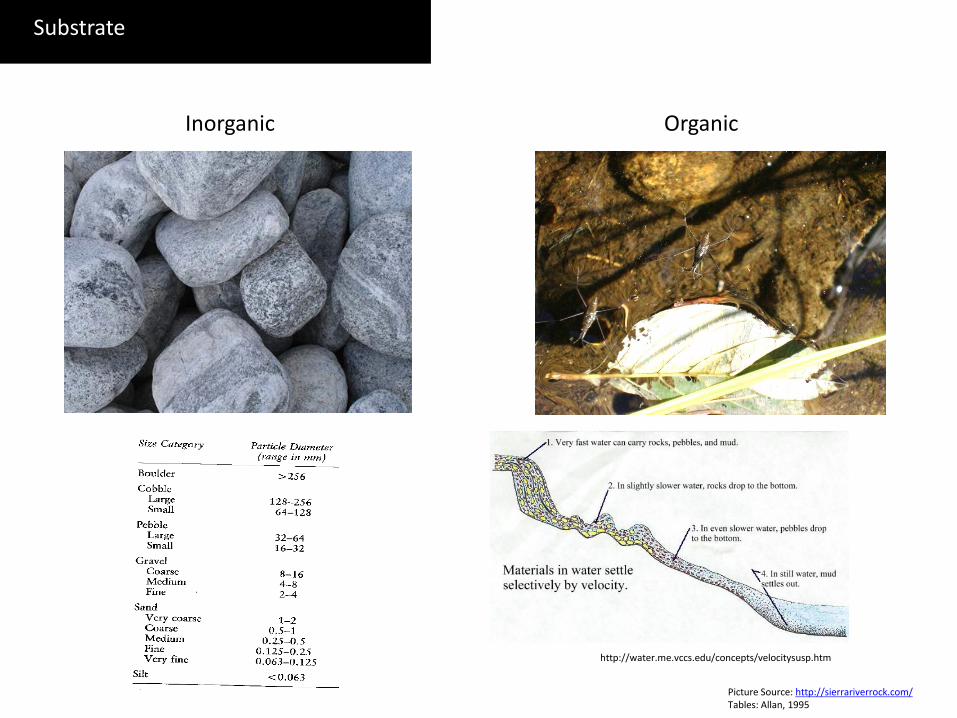
Substrate
Picture Source: http://sierrariverrock.com/ Tables: Allan, 1995
Inorganic Organic
http://water.me.vccs.edu/concepts/velocitysusp.htm

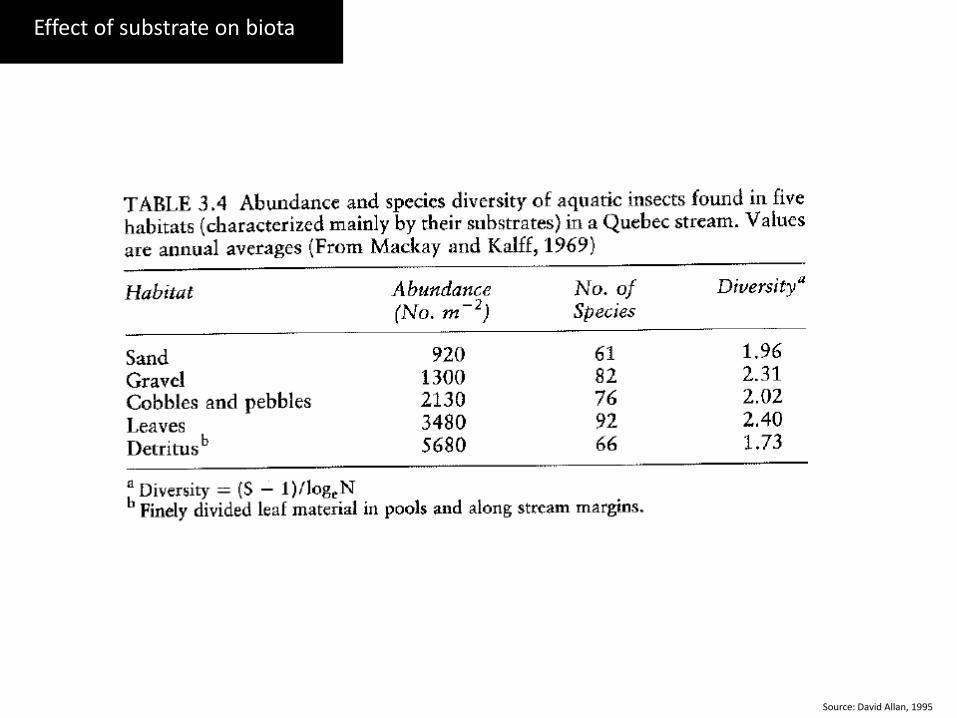
Effect of substrate on biota
Source: David Allan, 1995
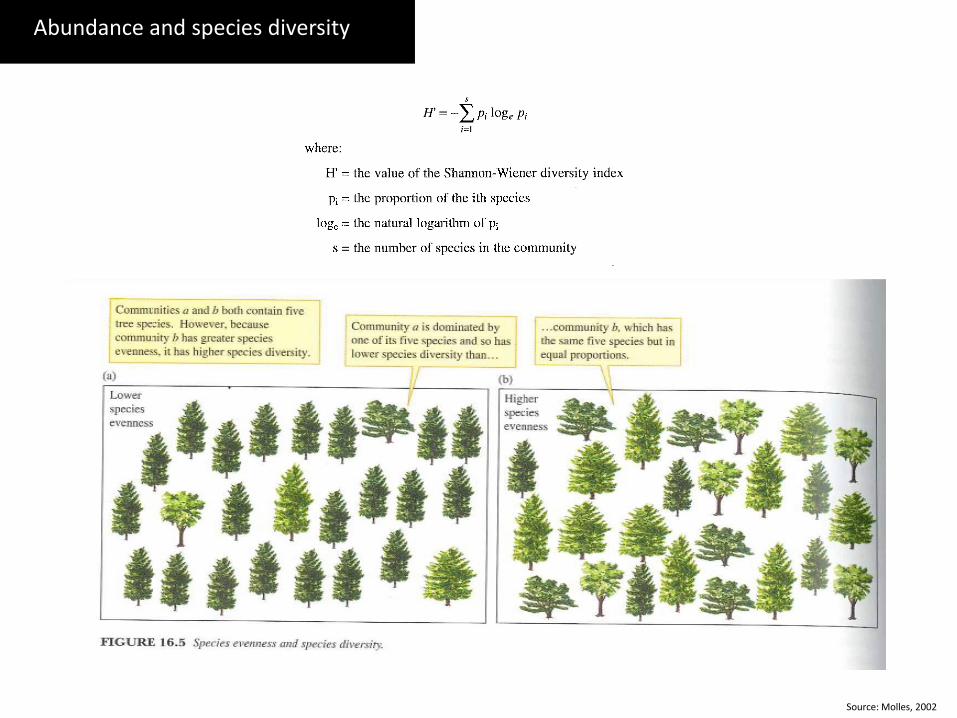
Abundance and species diversity
Source: Molles, 2002
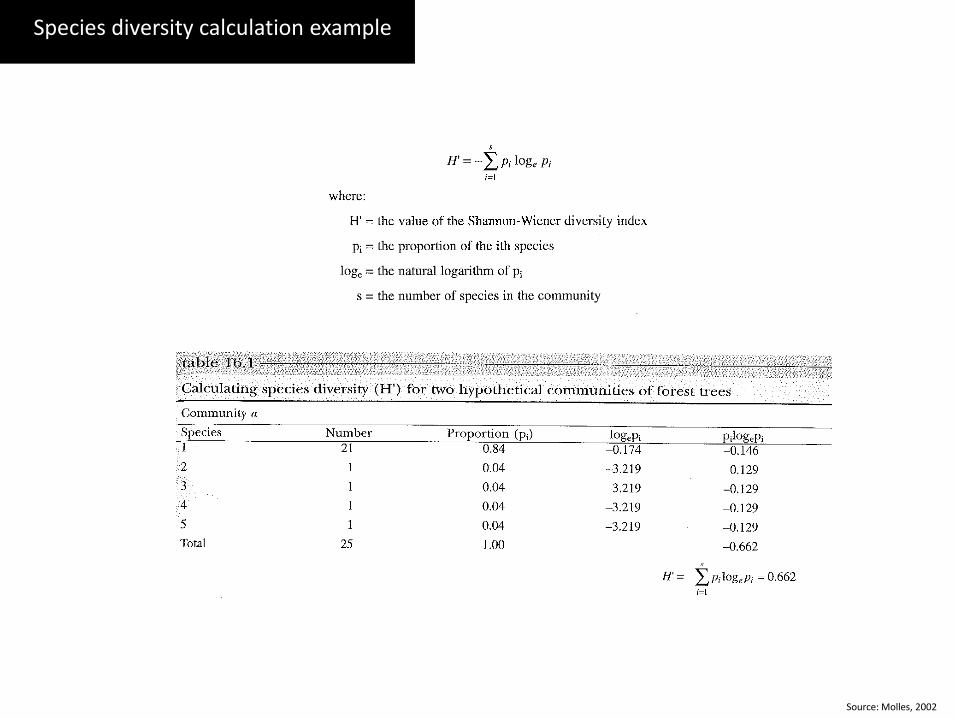
Species diversity calculation example
Source: Molles, 2002
Effect of substrate on biota
Source: David Allan, 1995
Physical factors important to biota
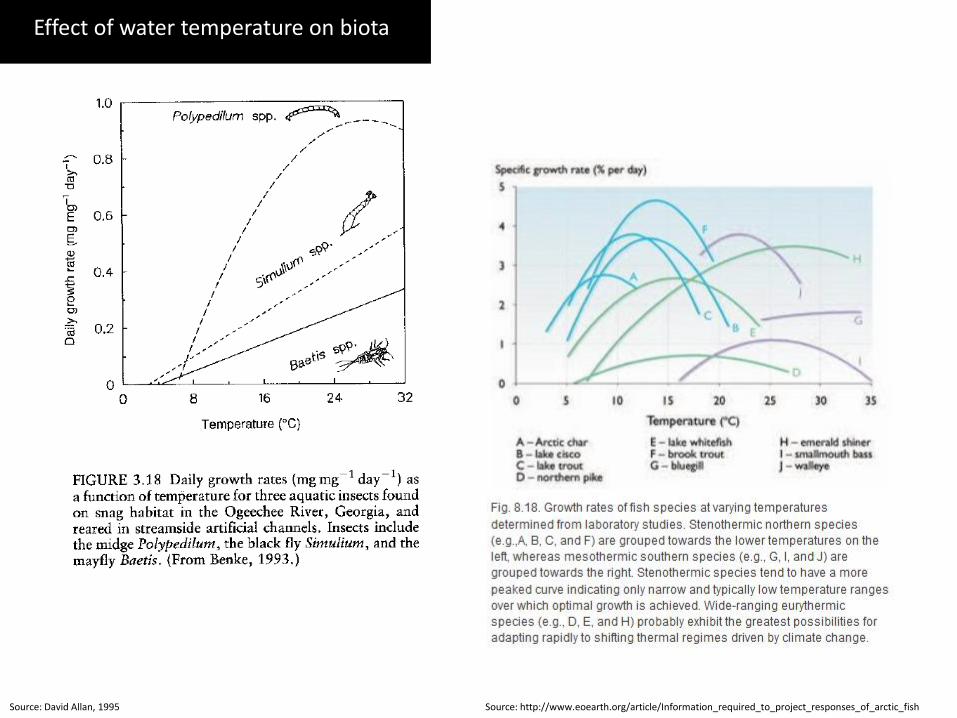
Effect of water temperature on biota
Source: David Allan, 1995 Source: http://www.eoearth.org/article/Information_required_to_project_responses_of_arctic_fish
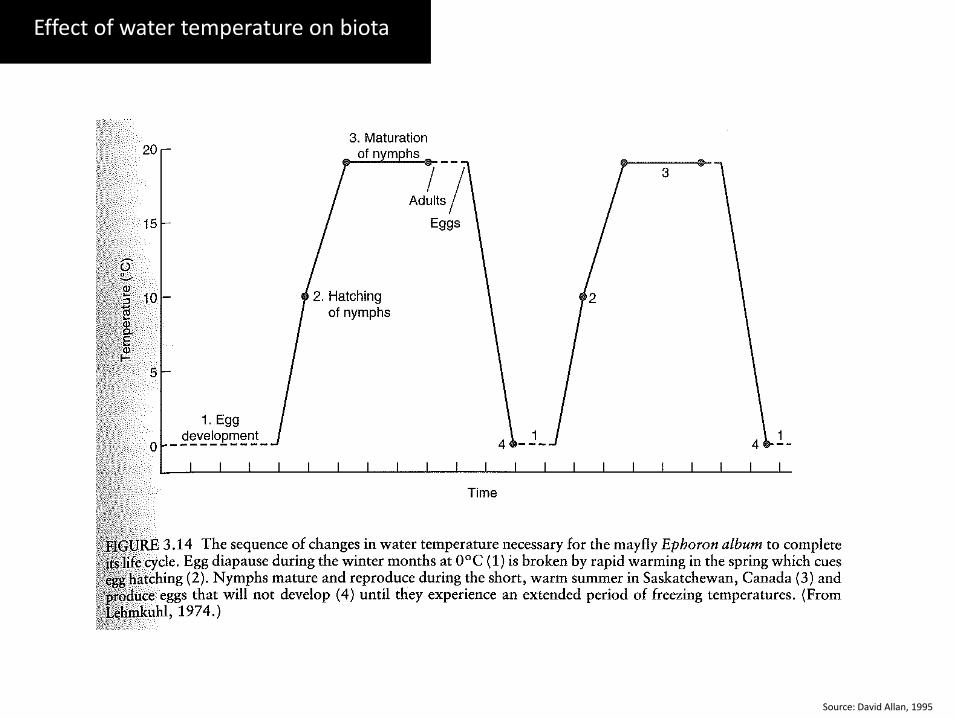
Effect of water temperature on biota
Source: David Allan, 1995
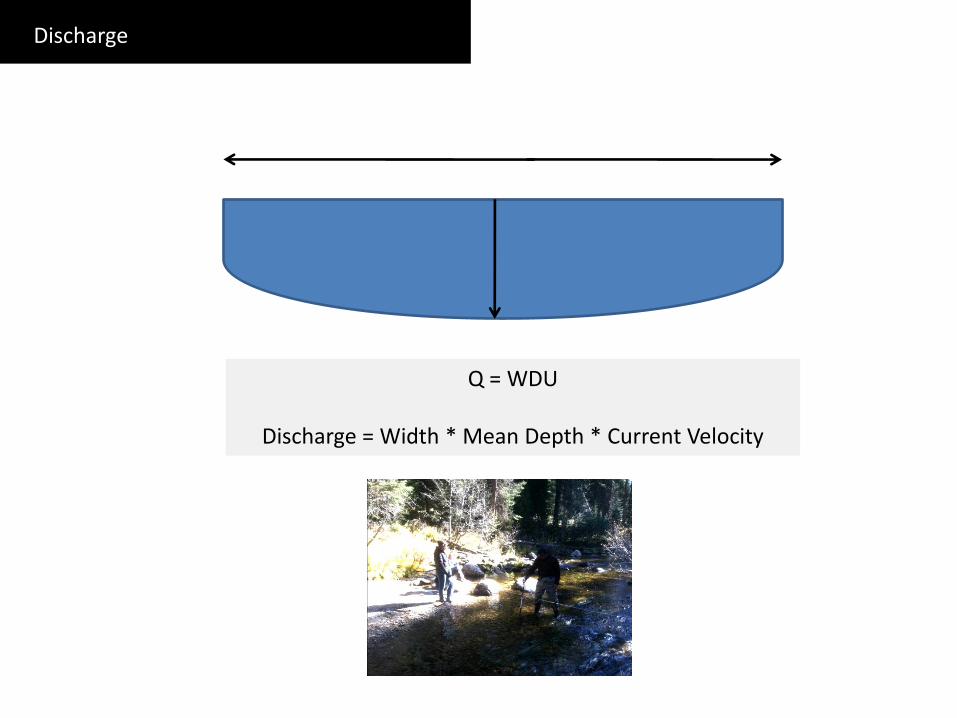
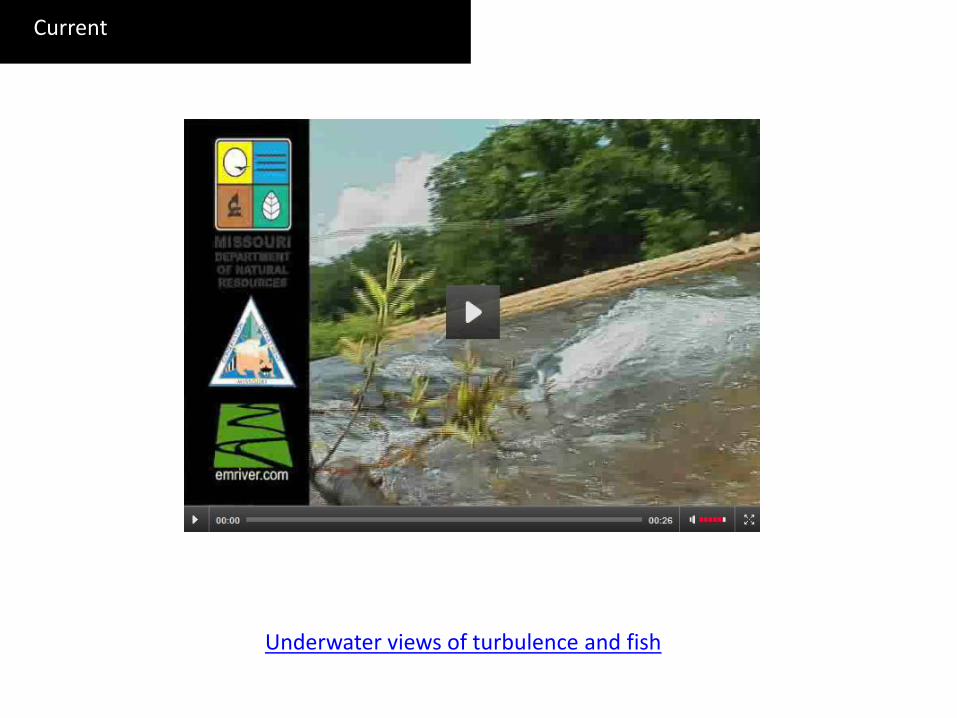
Discharge
Q = WDU
Discharge = Width * Mean Depth * Current Velocity
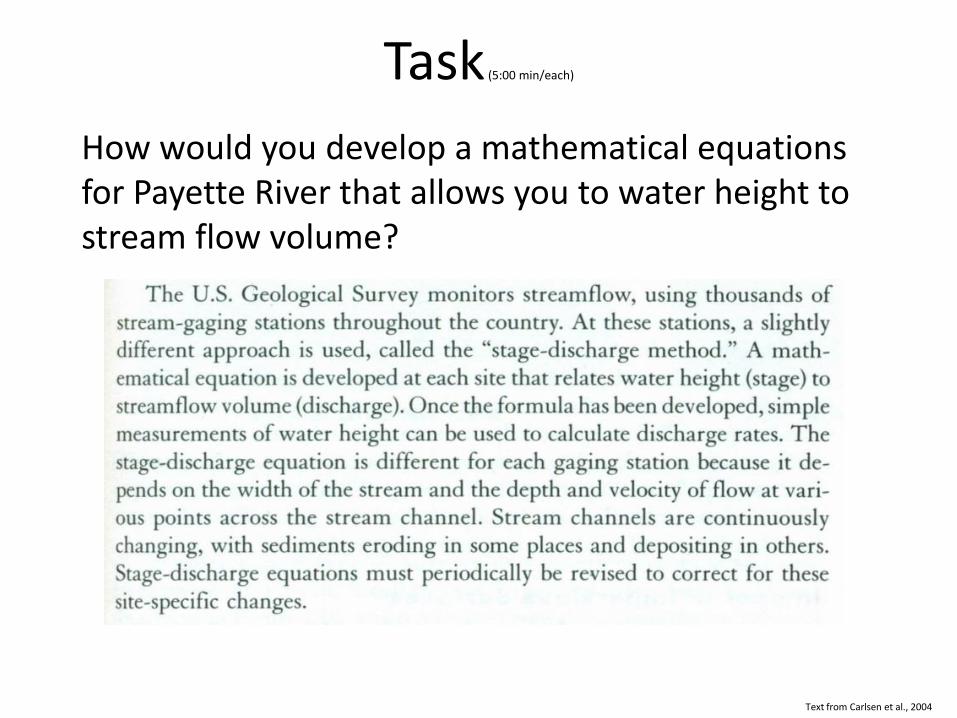
Task (5:00 min/each)
How would you develop a mathematical equations for Payette River that allows you to water height to stream flow volume?
Text from Carlsen et al., 2004
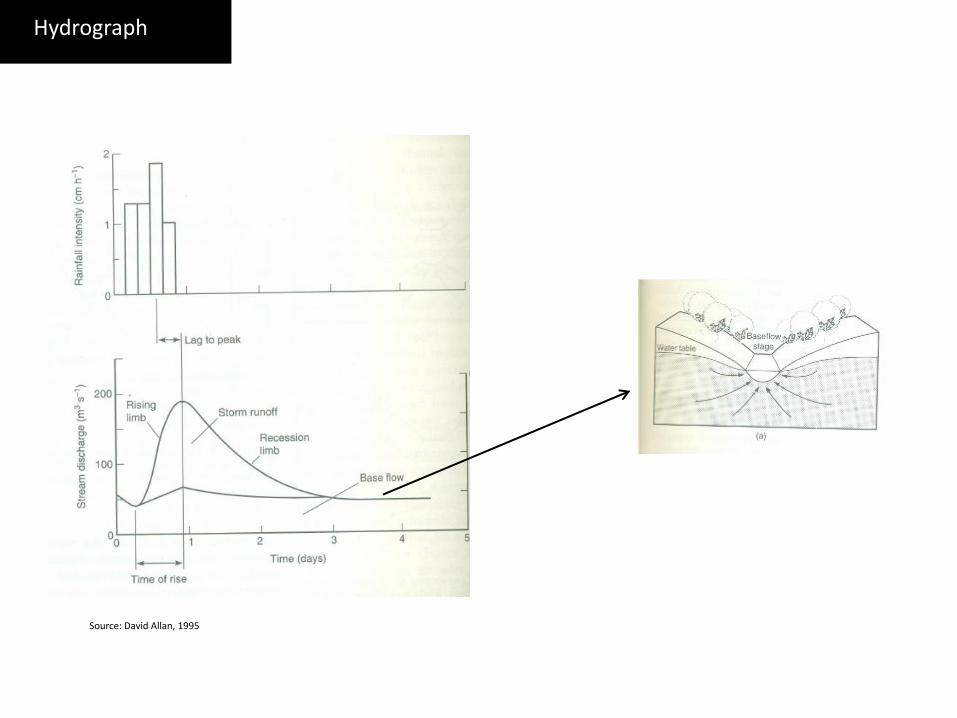
Hydrograph
Source: David Allan, 1995
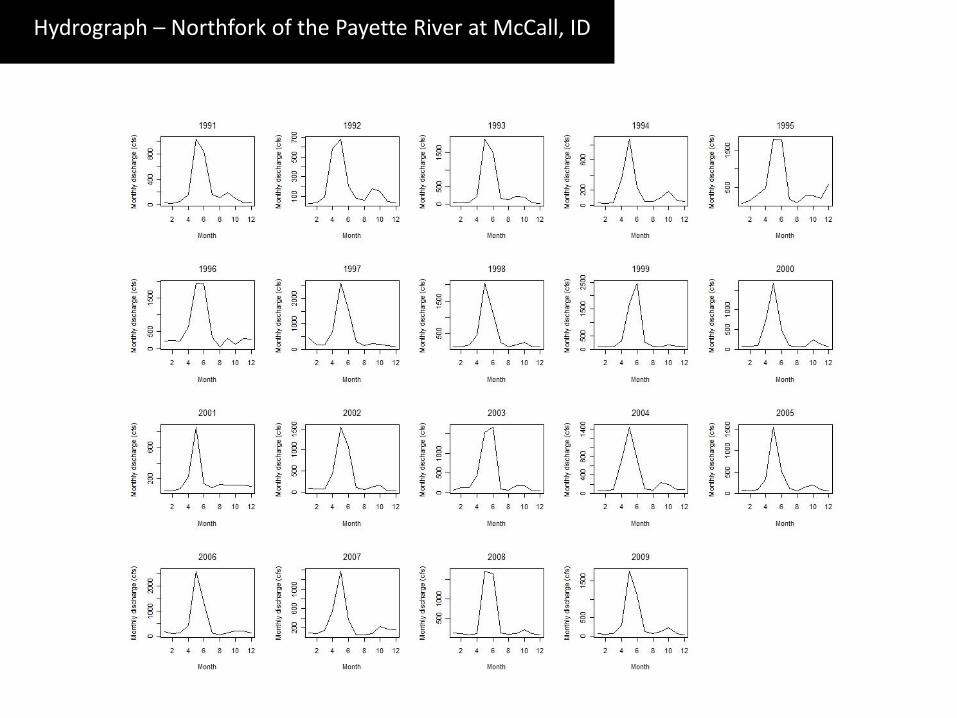
Hydrograph – Northfork of the Payette River at McCall, ID
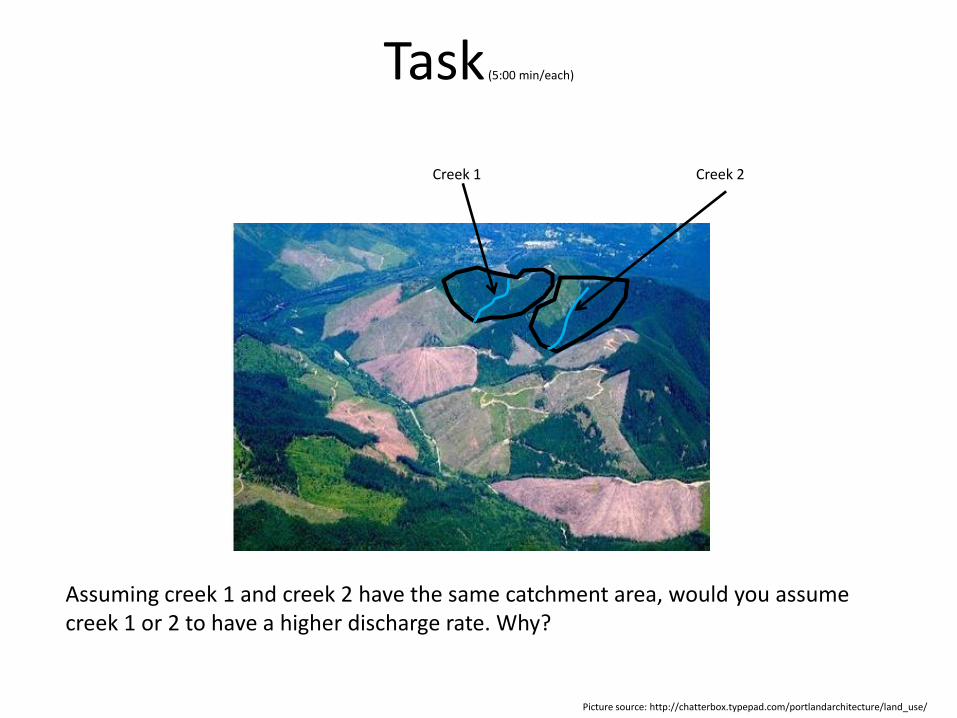
Creek 1 Creek 2
Assuming creek 1 and creek 2 have the same catchment area, would you assume creek 1 or 2 to have a higher discharge rate. Why?
Task (5:00 min/each)
Picture source: http://chatterbox.typepad.com/portlandarchitecture/land_use/
“The effect of evapotranspiration on water balance is illustrated by the following example – when an experimental forest in New Hempshire was clear cut and subsequent re-growth suppressed with herbicides, stream runoff increased by 40% on an annual basis, 400% during the summer” (Likens, 1984 in David Allan).
Task (Solution)
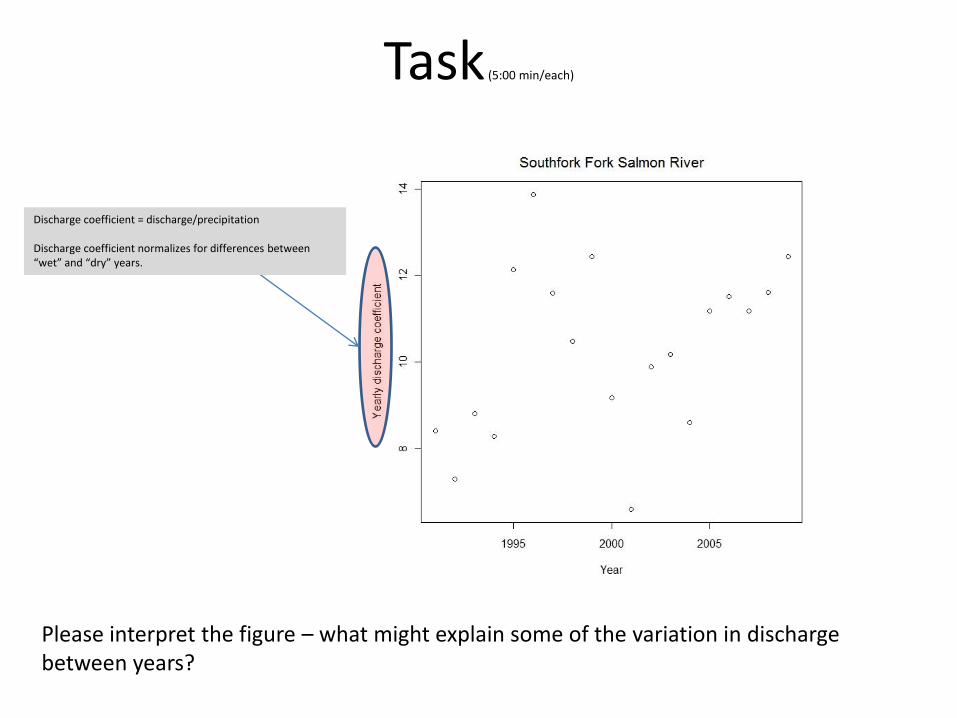
Task (5:00 min/each)
Please interpret the figure – what might explain some of the variation in discharge between years?
Discharge coefficient = discharge/precipitation Discharge coefficient normalizes for differences between “wet” and “dry” years.
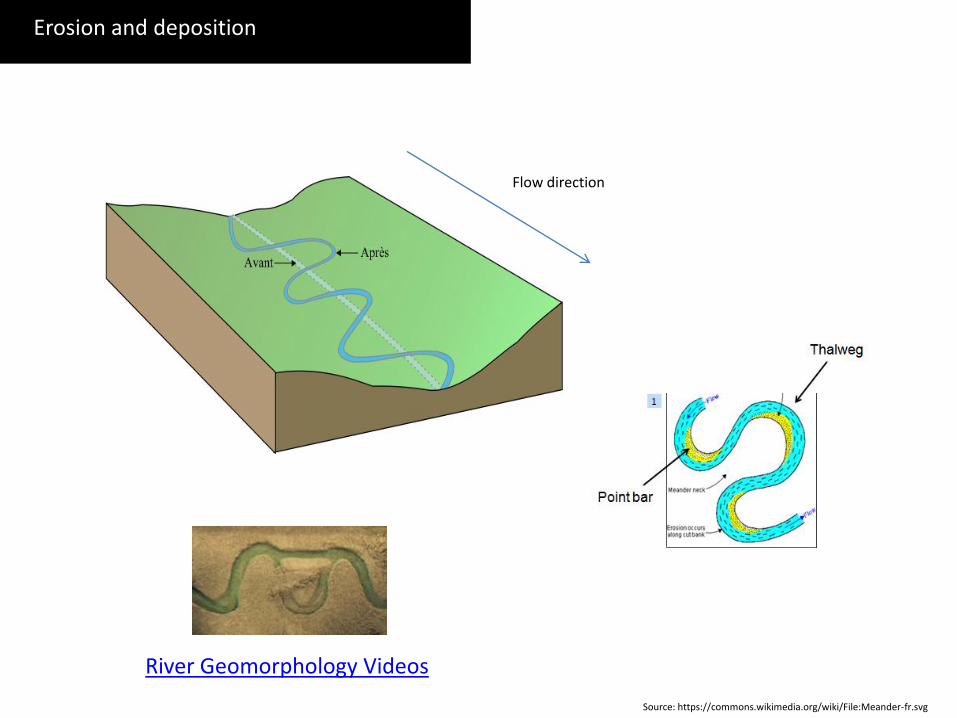
Erosion and deposition
Flow direction
Source: https://commons.wikimedia.org/wiki/File:Meander-fr.svg
River Geomorphology Videos
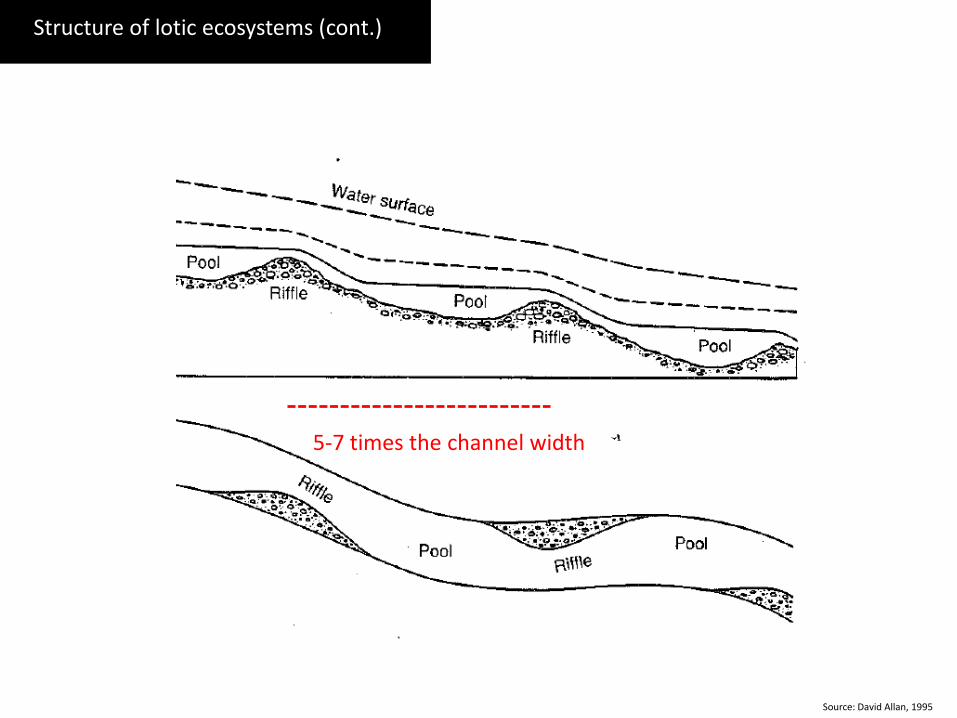
Structure of lotic ecosystems (cont.)
Source: David Allan, 1995
5-7 times the channel width
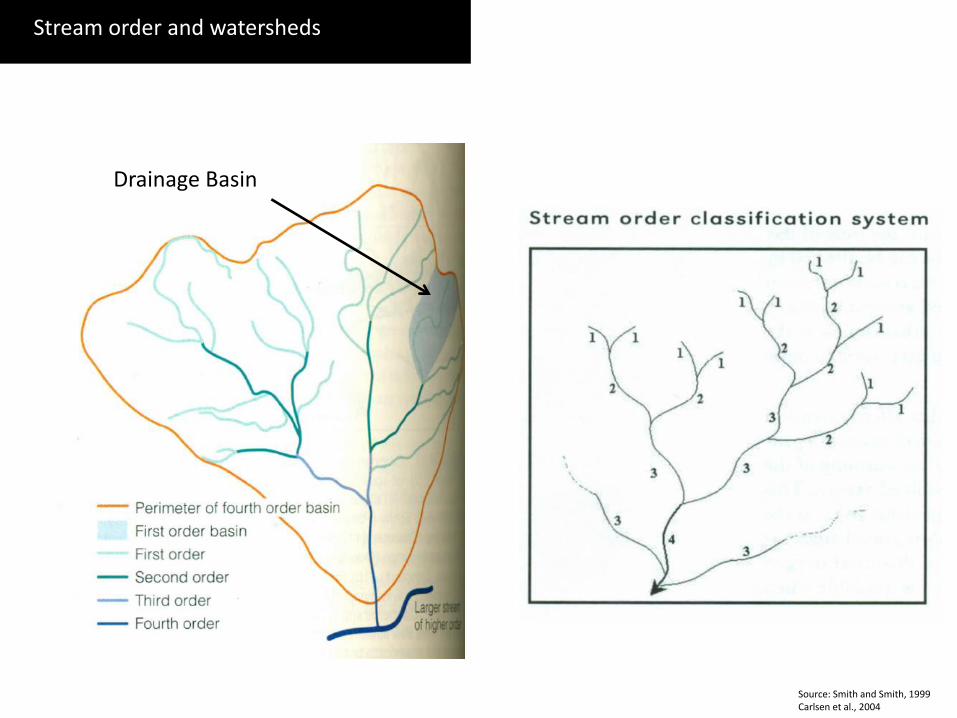
Stream order and watersheds
Source: Smith and Smith, 1999 Carlsen et al., 2004
Drainage Basin
Challenge/uniqueness of energy and nutrient cycling in streams?
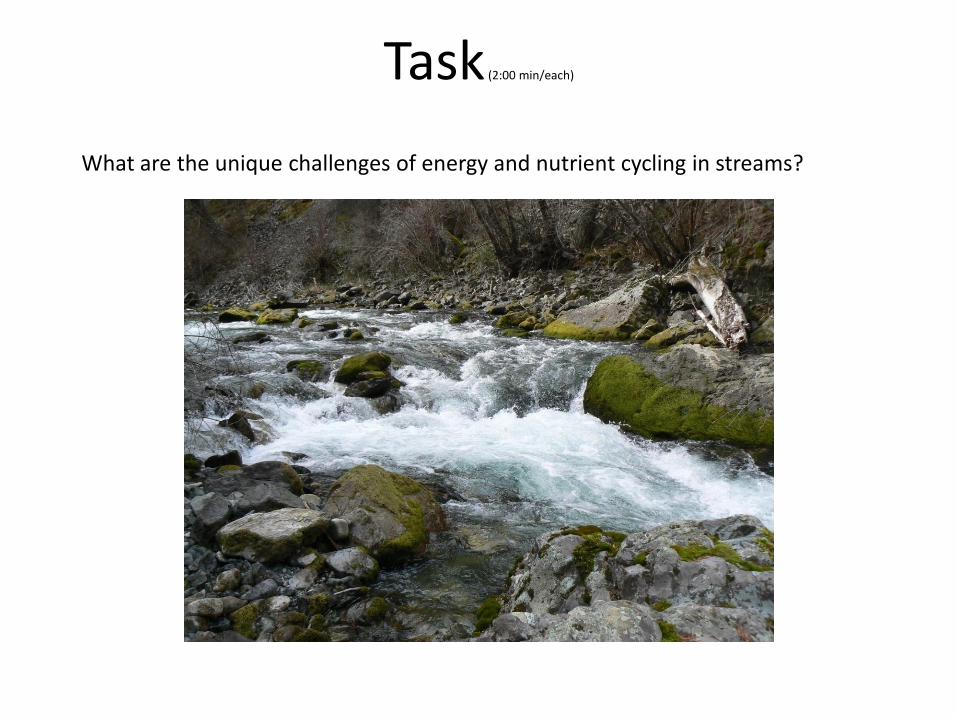
Task (2:00 min/each)
What are the unique challenges of energy and nutrient cycling in streams?
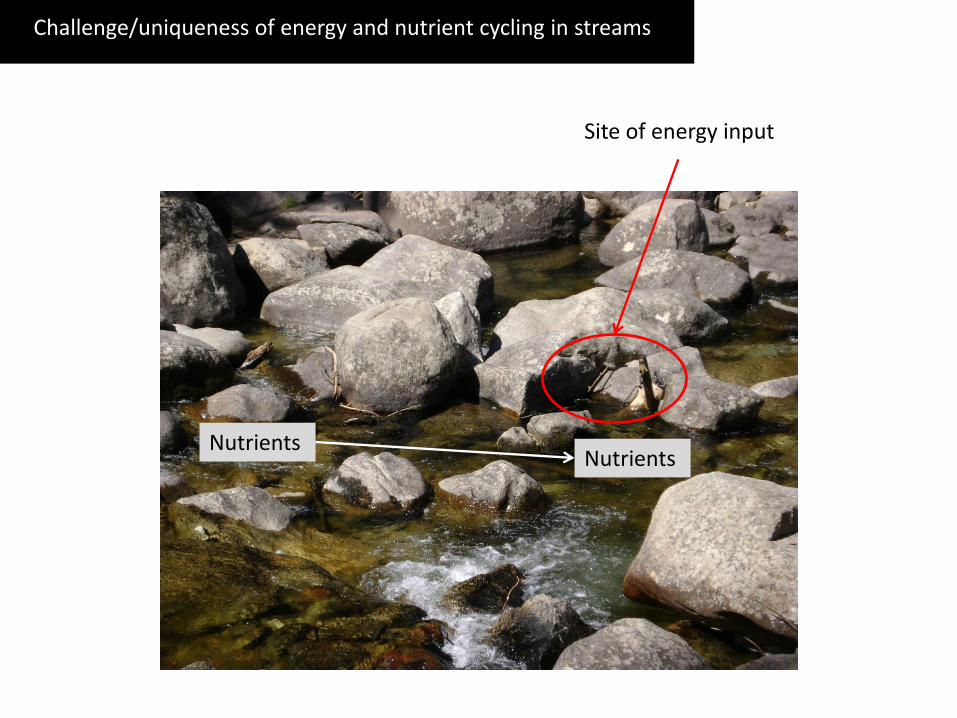
Challenge/uniqueness of energy and nutrient cycling in streams
Nutrients Nutrients
Site of energy input
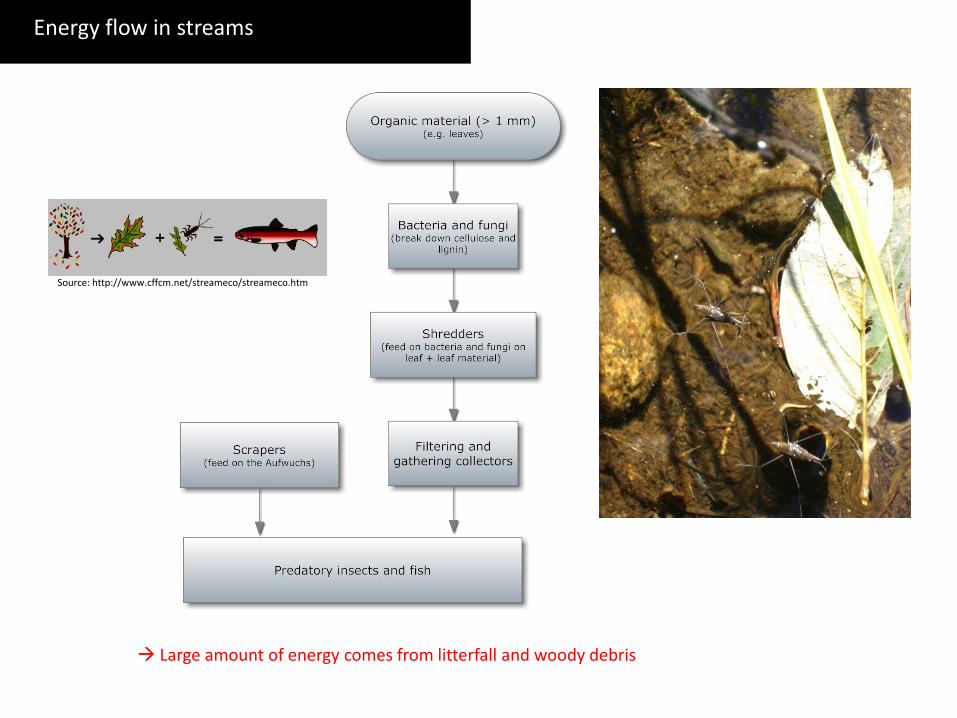
Energy flow in streams
Large amount of energy comes from litterfall and woody debris
Source: http://www.cffcm.net/streameco/streameco.htm
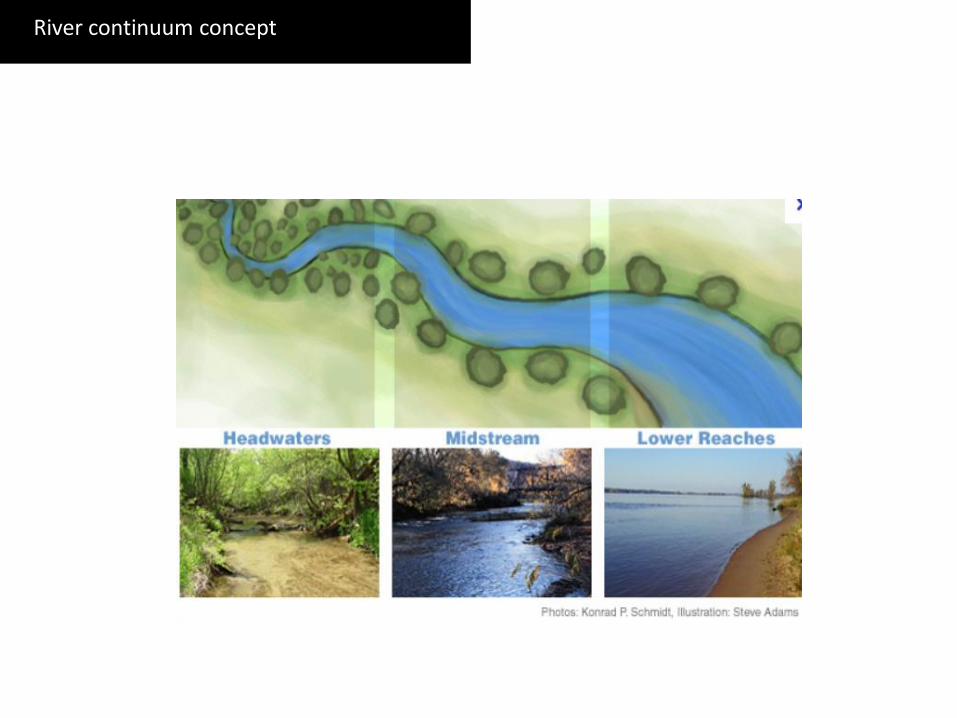
River continuum concept
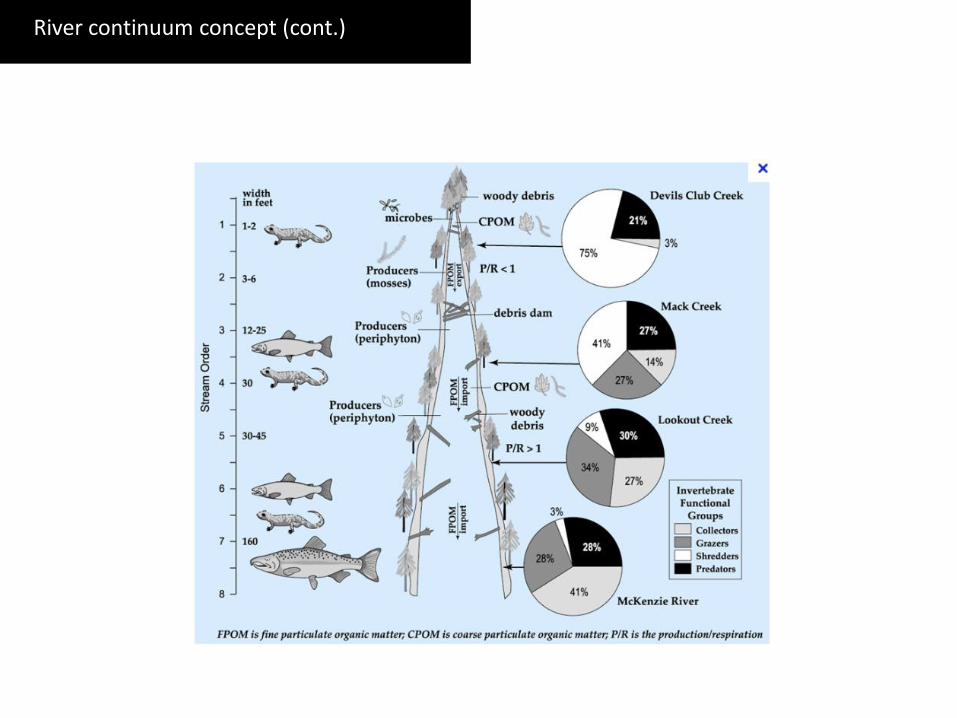
River continuum concept (cont.)
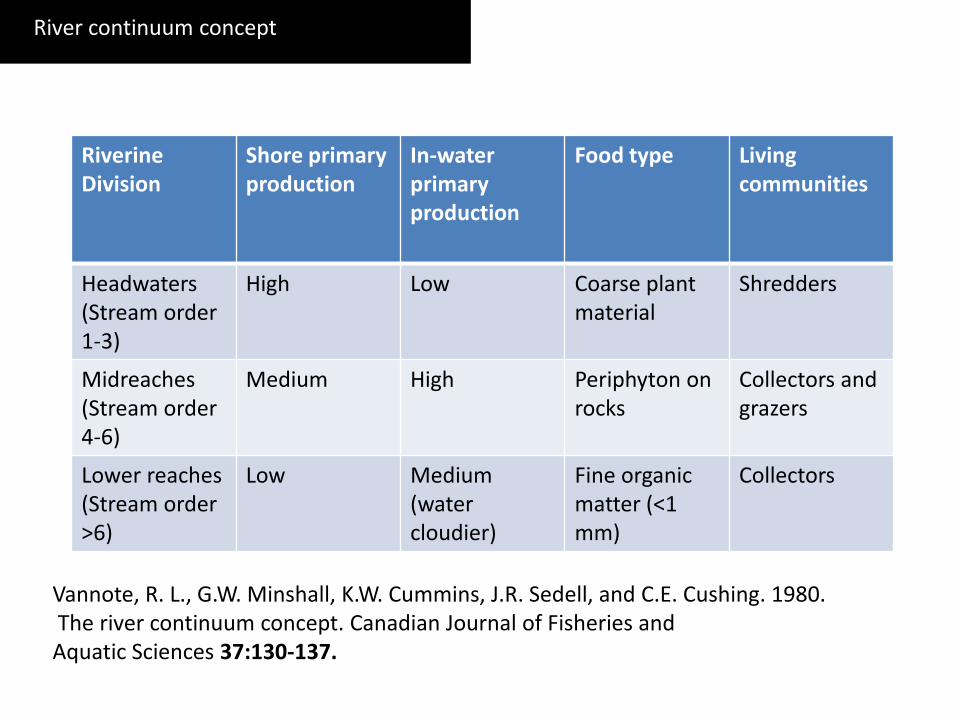
River continuum concept
Riverine Division
Shore primary production
In-water primary production
Food type Living communities
Headwaters (Stream order 1-3)
High Low Coarse plant material
Shredders
Midreaches (Stream order 4-6)
Medium High Periphyton on rocks
Collectors and grazers
Lower reaches (Stream order >6)
Low Medium (water cloudier)
Fine organic matter (<1 mm)
Collectors
Vannote, R. L., G.W. Minshall, K.W. Cummins, J.R. Sedell, and C.E. Cushing. 1980. The river continuum concept. Canadian Journal of Fisheries and Aquatic Sciences 37:130-137.
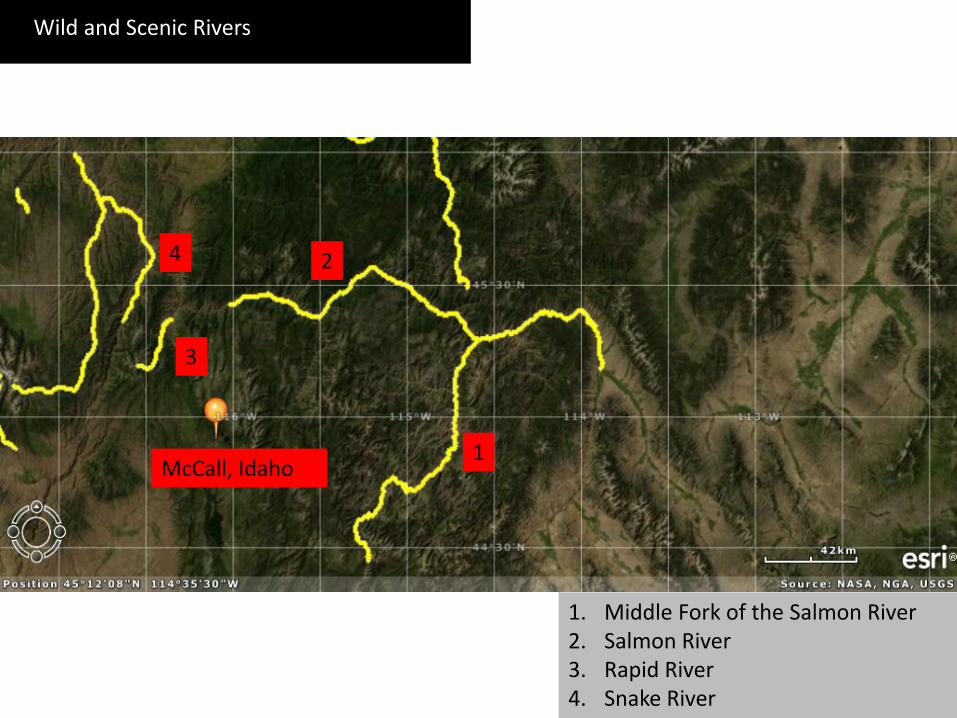
McCall, Idaho 1
3
4 2
1. Middle Fork of the Salmon River 2. Salmon River 3. Rapid River 4. Snake River
Wild and Scenic Rivers
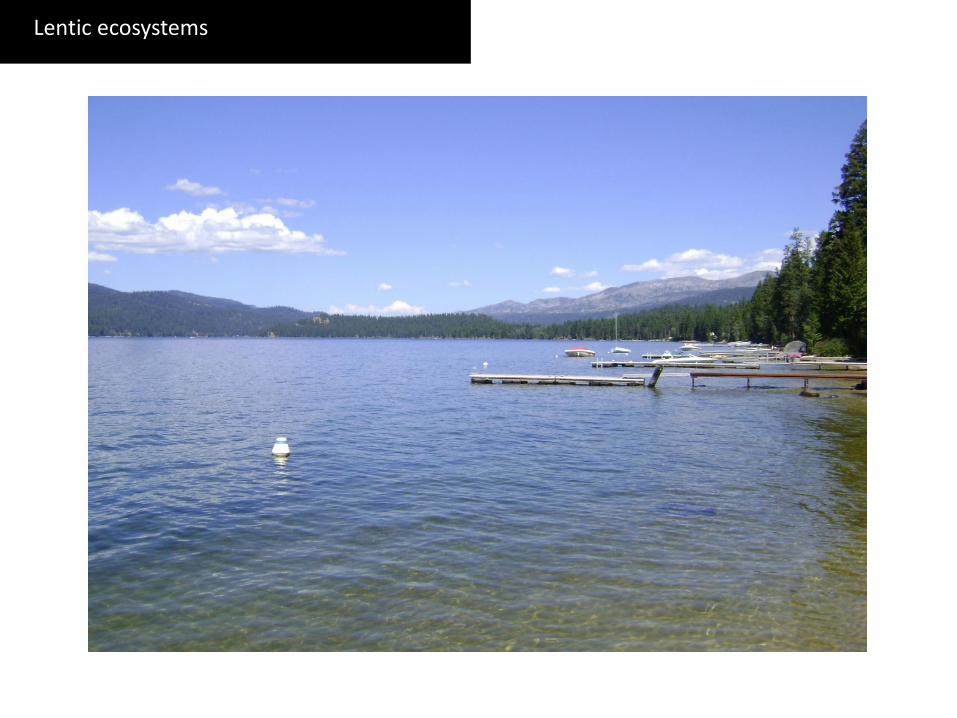
Lentic ecosystems
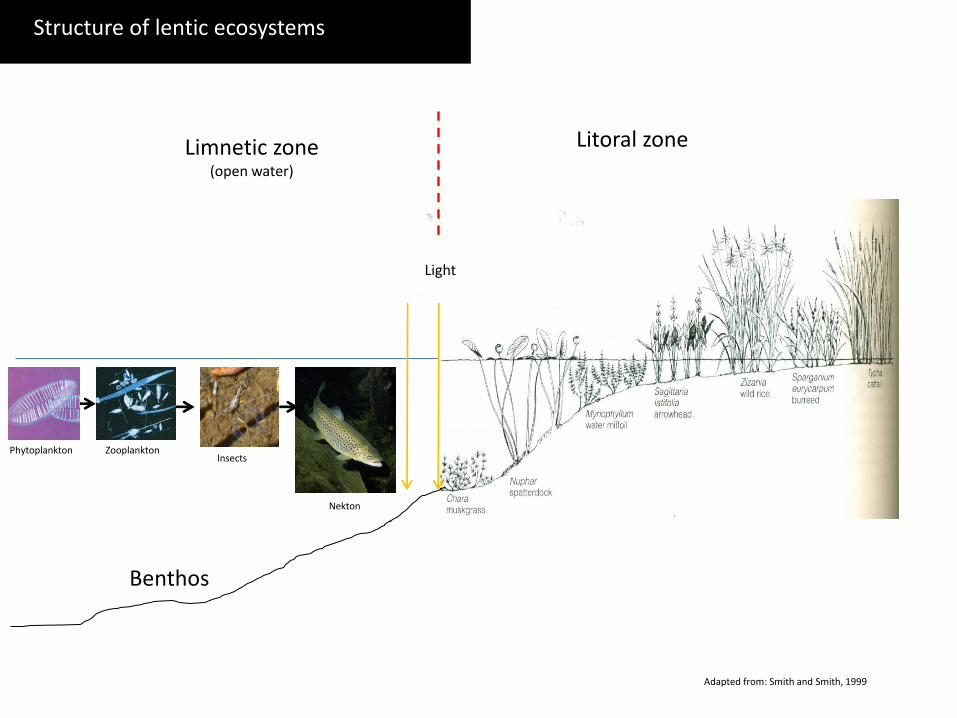
Light
Phytoplankton Zooplankton
Nekton
Litoral zone Limnetic zone (open water)
Benthos
Structure of lentic ecosystems
Insects
Adapted from: Smith and Smith, 1999
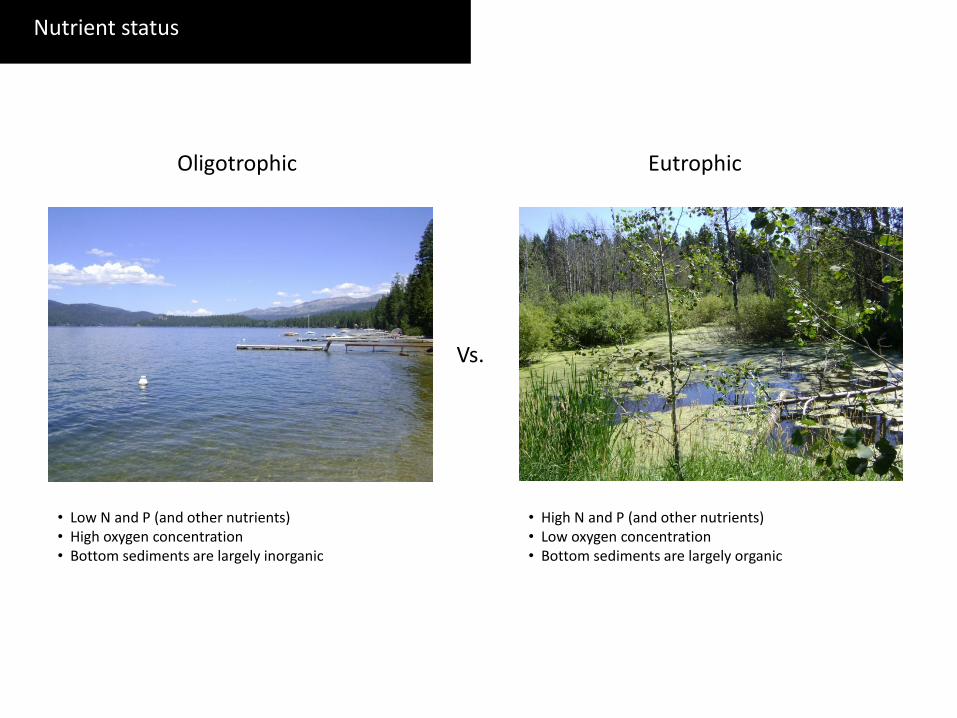
Oligotrophic Eutrophic
• Low N and P (and other nutrients) • High oxygen concentration • Bottom sediments are largely inorganic
• High N and P (and other nutrients) • Low oxygen concentration • Bottom sediments are largely organic
Vs.
Nutrient status
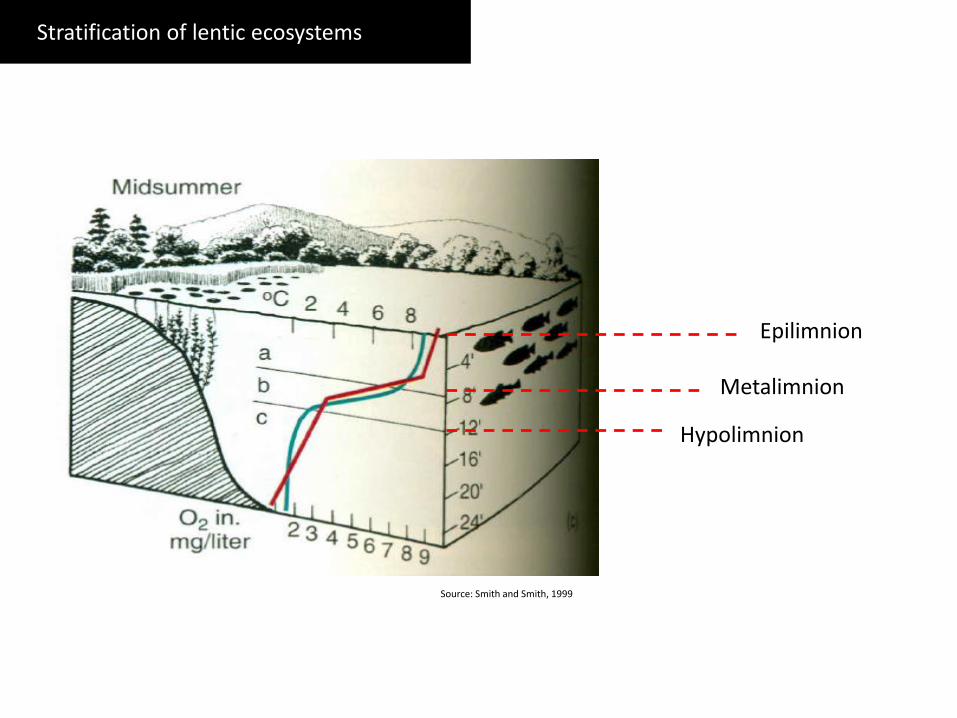
Source: Smith and Smith, 1999
Epilimnion
Metalimnion
Hypolimnion
Stratification of lentic ecosystems
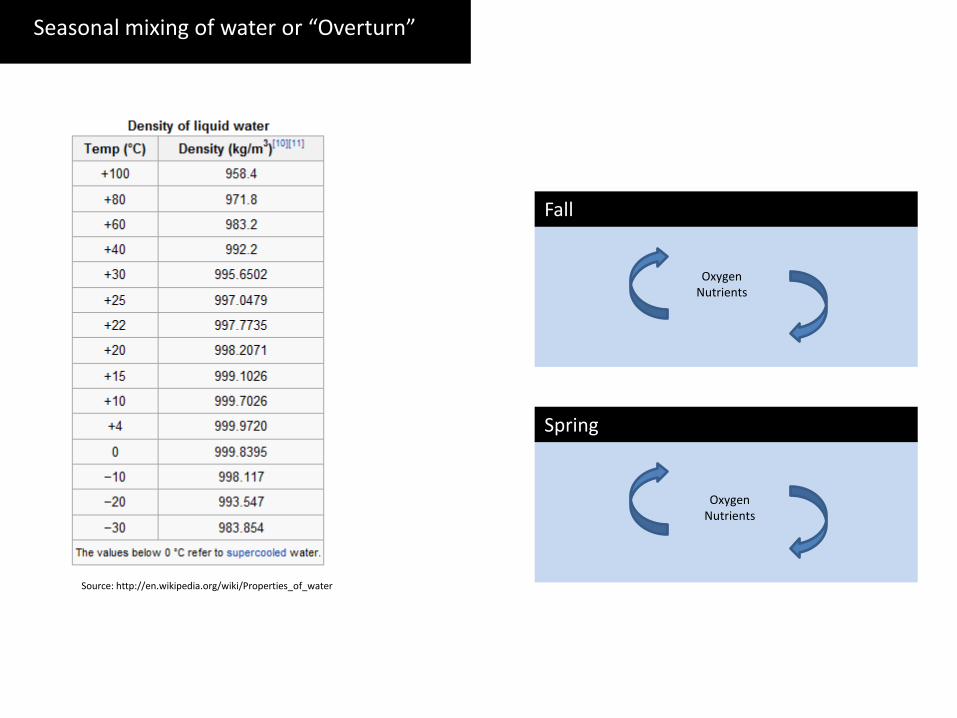
Source: http://en.wikipedia.org/wiki/Properties_of_water
Spring
Fall
Seasonal mixing of water or “Overturn”
Oxygen Nutrients
Oxygen Nutrients
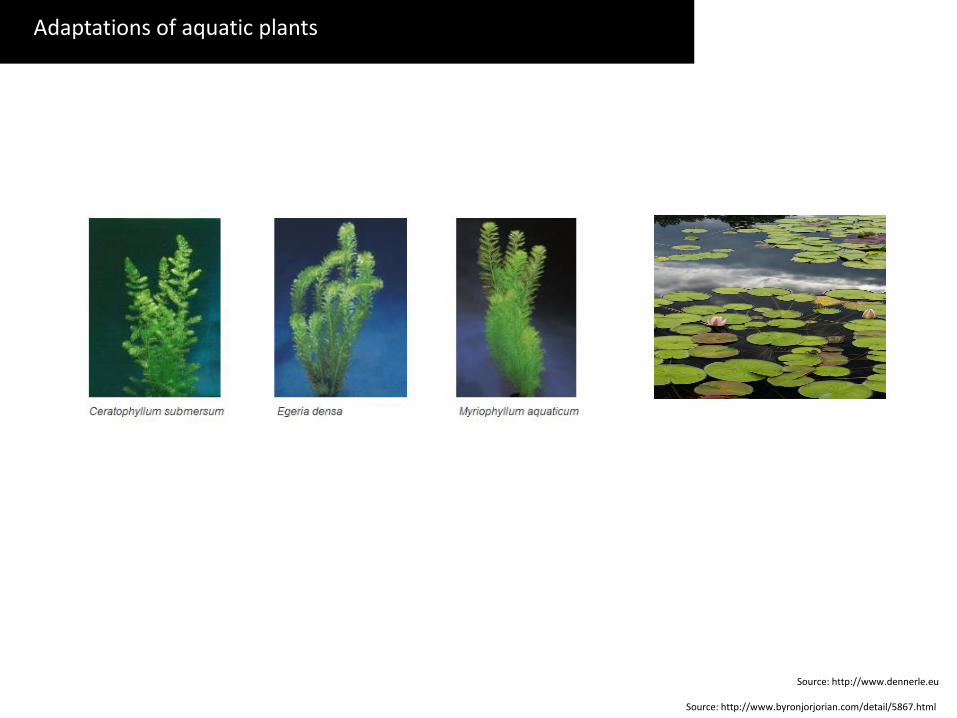
Adaptations of aquatic plants
Source: http://www.dennerle.eu
Source: http://www.byronjorjorian.com/detail/5867.html
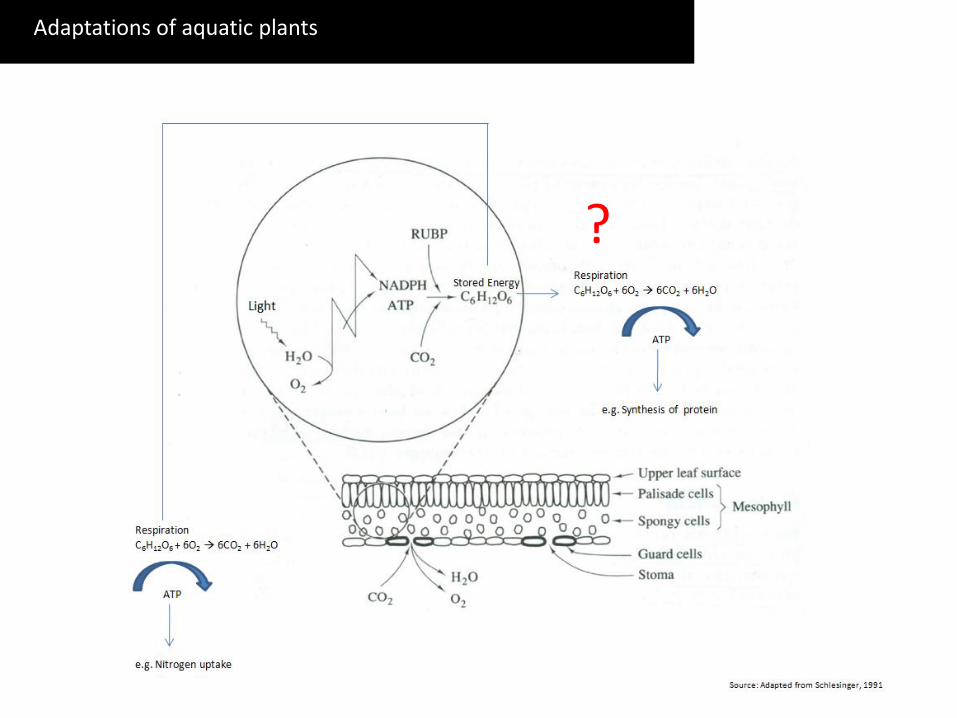
Photosynthesis Adaptations of aquatic plants
?
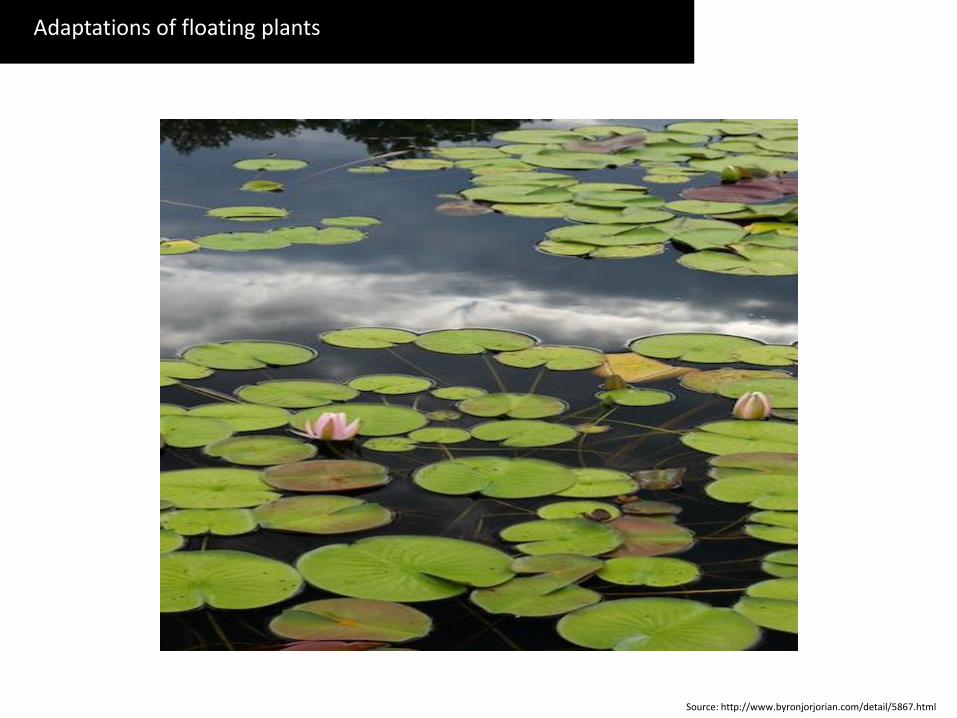
Adaptations of floating plants
Source: http://www.byronjorjorian.com/detail/5867.html
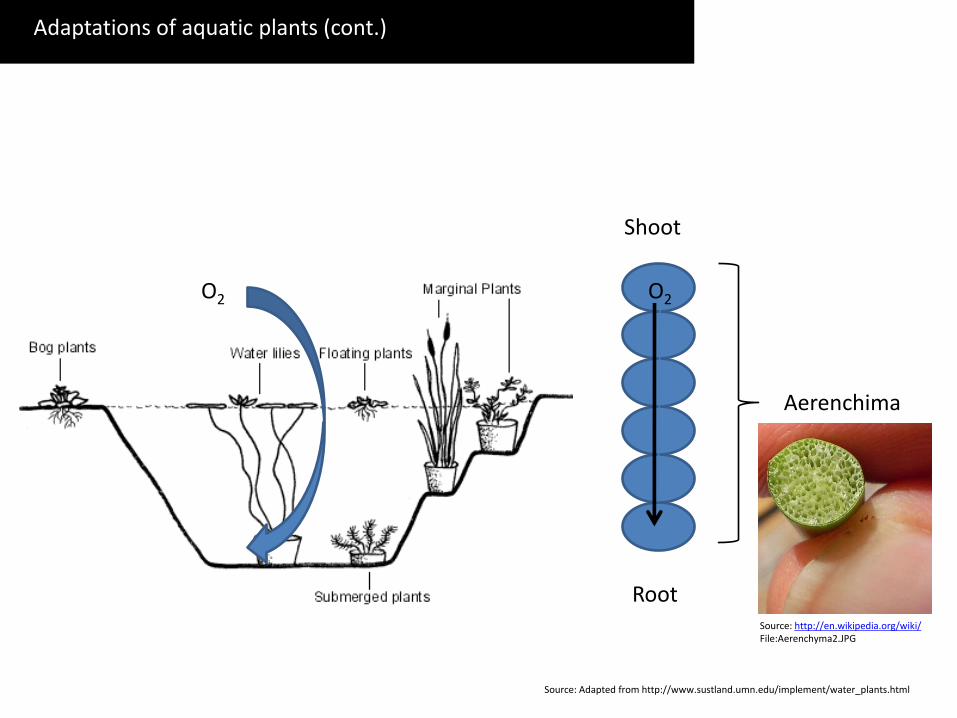
Shoot
Root
O2 O2
Aerenchima
Source: Adapted from http://www.sustland.umn.edu/implement/water_plants.html
Source: http://en.wikipedia.org/wiki/ File:Aerenchyma2.JPG
Adaptations of aquatic plants (cont.)
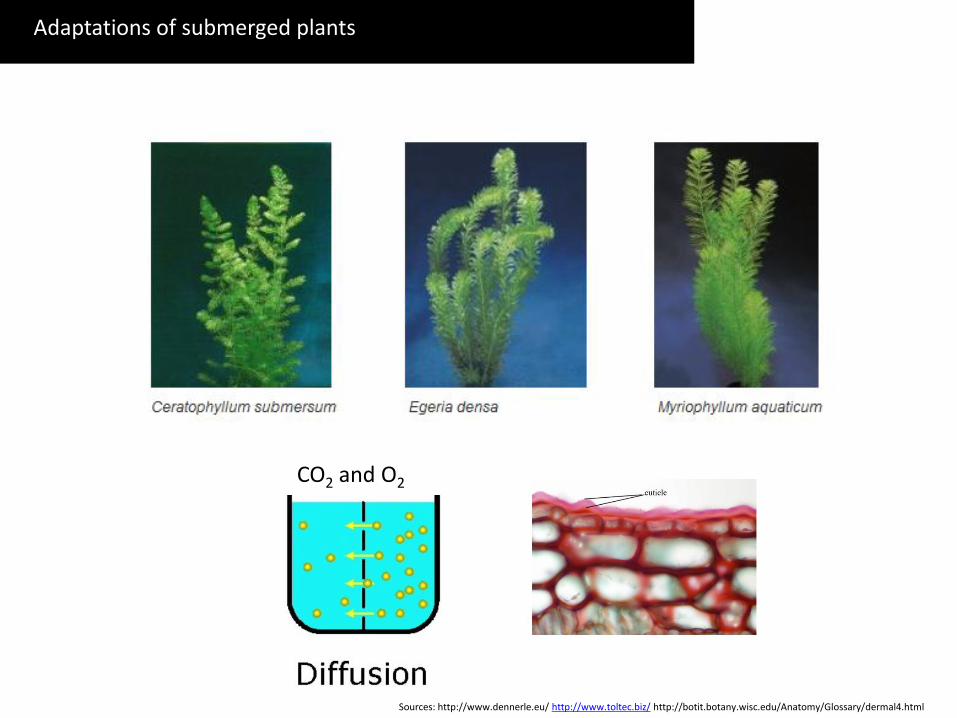
Adaptations of submerged plants
Sources: http://www.dennerle.eu/ http://www.toltec.biz/ http://botit.botany.wisc.edu/Anatomy/Glossary/dermal4.html
CO2 and O2
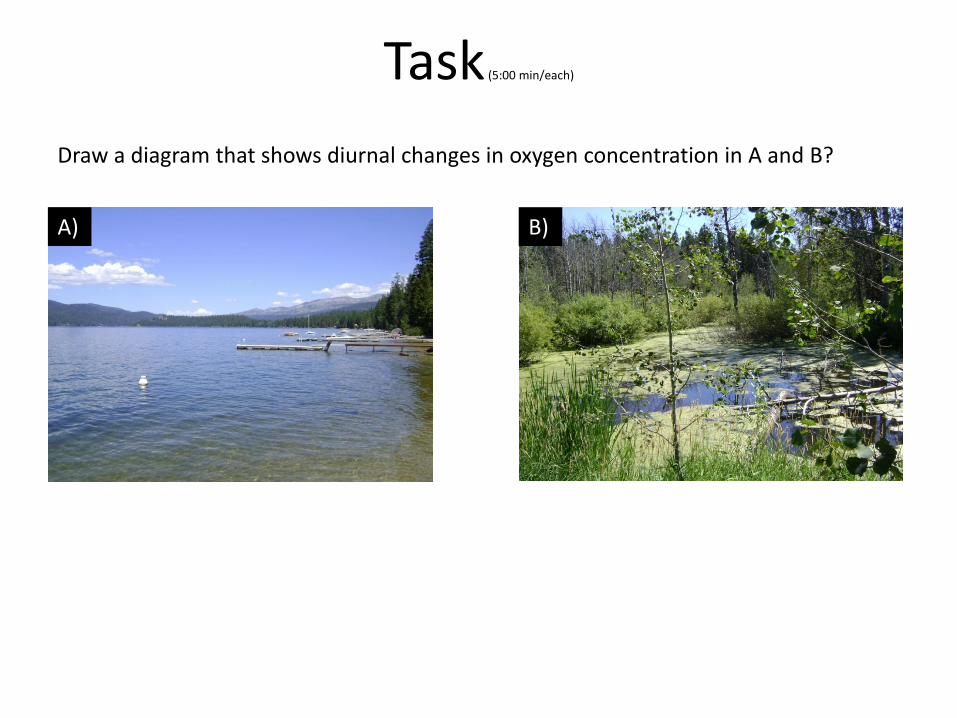
Draw a diagram that shows diurnal changes in oxygen concentration in A and B?
Task (5:00 min/each)
A) B)
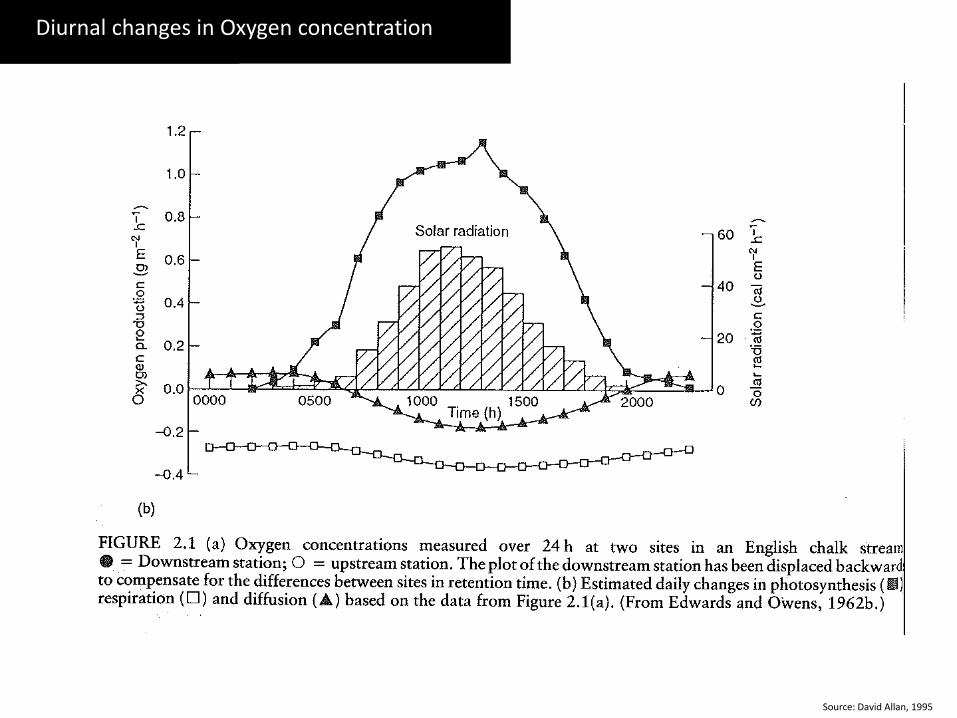
Water chemistry Diurnal changes in Oxygen concentration
Source: David Allan, 1995
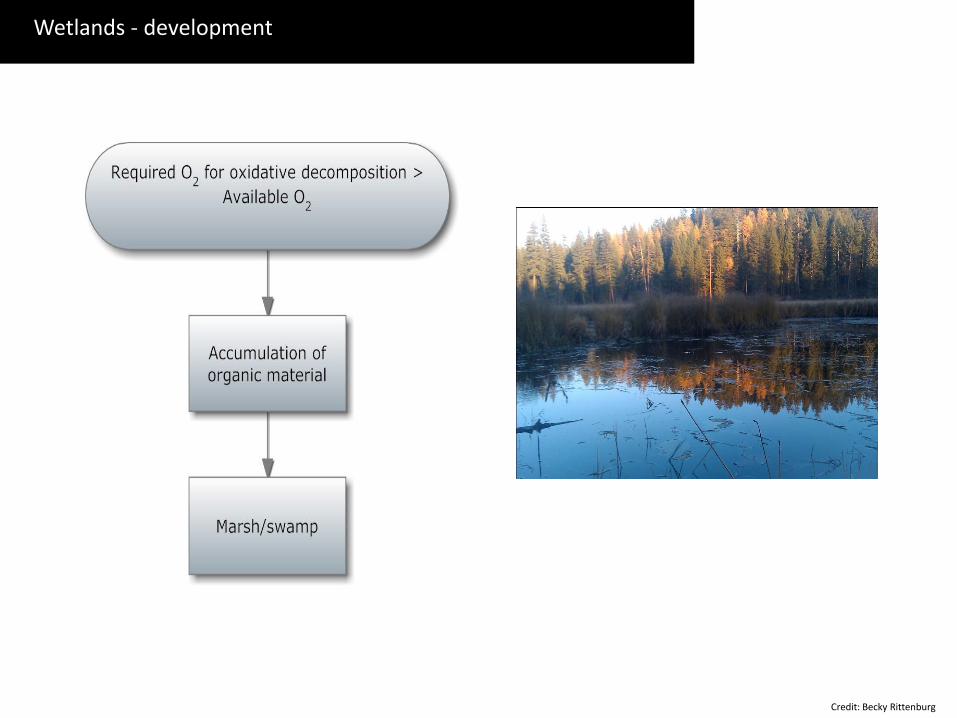
Wetlands - development
Credit: Becky Rittenburg