Embed Size (px)
Citation preview

Hydrology of Lake Eyre
APPENDICES
Final 27 September 2005
Rachel Murphy, Tom McMahon, Pat Little, Justin Costelloe, Murray Peel, Francis Chiew, Susan Hayes, Rory Nathan, Durga Kandel

Lake Eyre Hydrology Appendices
I:\WCMS\Projects\WC03272\Deliverables\final report\LakeEyreHydrol_App_final.doc PAGE 1
Contents
Appendix A Time Series Plots for Selected Stations 2 A.1 Rainfall Timeseries 2 A.2 Streamflow Timeseries 15
Appendix B Average Monthly Rainfall 28
Appendix C Wet / Dry Spell Length and Cumulative Surplus / Deficit Analysis 29
Appendix D The SIMHYD Model 34
Appendix E Transmission Losses 36
Appendix F List of Rainfall Gauges in the Lake Eyre Basin 42
Appendix G Average Monthly Streamflow 74
Appendix H Stream Monitoring Stations in the Lake Eyre Basin 76 H.1 Northern Territory (Department of Natural Resources, Environment and
the Arts) 76 H.2 South Australia (Department of Water, Land and Biodiversity
Conservation) 87 H.3 Queensland (Department of Natural Resources and Mines) 91
Appendix cover photo (Lake Toontoowaranie, Cooper Creek) taken by Justin Costelloe, November 2004.

Lake Eyre Hydrology Appendices
I:\WCMS\Projects\WC03272\Deliverables\final report\LakeEyreHydrol_App_final.doc PAGE 2
Appendix A Time Series Plots for Selected Stations
A.1 Rainfall Timeseries
Timeseries plots for annual, monthly and daily rainfall at Ringwood (close to Alice Springs), Barcaldine (close to Longreach), Birsdville and Anna Creek (close to Oodnadatta) are presented in Figure A1 to Figure A2.

Lake Eyre Hydrology Appendices
I:\WCMS\Projects\WC03272\Deliverables\final report\LakeEyreHydrol_App_final.doc PAGE 3
1880 1884 1888 1892 1896 1900 1904 1908
0
200
400
600
800
1000
Pre
cipi
tatio
n (m
m/y
ear)
Ringwood (015546) Annual Rainfall Time Series
1910 1914 1918 1922 1926 1930 1934 1938
0
200
400
600
800
1000
Pre
cipi
tatio
n (m
m/y
ear)
1940 1944 1948 1952 1956 1960 1964 1968
0
200
400
600
800
1000
Prec
ipita
tion
(mm
/yea
r)
1970 1974 1978 1982 1986 1990 1994 1998 2002Year
0
200
400
600
800
1000
Pre
cipi
tatio
n (m
m/y
ear)
Figure A-1 Ringwood (015546) Annual Rainfall Time Series

Lake Eyre Hydrology Appendices
I:\WCMS\Projects\WC03272\Deliverables\final report\LakeEyreHydrol_App_final.doc PAGE 4
1880 1884 1888 1892 1896 1900 1904 1908
0
100
200
300
400
Pre
cipi
tatio
n (m
m/m
onth
)
Ringwood (015546) Monthly Rainfall Time Series
1910 1914 1918 1922 1926 1930 1934 1938
0
100
200
300
400
Pre
cipi
tatio
n (m
m/m
onth
)
1940 1944 1948 1952 1956 1960 1964 1968
0
100
200
300
400
Pre
cipi
tatio
n (m
m/m
onth
)
1970 1974 1978 1982 1986 1990 1994 1998 2002Year
0
100
200
300
400
Pre
cipi
tatio
n (m
m/m
onth
)
Figure A-2 Ringwood (015546) Monthly Rainfall Time Series

Lake Eyre Hydrology Appendices
I:\WCMS\Projects\WC03272\Deliverables\final report\LakeEyreHydrol_App_final.doc PAGE 5
1880 1884 1888 1892 1896 1900 1904 1908
0
50
100
150
200
250
Pre
cipi
tatio
n (m
m/d
ay)
Ringwood (015546) Daily Rainfall Time Series
1910 1914 1918 1922 1926 1930 1934 1938
0
50
100
150
200
250
Pre
cipi
tatio
n (m
m/d
ay)
1940 1944 1948 1952 1956 1960 1964 1968
0
50
100
150
200
250
Pre
cipi
tatio
n (m
m/d
ay)
1970 1974 1978 1982 1986 1990 1994 1998 2002Year
0
50
100
150
200
250
Pre
cipi
tatio
n (m
m/d
ay)
Figure A-3 Ringwood (015546) Daily Rainfall Time Series
Lake Eyre Hydrology Appendices
I:\WCMS\Projects\WC03272\Deliverables\final report\LakeEyreHydrol_App_final.doc PAGE 6
1880 1884 1888 1892 1896 1900 1904 1908
0
400
800
1200
Pre
cipi
tatio
n (m
m/y
ear)
Barcaldine (036007) Annual Rainfall Time Series
1910 1914 1918 1922 1926 1930 1934 1938
0
400
800
1200
Pre
cipi
tatio
n (m
m/y
ear)
1940 1944 1948 1952 1956 1960 1964 1968
0
400
800
1200
Prec
ipita
tion
(mm
/yea
r)
1970 1974 1978 1982 1986 1990 1994 1998 2002Year
0
400
800
1200
Pre
cipi
tatio
n (m
m/y
ear)
Figure A-4 Barcaldine (036007) Annual Rainfall Time Series

Lake Eyre Hydrology Appendices
I:\WCMS\Projects\WC03272\Deliverables\final report\LakeEyreHydrol_App_final.doc PAGE 7
1880 1884 1888 1892 1896 1900 1904 1908
0
100
200
300
400
500
Pre
cipi
tatio
n (m
m/m
onth
)
Barcaldine (036007) Monthly Rainfall Time Series
1910 1914 1918 1922 1926 1930 1934 1938
0
100
200
300
400
500
Pre
cipi
tatio
n (m
m/m
onth
)
1940 1944 1948 1952 1956 1960 1964 1968
0
100
200
300
400
500
Prec
ipita
tion
(mm
/mon
th)
1970 1974 1978 1982 1986 1990 1994 1998 2002Year
0
100
200
300
400
500
Prec
ipita
tion
(mm
/mon
th)
Figure A-5 Barcaldine (036007) Monthly Rainfall Time Series

Lake Eyre Hydrology Appendices
I:\WCMS\Projects\WC03272\Deliverables\final report\LakeEyreHydrol_App_final.doc PAGE 8
1880 1884 1888 1892 1896 1900 1904 1908
0
40
80
120
160
200
Pre
cipi
tatio
n (m
m/d
ay)
Barcaldine (036007) Daily Rainfall Time Series
1910 1914 1918 1922 1926 1930 1934 1938
0
40
80
120
160
200
Pre
cipi
tatio
n (m
m/d
ay)
1940 1944 1948 1952 1956 1960 1964 1968
0
40
80
120
160
200
Pre
cipi
tatio
n (m
m/d
ay)
1970 1974 1978 1982 1986 1990 1994 1998 2002Year
0
40
80
120
160
200
Pre
cipi
tatio
n (m
m/d
ay)
Figure A-6 Barcaldine (036007) Daily Rainfall Time Series

Lake Eyre Hydrology Appendices
I:\WCMS\Projects\WC03272\Deliverables\final report\LakeEyreHydrol_App_final.doc PAGE 9
1880 1884 1888 1892 1896 1900 1904 1908
0
200
400
600
Prec
ipita
tion
(mm
/yea
r)
Birdsville (038002) Annual Rainfall Time Series
1910 1914 1918 1922 1926 1930 1934 1938
0
200
400
600
Pre
cipi
tatio
n (m
m/y
ear)
1940 1944 1948 1952 1956 1960 1964 1968
0
200
400
600
Pre
cipi
tatio
n (m
m/y
ear)
1970 1974 1978 1982 1986 1990 1994 1998 2002Year
0
200
400
600
Pre
cipi
tatio
n (m
m/y
ear)
Figure A-7 Birdsville (038002) Annual Rainfall Time Series

Lake Eyre Hydrology Appendices
I:\WCMS\Projects\WC03272\Deliverables\final report\LakeEyreHydrol_App_final.doc PAGE 10
1880 1884 1888 1892 1896 1900 1904 1908
0
100
200
300
Pre
cipi
tatio
n (m
m/m
onth
)
Birdsville (038002) Monthly Rainfall Time Series
1910 1914 1918 1922 1926 1930 1934 1938
0
100
200
300
Pre
cipi
tatio
n (m
m/m
onth
)
1940 1944 1948 1952 1956 1960 1964 1968
0
100
200
300
Prec
ipita
tion
(mm
/mon
th)
1970 1974 1978 1982 1986 1990 1994 1998 2002Year
0
100
200
300
Prec
ipita
tion
(mm
/mon
th)
Figure A-8 Birdsville (038002) Monthly Rainfall Time Series

Lake Eyre Hydrology Appendices
I:\WCMS\Projects\WC03272\Deliverables\final report\LakeEyreHydrol_App_final.doc PAGE 11
1880 1884 1888 1892 1896 1900 1904 1908
0
40
80
120
160
Prec
ipita
tion
(mm
/day
)
Birdsville (038002) Daily Rainfall Time Series
1910 1914 1918 1922 1926 1930 1934 1938
0
40
80
120
160
Pre
cipi
tatio
n (m
m/d
ay)
1940 1944 1948 1952 1956 1960 1964 1968
0
40
80
120
160
Pre
cipi
tatio
n (m
m/d
ay)
1970 1974 1978 1982 1986 1990 1994 1998 2002Year
0
40
80
120
160
Pre
cipi
tatio
n (m
m/d
ay)
Figure A-9 Birdsville (038002) Daily Rainfall Time Series

Lake Eyre Hydrology Appendices
I:\WCMS\Projects\WC03272\Deliverables\final report\LakeEyreHydrol_App_final.doc PAGE 12
1880 1884 1888 1892 1896 1900 1904 1908
0
100
200
300
400
500
Prec
ipita
tion
(mm
/yea
r)
Anna Creek (017004) Annual Rainfall Time Series
1910 1914 1918 1922 1926 1930 1934 1938
0
100
200
300
400
500
Pre
cipi
tatio
n (m
m/y
ear)
1940 1944 1948 1952 1956 1960 1964 1968
0
100
200
300
400
500
Pre
cipi
tatio
n (m
m/y
ear)
1970 1974 1978 1982 1986 1990 1994 1998 2002Year
0
100
200
300
400
500
Pre
cipi
tatio
n (m
m/y
ear)
Figure A-10 Anna Creek (017004) Annual Rainfall Time Series

Lake Eyre Hydrology Appendices
I:\WCMS\Projects\WC03272\Deliverables\final report\LakeEyreHydrol_App_final.doc PAGE 13
1880 1884 1888 1892 1896 1900 1904 1908
0
100
200
300
400
500
Pre
cipi
tatio
n (m
m/m
onth
)
Anna Creek (017004) Monthly Rainfall Time Series
1910 1914 1918 1922 1926 1930 1934 1938
0
100
200
300
400
500
Pre
cipi
tatio
n (m
m/m
onth
)
1940 1944 1948 1952 1956 1960 1964 1968
0
100
200
300
400
500
Pre
cipi
tatio
n (m
m/m
onth
)
1970 1974 1978 1982 1986 1990 1994 1998 2002Year
0
100
200
300
400
500
Pre
cipi
tatio
n (m
m/m
onth
)
Figure A-11 Anna Creek (017004) Monthly Rainfall Time Series

Lake Eyre Hydrology Appendices
I:\WCMS\Projects\WC03272\Deliverables\final report\LakeEyreHydrol_App_final.doc PAGE 14
1880 1884 1888 1892 1896 1900 1904 1908
0
40
80
120
160
Prec
ipita
tion
(mm
/day
)
Anna Creek (017004) Daily Rainfall Time Series
1910 1914 1918 1922 1926 1930 1934 1938
0
40
80
120
160
Pre
cipi
tatio
n (m
m/d
ay)
1940 1944 1948 1952 1956 1960 1964 1968
0
40
80
120
160
Pre
cipi
tatio
n (m
m/d
ay)
1970 1974 1978 1982 1986 1990 1994 1998 2002Year
0
40
80
120
160
Pre
cipi
tatio
n (m
m/d
ay)
Figure A-12 Anna Creek (017004) Daily Rainfall Time Series

Lake Eyre Hydrology Appendices
I:\WCMS\Projects\WC03272\Deliverables\final report\LakeEyreHydrol_App_final.doc PAGE 15
A.2 Streamflow Timeseries
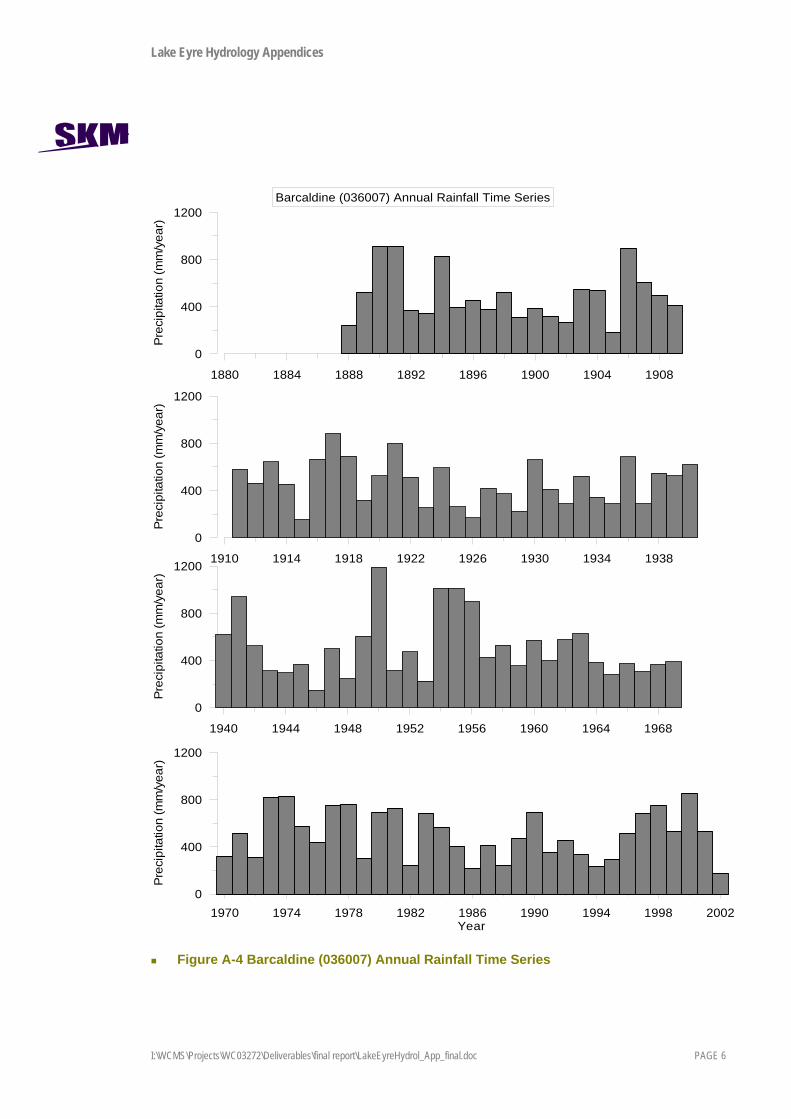
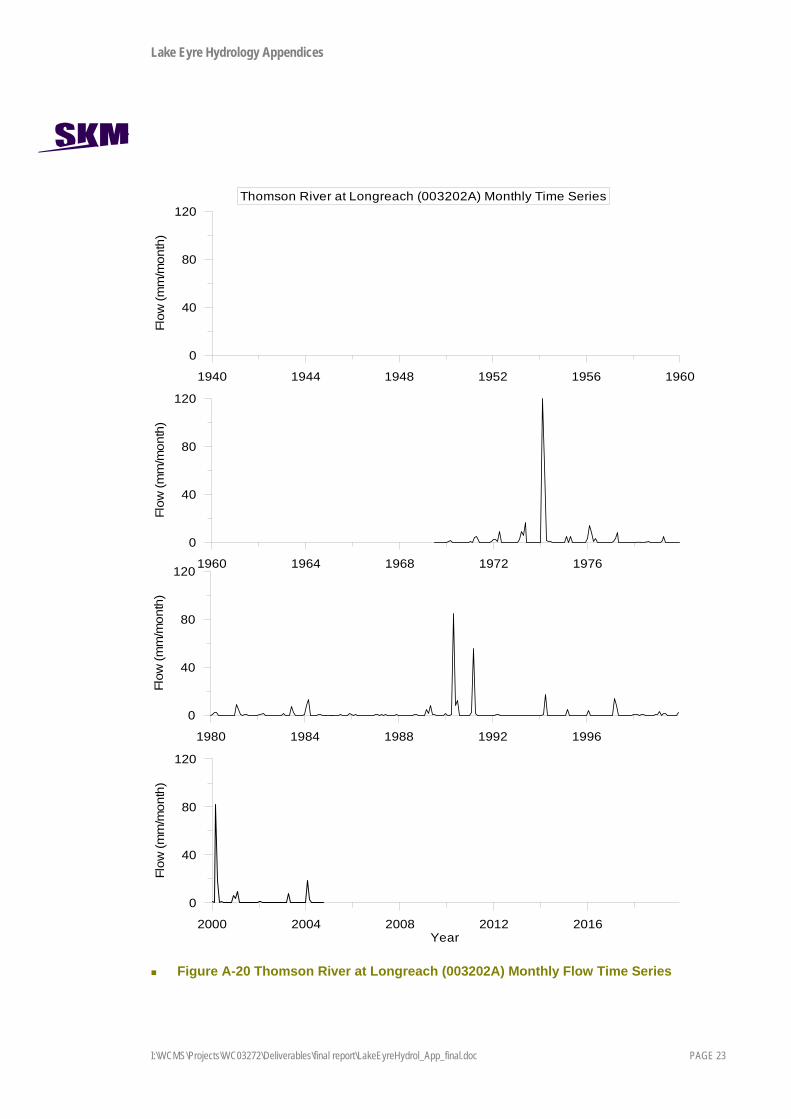
Timeseries plots for annual, monthly and daily streamflow on the Diamantina River at Birdsville,Cooper Creek at Callamurra (close to Innamincka), Thomson River at Longreach, and Todd River at Wigley Gorge (close to Alice Springs) are presented in Figure A13 to Figure A24.

Lake Eyre Hydrology Appendices
I:\WCMS\Projects\WC03272\Deliverables\final report\LakeEyreHydrol_App_final.doc PAGE 16
1940 1944 1948 1952 1956 1960
0
20
40
60
80
100
Flow
(mm
/yea
r)
Diamantina River at Birdsville (AW002101/002101A) Annual Time Series
1960 1964 1968 1972 1976 1980
0
20
40
60
80
100
Flow
(mm
/yea
r)
1980 1984 1988 1992 1996 2000
0
20
40
60
80
100
Flow
(mm
/yea
r)
2000 2004 2008 2012 2016 2020Year
0
20
40
60
80
100
Flow
(mm
/yea
r)
Figure A-13 Diamantina River at Birdsville (AW002101/02101A) Annual Flow Time Series

Lake Eyre Hydrology Appendices
I:\WCMS\Projects\WC03272\Deliverables\final report\LakeEyreHydrol_App_final.doc PAGE 17
1940 1944 1948 1952 1956 1960
0
20
40
60
Flow
(mm
/mon
th)
Diamantina River at Birdsville (002101a/AW002101) Monthly Time Series
1960 1964 1968 1972 1976
0
20
40
60
Flow
(mm
/mon
th)
1980 1984 1988 1992 1996
0
20
40
60
Flow
(mm
/mon
th)
2000 2004 2008 2012 2016Year
0
20
40
60
Flow
(mm
/mon
th)
Figure A-14 Diamantina River at Birdsville (AW002101/02101A) Monthly Flow Time Series

Lake Eyre Hydrology Appendices
I:\WCMS\Projects\WC03272\Deliverables\final report\LakeEyreHydrol_App_final.doc PAGE 18
1940 1944 1948 1952 1956
0
1
2
3
4
Flow
(mm
/day
)
Diamantina River at Birdsville (AW002101/002101A) Daily Time Series
1960 1964 1968 1972 1976
0
1
2
3
4
Flow
(mm
/day
)
1980 1984 1988 1992 1996
0
1
2
3
4
Flow
(mm
/day
)
2000 2004 2008 2012 2016Year
0
1
2
3
4
Flow
(mm
/day
)
Figure A-15 Diamantina River at Birdsville (AW002101/02101A) Daily Flow Time Series

Lake Eyre Hydrology Appendices
I:\WCMS\Projects\WC03272\Deliverables\final report\LakeEyreHydrol_App_final.doc PAGE 19
1940 1944 1948 1952 1956 1960
0
20
40
60
80
Flow
(mm
/yea
r)
Cooper Creek at Callamurra Water Hole (AW003501) Annual Time Series
1960 1964 1968 1972 1976 1980
0
20
40
60
80
Flow
(mm
/yea
r)
1980 1984 1988 1992 1996 2000
0
20
40
60
80
Flow
(mm
/yea
r)
2000 2004 2008 2012 2016 2020Year
0
20
40
60
80
Flow
(mm
/yea
r)
Figure A-16 Cooper Creek at Callamurra Water Hole (AW003201) Annual Flow Time Series

Lake Eyre Hydrology Appendices
I:\WCMS\Projects\WC03272\Deliverables\final report\LakeEyreHydrol_App_final.doc PAGE 20
1940 1944 1948 1952 1956 1960
0
10
20
30
40
Flow
(mm
/mon
th)
Cooper Creek at Callamurra Water Hole (AW003501) Monthly Time Series
1960 1964 1968 1972 1976
0
10
20
30
40
Flow
(mm
/mon
th)
1980 1984 1988 1992 1996
0
10
20
30
40
Flow
(mm
/mon
th)
2000 2004 2008 2012 2016Year
0
10
20
30
40
Flow
(mm
/mon
th)
Figure A-17 Cooper Creek at Callamurra Water Hole (AW003201) Monthly Flow Time Series

Lake Eyre Hydrology Appendices
I:\WCMS\Projects\WC03272\Deliverables\final report\LakeEyreHydrol_App_final.doc PAGE 21
1940 1944 1948 1952 1956
0
1
2
3
Flow
(mm
/day
)
Cooper Creek at Callamurra Water Hole (AW003501) Daily Time Series
1960 1964 1968 1972 1976
0
1
2
3
Flow
(mm
/day
)
1980 1984 1988 1992 1996
0
1
2
3
Flow
(mm
/day
)
2000 2004 2008 2012 2016Year
0
1
2
3
Flow
(mm
/day
)
Figure A-18 Cooper Creek at Callamurra Water Hole (AW003201) Daily Flow Time Series

Lake Eyre Hydrology Appendices
I:\WCMS\Projects\WC03272\Deliverables\final report\LakeEyreHydrol_App_final.doc PAGE 22
1940 1944 1948 1952 1956 1960
0
40
80
120
160
200
Flow
(mm
/yea
r)
Thomson River at Longreach (003202A) Annual Time Series
1960 1964 1968 1972 1976 1980
0
40
80
120
160
200
Flow
(mm
/yea
r)
1980 1984 1988 1992 1996 2000
0
40
80
120
160
200
Flow
(mm
/yea
r)
2000 2004 2008 2012 2016 2020Year
0
40
80
120
160
200
Flow
(mm
/yea
r)
Figure A-19 Thomson River at Longreach (003202A) Annual Flow Time Series
Lake Eyre Hydrology Appendices
I:\WCMS\Projects\WC03272\Deliverables\final report\LakeEyreHydrol_App_final.doc PAGE 23
1940 1944 1948 1952 1956 1960
0
40
80
120
Flow
(mm
/mon
th)
Thomson River at Longreach (003202A) Monthly Time Series
1960 1964 1968 1972 1976
0
40
80
120
Flow
(mm
/mon
th)
1980 1984 1988 1992 1996
0
40
80
120
Flow
(mm
/mon
th)
2000 2004 2008 2012 2016Year
0
40
80
120
Flow
(mm
/mon
th)
Figure A-20 Thomson River at Longreach (003202A) Monthly Flow Time Series

Lake Eyre Hydrology Appendices
I:\WCMS\Projects\WC03272\Deliverables\final report\LakeEyreHydrol_App_final.doc PAGE 24
1940 1944 1948 1952 1956
0
4
8
12
16
20
Flow
(mm
/day
)
Thomson River at Longreach (002302A) Daily Time Series
1960 1964 1968 1972 1976
0
4
8
12
16
20
Flow
(mm
/day
)
1980 1984 1988 1992 1996
0
4
8
12
16
20
Flow
(mm
/day
)
2000 2004 2008 2012 2016Year
0
4
8
12
16
20
Flow
(mm
/day
)
Figure A-21 Thomson River at Longreach (003202A) Daily Flow Time Series

Lake Eyre Hydrology Appendices
I:\WCMS\Projects\WC03272\Deliverables\final report\LakeEyreHydrol_App_final.doc PAGE 25
1940 1944 1948 1952 1956 1960
0
100
200
300
Flow
(mm
/yea
r)
Todd River at Wigley Gorge (G0060046) Annual Time Series
1960 1964 1968 1972 1976 1980
0
100
200
300
Flow
(mm
/yea
r)
1980 1984 1988 1992 1996 2000
0
100
200
300
Flow
(mm
/yea
r)
2000 2004 2008 2012 2016 2020Year
0
100
200
300
Flow
(mm
/yea
r)
Lake Eyre Hydrology Appendices
I:\WCMS\Projects\WC03272\Deliverables\final report\LakeEyreHydrol_App_final.doc PAGE 26
Figure A-22 Todd River at Wigley Gorge (G0060046) Annual Flow Time Series
1940 1944 1948 1952 1956 1960
0
40
80
120
160
Flow
(mm
/mon
th)
Todd River at Wigley Gorge (G0060046) Monthly Time Series
1960 1964 1968 1972 1976
0
40
80
120
160
Flow
(mm
/mon
th)
1980 1984 1988 1992 1996
0
40
80
120
160
Flow
(mm
/mon
th)
2000 2004 2008 2012 2016Year
0
40
80
120
160
Flow
(mm
/mon
th)
Figure A-23 Todd River at Wigley Gorge (G0060046) Monthly Flow Time Series

Lake Eyre Hydrology Appendices
I:\WCMS\Projects\WC03272\Deliverables\final report\LakeEyreHydrol_App_final.doc PAGE 27
1940 1944 1948 1952 1956
0
20
40
60
80
Flow
(mm
/day
)
Todd River at Wigley Gorge (G0060046) Daily Time Series
1960 1964 1968 1972 1976
0
20
40
60
80
Flow
(mm
/day
)
1980 1984 1988 1992 1996
0
20
40
60
80
Flow
(mm
/day
)
2000 2004 2008 2012 2016Year
0
20
40
60
80
Flow
(mm
/day
)
Figure A-24 Todd River at Wigley Gorge (G0060046) Daily Flow Time Series

Lake Eyre Hydrology Appendices
I:\WCMS\Projects\WC03272\Deliverables\final report\LakeEyreHydrol_App_final.doc PAGE 28
Appendix B Average Monthly Rainfall The following table presents the average monthly rainfall at the selected stations within the Lake Eyre Basin. The values are presented in mm.
Station January February March April May June July August September October November December
015524 24.36 26.28 20.31 13.36 14.82 12.21 8.69 8.05 6.60 14.42 16.36 23.37 015531 36.34 30.60 24.66 15.36 18.47 12.75 10.64 7.85 7.51 17.31 24.91 32.02 015546 40.08 46.40 38.82 23.78 19.32 16.20 18.74 10.54 7.80 22.90 24.58 35.12 015600 21.74 27.22 23.83 12.26 13.18 10.98 9.59 8.17 6.69 15.71 10.48 22.04 015620 43.97 52.72 18.78 15.13 15.59 5.10 8.21 5.09 3.21 12.13 18.27 29.46 015624 22.23 31.64 28.72 15.09 17.73 15.40 11.42 10.71 10.23 18.08 15.26 29.50 017004 17.92 17.77 13.97 7.95 9.59 13.81 7.80 7.93 8.42 11.78 9.91 13.90 017019 28.24 26.52 17.67 11.08 8.43 8.86 7.98 5.76 4.45 11.28 12.58 16.02 017028 27.42 22.04 21.04 11.10 12.35 12.11 10.32 6.53 7.71 11.40 11.17 16.83 017030 18.82 22.45 11.04 8.00 8.02 11.17 6.91 6.14 6.96 8.63 8.74 14.90 017031 18.32 21.32 14.53 10.96 14.27 14.07 9.91 9.19 10.43 13.54 11.45 16.44 017067 15.63 17.58 15.20 7.41 10.04 12.89 8.43 5.06 5.72 10.07 11.14 11.80 020010 21.61 21.62 15.44 17.25 20.68 20.21 14.11 14.71 16.44 19.92 17.09 18.72 030041 109.15 102.07 57.51 25.89 18.44 19.13 12.23 7.15 8.24 20.49 39.82 67.66 030133 88.99 100.20 56.45 17.33 15.93 14.45 10.31 3.61 6.99 15.10 27.27 54.25 035069 79.90 74.87 58.19 37.58 33.66 26.73 25.91 17.62 18.73 33.48 45.95 66.03 036007 83.69 77.36 61.30 36.76 31.74 23.59 23.56 16.37 14.82 29.11 37.28 60.48 036037 86.49 82.34 60.60 30.93 23.61 19.24 17.06 9.64 11.92 22.39 32.76 50.58 037002 73.54 82.29 52.27 26.53 21.80 14.32 13.37 5.82 8.69 20.49 27.21 47.80 037005 64.36 59.34 50.30 26.46 22.79 16.96 14.36 7.10 11.69 20.59 24.06 38.22 037010 93.85 91.54 55.83 13.27 11.32 10.37 5.70 2.74 6.15 14.42 29.01 60.07 037024 61.45 64.85 39.10 11.91 12.41 8.94 8.43 3.92 5.55 13.73 21.01 36.20 038002 24.98 29.85 16.88 9.47 11.41 10.02 11.07 6.58 5.73 11.70 14.20 15.51 038003 46.95 51.36 37.44 14.40 13.27 10.27 9.55 5.75 7.05 15.66 21.39 30.18 038007 33.13 42.42 21.94 15.97 12.17 10.42 10.05 6.38 8.11 10.50 18.55 19.83 038010 37.74 45.46 23.10 8.27 12.03 7.42 8.91 4.16 4.39 13.47 13.61 26.51 038022 52.13 45.09 31.44 13.40 13.60 10.02 8.87 3.80 5.19 13.69 15.95 25.79 038024 39.60 49.91 39.68 19.77 18.36 16.18 15.16 9.88 10.53 18.26 20.85 29.98 045011 38.33 40.27 30.72 20.12 17.70 16.15 12.86 10.47 10.15 16.39 22.63 24.43 046003 19.56 19.72 14.98 14.23 21.87 17.93 15.60 15.65 15.02 18.73 16.93 20.22 046006 22.00 24.87 17.42 9.75 13.74 13.89 12.77 8.99 10.50 15.41 10.71 16.66

Lake Eyre Hydrology Appendices
I:\WCMS\Projects\WC03272\Deliverables\final report\LakeEyreHydrol_App_final.doc PAGE 29
Appendix C Wet / Dry Spell Length and Cumulative Surplus / Deficit Analysis
This appendix provides details about the techniques used and some intermediate results for the wet and dry run length analysis of Section 3.3.1.
The annual median and frequencies of runs of consecutive wet or dry years were calculated for the gridded annual rainfall and the longest continuous (no missing years) record length (N) at each selected annual rainfall station. Figure B-1 shows an example time series of annual rainfall relative to the median for the Birdsville Police Station (N = 105). Figure B-2 shows the frequency distribution of run lengths of wet and dry years for the same station.
-200
-100
0
100
200
300
400
500
1898 1908 1918 1928 1938 1948 1958 1968 1978 1988 1998
Time (Years)
Ann
ual P
reci
pita
tion
- Med
ian
Prec
ipita
tion
(mm
)
WetDry
Figure C-1 Time series of annual rainfall relative to the median (N = 105) for Birdsville
Police Station (38002).

Lake Eyre Hydrology Appendices
I:\WCMS\Projects\WC03272\Deliverables\final report\LakeEyreHydrol_App_final.doc PAGE 30
0
2
4
6
8
10
12
14
16
1 2 3 4 5 6 7 8
Run Length of Wet or Dry years
Freq
uenc
y
WetDry
Figure C-2 Frequency distribution of run lengths of wet and dry years for Birdsville
Police Station (38002).
It is not clear from Figure B-1 and Figure B-2 whether the annual rainfall record at Birdsville Police Station contains run lengths of wet and dry years that are similar to, or have a bias toward longer or shorter run lengths than expected, for a series that can be described by a random or first-order linear autoregressive, AR1, model. To compare the distribution of wet and dry run lengths at a station with other stations and with a theoretical model (eg: random or AR1), the run length skewness (g) developed in Peel et al. (2004) is calculated for the annual gridded and selected rainfall station data. The run length skewness is an objective summary statistic of the frequency distribution of runs and is defined as:
11
3
−=∑=
N
bag
j
iii
(1)
where ai is the frequency of run length bi and j is the longest observed run length. For the Birdsville Police Station data the run length skewness for wet years gwet = 10.4 and for dry years gdry = 7.7. Based on the raw gwet and gdry values the annual rainfall at Birdsville tends to have longer runs of wet years than dry years. Confidence intervals for estimates of g relative to a random (population lag-one serial correlation ρ1 = 0) or AR1 (ρ1 ≠ 0) process were simulated in Peel et al (2004) for a range of sample sizes and ρ1 values.

Lake Eyre Hydrology Appendices
I:\WCMS\Projects\WC03272\Deliverables\final report\LakeEyreHydrol_App_final.doc PAGE 31
The sample lag-one serial correlation (r1) = 0.213 at Birdsville is significantly different from r1 = 0 at the 5% level of statistical significance (using the significance test of Yevjevich, 1972), so the annual rainfall at Birdsville is not described by a random process. The 90% confidence interval for g at Birdsville Police Station with N = 105 and r1 = 0.213 is g5% = 4.4 and g95% = 15.1 (see Peel et al., 2004 for equations). The 90% confidence interval for g is applicable for both gwet and gdry. Since the observed values of gwet and gdry fall within the 90% confidence interval for g, then the run lengths observed in the annual rainfall at Birdsville, for wet and dry years, are consistent with expectations for an AR1 process with r1 = 0.213.
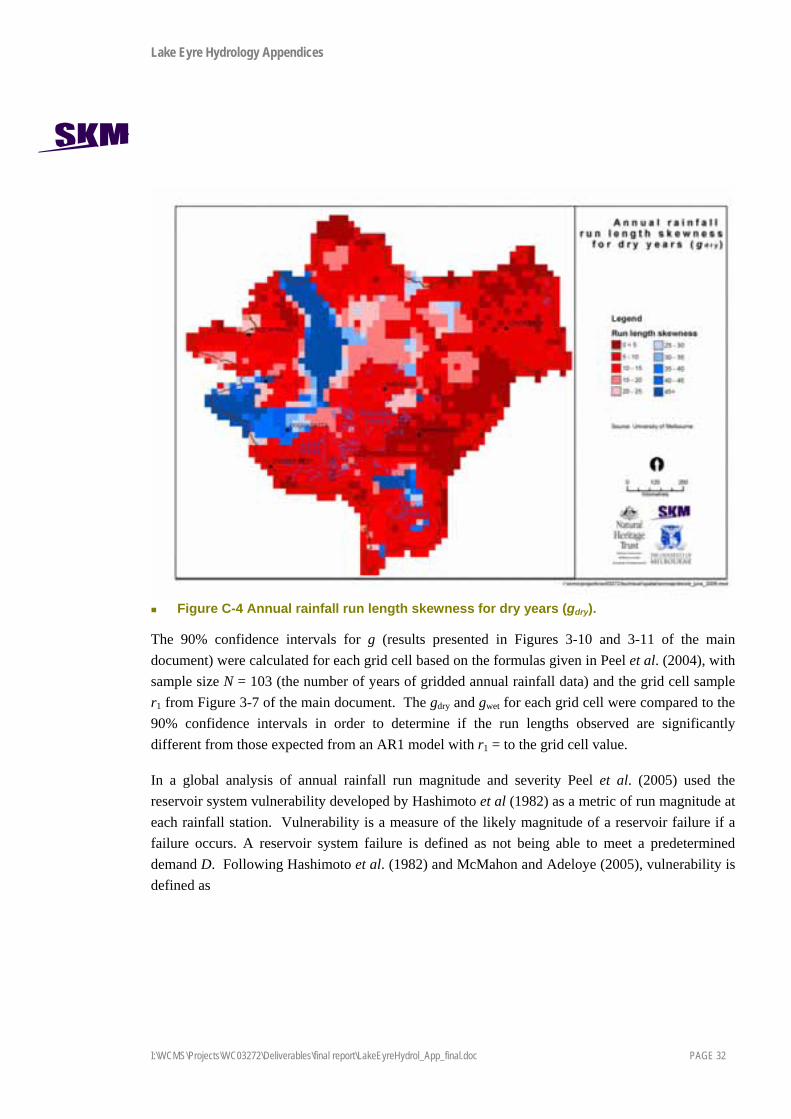
Figure B-3 and Figure B-4 show the run length skewness for wet (gwet) and dry (gdry) years respectively for the gridded annual rainfall data. The most striking similarity between the two figures is the region of high gwet and gdry in the Simpson Desert, which is a result of the unusually high values of r1 noted previously (Figure 3-7 of the main document) in this region for the gridded annual rainfall data. Generally gdry is greater than gwet at a grid cell from the north central part of the catchment through the west to the south of the LEB, indicating that runs of dry years are longer than runs of wet years in these regions. The difference between gdry and gwet at a grid cell is not consistently positive or negative in the east of the LEB.
Figure C-3 Annual rainfall run length skewness for wet years (gwet).
Lake Eyre Hydrology Appendices
I:\WCMS\Projects\WC03272\Deliverables\final report\LakeEyreHydrol_App_final.doc PAGE 32
Figure C-4 Annual rainfall run length skewness for dry years (gdry).
The 90% confidence intervals for g (results presented in Figures 3-10 and 3-11 of the main document) were calculated for each grid cell based on the formulas given in Peel et al. (2004), with sample size N = 103 (the number of years of gridded annual rainfall data) and the grid cell sample r1 from Figure 3-7 of the main document. The gdry and gwet for each grid cell were compared to the 90% confidence intervals in order to determine if the run lengths observed are significantly different from those expected from an AR1 model with r1 = to the grid cell value.
In a global analysis of annual rainfall run magnitude and severity Peel et al. (2005) used the reservoir system vulnerability developed by Hashimoto et al (1982) as a metric of run magnitude at each rainfall station. Vulnerability is a measure of the likely magnitude of a reservoir failure if a failure occurs. A reservoir system failure is defined as not being able to meet a predetermined demand D. Following Hashimoto et al. (1982) and McMahon and Adeloye (2005), vulnerability is defined as

Lake Eyre Hydrology Appendices
I:\WCMS\Projects\WC03272\Deliverables\final report\LakeEyreHydrol_App_final.doc PAGE 33
( )
n
f
kk
f
shs
∑==′ 1
maxη (2)
where η′ is the vulnerability, fn is the number of continuous failure sequences and max(shk) is the
maximum deficit during the kth continuous sequence. The dimensionless form of vulnerability, used in this analysis, is
Dηη′
= (3)
In this analysis we define D as the median annual rainfall so that a ‘failure’ is any value equal to or below the median (a dry year, as previously defined). The maximum deficit (max(shk)) for each failure (run length of dry years) is the year in the run length with the largest deviation from the median. At Birdsville Police Station (see Figure 3-12 of the main report) the vulnerability η = 0.53. The dimensionless form of vulnerability has the useful feature of summarizing the run magnitude behaviour of a station into a single number ranging from 0 to 1, which allows simple comparison against other stations. The vulnerability metric is only applied to dry years in this analysis.

Lake Eyre Hydrology Appendices
I:\WCMS\Projects\WC03272\Deliverables\final report\LakeEyreHydrol_App_final.doc PAGE 34
Appendix D The SIMHYD Model SIMHYD is a lumped conceptual daily rainfall-runoff model. SIMHYD simulates daily runoff (surface runoff and baseflow) using daily precipitation and potential evapotranspiration as input data. SIMHYD is one of the most commonly used rainfall-runoff models in Australia, and has been extensively tested using data from across Australia (Chiew et al., 2002). SIMHYD is one of the rainfall-runoff models in RRL (Rainfall-Runoff Library), a software product in the Catchment Modelling Toolkit (www.toolkit.net.au/rrl).
The structure of the SIMHYD model with the seven model parameters highlighted in bold italics is presented in Figure D-1. In the model, daily rainfall is first intercepted by an interception store. The maximum daily interception is the lesser of the interception store capacity and potential evapotranspiration. Incident rainfall occurs only when daily rainfall exceeds the maximum daily interception.
F
S
IMAXinterception
store
RAINPET
INR
RM
O
SMF
SMS
SMSC
soilmoisture
store
RUNOFF
grou
ndw
ater
rech
arge
GW baseflow (BAS)groundwater
store
RECsaturation excess runoffand interflow (SRUN)
ET
infiltration excessrunoff (IRUN)
PET = areal potential evapotranspiration (input data)IMAX = lesser of { INSC, PET }INT = lesser of { IMAX, RAIN}INR = RAIN - INTRMO = lesser of { COEFF exp (-SQ x SMS/SMSC) , INR }IRUN = INR - RMOSRUN = SUB x SMS/SMSC x RMOREC = CRAK x SMS/SMSC x (RMO - SRUN)SMF = RMO - SRUN - RECPOT = PET - INTET = lesser of { 10 x SMS/SMSC , POT }BAS = K x GW
Model parametersINSC interception store capacity (mm)COEFF maximum infiltration loss (mm)SQ infiltration loss exponentSMSC soil moisture store capacity (mm)SUB constant of proportionality in interflow equationCRAK constant of proportionality in groundwater recharge equationK baseflow linear recession parameter
Figure D-1 Lumped conceptual daily rainfall-runoff model, SIMHYD
The incident rainfall is then subjected to an infiltration function. The incident rainfall that exceeds the infiltration capacity becomes infiltration excess runoff. The remaining moisture is subjected to

Lake Eyre Hydrology Appendices
I:\WCMS\Projects\WC03272\Deliverables\final report\LakeEyreHydrol_App_final.doc PAGE 35
a soil moisture function that diverts water to the stream (as saturation excess runoff and interflow), groundwater store (recharge) and soil moisture store. The saturation excess runoff/interflow is first estimated as a linear function of the soil wetness (soil moisture level divided by the soil moisture store capacity). The equation used here attempts to mimic both the interflow and saturation excess runoff processes (with the soil wetness used to reflect parts of the catchment that are saturated from which saturation excess runoff can occur). Groundwater recharge is then estimated, also a linear function of the soil wetness. The remaining moisture flows into the soil moisture store.
Evapotranspiration from the soil moisture store is estimated as a linear function of the soil wetness, but is not allowed to exceed the potential rate (potential evapotranspiration less intercepted water). The soil moisture store has a finite capacity and overflows into the groundwater store. Baseflow from the groundwater store is simulated as a linear recession from the store.
SIMHYD simulates three components of runoff: infiltration excess runoff; saturation excess runoff/interflow; and baseflow. The infiltration excess runoff and saturation excess runoff/interflow are considered as surface runoff and baseflow is considered as subsurface runoff.

Lake Eyre Hydrology Appendices
I:\WCMS\Projects\WC03272\Deliverables\final report\LakeEyreHydrol_App_final.doc PAGE 36
Appendix E Transmission Losses A major feature of the large rivers of the Lake Eyre Basin is their large transmission losses that vary non-linearly with discharge. A systematic decrease in flood discharge with distance travelled downstream is not uncommon with many arid zone rivers, particularly if tributary input also decreases downstream. However, in the upper reaches of the LEB rivers, discharge increases with increasing catchment area. The change from a positive relationship between flood discharge and catchment area to a negative relationship in the major rivers of the LEB coincides with the junctions of the major tributaries of the rivers. Downstream of these junctions, the river/floodplain width widens dramatically (known as the ‘Channel Country’), fewer large tributaries occur and the river flows through more arid areas. This change in transmission behaviour is illustrated for the Cooper Creek catchment in Figure C-1 where the mean annual discharge (ML) is plotted against catchment area (km2) for all gauging stations in this catchment with records of greater than 12 years. The mean annual discharge increases as catchment area increases for all stations in the upper reach up to Currareva (near Windorah). Immediately upstream of the Currareva gauging station, the major tributaries of Cooper Creek (Thomson and Barcoo Rivers) join. Between Currareva and the next gauging station (Nappa Merrie), mean annual discharge decreases. A similar pattern occurs in the Georgina River, with mean annual discharge increasing with catchment area up to the junction of the Georgina River with two of its major tributaries; Burke and Hamilton Rivers. In the Diamantina River catchment there are insufficient gauging stations to determine this relationship but discharge decreases with increasing catchment area between Diamantina Lakes and Birdsville, downstream of the junction of a major tributary (Mayne River).
The transmission loss behaviour of flood events in the ‘Channel Country’ (middle reaches) of the large rivers is illustrated for Cooper Creek and the Diamantina River (Figure C-2). Following the approach of Knighton and Nanson (1994), the analysis of transmission loss using gauging station data utilised an event-based methodology. The correlation of pulses over the long reaches was facilitated by the flow occurring as discrete events and often starting and ending in zero flow at the upper and lower ends of the reach. Correlated flow events often contained more than one peak (particularly at the upstream gauging station) but generally had one well-defined maximum flow pulse peak at the downstream end. In Figure C-2, data on the correlated pulses is plotted as the ratio of the total downstream to upstream flow volume (y-axis) against the upstream total flow volume (x-axis). Flow pulses generated from runoff within the reach were excluded as much as possible from the analysis. These pulses were identified by having very high ratios of peak discharge to total volume at the downstream gauging station, or having a ratio of downstream to upstream volume greater than one. The latter only occurred in the Diamantina reach.

Lake Eyre Hydrology Appendices
I:\WCMS\Projects\WC03272\Deliverables\final report\LakeEyreHydrol_App_final.doc PAGE 37
NMCS
L
BL
BADT
100
1,000
10,000
100,000
1,000,000
10,000,000
100 1,000 10,000 100,000 1,000,000
Catchment area (km2)
Mea
n an
nual
dis
char
ge (M
L)
Figure E-1. Relationship between catchment area and mean annual discharge for gauging stations in Cooper Creek.
Gauging stations are coded as following: NM-Nappa Merrie, C-Currareva, S-Stonehenge, L-Longreach, BL-Blackall, BA-Barcaldine, D-Darr, T-Torrens. All data from Queensland Natural Resources and Mines.

Lake Eyre Hydrology Appendices
I:\WCMS\Projects\WC03272\Deliverables\final report\LakeEyreHydrol_App_final.doc PAGE 38
0.0
0.2
0.4
0.6
0.8
1.0
1 10 100 1,000 10,000 100,000
Currareva Total Flood Volume (106 m3)
Tran
smis
sion
Rat
io (V
NM/V
C)
0.0
0.2
0.4
0.6
0.8
1.0
1 10 100 1,000 10,000
Diamantina Lakes Total Flood Volume (106 m3)
Tran
smis
sion
Rat
io (V
B/V
DL)
Figure E-2. Transmission losses for Currareva to Nappa Merrie reach of Cooper Creek (upper panel) and Diamantina Lakes to Birdsville reach of the Diamantina River (lower panel).
The graphs show the ratio between the downstream and upstream total volume of the flood pulse on the y-axis (‘Transmission Ratio’) and the upstream total volume of the flood pulse is shown on the x-axis. Also shown are the 1500 x 106 m3 (Diamantina River) and 3000 x 106 m3 (Cooper Creek) threshold volumes.
Lake Eyre Hydrology Appendices
I:\WCMS\Projects\WC03272\Deliverables\final report\LakeEyreHydrol_App_final.doc PAGE 39
The mean ratio between upstream and downstream flow volumes was similar for both reaches with the Cooper Creek reach having a mean value of 0.23 and the Diamantina River reach having a mean value of 0.22. Three main points stand out in Figure C-2 for both reaches:
The transmission throughput varies non-linearly with flood size and in a similar fashion for both rivers. For both reaches, the transmission throughput generally declines as flood event volume increases towards a threshold value (see next point) before generally increasing at flow volumes above the threshold value.
Transmission losses are generally very high for floods below a threshold of approximately 1500 x 106 m3 (Diamantina River) to 3000 x 106 m3 (Cooper Creek) reaching levels of 96% loss for both rivers (see Figure C-2). For the Diamantina reach, flood volumes close to the threshold value represent events that utilise much of the available floodplain but do not receive any significant in-reach runoff (Costelloe et al., 2003).
There is considerable scatter in the data. Much of this scatter can be attributed to significant in-reach runoff being generated for some events, particularly at transmission ratios of greater than 0.4. Knighton and Nanson (1994) postulated that slightly higher transmission ratios at lower flood volumes may be due to lower transmission losses for flow events largely confined to the primary channel network. For very large floods (above the volume threshold discussed above), the contribution of in-reach runoff also increases due to heavier rainfall in the lower reaches associated with large floods (southerly incursion of the rain bearing systems). For instance, the mid-Diamantina reach shows a positive correlation (adjusted R2=0.69, p=0.002) between the annual rainfall within the reach and the ratio between the annual outflow volume (Birdsville) and the annual inflow volume (Diamantina Lakes).
The relationship between absolute transmission loss volumes (i.e. upstream flood volume minus downstream flood volume) and the upstream total flood volume is also examined for the two reaches (Figure C-3). The near-linear relationship between absolute transmission losses and upstream flow pulse volume indicates that no apparent threshold effects occur with transmission losses as flood size increases. Threshold effects may be expected above bankfull discharge when floodplain inundation and storage occurs. The apparent absence of such effects suggests that the transmission loss–discharge relationship mostly reflects the increase in inundated area with discharge as flow is spread across a number of channels. The increase in floodplain storage is likely to be more incremental for the anastomosing rivers of the LEB ‘Channel Country’ than in rivers with a single primary channel. Scarcity of satellite data during the period of analysis (1966-1988) prevented the relationship between inundated area and discharge from being comprehensively tested. The increased scatter at large flood volumes shown by the Diamantina reach data coincides with very large flood events associated with increased rainfall (and hence runoff) in the reach. The influence of in-reach runoff on the transmission loss relationship is not as obvious for the Cooper Creek reach. Three of the four largest flood events measured for the Diamantina reach had

Lake Eyre Hydrology Appendices
I:\WCMS\Projects\WC03272\Deliverables\final report\LakeEyreHydrol_App_final.doc PAGE 40
transmission ratios greater than one whereas no flood events had transmission ratios greater than 0.85 for the Cooper Creek reach.
Figure E-3. Relationship between transmission losses (upstream flood volume less downstream flood volume) and the upstream flood volume for the middle reaches of Cooper Creek and the Diamantina River.
Three major causes of transmission losses have been identified for these rivers (Knighton and Nanson 1994):
1) Evaporation from the free water surface as floods move slowly through the reaches. This evaporation would occur at the potential rate.
2) Infiltration to the soil moisture store that is depleted by evapotranspiration and some deep percolation to shallow unconfined groundwater aquifers.
3) Terminal storage (or drainage diffusion) where floodwaters become disconnected in low-lying areas. This process acts as a short term cause of transmission loss before these surface stores are depleted by evapotranspiration, and to a lesser extent by deep percolation.
All three of these causes of transmission losses will increase as the inundated area increases. As a result, transmission loss as a proportion of total flood volume is sensitive to the areal extent of flooding for a given flood size. Of the three major causes of transmission loss, evaporation at the potential rate from the free water surface is the best constrained. Little is known about the rate of deep percolation to unconfined alluvial aquifers that occurs within these river systems. Preliminary analysis of variations in groundwater levels in alluvial aquifers in response to flow events (J.Costelloe, University of Melbourne, unpublished data) indicates that fluxes generally showed exponentially decaying patterns of recharge over time and initial rates of recharge ranged between 5 and 57 mm/d. These rates were highest for waterbodies and floodplain surfaces that had been
1
10
100
1,000
10,000
100,000
1 10 100 1,000 10,000 100,000
Currareva Total Flood Volume (106 m3)
Vol
ume
Loss
(106 m
3 )
1
10
100
1,000
10,000
100,000
1 10 100 1,000 10,000 100,000
Diamantina Lakes Total Flood Volume (106 m3)
Vol
ume
Loss
(106 m
3 )

Lake Eyre Hydrology Appendices
I:\WCMS\Projects\WC03272\Deliverables\final report\LakeEyreHydrol_App_final.doc PAGE 41
inundated from a dry initial state. The extent of terminal storage as a short term cause of transmission losses is also poorly constrained. Modelling of the Diamantina Lakes to Birdsville reach of the Diamantina River (Costelloe et al., 2003) indicates that terminal storage is the largest cause of transmission losses during the passage of a flood event (Figure C-4). In that modelling exercise, the spatial distribution of floodwaters was simulated and evaporation was set at the potential rate for water held in a surface store and at a calibrated rate from the soil moisture store. The loss rate due to deep percolation was set at 1 mm/day and is probably over-estimated over the passage of the flood event. If the percolation losses were reduced then the short-term loss to the terminal storage or the longer term loss via evapotranspiration would need to rise in compensation.
The mix of processes involved in transmission losses in the upper reaches of the major rivers of the LEB and also in the rivers draining the western side of the basin are likely to differ from those operating in the middle and lower reaches of the major rivers. The former group of rivers and reaches have much less extensive floodplain areas, higher gradients and contain an increased proportion of coarser-grained sediments in their channel and floodplain. As a result, deep percolation may be a more dominant process and with less evaporation loss from open water bodies or short-term terminal storage, in comparison to the large rivers.
1
10
100
1,000
10,000
Jan-74 Jan-75 Jan-76 Jan-77 Jan-78 Jan-79 Jan-80
Dai
ly V
olum
e (1
06 m3 )
Terminal Storage Evaporation Deep Percolation
Figure E-4. Daily simulated fluctuations in terminal storage and losses from evaporation and deep percolation for the period 1974-1980 in the Diamantina Lakes to Birdsville reach of the Diamantina River.

Lake Eyre Hydrology Appendices
I:\WCMS\Projects\WC03272\Deliverables\final report\LakeEyreHydrol_App_final.doc PAGE 42
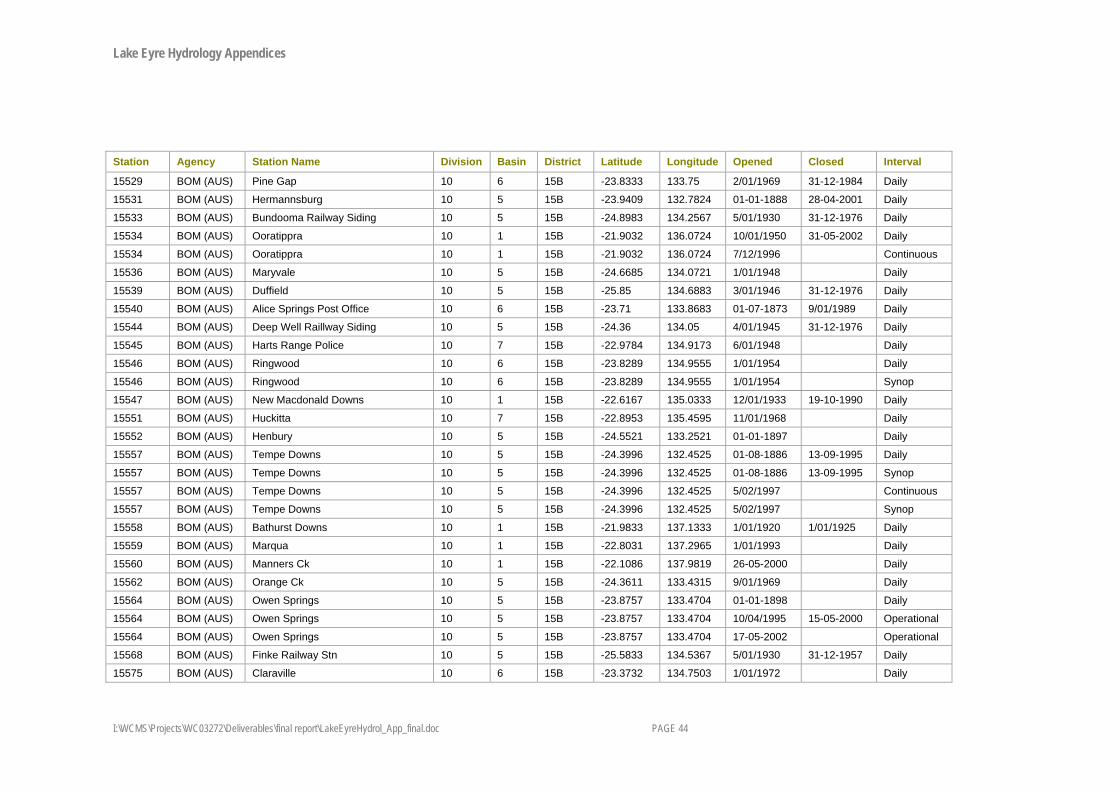
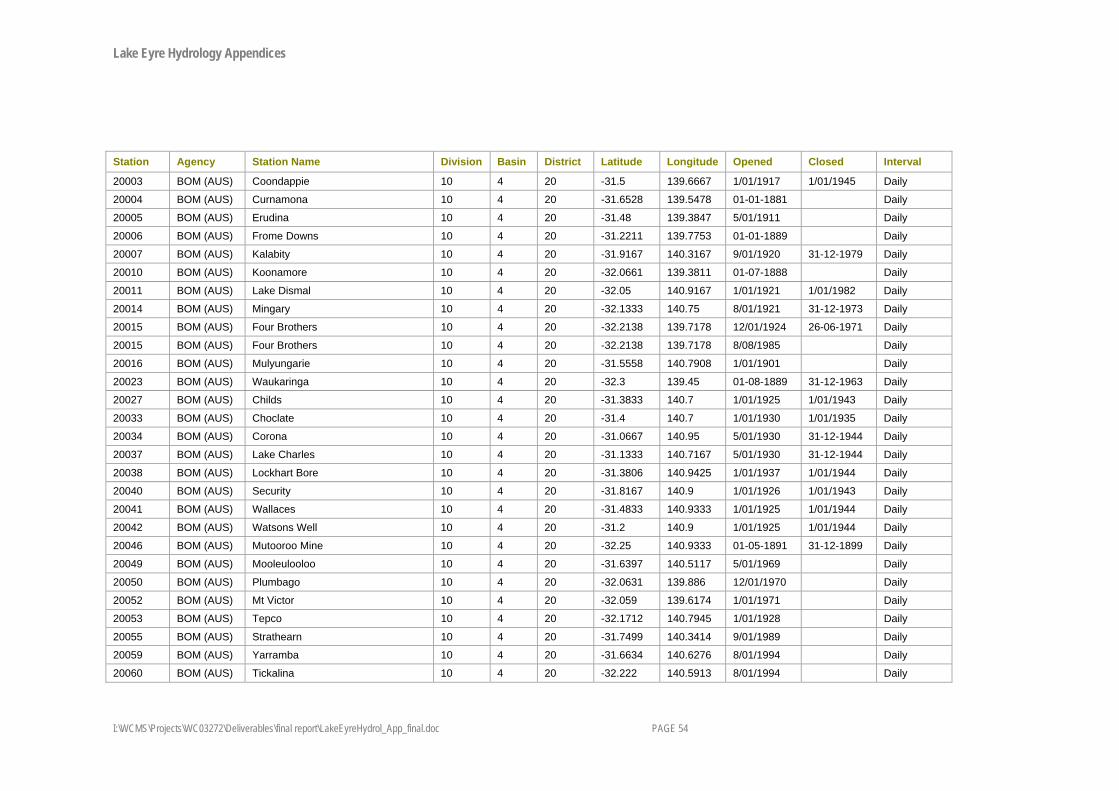
Appendix F List of Rainfall Gauges in the Lake Eyre Basin

Lake Eyre Hydrology Appendices
I:\WCMS\Projects\WC03272\Deliverables\final report\LakeEyreHydrol_App_final.doc PAGE 43
Station Agency Station Name Division Basin District Latitude Longitude Opened Closed Interval
15004 BOM (AUS) Austral Downs 10 1 15A -20.502 137.7744 6/01/1914 Daily
15005 BOM (AUS) Avon Downs 10 1 15A -20.0298 137.4906 1/01/1909 18-11-1968 Daily
15005 BOM (AUS) Avon Downs 10 1 15A -20.0298 137.4906 1/01/1909 18-11-1968 Synop
15005 BOM (AUS) Avon Downs 10 1 15A -20.0298 137.4906 24-05-1970 Daily
15005 BOM (AUS) Avon Downs 10 1 15A -20.0298 137.4906 24-05-1970 Synop
15019 BOM (AUS) Lake Nash 10 1 15A -20.9645 137.9214 01-01-1891 Daily
15026 BOM (AUS) Ranken 10 1 15A -19.6014 136.9078 10/01/1908 Daily
15040 BOM (AUS) Soudan 10 1 15A -20.0517 137.0186 1/01/1950 Daily
15075 BOM (AUS) Charles R CDW 10 6 15A -23.65 133.7833 9/01/1958 31-12-1963 Daily
15077 BOM (AUS) Bond Springs 10 6 15A -23.55 133.9 5/01/1979 31-12-1979 Daily
15079 BOM (AUS) Barry Caves 10 1 15A -20.0467 136.67 3/01/1969 31-12-1975 Daily
15138 BOM (AUS) Avon Downs Police 10 1 15A -20.0228 137.4892 12/01/1963 31-12-1970 Daily
15151 BOM (AUS) Number 36 Bore 10 1 15A -19.2815 137.2441 11/01/1982 Daily
15503 BOM (AUS) Mount Riddock 10 7 15B -23.0364 134.6801 1/01/1966 Daily
15504 BOM (AUS) Dnieper 10 1 15B -22.625 135.1933 7/01/1967 31-12-1971 Daily
15508 BOM (AUS) Allambi 10 6 15B -24.2691 134.4028 10/01/1968 Daily
15510 BOM (AUS) Mount Cavenagh 10 5 15B -25.9551 133.2111 3/01/1939 Daily
15512 BOM (AUS) Jay Ck 10 5 15B -23.795 133.5017 12/01/1967 19-10-1990 Daily
15516 BOM (AUS) Jinka 10 7 15B -22.9292 135.7136 12/01/1968 Daily
15517 BOM (AUS) Temple Bar 10 6 15B -23.7833 133.8667 1/01/1955 1/01/1959 Daily
15519 BOM (AUS) Palmer Valley 10 5 15B -24.7496 133.2316 1/01/1953 Daily
15519 BOM (AUS) Palmer Valley 10 5 15B -24.7496 133.2316 30-06-1996 Continuous
15521 BOM (AUS) The Garden 10 6 15B -23.2837 134.4239 1/01/1954 Daily
15524 BOM (AUS) Idracowra 10 5 15B -24.9951 133.7876 01-04-1888 Daily
15526 BOM (AUS) Finke Post Office 10 5 15B -25.5833 134.5667 9/01/1938 31-12-1980 Daily
15526 BOM (AUS) Finke Post Office 10 5 15B -25.5833 134.5667 9/01/1938 31-12-1980 Synop
Lake Eyre Hydrology Appendices
I:\WCMS\Projects\WC03272\Deliverables\final report\LakeEyreHydrol_App_final.doc PAGE 44
Station Agency Station Name Division Basin District Latitude Longitude Opened Closed Interval
15529 BOM (AUS) Pine Gap 10 6 15B -23.8333 133.75 2/01/1969 31-12-1984 Daily
15531 BOM (AUS) Hermannsburg 10 5 15B -23.9409 132.7824 01-01-1888 28-04-2001 Daily
15533 BOM (AUS) Bundooma Railway Siding 10 5 15B -24.8983 134.2567 5/01/1930 31-12-1976 Daily
15534 BOM (AUS) Ooratippra 10 1 15B -21.9032 136.0724 10/01/1950 31-05-2002 Daily
15534 BOM (AUS) Ooratippra 10 1 15B -21.9032 136.0724 7/12/1996 Continuous
15536 BOM (AUS) Maryvale 10 5 15B -24.6685 134.0721 1/01/1948 Daily
15539 BOM (AUS) Duffield 10 5 15B -25.85 134.6883 3/01/1946 31-12-1976 Daily
15540 BOM (AUS) Alice Springs Post Office 10 6 15B -23.71 133.8683 01-07-1873 9/01/1989 Daily
15544 BOM (AUS) Deep Well Raillway Siding 10 5 15B -24.36 134.05 4/01/1945 31-12-1976 Daily
15545 BOM (AUS) Harts Range Police 10 7 15B -22.9784 134.9173 6/01/1948 Daily
15546 BOM (AUS) Ringwood 10 6 15B -23.8289 134.9555 1/01/1954 Daily
15546 BOM (AUS) Ringwood 10 6 15B -23.8289 134.9555 1/01/1954 Synop
15547 BOM (AUS) New Macdonald Downs 10 1 15B -22.6167 135.0333 12/01/1933 19-10-1990 Daily
15551 BOM (AUS) Huckitta 10 7 15B -22.8953 135.4595 11/01/1968 Daily
15552 BOM (AUS) Henbury 10 5 15B -24.5521 133.2521 01-01-1897 Daily
15557 BOM (AUS) Tempe Downs 10 5 15B -24.3996 132.4525 01-08-1886 13-09-1995 Daily
15557 BOM (AUS) Tempe Downs 10 5 15B -24.3996 132.4525 01-08-1886 13-09-1995 Synop
15557 BOM (AUS) Tempe Downs 10 5 15B -24.3996 132.4525 5/02/1997 Continuous
15557 BOM (AUS) Tempe Downs 10 5 15B -24.3996 132.4525 5/02/1997 Synop
15558 BOM (AUS) Bathurst Downs 10 1 15B -21.9833 137.1333 1/01/1920 1/01/1925 Daily
15559 BOM (AUS) Marqua 10 1 15B -22.8031 137.2965 1/01/1993 Daily
15560 BOM (AUS) Manners Ck 10 1 15B -22.1086 137.9819 26-05-2000 Daily
15562 BOM (AUS) Orange Ck 10 5 15B -24.3611 133.4315 9/01/1969 Daily
15564 BOM (AUS) Owen Springs 10 5 15B -23.8757 133.4704 01-01-1898 Daily
15564 BOM (AUS) Owen Springs 10 5 15B -23.8757 133.4704 10/04/1995 15-05-2000 Operational
15564 BOM (AUS) Owen Springs 10 5 15B -23.8757 133.4704 17-05-2002 Operational
15568 BOM (AUS) Finke Railway Stn 10 5 15B -25.5833 134.5367 5/01/1930 31-12-1957 Daily
15575 BOM (AUS) Claraville 10 6 15B -23.3732 134.7503 1/01/1972 Daily

Lake Eyre Hydrology Appendices
I:\WCMS\Projects\WC03272\Deliverables\final report\LakeEyreHydrol_App_final.doc PAGE 45
Station Agency Station Name Division Basin District Latitude Longitude Opened Closed Interval
15577 BOM (AUS) Delmore Downs 10 1 15B -22.4515 134.8189 1/01/1950 Daily
15577 BOM (AUS) Delmore Downs 10 1 15B -22.4515 134.8189 7/09/1996 Continuous
15578 BOM (AUS) Delny 10 1 15B -22.5528 134.8173 3/01/1972 24-05-2000 Daily
15579 BOM (AUS) Numery 10 6 15B -24.0137 135.4268 1/01/1974 Daily
15579 BOM (AUS) Numery 10 6 15B -24.0137 135.4268 7/06/1996 Continuous
15581 BOM (AUS) Engoordina 10 6 15B -25.0667 134.35 1/01/1943 1/01/1946 Daily
15583 BOM (AUS) Areyonga 10 5 15B -24.0732 132.2712 1/01/1952 25-07-2002 Daily
15584 BOM (AUS) Argadargada 10 1 15B -21.6743 136.6654 11/01/1968 Daily
15585 BOM (AUS) Ammaroo 10 1 15B -21.7498 135.2382 1/01/1956 Daily
15586 BOM (AUS) Arapunya 10 1 15B -22.2875 135.7233 1/01/1961 Daily
15587 BOM (AUS) Annitowa 10 1 15B -21.2105 136.4752 1/01/1966 Daily
15588 BOM (AUS) Ambalindum 10 6 15B -23.3845 134.6841 1/01/1966 Daily
15589 BOM (AUS) Areyonga Welfare Settlement 10 5 15B -24.0667 132.2667 1/01/1966 1/01/1975 Daily
15590 BOM (AUS) Alice Springs Airport 10 6 15B -23.7951 133.889 11/01/1941 Daily
15590 BOM (AUS) Alice Springs Airport 10 6 15B -23.7951 133.889 11/01/1941 Synop
15590 BOM (AUS) Alice Springs Airport 10 6 15B -23.7951 133.889 6/01/1951 Continuous
15591 BOM (AUS) Alice Springs Township 10 6 15B -23.7 133.7 9/01/1958 31-12-1960 Daily
15592 BOM (AUS) Big Dipper 10 6 15B -23.5833 133.8333 9/01/1958 31-12-1963 Daily
15593 BOM (AUS) Alcoota 10 1 15B -22.8211 134.4508 10/01/1950 Daily
15594 BOM (AUS) Arltunga 10 6 15B -23.4635 134.6865 10/01/1900 Daily
15594 BOM (AUS) Arltunga 10 6 15B -23.4635 134.6865 10/01/1900 Synop
15594 BOM (AUS) Arltunga 10 6 15B -23.4635 134.6865 24-11-2000 Continuous
15595 BOM (AUS) Andado 10 6 15B -25.4108 135.2906 4/01/1951 Daily
15596 BOM (AUS) Bushy Park 10 1 15B -22.9027 134.05 1/01/1954 1/01/1983 Daily
15596 BOM (AUS) Bushy Park 10 1 15B -22.9027 134.05 24-05-2000 Daily
15597 BOM (AUS) Charlotte Waters 10 5 15B -25.9333 134.9167 01-01-1874 1/01/1938 Daily
15598 BOM (AUS) Derry Downs 10 1 15B -22.08 135.3267 11/01/1966 31-12-1977 Daily
15599 BOM (AUS) Ewaninga 10 6 15B -23.9817 133.9283 3/01/1930 31-12-1979 Daily

Lake Eyre Hydrology Appendices
I:\WCMS\Projects\WC03272\Deliverables\final report\LakeEyreHydrol_App_final.doc PAGE 46
Station Agency Station Name Division Basin District Latitude Longitude Opened Closed Interval
15600 BOM (AUS) New Crown 10 5 15B -25.6766 134.8333 1/01/1950 Daily
15602 BOM (AUS) Jervois 10 7 15B -22.9495 136.1444 1/01/1966 Daily
15602 BOM (AUS) Jervois 10 7 15B -22.9495 136.1444 1/01/1966 Synop
15602 BOM (AUS) Jervois 10 7 15B -22.9495 136.1444 1/01/1968 Continuous
15603 BOM (AUS) Kulgera 10 5 15B -25.8425 133.3022 10/01/1968 Daily
15603 BOM (AUS) Kulgera 10 5 15B -25.8425 133.3022 10/01/1968 Synop
15603 BOM (AUS) Kulgera 10 5 15B -25.8425 133.3022 7/02/1996 Continuous
15604 BOM (AUS) Lucy Ck 10 7 15B -22.441 136.2916 3/01/1966 Daily
15604 BOM (AUS) Lucy Ck 10 7 15B -22.441 136.2916 7/11/1996 Continuous
15605 BOM (AUS) Lilla Ck 10 5 15B -25.5607 134.0712 1/01/1966 Daily
15605 BOM (AUS) Lilla Ck 10 5 15B -25.5607 134.0712 7/03/1996 Continuous
15610 BOM (AUS) Indiana 10 6 15B -23.3292 135.44 1/01/1966 Daily
15613 BOM (AUS) Plenty Downs 10 7 15B -23.1 136.2333 1/01/1961 1/01/1962 Daily
15614 BOM (AUS) Rumbalara 10 6 15B -25.3333 134.4833 12/01/1929 11/04/1981 Daily
15615 BOM (AUS) Rodinga Railway Siding 10 5 15B -24.5567 134.0817 3/01/1930 31-12-1978 Daily
15616 BOM (AUS) Ross 10 6 15B -23.5927 134.4937 10/01/1966 Daily
15617 BOM (AUS) Santa Teresa 10 6 15B -24.1313 134.3737 9/01/1966 Daily
15618 BOM (AUS) Tobermorey 10 1 15B -22.2747 137.9733 11/01/1966 Daily
15618 BOM (AUS) Tobermorey 10 1 15B -22.2747 137.9733 7/11/1996 Continuous
15619 BOM (AUS) Todd 10 6 15B -23.8398 134.5089 10/01/1954 Daily
15620 BOM (AUS) Tarlton Downs 10 7 15B -22.6577 136.7998 1/01/1953 Daily
15622 BOM (AUS) Umbeara 10 5 15B -25.7533 133.685 11/01/1966 31-12-1969 Daily
15623 BOM (AUS) Undoolya 10 6 15B -23.6938 134.0354 01-01-1898 Daily
15624 BOM (AUS) Victory Downs 10 5 15B -25.9891 132.9748 1/01/1945 Daily
15627 BOM (AUS) Horseshoe Bend 10 5 15B -25.2141 134.2431 1/01/1974 Daily
15628 BOM (AUS) Alice Springs Golf Club 10 6 15B -23.7233 133.8792 8/01/1990 21-05-2000 Daily
15630 BOM (AUS) Heavitree Gap 10 6 15B -23.7333 133.8667 01-01-1890 1/01/1911 Daily
15631 BOM (AUS) Bond Springs Homestead 10 6 15B -23.5409 133.921 4/01/1901 Daily

Lake Eyre Hydrology Appendices
I:\WCMS\Projects\WC03272\Deliverables\final report\LakeEyreHydrol_App_final.doc PAGE 47
Station Agency Station Name Division Basin District Latitude Longitude Opened Closed Interval
15633 BOM (AUS) Palm Valley 10 5 15B -24.0636 132.7444 5/01/1981 Daily
15633 BOM (AUS) Palm Valley 10 5 15B -24.0636 132.7444 5/01/1981 Synop
15633 BOM (AUS) Palm Valley 10 5 15B -24.0636 132.7444 10/04/1995 Operational
15638 BOM (AUS) Glen Helen Lodge 10 5 15B -23.6854 132.6728 9/01/1986 Daily
15642 BOM (AUS) Wallace Rock Hole 10 5 15B -24.1267 133.0848 1/01/1986 Daily
15645 BOM (AUS) Deep Well 10 6 15B -24.2992 134.1439 1/01/1966 Daily
15646 BOM (AUS) Waite 10 1 15B -22.4787 134.5307 1/01/1991 Daily
15647 BOM (AUS) Atula 10 7 15B -23.2531 136.3816 1/01/1979 Daily
15648 BOM (AUS) Alice Springs East Side 10 6 15B -23.6925 133.8978 1/01/1982 Daily
15653 BOM (AUS) Gemtree Park 10 1 15B -22.9689 134.2415 1/01/1990 Daily
15654 BOM (AUS) Mereenie 10 5 15B -23.9953 131.5533 7/01/1990 Daily
15655 BOM (AUS) Atitjere 10 7 15B -22.9838 134.9359 1/01/1990 Daily
15656 BOM (AUS) Todd R Downs 10 6 15B -24.2581 135.2707 7/01/1986 Daily
15662 BOM (AUS) Alice Springs Airport Tbrg 10 6 15B -23.8083 133.8833 20-01-1993 9/04/1997 Continuous
15667 BOM (AUS) Ormiston Gorge 10 5 15B -23.6338 132.7311 5/01/1971 Daily
15668 BOM (AUS) Ormiston Knoll 10 5 15B -23.6521 132.7323 1/07/1998 Continuous
15668 BOM (AUS) Ormiston Knoll 10 5 15B -23.6521 132.7323 1/07/1998 Operational
15670 BOM (AUS) Old Andado 10 6 15B -25.3792 135.4287 23-11-2000 Continuous
16007 BOM (AUS) Coober Pedy 10 4 16 -29.0054 134.7551 1/01/1921 Daily
16007 BOM (AUS) Coober Pedy 10 4 16 -29.0054 134.7551 1/01/1921 Synop
16012 BOM (AUS) Eringa 10 5 16 -26.2783 134.7233 1/01/1931 1/01/1975 Daily
16019 BOM (AUS) Kenmore Park 10 5 16 -26.3292 132.4467 7/01/1947 31-12-1983 Daily
16047 BOM (AUS) Todmorden 10 5 16 -27.1419 134.7578 5/01/1949 Daily
16064 BOM (AUS) Granite Downs 10 5 16 -26.9383 133.4967 7/01/1965 30-09-1996 Daily
16079 BOM (AUS) Spare Tyre Hill 10 4 16 -27.7817 134.0267 28-06-1975 31-12-1975 Continuous
16082 BOM (AUS) Mount Barry 10 4 16 -28.2415 134.9899 12/01/1980 Daily
16083 BOM (AUS) Hamilton Stn 10 5 16 -26.7306 135.0753 1/01/1931 Daily
16091 BOM (AUS) Cadney Park 10 4 16 -27.9069 134.0546 11/07/1993 18-12-2003 Daily

Lake Eyre Hydrology Appendices
I:\WCMS\Projects\WC03272\Deliverables\final report\LakeEyreHydrol_App_final.doc PAGE 48
Station Agency Station Name Division Basin District Latitude Longitude Opened Closed Interval
16093 BOM (AUS) Arckaringa Stn 10 4 16 -27.9375 134.739 21-10-1994 8/09/1999 Daily
16093 BOM (AUS) Arckaringa Stn 10 4 16 -27.9375 134.739 30-01-2002 Daily
16094 BOM (AUS) Copper Hill Stn 10 4 16 -27.9555 134.3156 9/01/1994 Daily
16095 BOM (AUS) Tieyon 10 5 16 -26.1259 133.5119 13-05-1995 Daily
17000 BOM (AUS) Abminga Railway Siding 10 5 17 -26.1317 134.8517 1/01/1939 1/01/1980 Daily
17001 BOM (AUS) Alberga 10 5 17 -27.2 135.4333 1/01/1930 1/01/1979 Daily
17002 BOM (AUS) Alberrie Ck 10 4 17 -29.6267 137.5367 2/01/1930 31-12-1977 Daily
17004 BOM (AUS) Anna Ck 10 4 17 -28.8921 136.1688 01-01-1883 Daily
17005 BOM (AUS) Leigh Ck Aero 10 4 17 -30.4667 138.4075 7/01/1951 31-12-1982 Daily
17006 BOM (AUS) Apollinaris Well 10 4 17 -29.9267 138.7517 1/01/1925 1/01/1953 Daily
17007 BOM (AUS) Allandale 10 4 17 -27.6297 135.5869 1/01/1909 Daily
17008 BOM (AUS) Arrowie 10 4 17 -30.8536 139.2933 01-12-1876 31-12-1949 Daily
17009 BOM (AUS) Avondale 10 4 17 -30.2314 138.4511 01-01-1898 1/01/1953 Daily
17010 BOM (AUS) Balcanoona 10 4 17 -30.5328 139.3029 5/01/1945 Daily
17010 BOM (AUS) Balcanoona 10 4 17 -30.5328 139.3029 5/01/1945 Synop
17010 BOM (AUS) Balcanoona 10 4 17 -30.5328 139.3029 19-06-2001 Continuous
17013 BOM (AUS) Beresford 10 4 17 -29.2431 136.6581 1/01/1930 1/01/1978 Daily
17016 BOM (AUS) Clifton Hills 10 2 17 -27.0194 138.8933 01-01-1894 Daily
17018 BOM (AUS) Copley 10 4 17 -30.5564 138.4222 01-01-1883 1/01/1963 Daily
17019 BOM (AUS) Cordillo Downs 10 3 17 -26.7075 140.6247 01-01-1883 Daily
17020 BOM (AUS) Cowarie 10 2 17 -27.7031 138.335 01-09-1881 Daily
17021 BOM (AUS) Coward Springs 10 4 17 -29.4025 136.8108 01-09-1897 31-12-1977 Daily
17022 BOM (AUS) Tantanna 10 3 17 -28.1696 139.6105 1/01/2002 Daily
17023 BOM (AUS) Edwards Ck 10 4 17 -28.3325 135.8483 12/01/1929 31-12-1980 Daily
17024 BOM (AUS) Farina 10 4 17 -30.066 138.2739 01-01-1879 Daily
17024 BOM (AUS) Farina 10 4 17 -30.066 138.2739 01-01-1879 Synop
17025 BOM (AUS) Finniss Springs 10 4 17 -29.745 137.505 10/01/1920 31-12-1971 Daily
17026 BOM (AUS) Daralingie 10 3 17 -28.3724 139.9724 1/01/2002 Daily

Lake Eyre Hydrology Appendices
I:\WCMS\Projects\WC03272\Deliverables\final report\LakeEyreHydrol_App_final.doc PAGE 49
Station Agency Station Name Division Basin District Latitude Longitude Opened Closed Interval
17027 BOM (AUS) Innamincka Police Camp 10 3 17 -27.8 140.7333 01-10-1883 31-12-1952 Daily
17028 BOM (AUS) Innamincka Stn 10 3 17 -27.7256 140.7622 01-11-1882 Daily
17029 BOM (AUS) Lyndhurst Post Office 10 4 17 -30.2867 138.3458 12/01/1902 31-12-1989 Daily
17030 BOM (AUS) Macumba 10 5 17 -27.2547 135.648 01-01-1891 Daily
17031 BOM (AUS) Marree 10 4 17 -29.6494 138.0625 01-08-1885 Daily
17031 BOM (AUS) Marree 10 4 17 -29.6494 138.0625 01-08-1885 Synop
17033 BOM (AUS) Mount Dutton 10 4 17 -27.815 135.715 12/01/1929 31-12-1980 Daily
17034 BOM (AUS) Mount Lyndhurst 10 4 17 -30.1828 138.7093 01-01-1878 1/01/1953 Daily
17034 BOM (AUS) Mount Lyndhurst 10 4 17 -30.1828 138.7093 24-10-1999 6/01/2002 Daily
17035 BOM (AUS) Mount Serle 10 4 17 -30.5439 138.8558 7/01/1917 31-01-1991 Daily
17036 BOM (AUS) Mulka 10 3 17 -28.3539 138.6522 6/01/1917 Daily
17037 BOM (AUS) Muloorina Homestead 10 4 17 -29.2406 137.9044 01-11-1881 Daily
17038 BOM (AUS) Mundowdna 10 4 17 -29.7331 138.2329 1/01/1944 1/01/1958 Daily
17038 BOM (AUS) Mundowdna 10 4 17 -29.7331 138.2329 5/05/1998 Daily
17039 BOM (AUS) Murnpeowie 10 4 17 -29.5911 139.0497 01-01-1893 7/08/1999 Daily
17041 BOM (AUS) Narrina 10 4 17 -30.9372 138.8919 9/01/1949 Daily
17042 BOM (AUS) Nepabunna Mission 10 4 17 -30.5867 138.9833 8/01/1939 31-12-1975 Daily
17043 BOM (AUS) Oodnadatta Airport 10 4 17 -27.5553 135.4456 1/01/1961 8/01/1985 Continuous
17043 BOM (AUS) Oodnadatta Airport 10 4 17 -27.5553 135.4456 11/02/1994 Continuous
17043 BOM (AUS) Oodnadatta Airport 10 4 17 -27.5553 135.4456 11/02/1994 Synop
17044 BOM (AUS) Oodnadatta Post Office 10 4 17 -27.5458 135.4433 01-06-1891 31-12-1941 Daily
17045 BOM (AUS) Pandie Pandie 10 2 17 -26.1317 139.385 5/01/1949 31-12-1964 Daily
17047 BOM (AUS) Pedirka 10 5 17 -26.6567 135.2067 3/01/1930 31-12-1980 Daily
17048 BOM (AUS) Umberatana 10 4 17 -30.2402 139.13 01-01-1886 Daily
17049 BOM (AUS) Arcoona Bluff 10 4 17 -30.4291 138.9808 25-04-2003 Continuous
17050 BOM (AUS) Warrina 10 4 17 -28.2 135.8333 01-01-1891 1/01/1930 Daily
17052 BOM (AUS) Wertaloona 10 4 17 -30.6383 139.3445 6/01/1906 Daily
17053 BOM (AUS) William Ck 10 4 17 -28.9062 136.3386 01-01-1874 1/01/1968 Daily

Lake Eyre Hydrology Appendices
I:\WCMS\Projects\WC03272\Deliverables\final report\LakeEyreHydrol_App_final.doc PAGE 50
Station Agency Station Name Division Basin District Latitude Longitude Opened Closed Interval
17053 BOM (AUS) William Ck 10 4 17 -28.9062 136.3386 6/01/1996 Daily
17054 BOM (AUS) Wirrealpa 10 4 17 -31.1278 138.9618 01-08-1875 Daily
17055 BOM (AUS) Witchelina 10 4 17 -30.0213 138.0424 01-01-1898 Daily
17056 BOM (AUS) Wooltana 10 4 17 -30.4132 139.4198 01-01-1877 Daily
17057 BOM (AUS) Wyambana 10 4 17 -31.1933 139.4394 6/01/1938 31-12-1949 Daily
17058 BOM (AUS) Dulkaninna 10 4 17 -29.0192 138.4592 12/01/1950 Daily
17059 BOM (AUS) The Knob 10 4 17 -30.0158 138.9944 1/01/1925 1/01/1953 Daily
17060 BOM (AUS) Tilcha 10 4 17 -29.605 140.89 01-01-1884 1/01/1942 Daily
17061 BOM (AUS) Stuarts Ck 10 4 17 -29.7 137.04 01-01-1877 1/01/1930 Daily
17062 BOM (AUS) Cadelga 10 2 17 -26.09 140.4067 01-01-1886 1/01/1962 Daily
17063 BOM (AUS) Kanowana 10 3 17 -27.8383 139.6233 01-01-1888 1/01/1939 Daily
17064 BOM (AUS) Mount Hopeless 10 4 17 -29.595 139.75 1/01/1918 1/01/1936 Daily
17066 BOM (AUS) Killalpaninna 10 3 17 -28.6 138.5667 01-01-1885 1/01/1924 Daily
17067 BOM (AUS) Mungeranie 10 2 17 -28.0206 138.6619 01-11-1887 Daily
17068 BOM (AUS) Troudaninna 10 4 17 -29.05 139.1667 01-01-1893 1/01/1936 Daily
17069 BOM (AUS) Ilbunga 10 5 17 -26.4217 135.0333 5/01/1930 31-12-1979 Daily
17070 BOM (AUS) Mount Dare 10 5 17 -26.0694 135.2484 1/01/1950 Daily
17070 BOM (AUS) Mount Dare 10 5 17 -26.0694 135.2484 1/01/1950 Synop
17070 BOM (AUS) Mount Dare 10 5 17 -26.0694 135.2484 21-09-2000 Continuous
17071 BOM (AUS) Irrapatanna 10 4 17 -29.0283 136.4917 1/01/1954 1/01/1965 Daily
17072 BOM (AUS) Car 732 Mile 10 5 17 -26.93 135.3417 1/01/1947 1/01/1978 Daily
17073 BOM (AUS) Andrewilla Police Camp 10 2 17 -26.5133 139.2817 01-04-1894 31-12-1902 Daily
17074 BOM (AUS) Callabonna 10 4 17 -29.7567 140.245 1/01/1902 1/01/1909 Daily
17075 BOM (AUS) Dalhousie Springs 10 5 17 -26.5167 135.4617 01-01-1880 01-01-1890 Daily
17076 BOM (AUS) Clayton 10 4 17 -29.2797 138.3811 5/01/1914 30-06-1928 Daily
17076 BOM (AUS) Clayton 10 4 17 -29.2797 138.3811 8/01/1996 Daily
17078 BOM (AUS) Goyders Lagoon 10 2 17 -26.9514 138.9528 1/01/1901 1/01/1919 Daily
17079 BOM (AUS) Minnie Downs 10 2 17 -26.0517 139.8583 1/01/1915 1/01/1940 Daily

Lake Eyre Hydrology Appendices
I:\WCMS\Projects\WC03272\Deliverables\final report\LakeEyreHydrol_App_final.doc PAGE 51
Station Agency Station Name Division Basin District Latitude Longitude Opened Closed Interval
17080 BOM (AUS) Freelingwell 10 4 17 -29.95 139.2333 01-08-1887 31-12-1939 Daily
17081 BOM (AUS) Mount Gason 10 2 17 -27.3233 138.745 9/01/1910 31-12-1927 Daily
17083 BOM (AUS) Puttaburra 10 7 17 -26.6167 138.6167 9/01/1927 31-12-1933 Daily
17086 BOM (AUS) Yudnamultana 10 4 17 -30.1781 139.2808 6/01/1909 31-12-1931 Daily
17087 BOM (AUS) Haddon 10 2 17 -26.3517 140.8283 01-07-1884 31-12-1936 Daily
17088 BOM (AUS) Peechywarrina 10 4 17 -29.0317 138.1917 01-04-1882 31-12-1903 Daily
17089 BOM (AUS) Kalamurina 10 2 17 -27.7219 138.2533 01-10-1884 31-12-1898 Daily
17089 BOM (AUS) Kalamurina 10 2 17 -27.7219 138.2533 3/01/1998 Daily
17090 BOM (AUS) Montacollina 10 3 17 -29.4 139.9833 01-12-1885 31-12-1903 Daily
17091 BOM (AUS) Wondillina 10 4 17 -27.8056 135.6458 01-11-1897 31-12-1907 Daily
17093 BOM (AUS) Tinga Tingana 10 3 17 -28.795 140.1733 01-12-1891 31-12-1900 Daily
17094 BOM (AUS) Parallana 10 4 17 -30.2067 139.4558 01-01-1881 1/01/1907 Daily
17095 BOM (AUS) Alton Downs 10 1 17 -26.1533 138.9383 01-01-1886 1/01/1939 Daily
17096 BOM (AUS) Moomba 10 3 17 -28.1125 140.2102 11/01/1972 6/01/2000 Continuous
17096 BOM (AUS) Moomba 10 3 17 -28.1125 140.2102 11/01/1972 Daily
17096 BOM (AUS) Moomba 10 3 17 -28.1125 140.2102 11/01/1972 Synop
17097 BOM (AUS) Angorichina 10 4 17 -31.0885 138.7412 1/01/1969 Daily
17099 BOM (AUS) Arkaroola 10 4 17 -30.311 139.3357 1/01/1938 Daily
17099 BOM (AUS) Arkaroola 10 4 17 -30.311 139.3357 1/01/1938 Synop
17100 BOM (AUS) Blanchewater Stn 10 4 17 -29.55 139.4667 01-01-1879 1/01/1938 Daily
17101 BOM (AUS) Leigh Ck E.T.S.A 10 4 17 -30.4825 138.4136 9/01/1972 13-08-1975 Continuous
17101 BOM (AUS) Leigh Ck E.T.S.A 10 4 17 -30.4825 138.4136 10/01/1972 31-12-1975 Daily
17102 BOM (AUS) Yankaninna 10 4 17 -30.3658 139.0533 5/01/1920 16-09-1993 Daily
17105 BOM (AUS) Quinyambie 10 4 17 -30.215 140.9917 01-06-1887 31-12-1973 Daily
17106 BOM (AUS) New Quinyambie 10 4 17 -30.8734 140.9697 1/01/1973 Daily
17108 BOM (AUS) Leigh Ck Northern Coalfield 10 4 17 -30.4064 138.3961 8/01/1975 31-12-1977 Daily
17108 BOM (AUS) Leigh Ck Northern Coalfield 10 4 17 -30.4064 138.3961 13-08-1975 31-10-1977 Continuous
17109 BOM (AUS) The Peake 10 4 17 -28.0767 135.9042 01-12-1873 31-12-1891 Daily

Lake Eyre Hydrology Appendices
I:\WCMS\Projects\WC03272\Deliverables\final report\LakeEyreHydrol_App_final.doc PAGE 52
Station Agency Station Name Division Basin District Latitude Longitude Opened Closed Interval
17110 BOM (AUS) Leigh Ck Airport 10 4 17 -30.5963 138.4219 15-07-1992 Continuous
17111 BOM (AUS) Dullingari 10 3 17 -28.1484 140.8672 1/01/1984 Daily
17112 BOM (AUS) Tirrawarra 10 3 17 -27.6908 140.1066 1/01/1984 Daily
17114 BOM (AUS) Oodnadatta Police Stn 10 4 17 -27.5439 135.4408 8/01/1985 Daily
17114 BOM (AUS) Oodnadatta Police Stn 10 4 17 -27.5439 135.4408 8/01/1985 Synop
17115 BOM (AUS) Lindon 10 4 17 -29.1281 140.9 10/01/1987 Daily
17116 BOM (AUS) Coulthard 10 4 17 -30.275 139.3397 1/01/1990 31-08-2002 Daily
17117 BOM (AUS) Greenwood Hill 10 4 17 -30.2811 139.2639 1/01/1990 31-08-2002 Daily
17118 BOM (AUS) Innamincka Town Site 10 3 17 -27.7333 140.7383 12/03/1976 22-08-2002 Daily
17120 BOM (AUS) Mount Painter 10 4 17 -30.2369 139.0003 5/01/1990 31-01-2002 Daily
17121 BOM (AUS) Innamincka Hotel 10 3 17 -27.7481 140.7369 9/01/1993 Daily
17122 BOM (AUS) Owieandana 10 4 17 -30.4456 138.9481 9/01/1993 21-07-2003 Daily
17123 BOM (AUS) Moomba Airport 10 3 17 -28.0997 140.1956 4/10/1995 Continuous
17124 BOM (AUS) Keleary 10 3 17 -27.0742 140.6817 4/01/1996 31-12-1998 Daily
17125 BOM (AUS) Bookabourdie 10 3 17 -27.5347 140.4674 7/01/1997 Daily
17126 BOM (AUS) Marree Aero 10 4 17 -29.6587 138.0684 7/02/1998 Continuous
17127 BOM (AUS) Nilpinna 10 4 17 -28.4809 135.9211 4/01/1998 Daily
17129 BOM (AUS) Wilpoorinna 10 4 17 -29.9565 138.3411 5/05/1998 Daily
17130 BOM (AUS) Callanna 10 4 17 -29.7139 137.9017 5/05/1998 Daily
17131 BOM (AUS) Moolawatana 10 4 17 -29.9062 139.7345 5/11/1998 Daily
17132 BOM (AUS) Etadunna 10 3 17 -28.7206 138.6325 5/06/1998 Daily
19003 BOM (AUS) Old Baratta Homestead 10 4 19 -31.9767 139.105 01-01-1882 4/12/1989 Daily
19005 BOM (AUS) Black Rock 10 4 19 -32.8261 138.6893 01-01-1877 Daily
19012 BOM (AUS) Kylmorn 10 4 19 -32.7053 138.7796 11/01/1901 Daily
19014 BOM (AUS) Anda-Vale 10 4 19 -32.8037 138.9218 1/01/1902 Daily
19018 BOM (AUS) Holowilena 10 4 19 -31.8777 138.8372 01-01-1868 Daily
19021 BOM (AUS) Johnburgh Post Office 10 4 19 -32.4561 138.705 01-07-1882 31-12-1966 Daily
19023 BOM (AUS) Mannanarie Post Office 10 4 19 -33.0453 138.6178 01-01-1868 1/01/1974 Daily

Lake Eyre Hydrology Appendices
I:\WCMS\Projects\WC03272\Deliverables\final report\LakeEyreHydrol_App_final.doc PAGE 53
Station Agency Station Name Division Basin District Latitude Longitude Opened Closed Interval
19031 BOM (AUS) Oodla Wirra 10 4 19 -32.8776 139.0578 6/01/1919 Daily
19032 BOM (AUS) Orroroo 10 4 19 -32.7351 138.6123 01-01-1868 Daily
19034 BOM (AUS) Peterborough 10 4 19 -32.9752 138.8361 01-01-1881 Daily
19045 BOM (AUS) Ucolta Post Office 10 4 19 -32.9508 138.965 12/01/1906 31-12-1967 Daily
19049 BOM (AUS) Wilpena Head Stn 10 4 19 -31.5167 138.6117 4/01/1903 31-12-1985 Daily
19055 BOM (AUS) Yakapana 10 4 21 -33.0833 138.6775 12/01/1970 14-12-1992 Daily
19057 BOM (AUS) Yalpara 10 4 19 -32.552 138.8688 7/01/1907 Daily
19060 BOM (AUS) Yatina 10 4 19 -32.9333 138.6667 01-06-1894 31-12-1980 Daily
19062 BOM (AUS) Yongala 10 4 19 -33.0287 138.7489 01-01-1881 Daily
19062 BOM (AUS) Yongala 10 4 19 -33.0287 138.7489 01-01-1881 Synop
19063 BOM (AUS) Willow Springs 10 4 19 -31.4511 138.7569 1/01/1951 1/01/1954 Daily
19070 BOM (AUS) Wilpena Pound 10 4 19 -31.5286 138.6093 3/01/1962 Daily
19070 BOM (AUS) Wilpena Pound 10 4 19 -31.5286 138.6093 3/01/1962 Synop
19074 BOM (AUS) Cavenagh West 10 4 19 -32.6833 138.9667 01-01-1885 1/01/1925 Daily
19075 BOM (AUS) Dawson 10 4 19 -32.8056 138.9739 01-01-1884 1/01/1927 Daily
19087 BOM (AUS) Cavenagh 10 4 19 -32.7189 139.0164 01-07-1882 31-12-1910 Daily
19094 BOM (AUS) Yongala National Park 10 4 19 -33.0333 138.75 01-09-1886 31-12-1894 Daily
19095 BOM (AUS) Oakburne 10 4 19 -32.4654 138.7579 2/01/1967 Daily
19097 BOM (AUS) Glenroy 10 4 19 -32.3333 138.7167 1/01/1906 1/01/1908 Daily
19101 BOM (AUS) Matt Whim 10 4 19 -32.0464 138.9092 1/01/1954 1/01/1965 Daily
19104 BOM (AUS) Mannanarie 10 4 19 -33.0371 138.6003 1/01/1975 Daily
19110 BOM (AUS) Siccus 10 4 19 -31.9656 139.2147 1/01/1989 Daily
19111 BOM (AUS) Martins Well 10 4 19 -31.4763 139.1134 1/01/1958 Daily
19114 BOM (AUS) Minburra 10 4 19 -32.4295 138.8922 19-11-1997 Daily
20000 BOM (AUS) Bimbowrie 10 4 20 -32.0511 140.1603 01-01-1882 1/01/1949 Daily
20000 BOM (AUS) Bimbowrie 10 4 20 -32.0511 140.1603 10/01/1999 Daily
20001 BOM (AUS) Boolcoomatta 10 4 20 -31.9714 140.5422 01-06-1882 Daily
20002 BOM (AUS) Cockburn 10 4 20 -32.0774 140.9956 01-07-1888 Daily
Lake Eyre Hydrology Appendices
I:\WCMS\Projects\WC03272\Deliverables\final report\LakeEyreHydrol_App_final.doc PAGE 54
Station Agency Station Name Division Basin District Latitude Longitude Opened Closed Interval
20003 BOM (AUS) Coondappie 10 4 20 -31.5 139.6667 1/01/1917 1/01/1945 Daily
20004 BOM (AUS) Curnamona 10 4 20 -31.6528 139.5478 01-01-1881 Daily
20005 BOM (AUS) Erudina 10 4 20 -31.48 139.3847 5/01/1911 Daily
20006 BOM (AUS) Frome Downs 10 4 20 -31.2211 139.7753 01-01-1889 Daily
20007 BOM (AUS) Kalabity 10 4 20 -31.9167 140.3167 9/01/1920 31-12-1979 Daily
20010 BOM (AUS) Koonamore 10 4 20 -32.0661 139.3811 01-07-1888 Daily
20011 BOM (AUS) Lake Dismal 10 4 20 -32.05 140.9167 1/01/1921 1/01/1982 Daily
20014 BOM (AUS) Mingary 10 4 20 -32.1333 140.75 8/01/1921 31-12-1973 Daily
20015 BOM (AUS) Four Brothers 10 4 20 -32.2138 139.7178 12/01/1924 26-06-1971 Daily
20015 BOM (AUS) Four Brothers 10 4 20 -32.2138 139.7178 8/08/1985 Daily
20016 BOM (AUS) Mulyungarie 10 4 20 -31.5558 140.7908 1/01/1901 Daily
20023 BOM (AUS) Waukaringa 10 4 20 -32.3 139.45 01-08-1889 31-12-1963 Daily
20027 BOM (AUS) Childs 10 4 20 -31.3833 140.7 1/01/1925 1/01/1943 Daily
20033 BOM (AUS) Choclate 10 4 20 -31.4 140.7 1/01/1930 1/01/1935 Daily
20034 BOM (AUS) Corona 10 4 20 -31.0667 140.95 5/01/1930 31-12-1944 Daily
20037 BOM (AUS) Lake Charles 10 4 20 -31.1333 140.7167 5/01/1930 31-12-1944 Daily
20038 BOM (AUS) Lockhart Bore 10 4 20 -31.3806 140.9425 1/01/1937 1/01/1944 Daily
20040 BOM (AUS) Security 10 4 20 -31.8167 140.9 1/01/1926 1/01/1943 Daily
20041 BOM (AUS) Wallaces 10 4 20 -31.4833 140.9333 1/01/1925 1/01/1944 Daily
20042 BOM (AUS) Watsons Well 10 4 20 -31.2 140.9 1/01/1925 1/01/1944 Daily
20046 BOM (AUS) Mutooroo Mine 10 4 20 -32.25 140.9333 01-05-1891 31-12-1899 Daily
20049 BOM (AUS) Mooleulooloo 10 4 20 -31.6397 140.5117 5/01/1969 Daily
20050 BOM (AUS) Plumbago 10 4 20 -32.0631 139.886 12/01/1970 Daily
20052 BOM (AUS) Mt Victor 10 4 20 -32.059 139.6174 1/01/1971 Daily
20053 BOM (AUS) Tepco 10 4 20 -32.1712 140.7945 1/01/1928 Daily
20055 BOM (AUS) Strathearn 10 4 20 -31.7499 140.3414 9/01/1989 Daily
20059 BOM (AUS) Yarramba 10 4 20 -31.6634 140.6276 8/01/1994 Daily
20060 BOM (AUS) Tickalina 10 4 20 -32.222 140.5913 8/01/1994 Daily

Lake Eyre Hydrology Appendices
I:\WCMS\Projects\WC03272\Deliverables\final report\LakeEyreHydrol_App_final.doc PAGE 55
Station Agency Station Name Division Basin District Latitude Longitude Opened Closed Interval
21049 BOM (AUS) Teecarnee 10 4 21 -33.1464 138.7219 8/01/1902 31-12-1956 Daily
30016 BOM (AUS) Ewan Plains Stn 10 3 30 -21.2667 144.8333 1/01/1924 1/01/1978 Daily
30029 BOM (AUS) Lammermoor Stn 10 3 30 -21.2833 144.6333 01-12-1886 31-12-1965 Daily
30034 BOM (AUS) Merlin Stn 10 3 30 -21.1167 144.8103 1/01/1910 Daily
30041 BOM (AUS) Prairie Post Office 10 3 30 -20.8708 144.6 01-07-1887 Daily
30041 BOM (AUS) Prairie Post Office 10 3 30 -20.8708 144.6 23-12-1965 12/11/1983 Continuous
30051 BOM (AUS) Torrens Ck Post Office 10 3 30 -20.7694 145.0211 01-01-1893 Daily
30051 BOM (AUS) Torrens Ck Post Office 10 3 30 -20.7694 145.0211 11/12/1983 Continuous
30057 BOM (AUS) Zara Stn 10 3 30 -21.2139 144.3644 1/01/1914 Daily
30058 BOM (AUS) Wogadoona 10 3 30 -21.1117 144.9306 31-01-2001 Daily
30079 BOM (AUS) Cheltenham Stn 10 3 30 -21.05 144.95 4/01/1969 31-12-1973 Daily
30127 BOM (AUS) Woodbine Stn 10 3 30 -20.9942 144.6433 1/01/1907 Daily
30133 BOM (AUS) Kynuna 10 2 30 -21.5778 141.9189 01-01-1888 Daily
30133 BOM (AUS) Kynuna 10 2 30 -21.5778 141.9189 01-01-1888 Synop
35049 BOM (AUS) Gillespie 10 3 35 -24.5608 145.7869 01-01-1878 Daily
35069 BOM (AUS) Tambo Post Office 10 3 35 -24.8819 146.2564 01-01-1877 Daily
35069 BOM (AUS) Tambo Post Office 10 3 35 -24.8819 146.2564 01-01-1877 Synop
35069 BOM (AUS) Tambo Post Office 10 3 35 -24.8819 146.2564 8/01/1963 Continuous
35072 BOM (AUS) Tambo Stn 10 3 35 -24.8856 146.2781 12/01/2000 Daily
35084 BOM (AUS) Yalleroi 10 3 35 -24.0692 145.76 12/01/1900 8/01/1996 Daily
35099 BOM (AUS) Lorne 10 3 35 -24.8 145.3 01-01-1888 1/01/1923 Daily
35106 BOM (AUS) Ravensbourne Stn 10 3 35 -24.85 145.6167 1/01/1903 1/01/1920 Daily
35143 BOM (AUS) Maryvale Springs 10 3 35 -24.0569 145.9083 1/01/1969 Daily
35161 BOM (AUS) Champion 10 3 35 -24.2333 145.8833 1/01/1914 1/01/1925 Daily
35200 BOM (AUS) Greendale Stn 10 3 35 -24.7886 146.1108 1/01/1908 Daily
35240 BOM (AUS) Macfarlane 10 3 35 -24.8333 146.0167 1/01/1960 1/01/1979 Daily
35246 BOM (AUS) Mount Enniskillen 10 3 35 -24.5978 146.1844 1/01/1910 Daily
35247 BOM (AUS) Birkhead 10 3 35 -24.55 146.3667 1/01/1912 1/01/1971 Daily

Lake Eyre Hydrology Appendices
I:\WCMS\Projects\WC03272\Deliverables\final report\LakeEyreHydrol_App_final.doc PAGE 56
Station Agency Station Name Division Basin District Latitude Longitude Opened Closed Interval
35256 BOM (AUS) Jericho Post Office 10 3 35 -23.6033 146.1256 01-09-1896 Daily
35257 BOM (AUS) Northampton Dns Outstn 10 3 35 -24.4333 145.7167 1/01/1900 1/01/1912 Daily
35259 BOM (AUS) Duneira 10 3 35 -24.5408 145.5692 1/01/1994 Daily
35286 BOM (AUS) Glencoe 10 3 35 -23.7122 146.1675 5/01/1993 Daily
36000 BOM (AUS) Alice Post Office 10 3 36 -23.5667 145.65 01-10-1889 31-12-1972 Daily
36001 BOM (AUS) Albilbah 10 3 36 -24.7167 144.2833 01-01-1890 1/01/1979 Daily
36002 BOM (AUS) Ambo Stn 10 3 36 -22.8103 144.4033 01-01-1892 Daily
36003 BOM (AUS) Birricannia 10 3 36 -21.9089 144.6694 1/01/1901 Daily
36004 BOM (AUS) Aramac Post Office 10 3 36 -22.9717 145.245 01-01-1880 Daily
36005 BOM (AUS) Arrilalah Telegraph Off 10 3 36 -23.6833 143.8833 7/01/1910 31-12-1984 Daily
36006 BOM (AUS) Eversleigh 10 3 36 -21.7117 144.3928 4/01/1999 Daily
36007 BOM (AUS) Barcaldine Post Office 10 3 36 -23.5544 145.2883 01-12-1886 Daily
36007 BOM (AUS) Barcaldine Post Office 10 3 36 -23.5544 145.2883 01-12-1886 Synop
36008 BOM (AUS) Bowen Downs 10 3 36 -22.4672 145.005 01-01-1882 Daily
36009 BOM (AUS) Bowie 10 3 36 -21.8 145.9333 1/01/1913 1/01/1953 Daily
36011 BOM (AUS) Marengo 10 3 36 -22.2067 145.0083 4/01/1999 Daily
36012 BOM (AUS) Cameron Downs 10 3 36 -21.3747 144.2794 01-01-1888 Daily
36013 BOM (AUS) Camoola Park 10 3 36 -23.0394 144.5194 1/01/1900 Daily
36014 BOM (AUS) Catumnal 10 3 36 -21.8833 143.97 11/01/1943 Daily
36016 BOM (AUS) Coreena 10 3 36 -23.2761 145.4008 01-01-1894 Daily
36017 BOM (AUS) Corinda 10 3 36 -22.0667 145.3333 01-01-1899 Daily
36019 BOM (AUS) Elwell 10 3 36 -21.7333 144.6333 8/01/1914 31-12-1978 Daily
36020 BOM (AUS) Emmet Lister St 10 3 36 -24.6667 144.4833 1/01/1938 1/01/1979 Daily
36021 BOM (AUS) Emmet Downs 10 3 36 -24.7208 144.4981 01-01-1897 23-12-1982 Daily
36021 BOM (AUS) Emmet Downs 10 3 36 -24.7208 144.4981 01-01-1897 23-12-1982 Operational
36021 BOM (AUS) Emmet Downs 10 3 36 -24.7208 144.4981 22-04-1998 Daily
36022 BOM (AUS) Evesham Stn 10 3 36 -23.0311 143.7117 01-01-1884 11/07/1977 Daily
36022 BOM (AUS) Evesham Stn 10 3 36 -23.0311 143.7117 25-08-1989 Daily

Lake Eyre Hydrology Appendices
I:\WCMS\Projects\WC03272\Deliverables\final report\LakeEyreHydrol_App_final.doc PAGE 57
Station Agency Station Name Division Basin District Latitude Longitude Opened Closed Interval
36023 BOM (AUS) Holmleigh 10 3 36 -21.5119 144.6339 01-01-1899 Daily
36024 BOM (AUS) Ilfracombe Post Office 10 3 36 -23.49 144.5075 01-12-1897 Daily
36025 BOM (AUS) Isis Downs 10 3 36 -24.2217 143.6325 01-01-1888 Daily
36026 BOM (AUS) Isisford Post Office 10 3 36 -24.2589 144.4406 01-01-1885 Daily
36026 BOM (AUS) Isisford Post Office 10 3 36 -24.2589 144.4406 01-01-1885 Synop
36026 BOM (AUS) Isisford Post Office 10 3 36 -24.2589 144.4406 26-07-1974 Continuous
36027 BOM (AUS) Manningham 10 3 36 -23.1925 143.7889 19-01-2000 Daily
36028 BOM (AUS) Lerida 10 3 36 -22.1769 144.0486 1/01/1915 Daily
36029 BOM (AUS) Lochnagar 10 3 36 -23.5667 145.65 01-03-1899 31-12-1972 Daily
36030 BOM (AUS) Longreach Post Office 10 3 36 -23.45 144.25 01-01-1893 1/01/1985 Daily
36030 BOM (AUS) Longreach Post Office 10 3 36 -23.45 144.25 7/01/1963 13-09-1971 Continuous
36031 BOM (AUS) Longreach Aero 10 3 36 -23.4372 144.2769 8/01/1949 Daily
36031 BOM (AUS) Longreach Aero 10 3 36 -23.4372 144.2769 8/01/1949 Synop
36031 BOM (AUS) Longreach Aero 10 3 36 -23.4372 144.2769 31-01-1963 Continuous
36032 BOM (AUS) Maneroo 10 3 36 -23.3667 143.8833 01-01-1884 1/01/1979 Daily
36033 BOM (AUS) Malvern Hills 10 3 36 -24.5 145.15 01-01-1880 1/01/1948 Daily
36034 BOM (AUS) Blackall Airport 10 3 36 -24.4303 145.4306 3/08/2001 Continuous
36036 BOM (AUS) Lochnagar 10 3 36 -23.6239 145.6892 8/01/2001 Daily
36037 BOM (AUS) Muttaburra 10 3 36 -22.595 144.5469 01-01-1885 Daily
36039 BOM (AUS) Portland Downs 10 3 36 -24.1333 144.5833 01-01-1887 1/01/1974 Daily
36040 BOM (AUS) Springleigh 10 3 36 -24.5617 144.7183 1/01/1933 Daily
36041 BOM (AUS) Ruthven 10 3 36 -24.3333 144.1833 01-01-1888 1/01/1975 Daily
36042 BOM (AUS) Saltern Post Office 10 3 36 -23.55 145.1 01-08-1896 31-12-1986 Daily
36043 BOM (AUS) Strathdarr 10 3 36 -23.2828 143.9828 1/01/1913 Daily
36044 BOM (AUS) Sutton Downs 10 3 36 -21.5 144.1167 1/01/1930 1/01/1987 Daily
36045 BOM (AUS) Tangorin 10 3 36 -21.7631 144.2222 01-01-1892 31-03-1998 Daily
36046 BOM (AUS) Tiree 10 3 36 -21.6283 145.1167 8/01/1912 Daily
36046 BOM (AUS) Tiree 10 3 36 -21.6283 145.1167 10/10/1971 Continuous

Lake Eyre Hydrology Appendices
I:\WCMS\Projects\WC03272\Deliverables\final report\LakeEyreHydrol_App_final.doc PAGE 58
Station Agency Station Name Division Basin District Latitude Longitude Opened Closed Interval
36048 BOM (AUS) Uanda 10 3 36 -21.6039 144.9033 01-09-1889 Daily
36049 BOM (AUS) Darr R Downs 10 3 36 -22.9 144 01-01-1891 1/01/1963 Daily
36051 BOM (AUS) Westland 10 3 36 -23.9683 143.8239 01-01-1887 Daily
36052 BOM (AUS) Morella Railway Stn 10 3 36 -22.9831 143.8658 1/01/1956 31-08-1989 Daily
36054 BOM (AUS) Evora Stn 10 3 36 -24.0825 145.5092 01-01-1887 Daily
36056 BOM (AUS) Landsborough Downs 10 3 36 -21.5114 144.3989 01-01-1885 Daily
36057 BOM (AUS) Mount Cornish 10 3 36 -22.6 144.6 01-01-1885 1/01/1918 Daily
36058 BOM (AUS) Saltern Ck 10 3 36 -23.4 145.1 01-01-1889 1/01/1928 Daily
36059 BOM (AUS) Bimbah 10 3 36 -23.3 144.4 01-01-1894 1/01/1930 Daily
36060 BOM (AUS) Acacia Downs 10 3 36 -22.8333 144.7333 10/01/1908 31-12-1937 Daily
36061 BOM (AUS) Alice Downs 10 3 36 -24.2667 145.4833 01-10-1890 31-12-1911 Daily
36062 BOM (AUS) Kensington Downs 10 3 36 -22.5 144.2 01-01-1889 1/01/1903 Daily
36063 BOM (AUS) Rimbanda Rail Siding 10 3 36 -22.8333 143.7333 9/01/1964 31-12-1974 Daily
36064 BOM (AUS) Alroy 10 3 36 -23.5 143.4167 1/01/1915 1/01/1943 Daily
36065 BOM (AUS) Caledonia 10 3 36 -22.1381 145.0564 01-01-1896 3/04/1999 Daily
36066 BOM (AUS) Beaconsfield 10 3 36 -23.3269 144.5964 01-01-1894 Daily
36067 BOM (AUS) Bristol 10 3 36 -23.25 145.0833 1/01/1966 1/01/1970 Daily
36068 BOM (AUS) Marchmont 10 3 36 -23.1203 144.7542 1/01/1943 29-03-2001 Daily
36069 BOM (AUS) Hanworth 10 3 36 -22.335 144.0569 1/01/1966 Daily
36073 BOM (AUS) Luthrie 10 3 36 -22.7064 144.1028 6/01/1968 Daily
36074 BOM (AUS) Jochmus 10 3 36 -22.3022 145.99 6/01/1968 Daily
36075 BOM (AUS) Glenavon 10 3 36 -22.4833 145.3833 1/01/1969 1/01/1984 Daily
36076 BOM (AUS) Eastmere 10 3 36 -22.5017 145.9183 3/01/1969 Daily
36077 BOM (AUS) Home Ck 10 3 36 -23.9667 145.2667 1/01/1939 1/01/1985 Daily
36078 BOM (AUS) Cranford 10 3 36 -21.3517 145.0753 1/01/1915 Daily
36079 BOM (AUS) Tumut Vale 10 3 36 -21.3614 145.1717 1/01/1969 Daily
36080 BOM (AUS) Yarrowmere 10 3 36 -21.45 145.8667 1/01/1940 1/01/1976 Daily
36081 BOM (AUS) Thornleigh 10 3 36 -24.3231 144.9092 1/01/1911 Daily

Lake Eyre Hydrology Appendices
I:\WCMS\Projects\WC03272\Deliverables\final report\LakeEyreHydrol_App_final.doc PAGE 59
Station Agency Station Name Division Basin District Latitude Longitude Opened Closed Interval
36082 BOM (AUS) Gowan Hills 10 3 36 -24.2483 144.6983 01-01-1898 Daily
36085 BOM (AUS) Aberfoyle 10 3 36 -21.6678 145.2689 01-01-1892 Daily
36087 BOM (AUS) Leichardt Farms 10 3 36 -23.1292 145.1128 1/01/1950 Daily
36088 BOM (AUS) Gordonvale 10 3 36 -23.7667 144.4167 9/01/1970 31-12-1977 Daily
36090 BOM (AUS) Rosedale Stn 10 3 36 -23.1714 146.0592 10/01/1970 Daily
36091 BOM (AUS) Glenample Stn 10 3 36 -22.9167 145.1 1/01/1900 1/01/1975 Daily
36092 BOM (AUS) Maylands 10 3 36 -22.4583 144.8339 1/01/1934 Daily
36093 BOM (AUS) Yaraka State School 10 3 36 -24.8861 144.0756 1/01/1954 1/01/1989 Daily
36093 BOM (AUS) Yaraka State School 10 3 36 -24.8861 144.0756 7/01/2000 Daily
36094 BOM (AUS) Wahroongha 10 3 36 -24.4464 144.1094 20-12-2002 Daily
36096 BOM (AUS) Ronlow Park 10 3 36 -21.7447 145.8147 1/01/1961 Daily
36097 BOM (AUS) Clarendon 10 3 36 -24.2428 145.2219 1/01/1938 Daily
36098 BOM (AUS) Lara 10 3 36 -23.8064 145.1867 1/01/1942 31-05-1995 Daily
36099 BOM (AUS) Lake Dunn 10 3 36 -22.5167 145.6333 1/01/1901 1/01/1981 Daily
36100 BOM (AUS) Arno 10 3 36 -24.6994 143.7331 1/01/1911 11/05/2003 Daily
36101 BOM (AUS) Richmond Hills 10 3 36 -23.4914 145.6544 11/01/1972 31-07-2001 Daily
36102 BOM (AUS) Barcaldine Downs 10 3 36 -23.7161 145.1303 01-01-1895 Daily
36103 BOM (AUS) Ventry 10 3 36 -24.7 143.95 3/01/1915 31-12-1974 Daily
36109 BOM (AUS) El Kantara 10 3 36 -23.55 143.5167 6/01/1921 31-12-1932 Daily
36111 BOM (AUS) Evanston 10 3 36 -23.7092 144.5253 6/01/1974 Daily
36112 BOM (AUS) Tally Rand 10 3 36 -23.05 144.1167 1/01/1900 1/01/1921 Daily
36113 BOM (AUS) Wellshot 10 3 36 -23.8722 144.4783 01-01-1890 Daily
36114 BOM (AUS) Tara Stn 10 3 36 -23.5833 145.0167 7/01/1917 31-12-1941 Daily
36115 BOM (AUS) Tower Hill 10 3 36 -22.05 144.6 01-01-1888 1/01/1928 Daily
36116 BOM (AUS) Bogewong 10 3 36 -23.9283 143.5217 1/01/1955 Daily
36116 BOM (AUS) Bogewong 10 3 36 -23.9283 143.5217 1/01/1955 Operational
36117 BOM (AUS) Rutland Park 10 3 36 -24.4 144.45 8/01/1974 31-12-1975 Daily
36118 BOM (AUS) Wakefield 10 3 36 -24.1478 144.2325 1/01/1948 Daily

Lake Eyre Hydrology Appendices
I:\WCMS\Projects\WC03272\Deliverables\final report\LakeEyreHydrol_App_final.doc PAGE 60
Station Agency Station Name Division Basin District Latitude Longitude Opened Closed Interval
36119 BOM (AUS) Pemberley 10 3 36 -24.5247 144.0928 7/01/1974 Daily
36120 BOM (AUS) Tallundilly 10 3 36 -24.5753 144.5886 8/01/1974 Daily
36121 BOM (AUS) Hazelwood 10 3 36 -23.9667 144.1333 8/01/1974 31-12-1984 Daily
36123 BOM (AUS) Rotherfield 10 3 36 -23.6064 144.4758 9/01/1974 Daily
36124 BOM (AUS) Amor Downs 10 3 36 -23.8583 144.2958 1/01/1949 30-04-2001 Daily
36125 BOM (AUS) Campsie 10 3 36 -23.5667 143.6667 1/01/1966 1/01/1982 Daily
36126 BOM (AUS) New Deer 10 3 36 -24.7014 144.1442 8/01/1974 Daily
36127 BOM (AUS) Sunbury 10 3 36 -24.6017 143.8314 8/01/1974 Daily
36128 BOM (AUS) Yarawa Downs 10 3 36 -24.4519 143.8742 8/01/1974 Daily
36129 BOM (AUS) Ban Ban 10 3 36 -24.1167 143.7167 1/01/1933 1/01/1975 Daily
36130 BOM (AUS) Russleigh 10 3 36 -24.335 143.7539 1/01/1951 Daily
36131 BOM (AUS) Whitehill 10 3 36 -23.6367 144.0478 1/01/1950 Daily
36132 BOM (AUS) Nerrena 10 3 36 -23.7833 144.1167 11/01/1974 31-12-1983 Daily
36134 BOM (AUS) Moorlands 10 3 36 -24.3972 145.0694 9/01/1974 Daily
36135 BOM (AUS) Selvister 10 3 36 -24.4572 145.2139 1/01/1954 Daily
36138 BOM (AUS) Lorne Peak 10 3 36 -24.9614 145.1442 10/01/1922 31-12-1996 Daily
36140 BOM (AUS) Gundoo 10 3 36 -24.7033 143.8306 1/01/1960 Daily
36141 BOM (AUS) Rodney Downs 10 3 36 -23.1858 144.8514 1/01/1943 Daily
36142 BOM (AUS) Kilala 10 3 36 -23.7 144.6667 1/01/1942 1/01/1957 Daily
36143 BOM (AUS) Blackall Township 10 3 36 -24.4242 145.4653 01-01-1880 Daily
36143 BOM (AUS) Blackall Township 10 3 36 -24.4242 145.4653 01-01-1880 Synop
36144 BOM (AUS) Terrick Terrick Stud 10 3 36 -24.7361 145.0731 01-01-1894 Daily
36145 BOM (AUS) Milton Park 10 3 36 -24.65 145.0667 1/01/1969 1/01/1976 Daily
36146 BOM (AUS) Winhaven 10 3 36 -22.95 145.6833 10/01/1972 31-12-1976 Daily
36147 BOM (AUS) Dotswood 10 3 36 -22.2319 144.5767 1/01/1929 Daily
36148 BOM (AUS) Blackall DPI 10 3 36 -24.4167 145.4667 1/01/1965 1/01/1988 Daily
36149 BOM (AUS) Keen Gea 10 3 36 -21.4717 145.0914 2/01/1976 Daily
36150 BOM (AUS) Rockwood 10 3 36 -21.8 144.2667 01-01-1889 1/01/1906 Daily

Lake Eyre Hydrology Appendices
I:\WCMS\Projects\WC03272\Deliverables\final report\LakeEyreHydrol_App_final.doc PAGE 61
Station Agency Station Name Division Basin District Latitude Longitude Opened Closed Interval
36151 BOM (AUS) Stainburn Downs 10 3 36 -22.8667 145.1 01-01-1888 1/01/1903 Daily
36152 BOM (AUS) Highlands 10 3 36 -24.95 144.4333 01-01-1889 1/01/1901 Daily
36153 BOM (AUS) Summer Hill 10 3 36 -23.0522 144.8103 1/01/1909 Daily
36154 BOM (AUS) Bogunda Stn 10 3 36 -21.3764 144.7642 1/01/1980 Daily
36158 BOM (AUS) Gooyea Stn 10 3 36 -25.37 144.3581 1/01/1988 Daily
36163 BOM (AUS) Ashgrove Stn 10 3 36 -23.4894 144.9889 1/01/1993 Daily
36164 BOM (AUS) Fernhurst 10 3 36 -23.6172 144.2114 1/01/1984 Daily
36165 BOM (AUS) Moorrinya National Park 10 3 36 -21.5028 144.9897 7/01/1995 Daily
36167 BOM (AUS) Longreach Comparison 10 3 36 -23.4372 144.2769 7/02/1996 31-05-1997 Daily
36167 BOM (AUS) Longreach Comparison 10 3 36 -23.4372 144.2769 7/02/1996 31-05-1997 Synop
36168 BOM (AUS) Koondoo 10 3 36 -24.9553 145.2489 1/01/1997 Daily
36171 BOM (AUS) Birkdale 10 3 36 -24.0567 144.7008 1/01/1998 Daily
36172 BOM (AUS) Gue 10 3 36 -21.9667 144.3333 2/03/2004 Daily
37000 BOM (AUS) Alni 10 2 37 -22.1542 142.49 6/01/1916 Daily
37001 BOM (AUS) Ayrshire Downs 10 2 37 -21.9678 142.7214 01-01-1885 Daily
37002 BOM (AUS) Baratria 10 3 37 -22.82 143.385 1/01/1913 Daily
37003 BOM (AUS) Barkly Downs 10 1 37 -20.4661 138.4683 1/01/1904 Daily
37004 BOM (AUS) Beauly 10 2 37 -21.7667 143.5167 1/01/1943 1/01/1945 Daily
37005 BOM (AUS) Bimerah 10 3 37 -24.2189 143.5781 01-01-1885 Daily
37006 BOM (AUS) Bladensburg 10 2 37 -22.515 143.0386 1/01/1917 Daily
37007 BOM (AUS) Brighton Downs 10 2 37 -23.3594 141.5628 01-04-1893 Daily
37008 BOM (AUS) Buckingham Downs 10 1 37 -22.0764 139.7581 1/01/1915 Daily
37009 BOM (AUS) Mackunda Downs 10 2 37 -22.3736 141.2853 10/01/1998 Daily
37010 BOM (AUS) Camooweal Township 10 1 37 -19.9225 138.1214 01-10-1891 30-09-1997 Daily
37010 BOM (AUS) Camooweal Township 10 1 37 -19.9225 138.1214 01-10-1891 30-09-1997 Synop
37010 BOM (AUS) Camooweal Township 10 1 37 -19.9225 138.1214 8/10/1964 30-09-1997 Continuous
37010 BOM (AUS) Camooweal Township 10 1 37 -19.9225 138.1214 29-04-1998 Synop
37011 BOM (AUS) Carandotta Stn 10 1 37 -21.9714 138.6117 01-01-1882 Daily

Lake Eyre Hydrology Appendices
I:\WCMS\Projects\WC03272\Deliverables\final report\LakeEyreHydrol_App_final.doc PAGE 62
Station Agency Station Name Division Basin District Latitude Longitude Opened Closed Interval
37012 BOM (AUS) Cawnpore Stn 10 1 37 -22.9817 140.2933 1/01/1949 1/01/1950 Daily
37013 BOM (AUS) Chatsworth 10 1 37 -21.9744 140.2964 12/01/1914 Daily
37014 BOM (AUS) Cork Stn 10 2 37 -22.9258 142.3119 01-01-1888 Daily
37015 BOM (AUS) Corona Downs 10 3 37 -23.1258 143.4619 01-01-1888 Daily
37016 BOM (AUS) Dagworth Stn 10 2 37 -21.8664 142.1544 01-01-1884 Daily
37017 BOM (AUS) Dajarra Hotel 10 1 37 -21.6944 139.5128 1/01/1940 Daily
37019 BOM (AUS) Duchess Hotel 10 1 37 -21.3564 139.8653 6/01/1914 Daily
37020 BOM (AUS) Elvo Stn 10 2 37 -23.335 142.25 1/01/1940 Daily
37021 BOM (AUS) Fermoy 10 3 37 -23.1697 143.0197 1/01/1915 1/01/1995 Daily
37022 BOM (AUS) Fort William 10 1 37 -22.45 140.0167 1/01/1915 1/01/1953 Daily
37024 BOM (AUS) Headingly Stn 10 1 37 -21.3225 138.2906 01-05-1882 Daily
37025 BOM (AUS) Katandra 10 3 37 -21.55 143.8031 01-01-1885 Daily
37026 BOM (AUS) Aldingham 10 2 37 -22.2806 143.22 24-07-2001 Daily
37027 BOM (AUS) Llanrheidol Stn 10 2 37 -22.2833 141.6 01-01-1888 1/01/1966 Daily
37028 BOM (AUS) Lucknow Stn 10 1 37 -22.7172 140.9172 01-01-1895 Daily
37030 BOM (AUS) Malboona 10 2 37 -21.8886 143.6019 1/01/1903 Daily
37031 BOM (AUS) Manuka 10 2 37 -21.7167 143.4 01-02-1887 31-12-1954 Daily
37032 BOM (AUS) Mayneside 10 2 37 -23.5167 142.55 3/01/1915 31-12-1963 Daily
37033 BOM (AUS) Melrose 10 3 37 -22.7414 143.3342 01-01-1886 Daily
37035 BOM (AUS) Oban Stn 10 1 37 -21.2339 139.0467 9/01/1915 Daily
37036 BOM (AUS) Trepell Airport 10 1 37 -21.84 140.8925 21-08-2001 Continuous
37037 BOM (AUS) Pialaway Downs 10 3 37 -22.4833 143.7167 2/01/1916 31-12-1956 Daily
37038 BOM (AUS) Saville Downs 10 2 37 -22.05 141.5 1/01/1949 1/01/1950 Daily
37040 BOM (AUS) Stonehenge 10 3 37 -24.3514 143.2881 6/01/1921 Daily
37041 BOM (AUS) Stradbroke Stn 10 1 37 -21.5647 139.7231 1/01/1916 Daily
37042 BOM (AUS) Toolebuc 10 1 37 -22.1644 140.8431 1/01/1915 8/09/1992 Daily
37043 BOM (AUS) Urandangie 10 1 37 -21.6119 138.3136 01-11-1891 Daily
37043 BOM (AUS) Urandangie 10 1 37 -21.6119 138.3136 01-11-1891 Synop

Lake Eyre Hydrology Appendices
I:\WCMS\Projects\WC03272\Deliverables\final report\LakeEyreHydrol_App_final.doc PAGE 63
Station Agency Station Name Division Basin District Latitude Longitude Opened Closed Interval
37045 BOM (AUS) Vergemont 10 3 37 -23.5303 143.0086 1/01/1910 10/03/2002 Daily
37046 BOM (AUS) Elderslie 10 2 37 -22.2903 142.4731 01-01-1888 Daily
37048 BOM (AUS) Warenda 10 1 37 -22.6372 140.4958 01-01-1892 8/09/1997 Daily
37049 BOM (AUS) Warrnambool Downs 10 3 37 -22.8131 142.8325 01-01-1887 Daily
37050 BOM (AUS) Whitewood Post Office 10 3 37 -21.4833 143.6 1/01/1913 1/01/1973 Daily
37051 BOM (AUS) Winton Post Office 10 2 37 -22.3908 143.0386 01-01-1884 Daily
37051 BOM (AUS) Winton Post Office 10 2 37 -22.3908 143.0386 01-01-1884 Synop
37051 BOM (AUS) Winton Post Office 10 2 37 -22.3908 143.0386 8/12/1964 Continuous
37052 BOM (AUS) Mundurin Stn 10 2 37 -22.8792 141.8364 1/01/1945 Daily
37055 BOM (AUS) Flora Downs 10 1 37 -20.1153 138.8036 01-02-1894 Daily
37056 BOM (AUS) Mahrigong 10 2 37 -22.2628 143.7447 1/01/1916 Daily
37057 BOM (AUS) Bushy Park 10 1 37 -21.2622 139.7247 1/01/1912 Daily
37060 BOM (AUS) Suvla 10 2 37 -22.5167 142.5833 1/01/1940 1/01/1979 Daily
37061 BOM (AUS) Cotswold Hills 10 2 37 -22.545 142.6683 1/01/1938 Daily
37062 BOM (AUS) Chorregon Railway Stn 10 3 37 -22.6833 143.55 9/01/1964 31-12-1986 Daily
37064 BOM (AUS) Noranside 10 1 37 -22.1667 140 01-01-1889 1/01/1902 Daily
37065 BOM (AUS) Olio Post Office 10 2 37 -21.9 143.2167 1/01/1912 1/01/1938 Daily
37066 BOM (AUS) Happy Valley 10 3 37 -22.9692 142.6458 1/01/1904 1/01/1957 Daily
37067 BOM (AUS) Wandsworth Stn 10 3 37 -25.0333 143.6667 1/01/1965 1/01/1970 Daily
37069 BOM (AUS) Lochern 10 3 37 -24.1167 143.35 1/01/1924 1/01/1931 Daily
37070 BOM (AUS) Oondooroo Railway Stn 10 2 37 -22.1667 143.0833 01-01-1882 1/01/1928 Daily
37072 BOM (AUS) Ardmore 10 1 37 -21.6489 139.1844 1/01/1915 Daily
37073 BOM (AUS) Westerton 10 3 37 -24.0417 142.8317 11/01/1967 Daily
37074 BOM (AUS) Mayfair Stn 10 2 37 -22.45 141.5833 1/01/1965 1/01/1968 Daily
37075 BOM (AUS) Winton Police Stn 10 2 37 -22.3775 143.0333 1/01/1965 1/01/1976 Daily
37076 BOM (AUS) Mount Landsborough 10 2 37 -22.5875 143.2283 6/01/1969 10/03/2002 Daily
37077 BOM (AUS) Linda Downs 10 1 37 -22.2 138.6947 1/01/1969 Daily
37078 BOM (AUS) Middleton Hotel 10 2 37 -22.3522 141.5497 7/01/1970 Daily
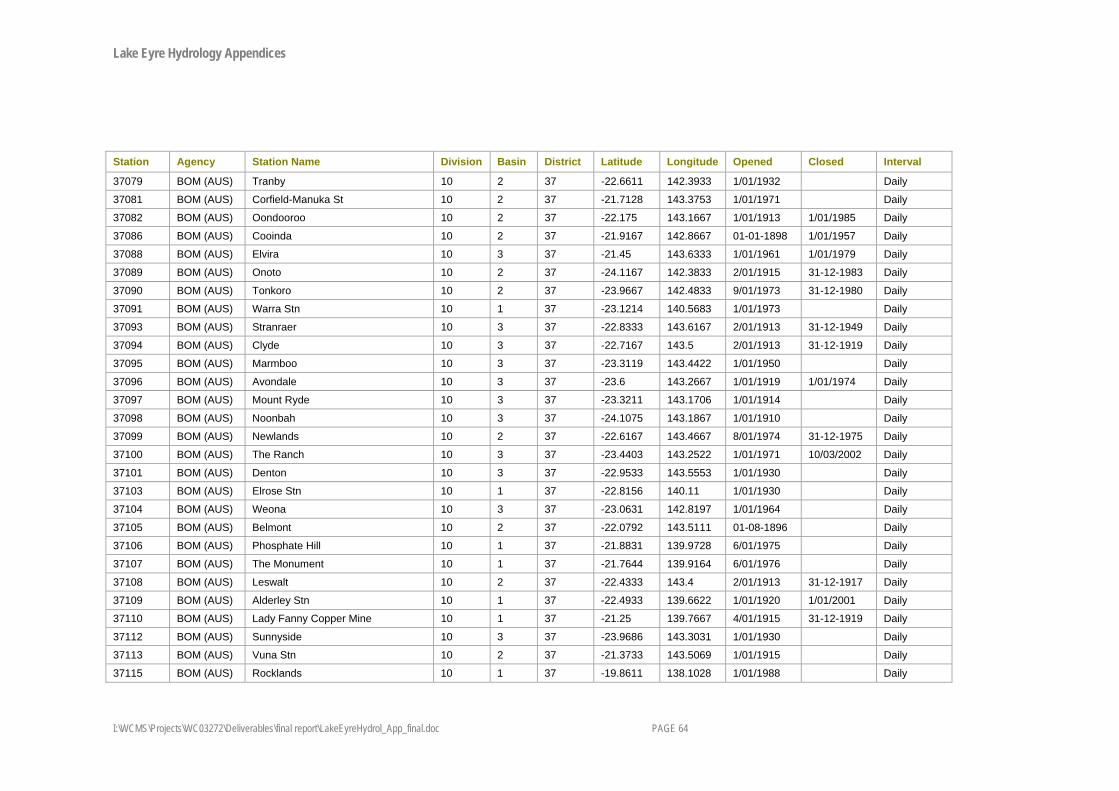
Lake Eyre Hydrology Appendices
I:\WCMS\Projects\WC03272\Deliverables\final report\LakeEyreHydrol_App_final.doc PAGE 64
Station Agency Station Name Division Basin District Latitude Longitude Opened Closed Interval
37079 BOM (AUS) Tranby 10 2 37 -22.6611 142.3933 1/01/1932 Daily
37081 BOM (AUS) Corfield-Manuka St 10 2 37 -21.7128 143.3753 1/01/1971 Daily
37082 BOM (AUS) Oondooroo 10 2 37 -22.175 143.1667 1/01/1913 1/01/1985 Daily
37086 BOM (AUS) Cooinda 10 2 37 -21.9167 142.8667 01-01-1898 1/01/1957 Daily
37088 BOM (AUS) Elvira 10 3 37 -21.45 143.6333 1/01/1961 1/01/1979 Daily
37089 BOM (AUS) Onoto 10 2 37 -24.1167 142.3833 2/01/1915 31-12-1983 Daily
37090 BOM (AUS) Tonkoro 10 2 37 -23.9667 142.4833 9/01/1973 31-12-1980 Daily
37091 BOM (AUS) Warra Stn 10 1 37 -23.1214 140.5683 1/01/1973 Daily
37093 BOM (AUS) Stranraer 10 3 37 -22.8333 143.6167 2/01/1913 31-12-1949 Daily
37094 BOM (AUS) Clyde 10 3 37 -22.7167 143.5 2/01/1913 31-12-1919 Daily
37095 BOM (AUS) Marmboo 10 3 37 -23.3119 143.4422 1/01/1950 Daily
37096 BOM (AUS) Avondale 10 3 37 -23.6 143.2667 1/01/1919 1/01/1974 Daily
37097 BOM (AUS) Mount Ryde 10 3 37 -23.3211 143.1706 1/01/1914 Daily
37098 BOM (AUS) Noonbah 10 3 37 -24.1075 143.1867 1/01/1910 Daily
37099 BOM (AUS) Newlands 10 2 37 -22.6167 143.4667 8/01/1974 31-12-1975 Daily
37100 BOM (AUS) The Ranch 10 3 37 -23.4403 143.2522 1/01/1971 10/03/2002 Daily
37101 BOM (AUS) Denton 10 3 37 -22.9533 143.5553 1/01/1930 Daily
37103 BOM (AUS) Elrose Stn 10 1 37 -22.8156 140.11 1/01/1930 Daily
37104 BOM (AUS) Weona 10 3 37 -23.0631 142.8197 1/01/1964 Daily
37105 BOM (AUS) Belmont 10 2 37 -22.0792 143.5111 01-08-1896 Daily
37106 BOM (AUS) Phosphate Hill 10 1 37 -21.8831 139.9728 6/01/1975 Daily
37107 BOM (AUS) The Monument 10 1 37 -21.7644 139.9164 6/01/1976 Daily
37108 BOM (AUS) Leswalt 10 2 37 -22.4333 143.4 2/01/1913 31-12-1917 Daily
37109 BOM (AUS) Alderley Stn 10 1 37 -22.4933 139.6622 1/01/1920 1/01/2001 Daily
37110 BOM (AUS) Lady Fanny Copper Mine 10 1 37 -21.25 139.7667 4/01/1915 31-12-1919 Daily
37112 BOM (AUS) Sunnyside 10 3 37 -23.9686 143.3031 1/01/1930 Daily
37113 BOM (AUS) Vuna Stn 10 2 37 -21.3733 143.5069 1/01/1915 Daily
37115 BOM (AUS) Rocklands 10 1 37 -19.8611 138.1028 1/01/1988 Daily

Lake Eyre Hydrology Appendices
I:\WCMS\Projects\WC03272\Deliverables\final report\LakeEyreHydrol_App_final.doc PAGE 65
Station Agency Station Name Division Basin District Latitude Longitude Opened Closed Interval
37116 BOM (AUS) Woodstock Stn 10 2 37 -22.2583 141.9464 1/01/1988 Daily
37118 BOM (AUS) Jarvisfield 10 2 37 -22.5067 142.5875 6/01/1990 Daily
37119 BOM (AUS) Thorner Stn 10 1 37 -21.7075 138.4833 6/01/1990 Daily
37120 BOM (AUS) Wyora 10 2 37 -21.8958 143.0967 8/01/1992 Daily
37121 BOM (AUS) Wongan 10 2 37 -21.8 142.5425 10/01/1992 Daily
37122 BOM (AUS) Tulmur 10 2 37 -22.6439 142.2511 2/01/1994 Daily
38000 BOM (AUS) Bedourie Police Stn 10 1 38 -24.3597 139.4714 8/01/1932 Daily
38000 BOM (AUS) Bedourie Police Stn 10 1 38 -24.3597 139.4714 8/01/1932 Synop
38001 BOM (AUS) Betoota 10 2 38 -25.7 140.7667 6/01/1949 31-12-1950 Daily
38002 BOM (AUS) Birdsville Police Stn 10 2 38 -25.9003 139.3486 01-01-1892 5/05/2001 Daily
38002 BOM (AUS) Birdsville Police Stn 10 2 38 -25.9003 139.3486 01-01-1892 5/05/2001 Synop
38003 BOM (AUS) Boulia Airport 10 1 38 -22.9117 139.9039 01-01-1886 Daily
38003 BOM (AUS) Boulia Airport 10 1 38 -22.9117 139.9039 01-01-1886 Synop
38003 BOM (AUS) Boulia Airport 10 1 38 -22.9117 139.9039 15-07-1964 Continuous
38004 BOM (AUS) Navarra 10 3 38 -24.8517 143.6669 10/01/1998 Daily
38005 BOM (AUS) Cluny 10 1 38 -24.5081 139.5881 1/01/1939 Daily
38006 BOM (AUS) Coorabulka 10 1 38 -23.7308 140.3075 01-01-1898 Daily
38007 BOM (AUS) Currawilla Stn 10 2 38 -25.1425 141.3456 01-01-1881 Daily
38008 BOM (AUS) Diamantina Lakes 10 2 38 -23.7642 141.1414 01-01-1890 Daily
38009 BOM (AUS) Glengyle 10 1 38 -24.7867 139.59 3/01/1914 Daily
38010 BOM (AUS) Glenormiston 10 1 38 -22.9144 138.8036 01-09-1890 Daily
38011 BOM (AUS) Jedburgh Stn 10 3 38 -25.0833 143.55 1/01/1913 1/01/1979 Daily
38012 BOM (AUS) Jundah Post Office 10 3 38 -24.8286 143.0592 01-04-1887 Daily
38013 BOM (AUS) Keeroongooloo 10 3 38 -25.9097 142.7961 01-04-1890 Daily
38014 BOM (AUS) Marion Downs 10 1 38 -23.365 139.6556 1/01/1913 Daily
38015 BOM (AUS) Monkira 10 2 38 -24.8217 140.5558 01-01-1882 Daily
38016 BOM (AUS) Moothandella Stn 10 3 38 -25.5458 142.9419 1/01/1926 Daily
38017 BOM (AUS) Mount Leonard Stn 10 2 38 -25.6825 140.7483 11/01/1925 31-10-1953 Daily

Lake Eyre Hydrology Appendices
I:\WCMS\Projects\WC03272\Deliverables\final report\LakeEyreHydrol_App_final.doc PAGE 66
Station Agency Station Name Division Basin District Latitude Longitude Opened Closed Interval
38017 BOM (AUS) Mount Leonard Stn 10 2 38 -25.6825 140.7483 1/01/1973 Daily
38018 BOM (AUS) Retreat (Barcoo River) 10 3 38 -25.1953 143.2756 1/01/1912 Daily
38019 BOM (AUS) Longford 10 3 38 -24.9453 143.9244 1/01/1929 19-06-2002 Daily
38020 BOM (AUS) Roseberth Stn 10 2 38 -25.79 139.5856 7/01/1913 Daily
38021 BOM (AUS) Springfield 10 3 38 -25.8 143.0167 5/01/1914 31-12-1961 Daily
38022 BOM (AUS) Springvale 10 2 38 -23.5564 140.6978 01-01-1888 Daily
38023 BOM (AUS) Tanbar Stn 10 3 38 -25.8433 141.915 01-01-1888 Daily
38024 BOM (AUS) Windorah Post Office 10 3 38 -25.4228 142.6564 01-01-1887 Daily
38024 BOM (AUS) Windorah Post Office 10 3 38 -25.4228 142.6564 01-01-1887 Synop
38024 BOM (AUS) Windorah Post Office 10 3 38 -25.4228 142.6564 10/01/1964 Continuous
38025 BOM (AUS) Sandringham 10 1 38 -24.055 139.0617 6/01/1965 Daily
38026 BOM (AUS) Birdsville Airport 10 2 38 -25.8975 139.3472 27-06-2000 Continuous
38026 BOM (AUS) Birdsville Airport 10 2 38 -25.8975 139.3472 5/06/2001 Daily
38027 BOM (AUS) Annandale Stn 10 1 38 -25.3833 138.6333 01-01-1898 1/01/1924 Daily
38028 BOM (AUS) Kallidiwarry 10 1 38 -25.1833 138.5667 01-04-1890 31-12-1905 Daily
38029 BOM (AUS) Connemarra Stn 10 2 38 -24.2167 142.2667 01-04-1885 31-12-1979 Daily
38030 BOM (AUS) Davenport Downs Stn 10 2 38 -24.155 141.0983 7/01/1944 Daily
38031 BOM (AUS) Durrie Stn 10 2 38 -25.65 140.2333 6/01/1913 31-12-1978 Daily
38032 BOM (AUS) Roxborough Downs 10 1 38 -22.5197 138.8347 01-01-1890 Daily
38033 BOM (AUS) Palparara 10 2 38 -24.8233 141.475 01-01-1893 30-11-1992 Daily
38035 BOM (AUS) Trinidad 10 3 38 -25.5903 143.8917 5/01/1969 Daily
38039 BOM (AUS) Regleigh 10 3 38 -25.7011 143.4558 1/01/1951 Daily
38040 BOM (AUS) Carranya 10 3 38 -25.3039 142.2017 1/01/1958 Daily
38041 BOM (AUS) Hammond Downs 10 3 38 -25.4272 142.82 10/01/1972 Daily
38042 BOM (AUS) Clifton 10 3 38 -25.6478 143.1686 1/01/1956 Daily
38043 BOM (AUS) Lochiel 10 3 38 -24.68 142.385 1/01/1953 Daily
38044 BOM (AUS) Canary 10 1 38 -23.2436 140.3603 9/01/1973 Daily
38045 BOM (AUS) Grahgor Downs 10 2 38 -24.4833 142.45 9/01/1973 31-12-1980 Daily
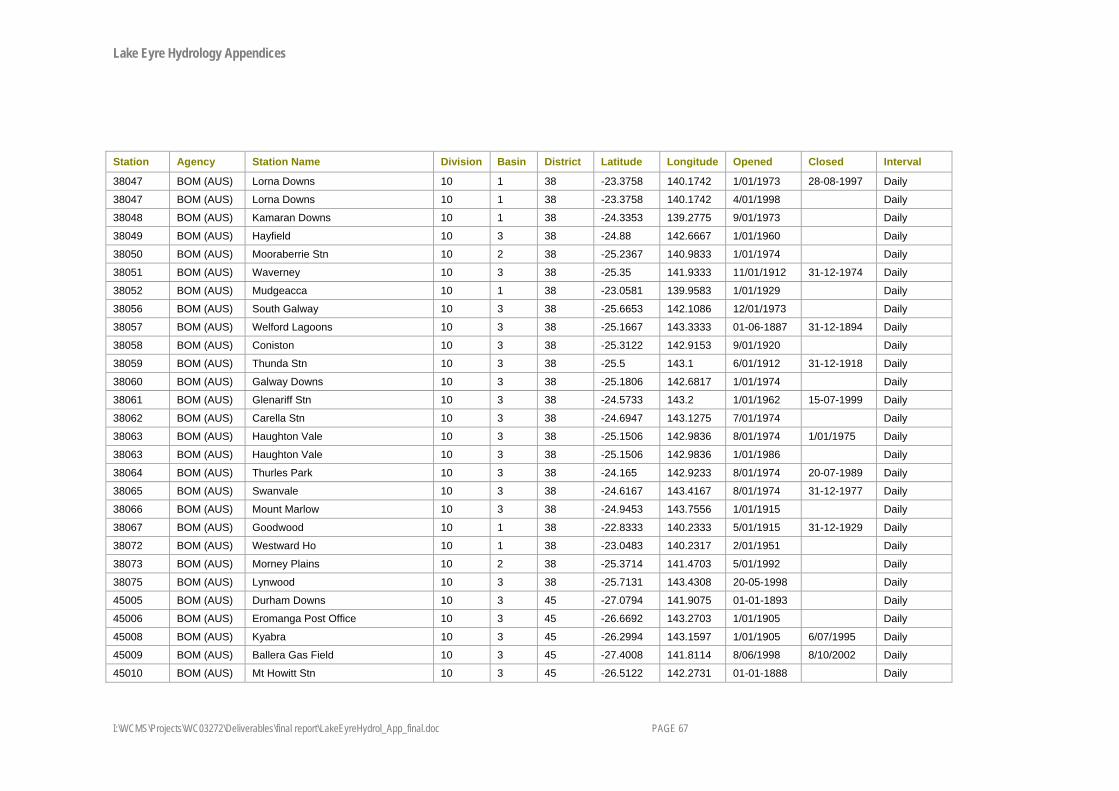
Lake Eyre Hydrology Appendices
I:\WCMS\Projects\WC03272\Deliverables\final report\LakeEyreHydrol_App_final.doc PAGE 67
Station Agency Station Name Division Basin District Latitude Longitude Opened Closed Interval
38047 BOM (AUS) Lorna Downs 10 1 38 -23.3758 140.1742 1/01/1973 28-08-1997 Daily
38047 BOM (AUS) Lorna Downs 10 1 38 -23.3758 140.1742 4/01/1998 Daily
38048 BOM (AUS) Kamaran Downs 10 1 38 -24.3353 139.2775 9/01/1973 Daily
38049 BOM (AUS) Hayfield 10 3 38 -24.88 142.6667 1/01/1960 Daily
38050 BOM (AUS) Mooraberrie Stn 10 2 38 -25.2367 140.9833 1/01/1974 Daily
38051 BOM (AUS) Waverney 10 3 38 -25.35 141.9333 11/01/1912 31-12-1974 Daily
38052 BOM (AUS) Mudgeacca 10 1 38 -23.0581 139.9583 1/01/1929 Daily
38056 BOM (AUS) South Galway 10 3 38 -25.6653 142.1086 12/01/1973 Daily
38057 BOM (AUS) Welford Lagoons 10 3 38 -25.1667 143.3333 01-06-1887 31-12-1894 Daily
38058 BOM (AUS) Coniston 10 3 38 -25.3122 142.9153 9/01/1920 Daily
38059 BOM (AUS) Thunda Stn 10 3 38 -25.5 143.1 6/01/1912 31-12-1918 Daily
38060 BOM (AUS) Galway Downs 10 3 38 -25.1806 142.6817 1/01/1974 Daily
38061 BOM (AUS) Glenariff Stn 10 3 38 -24.5733 143.2 1/01/1962 15-07-1999 Daily
38062 BOM (AUS) Carella Stn 10 3 38 -24.6947 143.1275 7/01/1974 Daily
38063 BOM (AUS) Haughton Vale 10 3 38 -25.1506 142.9836 8/01/1974 1/01/1975 Daily
38063 BOM (AUS) Haughton Vale 10 3 38 -25.1506 142.9836 1/01/1986 Daily
38064 BOM (AUS) Thurles Park 10 3 38 -24.165 142.9233 8/01/1974 20-07-1989 Daily
38065 BOM (AUS) Swanvale 10 3 38 -24.6167 143.4167 8/01/1974 31-12-1977 Daily
38066 BOM (AUS) Mount Marlow 10 3 38 -24.9453 143.7556 1/01/1915 Daily
38067 BOM (AUS) Goodwood 10 1 38 -22.8333 140.2333 5/01/1915 31-12-1929 Daily
38072 BOM (AUS) Westward Ho 10 1 38 -23.0483 140.2317 2/01/1951 Daily
38073 BOM (AUS) Morney Plains 10 2 38 -25.3714 141.4703 5/01/1992 Daily
38075 BOM (AUS) Lynwood 10 3 38 -25.7131 143.4308 20-05-1998 Daily
45005 BOM (AUS) Durham Downs 10 3 45 -27.0794 141.9075 01-01-1893 Daily
45006 BOM (AUS) Eromanga Post Office 10 3 45 -26.6692 143.2703 1/01/1905 Daily
45008 BOM (AUS) Kyabra 10 3 45 -26.2994 143.1597 1/01/1905 6/07/1995 Daily
45009 BOM (AUS) Ballera Gas Field 10 3 45 -27.4008 141.8114 8/06/1998 8/10/2002 Daily
45010 BOM (AUS) Mt Howitt Stn 10 3 45 -26.5122 142.2731 01-01-1888 Daily
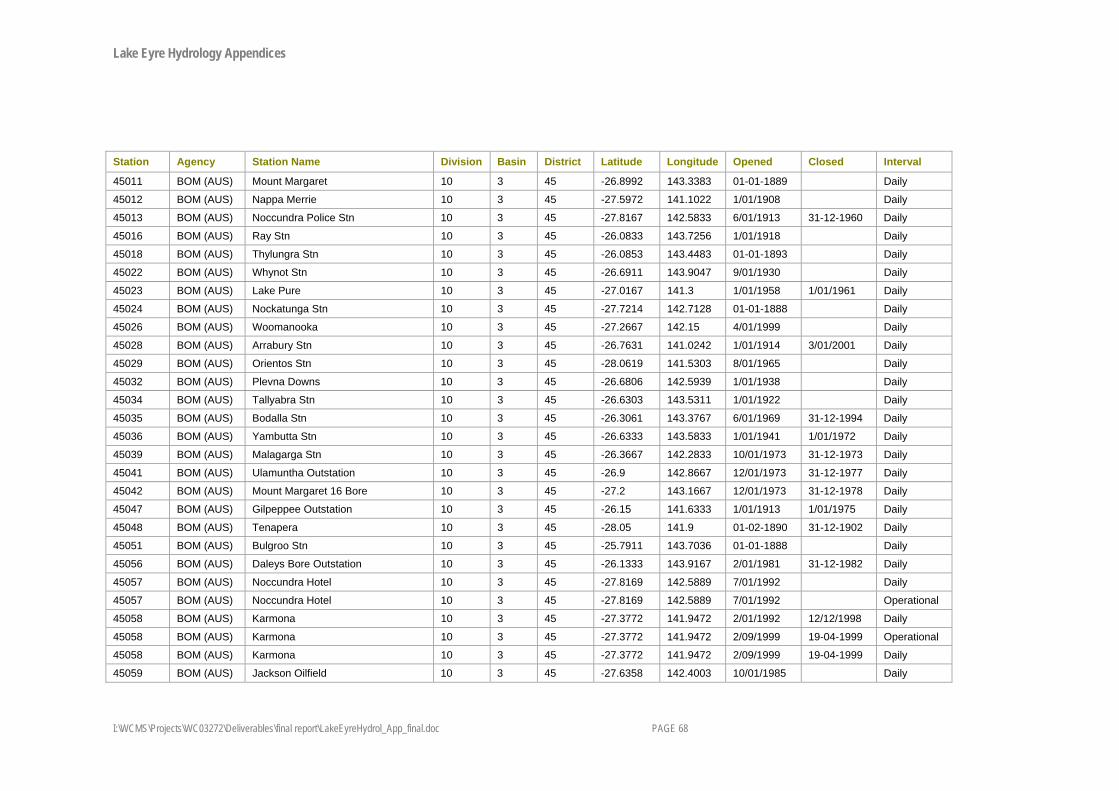
Lake Eyre Hydrology Appendices
I:\WCMS\Projects\WC03272\Deliverables\final report\LakeEyreHydrol_App_final.doc PAGE 68
Station Agency Station Name Division Basin District Latitude Longitude Opened Closed Interval
45011 BOM (AUS) Mount Margaret 10 3 45 -26.8992 143.3383 01-01-1889 Daily
45012 BOM (AUS) Nappa Merrie 10 3 45 -27.5972 141.1022 1/01/1908 Daily
45013 BOM (AUS) Noccundra Police Stn 10 3 45 -27.8167 142.5833 6/01/1913 31-12-1960 Daily
45016 BOM (AUS) Ray Stn 10 3 45 -26.0833 143.7256 1/01/1918 Daily
45018 BOM (AUS) Thylungra Stn 10 3 45 -26.0853 143.4483 01-01-1893 Daily
45022 BOM (AUS) Whynot Stn 10 3 45 -26.6911 143.9047 9/01/1930 Daily
45023 BOM (AUS) Lake Pure 10 3 45 -27.0167 141.3 1/01/1958 1/01/1961 Daily
45024 BOM (AUS) Nockatunga Stn 10 3 45 -27.7214 142.7128 01-01-1888 Daily
45026 BOM (AUS) Woomanooka 10 3 45 -27.2667 142.15 4/01/1999 Daily
45028 BOM (AUS) Arrabury Stn 10 3 45 -26.7631 141.0242 1/01/1914 3/01/2001 Daily
45029 BOM (AUS) Orientos Stn 10 3 45 -28.0619 141.5303 8/01/1965 Daily
45032 BOM (AUS) Plevna Downs 10 3 45 -26.6806 142.5939 1/01/1938 Daily
45034 BOM (AUS) Tallyabra Stn 10 3 45 -26.6303 143.5311 1/01/1922 Daily
45035 BOM (AUS) Bodalla Stn 10 3 45 -26.3061 143.3767 6/01/1969 31-12-1994 Daily
45036 BOM (AUS) Yambutta Stn 10 3 45 -26.6333 143.5833 1/01/1941 1/01/1972 Daily
45039 BOM (AUS) Malagarga Stn 10 3 45 -26.3667 142.2833 10/01/1973 31-12-1973 Daily
45041 BOM (AUS) Ulamuntha Outstation 10 3 45 -26.9 142.8667 12/01/1973 31-12-1977 Daily
45042 BOM (AUS) Mount Margaret 16 Bore 10 3 45 -27.2 143.1667 12/01/1973 31-12-1978 Daily
45047 BOM (AUS) Gilpeppee Outstation 10 3 45 -26.15 141.6333 1/01/1913 1/01/1975 Daily
45048 BOM (AUS) Tenapera 10 3 45 -28.05 141.9 01-02-1890 31-12-1902 Daily
45051 BOM (AUS) Bulgroo Stn 10 3 45 -25.7911 143.7036 01-01-1888 Daily
45056 BOM (AUS) Daleys Bore Outstation 10 3 45 -26.1333 143.9167 2/01/1981 31-12-1982 Daily
45057 BOM (AUS) Noccundra Hotel 10 3 45 -27.8169 142.5889 7/01/1992 Daily
45057 BOM (AUS) Noccundra Hotel 10 3 45 -27.8169 142.5889 7/01/1992 Operational
45058 BOM (AUS) Karmona 10 3 45 -27.3772 141.9472 2/01/1992 12/12/1998 Daily
45058 BOM (AUS) Karmona 10 3 45 -27.3772 141.9472 2/09/1999 19-04-1999 Operational
45058 BOM (AUS) Karmona 10 3 45 -27.3772 141.9472 2/09/1999 19-04-1999 Daily
45059 BOM (AUS) Jackson Oilfield 10 3 45 -27.6358 142.4003 10/01/1985 Daily

Lake Eyre Hydrology Appendices
I:\WCMS\Projects\WC03272\Deliverables\final report\LakeEyreHydrol_App_final.doc PAGE 69
Station Agency Station Name Division Basin District Latitude Longitude Opened Closed Interval
45060 BOM (AUS) Yapunyah Stn 10 3 45 -26.3867 143.1997 1/01/1987 Daily
45061 BOM (AUS) Tau Oilfield 10 3 45 -28.325 141.4483 4/01/1989 18-02-1992 Daily
45063 BOM (AUS) Camerons Corner 10 4 45 -28.9981 140.9997 3/01/1991 12/10/1996 Daily
45064 BOM (AUS) Canaway Downs 10 3 45 -25.9953 143.9253 1/01/1987 Daily
45065 BOM (AUS) Raymore 10 3 45 -26.1422 143.0292 1/01/1995 Daily
46000 BOM (AUS) Binerah Downs 10 3 46 -29.0333 141.55 4/01/1939 31-12-1952 Daily
46003 BOM (AUS) Corona Homestead 10 4 46 -31.2873 141.4437 01-01-1882 Daily
46005 BOM (AUS) Fortville 10 3 46 -29 141.1667 4/01/1936 31-12-1945 Daily
46006 BOM (AUS) Tibooburra (Fort Grey) 10 4 46 -29.0917 141.2022 01-08-1899 Daily
46009 BOM (AUS) Hewart Downs 10 4 46 -29.5167 141.3333 4/01/1928 31-12-1949 Daily
46014 BOM (AUS) Lake Stewart 10 4 46 -29.2833 141.25 12/01/1935 31-12-1950 Daily
46023 BOM (AUS) Mundi Mundi 10 4 46 -31.8833 141.0333 01-01-1894 1/01/1960 Daily
46028 BOM (AUS) Olive Downs 10 3 46 -29.05 141.86 01-09-1896 30-04-1995 Daily
46036 BOM (AUS) Thompsons Siding 10 4 46 -31.6 141.5 1/01/1933 1/01/1946 Daily
46040 BOM (AUS) Waka 10 4 46 -29.2333 141.3333 1/01/1951 1/01/1976 Daily
46049 BOM (AUS) Yandama Downs 10 4 46 -29.6833 141.4167 01-05-1887 31-12-1945 Daily
46050 BOM (AUS) Broken Hill (Pine View) 10 4 46 -30.6978 141.0722 23-07-1999 Daily
46053 BOM (AUS) Theldarpa 10 4 46 -29.6333 141.4833 5/01/1959 31-12-1977 Daily
46066 BOM (AUS) Mokely 10 4 46 -29.45 141.6167 01-06-1899 31-12-1914 Daily
46073 BOM (AUS) Purnamoota 10 4 46 -31.7 141.45 01-08-1887 31-12-1919 Daily
46080 BOM (AUS) Torrowangee 10 4 46 -31.4667 141.4167 01-08-1896 31-12-1925 Daily
46083 BOM (AUS) Wyarra 10 4 46 -30.2667 141.55 01-06-1897 31-12-1913 Daily
46084 BOM (AUS) Wydgah 10 4 46 -30 141.6167 01-06-1897 31-12-1915 Daily
46087 BOM (AUS) Poolamacca 10 4 46 -31.5 141.4 01-01-1879 1/01/1922 Daily
46108 BOM (AUS) Teilta 10 4 46 -30.9333 141.2333 1/01/1911 1/01/1918 Daily
47030 BOM (AUS) Silverton Post Office 10 4 47 -31.8833 141.2167 01-01-1884 1/01/1979 Daily
47035 BOM (AUS) Thackaringa 10 4 47 -32 141.1 01-01-1891 1/01/1949 Daily
47039 BOM (AUS) Umberumberka Reservoir 10 4 47 -31.8167 141.2078 11/01/1911 Daily

Lake Eyre Hydrology Appendices
I:\WCMS\Projects\WC03272\Deliverables\final report\LakeEyreHydrol_App_final.doc PAGE 70
Station Agency Station Name Division Basin District Latitude Longitude Opened Closed Interval
47039 BOM (AUS) Umberumberka Reservoir 10 4 47 -31.8167 141.2078 11/01/1911 Synop
47039 BOM (AUS) Umberumberka Reservoir 10 4 47 -31.8167 141.2078 6/01/1982 20-11-1999 Continuous
47049 BOM (AUS) Broken Hill (Thackaringa) 10 4 47 -32.0682 141.1097 5/03/2001 Daily
47073 BOM (AUS) Tharinga Tank 10 4 47 -32 141.1 01-01-1891 1/01/1923 Daily
47088 BOM (AUS) Thackaringa Town 10 4 47 -32 141.1 01-08-1890 31-12-1918 Daily
47090 BOM (AUS) Rat Hole Tank 10 4 47 -31.9 141.1667 01-01-1891 1/01/1917 Daily
515006 BOM (AUS) Mount Lloyd 10 6 15B -23.6431 133.7981 30-05-2001 Operational
515509 BOM (AUS) Mt Sir Charles 10 6 15B -23.55 134.05 15-12-2003 Operational
530004 NRM (QLD) Oakley Rn 00320002 10 3 30 -21.0156 145.1858 27-07-1995 Continuous
535010 NRM (QLD) Tambo (Old Alpha Rd) RN00330007 10 3 35 -24.8342 146.3122 16-02-1993 Continuous
535011 NRM (QLD) Tarabah RN00330004 10 3 35 -24.5578 146.4436 17-02-1993 Continuous
535043 BOM (AUS) Tambo TM 10 3 35 -24.8817 146.2564 12/12/2003 Operational
536001 NRM (QLD) Swanlea Bore - GS 600306A 10 3 36 -22.4142 145.545 25-07-1995 Continuous
536002 NRM (QLD) Parkgate - GS 600312A 10 3 36 -23.8067 145.7047 23-07-1995 Continuous
536003 NRM (QLD) Jericho/Blackall Rd - GS 600313A 10 3 35 -23.8631 145.8503 9/02/1995 Continuous
536004 NRM (QLD) Grant GS 600314A 10 3 36 -23.3844 145.6878 24-07-1995 Continuous
545002 BOM (AUS) Nappa Merrie TM 10 3 45 -27.6008 141.095 3/04/2002 Operational
AW004502
DWLBC (SA)
Terrapinna Springs 10 4 17 -29.9217 139.6667 1/01/1972 1/01/1991 Continuous
AW004517
DWLBC (SA)
Gammon Plateau 10 4 17 -30.4633 139.05 1/01/1988 Continuous
AW004518
DWLBC (SA)
Exclusion Zone 10 4 17 -30.4383 138.97 1/01/1990 Continuous
AW004519
DWLBC (SA)
near Sambot Waterhole 10 4 17 -30.445 139.035 1/01/1991 Continuous
AW004521
DWLBC (SA)
4 Km Along South Branch 10 4 17 -30.4717 139.0033 1/01/1997 Continuous
R0050004 NRETA (NT) Andado Stn at Stoney Plains 10 6 15B -25.4518 135.1691 9/12/1967 23-07-1970 Continuous
R0050005 NRETA (NT) Jay Ck at Ildjarabada 10 5 15B -23.7667 133.5167 11/07/1975 12/10/1981 Continuous
R0050006 NRETA (NT) Jay Ck at Pyberinge 10 5 15B -24.7167 133.5333 7/04/1974 9/11/1995 Continuous

Lake Eyre Hydrology Appendices
I:\WCMS\Projects\WC03272\Deliverables\final report\LakeEyreHydrol_App_final.doc PAGE 71
Station Agency Station Name Division Basin District Latitude Longitude Opened Closed Interval
R0050007 NRETA (NT) Andado Stn at Swale 10 6 15B -25.28 135.298 17-12-1967 25-07-1970 Continuous
R0050008 NRETA (NT) Jay Ck at Old Hamilton Downs 10 5 15B -23.6504 133.4841 11/08/1972 Continuous
R0050115 NRETA (NT) Hugh R South Rd. X-Ing 10 5 15B -24.3538 133.4331 12/07/1994 Continuous
R0050116 NRETA (NT) Finke R Stuart HWY D/S Rd Br 10 5 15B -24.55 133.3333 28-11-1997 Continuous
R0050139 NRETA (NT) Hermannsburg at RN015006 10 5 15B -23.9525 132.7511 7/08/1993 Continuous
R0050154 NRETA (NT) Hugh R at GS Stuart Pass 10 5 15B -23.7333 133.3333 13-09-1973 3/10/1987 Continuous
R0050158 NRETA (NT) Hugh R at Right(West)Tributary 10 5 15B -23.7233 133.27 9/12/1973 3/10/1987 Continuous
R0060001 NRETA (NT) Andado Bore RN016707 10 6 15B -25.3321 135.3545 28-08-1997 Continuous
R0060003 NRETA (NT) Gillen Ck at Flynn's Grave 10 6 15B -23.7008 133.8178 13-10-1988 Continuous
R0060005 NRETA (NT) Trephina Ck. Trephina Gorge 10 6 15B -23.5383 134.3794 2/02/1993 Continuous
R0060009 NRETA (NT) Todd R Wrb Depot Smith St 10 6 15B -23.6904 133.8636 3/11/1980 Continuous
R0060012 NRETA (NT) Stn Ck at Bond Springs CSIRO Site 64
10 6 15B -23.527 133.922 14-02-1980 Continuous
R0060015 NRETA (NT) Stn Ck at Bond Springs 10 6 15B -23.527 133.9033 14-02-1980 Continuous
R0060016 NRETA (NT) Emily Ck at Undoolya Rd 10 6 15B -23.6956 133.9426 10/08/1981 Continuous
R0060018 NRETA (NT) Stn Ck at Bond Springs 10 6 15B -23.5218 133.9315 14-02-1980 Continuous
R0060019 NRETA (NT) Stn Ck at Bond Springs 10 6 15B -23.5003 133.9231 14-02-1980 Continuous
R0060021 NRETA (NT) White Gums at Alice Springs 10 6 15B -23.7673 133.7831 8/02/1966 21-11-1969 Continuous
R0060041 NRETA (NT) Todd R Rocky Hill 10 6 15B -23.8444 134.0871 19-10-1996 Continuous
R0060044 NRETA (NT) Todd R at Bond Springs (M.36) 10 6 15B -23.5429 133.9452 26-02-1957 Continuous
R0060045 NRETA (NT) Todd R at Bond Springs Turn Off 10 6 15B -23.587 133.8754 15-09-1986 Continuous
R0060047 NRETA (NT) Charles R at Big Dipper [8 RG] 10 6 15B -23.6498 133.8625 14-10-1958 28-02-1979 Continuous
R0060048 NRETA (NT) Charles R at Mt Lloyd 10 6 15B -23.6433 133.7983 14-06-1968 Continuous
R0070009 NRETA (NT) Unca Ck at Jervois Dam 10 7 15B -22.6484 136.2399 14-04-1972 Continuous
R0070010 NRETA (NT) Unca Ck at Jervois Dam Left Tributary
10 7 15B -22.6392 136.239 23-07-1973 Continuous
R0070011 NRETA (NT) Unca Ck at Jervois Dam Right Tributary
10 7 15B -22.6655 136.22 24-07-1973 Continuous
R0070012 NRETA (NT) Unca Ck Jervois Dam at Petrocarb 10 7 15B -22.6484 136.2399 6/01/1972 31-08-1987 Continuous

Lake Eyre Hydrology Appendices
I:\WCMS\Projects\WC03272\Deliverables\final report\LakeEyreHydrol_App_final.doc PAGE 72
Station Agency Station Name Division Basin District Latitude Longitude Opened Closed Interval Camp [8 RG]

Lake Eyre Hydrology Appendices
SINCLAIR KNIGHT MERZ
I:\WCMS\Projects\WC03272\Deliverables\final report\LakeEyreHydrol_App_final.doc PAGE 73

Lake Eyre Hydrology Appendices
SINCLAIR KNIGHT MERZ
I:\WCMS\Projects\WC03272\Deliverables\final report\LakeEyreHydrol_App_final.doc PAGE 74
Appendix G Average Monthly Streamflow Table 1 Average Monthly Streamflow (ML/month)
Station January February March April May June July August September October November December 001101a 87677 520168 331076 141613 73874 27398 9447 6827 3053 1834 4515 16433
001202a 119852 149696 84253 26842 10877 296 1488 381 1 0 2804 38789
001203a 257747 383802 244730 69126 28571 1102 1487 71 8 31 303 54645
001204a 62961 60842 8857 4115 6 0 0 0 0 122 43 4268
002101a 44742 83160 417509 295920 103919 54036 56513 21587 2365 4540 7672 8546
002101b 110647 526020 524765 142332 62034 52816 18465 9549 665 475 5894 7998
002104a 647522 1047319 426693 183294 80828 35336 31784 2638 2 6694 49456 80049
003101a 617929 969403 796981 455109 69675 146413 33265 35499 5060 21967 31753 86008
003103a 66652 401529 334873 288529 91235 63192 36791 16756 9638 3207 12952 8846
003202a 338993 460877 169851 192961 34808 28360 2656 2153 1115 1019 21357 27222
003203a 393399 918521 441154 385847 217433 72414 11338 1161 2502 5692 45656 132982
003204a 123416 134320 44736 14125 16297 2362 714 1904 302 1003 6143 13761
003205a 8974 14687 9130 4925 1941 314 48 0 10 50 2738 2371
003206a 7879 8799 2513 2386 1522 208 188 446 148 3 1445 3439
003301b 341931 130044 11192 4750 6865 435 9 0 0 237 79627 167337
003302a 8751 12598 1981 12181 6455 1070 404 233 143 10 845 2497
003303a 13608 14744 6686 10510 9781 3851 1554 332 485 821 2523 4247
003305a 194 20 24 68 281 38 51 10 5 3 63 58
AW002101 150680 465396 460016 177323 76107 50578 22255 8410 2373 1024 7359 35494
AW003501 84283 414277 262370 191267 271262 194764 88223 31100 11019 3130 13031 12442
AW004508 3728 2269 1007 1901 171 17 19 40 130 97 20 150
AW004520 77 1 44 0 0 0 0 0 0 0 0 17
G0060046 3435 1825 2800 989 611 334 256 161 41 349 698 1266
G0060009 2644 2518 3196 2294 824 42 0 0 2 352 660 1227
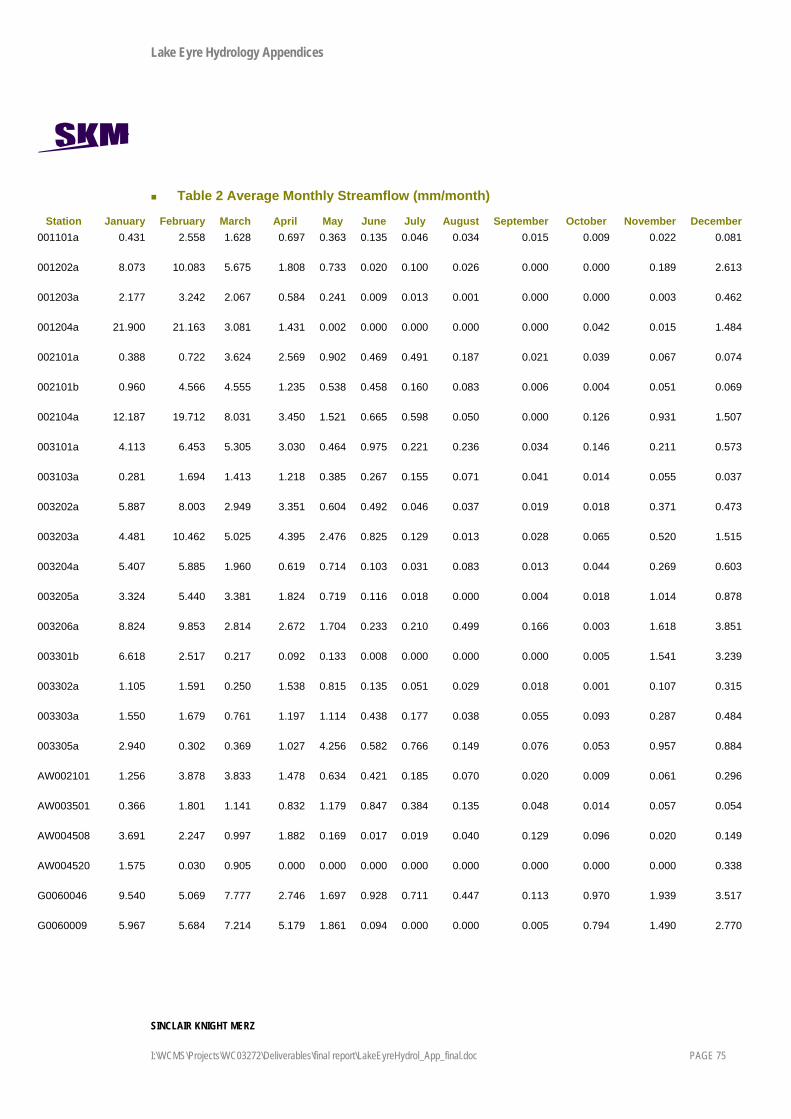
Lake Eyre Hydrology Appendices
SINCLAIR KNIGHT MERZ
I:\WCMS\Projects\WC03272\Deliverables\final report\LakeEyreHydrol_App_final.doc PAGE 75
Table 2 Average Monthly Streamflow (mm/month)
Station January February March April May June July August September October November December 001101a 0.431 2.558 1.628 0.697 0.363 0.135 0.046 0.034 0.015 0.009 0.022 0.081
001202a 8.073 10.083 5.675 1.808 0.733 0.020 0.100 0.026 0.000 0.000 0.189 2.613
001203a 2.177 3.242 2.067 0.584 0.241 0.009 0.013 0.001 0.000 0.000 0.003 0.462
001204a 21.900 21.163 3.081 1.431 0.002 0.000 0.000 0.000 0.000 0.042 0.015 1.484
002101a 0.388 0.722 3.624 2.569 0.902 0.469 0.491 0.187 0.021 0.039 0.067 0.074
002101b 0.960 4.566 4.555 1.235 0.538 0.458 0.160 0.083 0.006 0.004 0.051 0.069
002104a 12.187 19.712 8.031 3.450 1.521 0.665 0.598 0.050 0.000 0.126 0.931 1.507
003101a 4.113 6.453 5.305 3.030 0.464 0.975 0.221 0.236 0.034 0.146 0.211 0.573
003103a 0.281 1.694 1.413 1.218 0.385 0.267 0.155 0.071 0.041 0.014 0.055 0.037
003202a 5.887 8.003 2.949 3.351 0.604 0.492 0.046 0.037 0.019 0.018 0.371 0.473
003203a 4.481 10.462 5.025 4.395 2.476 0.825 0.129 0.013 0.028 0.065 0.520 1.515
003204a 5.407 5.885 1.960 0.619 0.714 0.103 0.031 0.083 0.013 0.044 0.269 0.603
003205a 3.324 5.440 3.381 1.824 0.719 0.116 0.018 0.000 0.004 0.018 1.014 0.878
003206a 8.824 9.853 2.814 2.672 1.704 0.233 0.210 0.499 0.166 0.003 1.618 3.851
003301b 6.618 2.517 0.217 0.092 0.133 0.008 0.000 0.000 0.000 0.005 1.541 3.239
003302a 1.105 1.591 0.250 1.538 0.815 0.135 0.051 0.029 0.018 0.001 0.107 0.315
003303a 1.550 1.679 0.761 1.197 1.114 0.438 0.177 0.038 0.055 0.093 0.287 0.484
003305a 2.940 0.302 0.369 1.027 4.256 0.582 0.766 0.149 0.076 0.053 0.957 0.884
AW002101 1.256 3.878 3.833 1.478 0.634 0.421 0.185 0.070 0.020 0.009 0.061 0.296
AW003501 0.366 1.801 1.141 0.832 1.179 0.847 0.384 0.135 0.048 0.014 0.057 0.054
AW004508 3.691 2.247 0.997 1.882 0.169 0.017 0.019 0.040 0.129 0.096 0.020 0.149
AW004520 1.575 0.030 0.905 0.000 0.000 0.000 0.000 0.000 0.000 0.000 0.000 0.338
G0060046 9.540 5.069 7.777 2.746 1.697 0.928 0.711 0.447 0.113 0.970 1.939 3.517
G0060009 5.967 5.684 7.214 5.179 1.861 0.094 0.000 0.000 0.005 0.794 1.490 2.770
Lake Eyre Hydrology Appendices
SINCLAIR KNIGHT MERZ
I:\WCMS\Projects\WC03272\Deliverables\final report\LakeEyreHydrol_App_final.doc PAGE 76
Appendix H Stream Monitoring Stations in the Lake Eyre Basin
H.1 Northern Territory (Department of Natural Resources, Environment and the Arts)
HYSITREP - Site Summary Report G0010005 - Ranken River at Soudan Homestead SITE DESCRIPTION Site Commenced: 09/08/1965 Site Ceased: Map Name: Ranken SE 53 Local Map Reference: Grid Reference: Zone - 53 Easting - 711046.8 Northing - 7782054.3 Latitude: 20: 2:49S Longitude: 137: 1: 4E Elevation: 22.391 Comment: STATION DESCRIPTION Stream Distance: 0.000 Gauge Zero: 0.000 Gauge Datum: GD Control: Old Causeway Cease to Flow: 0.150 Max gauged stage (m.): 3.730 on 22/02/1977 Catchment Area: 4360.000 GAUGINGS 42 gaugings between 05/05/1960 and 23/07/1986 --------------------------------------------------------------- HYSITREP - Site Summary Report G0050115 - Hugh River at South Road Crossing SITE DESCRIPTION Site Commenced: 18/05/1972 Site Ceased: Map Name: Henbury SG 5 Local Map Reference: Grid Reference: Zone - 53 Easting - 341178.0 Northing - 7305870.6 Latitude: 24:21: 8S Longitude: 133:26: 4E Elevation: 4.358 Comment: STATION DESCRIPTION Stream Distance: 0.000 Gauge Zero: 0.000 Gauge Datum: GD Control: Rock Bar Downstream Of Bridge Cease to Flow: 0.473 Max gauged stage (m.): 3.070 on 19/02/1977

Lake Eyre Hydrology Appendices
SINCLAIR KNIGHT MERZ
I:\WCMS\Projects\WC03272\Deliverables\final report\LakeEyreHydrol_App_final.doc PAGE 77
Catchment Area: 3140.000 GAUGINGS 40 gaugings between 09/03/1972 and 25/02/2004 --------------------------------------------------------------- HYSITREP - Site Summary Report G0050116 - Finke River at South Road Bridge X-ing SITE DESCRIPTION Site Commenced: 28/11/1997 Site Ceased: Map Name: Local Map Reference: Grid Reference: Zone - 53 Easting - 321739.1 Northing - 7283538.7 Latitude: 24:33: 7S Longitude: 133:14:24E Elevation: 3.475 Comment: STATION DESCRIPTION Stream Distance: 0.000 Gauge Zero: 0.000 Gauge Datum: GD Control: Sand & Gravel Bar approx. 30m D/s Gauges Cease to Flow: 0.139 Max gauged stage (m.): 2.625 on 13/01/1985 Catchment Area: 7500.000 GAUGINGS 27 gaugings between 11/01/1972 and 21/02/2003 --------------------------------------------------------------- HYSITREP - Site Summary Report G0050117 - Palmer River at South Road Crossing SITE DESCRIPTION Site Commenced: 09/07/1967 Site Ceased: Map Name: Local Map Reference: Grid Reference: Zone - 53 Easting - 316436.1 Northing - 7261090.7 Latitude: 24:45:14S Longitude: 133:11: 5E Elevation: 2.848 Comment: STATION DESCRIPTION Stream Distance: 0.000 Gauge Zero: 0.000 Gauge Datum: GD Control: Sandy River Bed Cease to Flow: -0.152 Max gauged stage (m.): 2.820 on 12/01/1972 Catchment Area: 6100.000 GAUGINGS 6 gaugings between 11/01/1972 and 10/03/1972

Lake Eyre Hydrology Appendices
SINCLAIR KNIGHT MERZ
I:\WCMS\Projects\WC03272\Deliverables\final report\LakeEyreHydrol_App_final.doc PAGE 78
--------------------------------------------------------------- HYSITREP - Site Summary Report G0050140 - Finke River at Railway Bridge SITE DESCRIPTION Site Commenced: 03/09/1987 Site Ceased: Map Name: Rodinga SG 5 Local Map Reference: Grid Reference: Zone - 53 Easting - 362843.0 Northing - 7241806.8 Latitude: 24:55:58S Longitude: 133:38:30E Elevation: 3.259 Comment: STATION DESCRIPTION Stream Distance: 0.000 Gauge Zero: 0.000 Gauge Datum: GD Control: Sandy River Bed-Unstable Cease to Flow: 1.763 Catchment Area: 15100.000 --------------------------------------------------------------- HYSITREP - Site Summary Report G0060005 - Trephina Creek at Trephina Gorge SITE DESCRIPTION Site Commenced: 15/07/1967 Site Ceased: Map Name: Alice Springs Local Map Reference: Grid Reference: Zone - 53 Easting - 436778.6 Northing - 7396914.4 Latitude: 23:32:13S Longitude: 134:22:50E Elevation: 8.263 Comment: STATION DESCRIPTION Stream Distance: 0.000 Gauge Zero: 0.000 Gauge Datum: GD Control: Sandy River Bed-Unstable Cease to Flow: 1.003 Max gauged stage (m.): 1.011 on 18/10/1976 Catchment Area: 417.000 GAUGINGS 6 gaugings between 18/10/1976 and 30/01/1984 --------------------------------------------------------------- HYSITREP - Site Summary Report G0060008 - Roe Creek at South Road Crossing SITE DESCRIPTION Site Commenced: 20/06/1972 Site Ceased:

Lake Eyre Hydrology Appendices
SINCLAIR KNIGHT MERZ
I:\WCMS\Projects\WC03272\Deliverables\final report\LakeEyreHydrol_App_final.doc PAGE 79
Map Name: A/S SF 53-14 Local Map Reference: Grid Reference: Zone - 53 Easting - 382048.8 Northing - 7365551.5 Latitude: 23:49: 1S Longitude: 133:50:31E Elevation: 6.517 Comment: STATION DESCRIPTION Stream Distance: 0.000 Gauge Zero: 0.000 Gauge Datum: GD Control: Sandy River Bed-Unstable Cease to Flow: 0.456 Max gauged stage (m.): 2.650 on 22/01/1974 Catchment Area: 560.000 GAUGINGS 44 gaugings between 07/03/1967 and 23/03/1976 --------------------------------------------------------------- HYSITREP - Site Summary Report G0060009 - Todd River at Anzac Oval SITE DESCRIPTION Site Commenced: 01/08/1959 Site Ceased: Map Name: A/S SF 53-14 Local Map Reference: 862780 Grid Reference: Zone - 53 Easting - 386341.8 Northing - 7379120.4 Latitude: 23:41:41S Longitude: 133:53: 7E Elevation: 6.916 Comment: Elpro Alert identifier number 4804 for River Data. Elpro Alert identifier number 4805 for Rain Data. STATION DESCRIPTION Stream Distance: 0.000 Gauge Zero: 0.000 Gauge Datum: GD Control: Low: sandy river bed Med: Wills causeway Cease to Flow: 1.164 Max gauged stage (m.): 3.115 on 05/03/1972 Catchment Area: 443.000 GAUGINGS 216 gaugings between 25/04/1957 and 26/05/2004 --------------------------------------------------------------- HYSITREP - Site Summary Report G0060017 - Emily Creek Upstream Undoolya Road SITE DESCRIPTION Site Commenced: 18/09/1981 Site Ceased: Map Name: A/S SF 53-14 Local Map Reference: Grid Reference: Zone - 53 Easting - 396311.7 Northing - 7379588.4
Lake Eyre Hydrology Appendices
SINCLAIR KNIGHT MERZ
I:\WCMS\Projects\WC03272\Deliverables\final report\LakeEyreHydrol_App_final.doc PAGE 80
Latitude: 23:41:28S Longitude: 133:58:59E Elevation: 7.110 Comment: STATION DESCRIPTION Stream Distance: 0.000 Gauge Zero: 0.000 Gauge Datum: GD Control: Sandy River Bed-Unstable Cease to Flow: 1.957 Max gauged stage (m.): 2.830 on 17/12/1984 Catchment Area: 60.000 GAUGINGS 34 gaugings between 14/02/1982 and 20/03/1989 --------------------------------------------------------------- HYSITREP - Site Summary Report G0060040 - Todd River at Amoonguna SITE DESCRIPTION Site Commenced: 26/09/1978 Site Ceased: Map Name: A/S SF 53-14 Local Map Reference: Grid Reference: Zone - 53 Easting - 389697.8 Northing - 7371484.4 Latitude: 23:45:50S Longitude: 133:55: 3E Elevation: 6.797 Comment: STATION DESCRIPTION Stream Distance: 0.000 Gauge Zero: 0.000 Gauge Datum: GD Control: Sandy River Bed-Unstable Cease to Flow: 1.200 Catchment Area: 600.000 --------------------------------------------------------------- HYSITREP - Site Summary Report G0060041 - Todd River Rocky Hill SITE DESCRIPTION Site Commenced: 26/09/1978 Site Ceased: Map Name: ALICE SPRING Local Map Reference: Grid Reference: Zone - 53 Easting - 407162.7 Northing - 7362864.5 Latitude: 23:50:35S Longitude: 134: 5:18E Elevation: 6.915 Comment: STATION DESCRIPTION Stream Distance: 0.000 Gauge Zero: 0.000

Lake Eyre Hydrology Appendices
SINCLAIR KNIGHT MERZ
I:\WCMS\Projects\WC03272\Deliverables\final report\LakeEyreHydrol_App_final.doc PAGE 81
Gauge Datum: GD Control: Causeway/Rock Bar Reasonably Stable Cease to Flow: 1.662 Catchment Area: 2500.000 --------------------------------------------------------------- HYSITREP - Site Summary Report G0060046 - Todd River at Wigley Gorge SITE DESCRIPTION Site Commenced: 21/06/1972 Site Ceased: Map Name: A/S SF 53-14 Local Map Reference: Grid Reference: Zone - 53 Easting - 385987.8 Northing - 7385801.4 Latitude: 23:38: 4S Longitude: 133:52:56E Elevation: 7.067 Comment: Elpro Alert identifier number 4815 for Rainfall Data. Elpro Alert identifier number 4817 for River Data. STATION DESCRIPTION Stream Distance: 0.000 Gauge Zero: 0.000 Gauge Datum: GD Control: Concrete Weir Cease to Flow: 0.303 Max gauged stage (m.): 3.800 on 23/01/1991 Catchment Area: 360.000 GAUGINGS 104 gaugings between 11/01/1960 and 19/02/2004 --------------------------------------------------------------- HYSITREP - Site Summary Report G0060126 - Todd River at Heavitree Gap SITE DESCRIPTION Site Commenced: 02/08/1959 Site Ceased: Map Name: A/S SF 53-14 Local Map Reference: Grid Reference: Zone - 53 Easting - 384316.8 Northing - 7375366.4 Latitude: 23:43:43S Longitude: 133:51:54E Elevation: 6.790 Comment: STATION DESCRIPTION Stream Distance: 0.000 Gauge Zero: 0.000 Gauge Datum: GD Control: Road Causeway Cease to Flow: 0.159 Max gauged stage (m.): 1.417 on 23/02/1967 Catchment Area: 502.000 GAUGINGS 51 gaugings between 25/04/1957 and 29/11/2002

Lake Eyre Hydrology Appendices
SINCLAIR KNIGHT MERZ
I:\WCMS\Projects\WC03272\Deliverables\final report\LakeEyreHydrol_App_final.doc PAGE 82
--------------------------------------------------------------- HYSITREP - Site Summary Report G0070005 - Plenty River at Harts Range SITE DESCRIPTION Site Commenced: 06/12/1969 Site Ceased: Map Name: Huckitta Local Map Reference: Grid Reference: Zone - 53 Easting - 506807.2 Northing - 7475912.2 Latitude: 22:49:28S Longitude: 135: 3:59E Elevation: 11.416 Comment: STATION DESCRIPTION Stream Distance: 0.000 Gauge Zero: 0.000 Gauge Datum: GD Control: Sandy River Bed-Unstable Cease to Flow: 0.310 Max gauged stage (m.): 0.685 on 27/01/1984 Catchment Area: 1774.000 GAUGINGS 3 gaugings between 28/01/1979 and 17/12/2001 --------------------------------------------------------------- HYSITREP - Site Summary Report G0070009 - Unca Creek at Jervois Mine SITE DESCRIPTION Site Commenced: 01/06/1972 Site Ceased: Map Name: Huckitta Local Map Reference: Grid Reference: Zone - 53 Easting - 627507.8 Northing - 7495060.4 Latitude: 22:38:48S Longitude: 136:14:27E Elevation: 14.090 Comment: STATION DESCRIPTION Stream Distance: 0.000 Gauge Zero: 0.000 Gauge Datum: GD Control: Rocky Spillway Reasonably Stable Cease to Flow: 5.818 Max gauged stage (m.): 5.420 on 09/01/1980 Spillway Level: 5.818 Catchment Area: 15.600 GAUGINGS 1 gaugings between 09/01/1980 and 09/01/1980 ---------------------------------------------------------------

Lake Eyre Hydrology Appendices
SINCLAIR KNIGHT MERZ
I:\WCMS\Projects\WC03272\Deliverables\final report\LakeEyreHydrol_App_final.doc PAGE 83
HYSITREP - Site Summary Report G0260004 - Kintore Creek - Downstream SITE DESCRIPTION Site Commenced: 01/09/1994 Site Ceased: Map Name: SF52-15 Mt R Local Map Reference: Grid Reference: Zone - 52 Easting - 539975.2 Northing - 7424211.1 Latitude: 23:17:28S Longitude: 129:23:27E Elevation: 464.273 Comment: STATION DESCRIPTION Stream Distance: 0.000 Gauge Zero: 464.893 Gauge Datum: AHD Control: Rocky creek bed Cease to Flow: 464.772 Catchment Area: 23.000 --------------------------------------------------------------- HYSITREP - Site Summary Report G0260005 - Kintore Creek Upstream SITE DESCRIPTION Site Commenced: 01/09/1994 Site Ceased: Map Name: SF52-15 Mt R Local Map Reference: Grid Reference: Zone - 52 Easting - 539608.2 Northing - 7423602.1 Latitude: 23:17:47S Longitude: 129:23:14E Elevation: 467.252 Comment: STATION DESCRIPTION Stream Distance: 0.000 Gauge Zero: 467.813 Gauge Datum: AHD Control: Rocky creek bed Cease to Flow: 467.745 Catchment Area: 23.000 --------------------------------------------------------------- HYSITREP - Site Summary Report G0280004 - Allungra Creek SITE DESCRIPTION Site Commenced: 06/03/1996 Site Ceased: Map Name: Alcoota 1:25 Local Map Reference: Grid Reference: Zone - 53 Easting - 359329.8 Northing - 7490226.0 Latitude: 22:41:21S Longitude: 133:37:50E Elevation: 9.039

Lake Eyre Hydrology Appendices
SINCLAIR KNIGHT MERZ
I:\WCMS\Projects\WC03272\Deliverables\final report\LakeEyreHydrol_App_final.doc PAGE 84
Comment: STATION DESCRIPTION Stream Distance: 0.000 Gauge Zero: 0.000 Gauge Datum: GD Control: SANDY RIVER BED Cease to Flow: 7.644 Catchment Area: 432.000 --------------------------------------------------------------- HYSITREP - Site Summary Report G0280010 - Woodforde River at Arden Soak Bore SITE DESCRIPTION Site Commenced: 30/05/1974 Site Ceased: Map Name: Napperby Local Map Reference: 662208 Grid Reference: Zone - 53 Easting - 327419.9 Northing - 7525540.8 Latitude: 22:22: 3S Longitude: 133:19:26E Elevation: 9.284 Comment: STATION DESCRIPTION Stream Distance: 0.000 Gauge Zero: 0.000 Gauge Datum: GD Control: Sandy River Bed Cease to Flow: 2.379 Max gauged stage (m.): 2.535 on 19/03/1975 Catchment Area: 393.000 GAUGINGS 4 gaugings between 19/03/1975 and 26/07/1986 --------------------------------------------------------------- HYSITREP - Site Summary Report G0280114 - MCLAREN CREEK AT STUART HIGHWAY SITE DESCRIPTION Site Commenced: 08/06/1964 Site Ceased: Map Name: Bonney Well Local Map Reference: Grid Reference: Zone - 53 Easting - 419266.8 Northing - 7751141.5 Latitude: 20:20:10S Longitude: 134:13:36E Elevation: 16.294 Comment: STATION DESCRIPTION Stream Distance: 0.000 Gauge Zero: 0.000 Gauge Datum: GD Control: Gravel & Rock Bar 150m Downstream Cease to Flow: 0.786 Max gauged stage (m.): 2.610 on 11/02/1982

Lake Eyre Hydrology Appendices
SINCLAIR KNIGHT MERZ
I:\WCMS\Projects\WC03272\Deliverables\final report\LakeEyreHydrol_App_final.doc PAGE 85
Catchment Area: 417.000 GAUGINGS 47 gaugings between 09/03/1967 and 12/12/2000 --------------------------------------------------------------- HYSITREP - Site Summary Report G0290002 - Maryanne Creek At Maryanne Dam Tennant Creek SITE DESCRIPTION Site Commenced: 06/05/1981 Site Ceased: Map Name: Tennant SE 5 Local Map Reference: Grid Reference: Zone - 53 Easting - 417406.1 Northing - 7831765.6 Latitude: 19:36:27S Longitude: 134:12:45E Elevation: 18.159 Comment: STATION DESCRIPTION Stream Distance: 0.000 Gauge Zero: 0.000 Gauge Datum: AHD Control: Concrete Spillway Cease to Flow: 372.717 Spillway Level: 372.717 Catchment Area: 9.000 --------------------------------------------------------------- HYSITREP - Site Summary Report G0290004 - Playford River at Alroy Downs Homestead SITE DESCRIPTION Site Commenced: 05/02/1968 Site Ceased: Map Name: ALROY 1:2500 Local Map Reference: 408582 Grid Reference: Zone - 53 Easting - 612191.1 Northing - 7866520.7 Latitude: 19:17:31S Longitude: 136: 4: 4E Elevation: 22.563 Comment: STATION DESCRIPTION Stream Distance: 0.000 Gauge Zero: 0.000 Gauge Datum: GD Control: Black Soil and Gravel Bank Cease to Flow: 3.021 Max gauged stage (m.): 5.040 on 28/02/1977 Catchment Area: 6620.000 GAUGINGS 5 gaugings between 19/02/1967 and 22/07/1986 --------------------------------------------------------------- HYSITREP - Site Summary Report

Lake Eyre Hydrology Appendices
SINCLAIR KNIGHT MERZ
I:\WCMS\Projects\WC03272\Deliverables\final report\LakeEyreHydrol_App_final.doc PAGE 86
G0290012 - Kelly Creek at Kelly Well. Stuart Highway SITE DESCRIPTION Site Commenced: 07/07/1974 Site Ceased: Map Name: SF53-14 SF53 Local Map Reference: 195501 Grid Reference: Zone - 53 Easting - 417600.2 Northing - 7792281.8 Latitude: 19:57:51S Longitude: 134:12:45E Elevation: 17.233 Comment: STATION DESCRIPTION Stream Distance: 0.000 Gauge Zero: 0.000 Gauge Datum: ASS Control: LOW CONTROL -LOW PROFILE CONCRETE WEIR Cease to Flow: 1.157 Max gauged stage (m.): 2.255 on 19/02/1975 Catchment Area: 62.000 GAUGINGS 61 gaugings between 10/02/1967 and 12/12/2000 --------------------------------------------------------------- HYSITREP - Site Summary Report G0290228 - Morphett Creek Downstream G029227 Nth.Stuart Highway SITE DESCRIPTION Site Commenced: 20/07/1979 Site Ceased: Map Name: Helen Spring Local Map Reference: 18631 Grid Reference: Zone - 53 Easting - 404584.1 Northing - 7911894.2 Latitude: 18:52:58S Longitude: 134: 5:39E Elevation: 19.809 Comment: STATION DESCRIPTION Stream Distance: 0.000 Gauge Zero: 0.000 Gauge Datum: GD Control: Rocky Bar 80m Downstream Cease to Flow: 1.914 Max gauged stage (m.): 3.235 on 10/02/1982 Catchment Area: 211.000 GAUGINGS 27 gaugings between 19/11/1981 and 04/02/1992 --------------------------------------------------------------- HYSITREP - Site Summary Report G0290240 - Tennant Creek at Old Telegraph Station SITE DESCRIPTION Site Commenced: 23/02/1972 Site Ceased:

Lake Eyre Hydrology Appendices
SINCLAIR KNIGHT MERZ
I:\WCMS\Projects\WC03272\Deliverables\final report\LakeEyreHydrol_App_final.doc PAGE 87
Map Name: Tennant Ck. Local Map Reference: Grid Reference: Zone - 53 Easting - 419558.1 Northing - 7837445.6 Latitude: 19:33:22S Longitude: 134:13:59E Elevation: 18.333 Comment: STATION DESCRIPTION Stream Distance: 0.000 Gauge Zero: 0.000 Gauge Datum: GD Control: Rock Bar Cease to Flow: 1.613 Max gauged stage (m.): 4.188 on 19/12/1977 Catchment Area: 72.300 GAUGINGS 48 gaugings between 09/01/1974 and 18/02/1993
H.2 South Australia (Department of Water, Land and Biodiversity Conservation)
AW002101 DIAMANTINA RIVER AT BIRDSVILLE Site Commenced: 01/01/1949 Site Ceased: Map Name: 6746 (100k) Local Map Reference: Grid Reference: Zone - 54 Easting - 336429.0 Northing - 7133424.0 Latitude: 25:54:30S Longitude: 139:22: 1E Elevation: 34.000 100 Level (m) Recording 17/10/1966 to 6/09/2004 Instantaneous 100.9 Level (m) Field Reading 11/03/1977 to 28/03/1990 Instantaneous 141.9 Discharge (Ml/day) Field Reading 19/02/1981 to 13/03/1981 Instantaneous 198.72 Catchment Yield (ML) NLWRA 2000 Curr 1/01/1978 to 1/01/1998 Daily total 450.9 Water Temp. (Deg.C) Field Reading 17/02/1977 to 28/03/1990 Instantaneous 800.91 TDS (mg/L) Lab Result 13/02/1974 to 16/03/1981 Instantaneous 806.9 pH Field Reading 19/02/1981 to 28/03/1990 Instantaneous 806.91 pH Lab Result 15/03/1971 to 16/03/1981 Instantaneous 807.9 Dissolved Oxygen % Field Reading 19/02/1981 to 13/03/1981 Instantaneous 821.9 EC corrected (uS/cm) Field Reading 16/02/1977 to 30/03/2003 Instantaneous 821.91 EC corrected (uS/cm) Lab Result 15/03/1971 to 16/03/1981 Instantaneous --------------------------------------------------------------- AW003501 - COOPER CREEK @ CALLAMURRA WATER HOLE Site Commenced: 22/02/1973 Site Ceased: Map Name: 7042 (100k) Local Map Reference:

Lake Eyre Hydrology Appendices
SINCLAIR KNIGHT MERZ
I:\WCMS\Projects\WC03272\Deliverables\final report\LakeEyreHydrol_App_final.doc PAGE 88
Grid Reference: Zone - 54 Easting - 484536.0 Northing - 6936034.0 Latitude: 27:41:59S Longitude: 140:50:35E Elevation: 46.000 100 Level (m) Recording 22/02/1973 to 5/09/2004 Instantaneous 100.9 Level (m) Field Reading 22/02/1973 to 12/10/1990 Instantaneous 140.9 Discharge (m^3/s) Field Reading 2/10/1985 to 2/10/1985 Instantaneous 141.9 Discharge (Ml/day) Field Reading 29/09/1978 to 5/07/1983 Instantaneous 198.72 Catchment Yield (ML) NLWRA 2000 Curr 1/01/1978 to 1/02/1998 Daily total 450.9 Water Temp. (Deg.C) Field Reading 14/03/1974 to 12/10/1990 Instantaneous 800.91 TDS (mg/L) Lab Result 12/02/1974 to 3/02/1985 Instantaneous 806.9 pH Field Reading 2/11/1978 to 12/10/1990 Instantaneous 806.91 pH Lab Result 17/06/1972 to 3/02/1985 Instantaneous 807.9 Dissolved Oxygen % Field Reading 27/02/1980 to 12/03/1986 Instantaneous 821.9 EC corrected (uS/cm) Field Reading 17/06/1972 to 9/11/2003 Instantaneous 821.91 EC corrected (uS/cm) Lab Result 17/06/1972 to 3/02/1985 Instantaneous
--------------------------------------------------------------- AW004502 - HAMILTON CK @ TERRAPINNA SPRINGS Site Commenced: 21/11/1972 Site Ceased: 01/10/1991 Map Name: 6838 (100k) Local Map Reference: Grid Reference: Zone - 54 Easting - 371229.0 Northing - 6689167.0 Latitude: 29:55:17S Longitude: 139:39:58E Elevation: 135.000 10 Rainfall (mm) Recording 20/03/1982 to 1/10/1991 Daily total 100 Level (m) Recording 21/11/1972 to 1/10/1991 Instantaneous 100.9 Level (m) Field Reading 15/11/1973 to 2/08/1989 Instantaneous 141.9 Discharge (Ml/day) Field Reading 30/09/1978 to 31/07/1979 Instantaneous 450.9 Water Temp. (Deg.C) Field Reading 10/02/1974 to 2/08/1989 Instantaneous 800.91 TDS (mg/L) Lab Result 10/02/1974 to 9/07/1997 Instantaneous 806.9 pH Field Reading 30/09/1978 to 2/08/1989 Instantaneous 806.91 pH Lab Result 19/10/1970 to 19/01/1984 Instantaneous 807.9 Dissolved Oxygen % Field Reading 14/09/1979 to 14/09/1979 Instantaneous 821.9 EC corrected (uS/cm) Field Reading 15/11/1973 to 2/08/1989 Instantaneous 821.91 EC corrected (uS/cm) Lab Result 19/10/1970 to 9/07/1997 Instantaneous
--------------------------------------------------------------- AW004508 - MT MCKINLAY CREEK @ WERTALOONA Site Commenced: 18/09/1973 Site Ceased: 09/05/1989 Map Name: 6736-4 (50k)

Lake Eyre Hydrology Appendices
SINCLAIR KNIGHT MERZ
I:\WCMS\Projects\WC03272\Deliverables\final report\LakeEyreHydrol_App_final.doc PAGE 89
Local Map Reference: Grid Reference: Zone - 54 Easting - 323380.0 Northing - 6605210.0 Latitude: 30:40:22S Longitude: 139: 9:23E 100.00 Level (m) Recording 18/09/1973 to 9/05/1989 Instantaneous 100.90 Level (m) Field Reading 18/09/1973 to 4/01/1989 Instantaneous 141.90 Discharge (Ml/day) Field Reading 20/08/1978 to 21/04/1983 Instantaneous 198.72 Catchment Yield (ML) NLWRA 2000 Curr 1/01/1978 to 1/08/1997 Daily total 450.90 Water Temp. (Deg.C) Field Reading 13/02/1974 to 9/05/1989 Instantaneous 800.91 TDS (mg/L) Lab Result 13/02/1974 to 21/04/1983 Instantaneous 806.90 pH Field Reading 28/05/1978 to 9/05/1989 Instantaneous 806.91 pH Lab Result 18/11/1971 to 21/04/1983 Instantaneous 807.90 Dissolved Oxygen % Field Reading 15/09/1979 to 17/09/1984 Instantaneous 821.90 EC corrected (uS/cm) Field Reading 18/11/1971 to 9/05/1989 Instantaneous 821.91 EC corrected (uS/cm) Lab Result 18/11/1971 to 21/04/1983 Instantaneous
--------------------------------------------------------------- AW004517 - MT MCKINLAY CREEK CATCHMENT PLUVIO @ GAMMON PLATEAU SITE DESCRIPTION Site Commenced: 11/09/1988 Site Ceased: Map Name: 6737-3 (50k) Local Map Reference: Grid Reference: Zone - 54 Easting - 312725.0 Northing - 6628275.0 Latitude: 30:27:47S Longitude: 139: 2:58E Elevation: 930.000 10 Rainfall (mm) Recording 11/09/1988 to 17/02/2002 Daily total
--------------------------------------------------------------- AW004518 - ARCOONA CREEK CATCHMENT PLUVIO @ EXCLUSION ZONE SITE DESCRIPTION Site Commenced: 26/04/1990 Site Ceased: Map Name: 6637-2 (50k) Local Map Reference: Grid Reference: Zone - 54 Easting - 305111.0 Northing - 6630891.0 Latitude: 30:26:18S Longitude: 138:58:14E Elevation: 555.000

Lake Eyre Hydrology Appendices
SINCLAIR KNIGHT MERZ
I:\WCMS\Projects\WC03272\Deliverables\final report\LakeEyreHydrol_App_final.doc PAGE 90
10 Rainfall (mm) Recording 26/04/1990 to 15/02/2002 Daily --------------------------------------------------------------- AW004519 - ARCOONA CREEK CATCHMENT PLUVIO @ near Sambot Waterhole SITE DESCRIPTION Site Commenced: 17/09/1991 Site Ceased: Map Name: 6737-3 (50k) Local Map Reference: Grid Reference: Zone - 54 Easting - 311362.0 Northing - 6630326.0 Latitude: 30:26:40S Longitude: 139: 2: 8E Elevation: 675.000 10.00 Rainfall (mm) Recording 17/09/1991 to 30/09/2001 Daily total --------------------------------------------------------------- AW004520 - ARCOONA CREEK @ GAMMON RANGES NATIONAL PARK Site Commenced: 22/06/1993 Site Ceased: Map Name: 6637-2 (50k) Local Map Reference: Grid Reference: Zone - 54 Easting - 305311.0 Northing - 6631126.0 Latitude: 30:26:10S Longitude: 138:58:22E Elevation: 541.000 100 Level (m) Recording 22/06/1993 to 29/09/2001 Instantaneous 300 Bat Volts Recording 26/08/2000 to 12/07/2001 Instantaneous 450 Water Temp. (Deg.C) Recording 22/04/1995 to 12/07/2001 Instantaneous 820 EC uncorrected mS/m Recording 26/08/2000 to 12/07/2001 Instantaneous
--------------------------------------------------------------- AW004521 - ARCOONA CREEK CATCHMENT PLUVIO @ 4 KM ALONG STH BRANCH Site Commenced: 13/07/1997 Site Ceased: Map Name: 6737-3 (50k) Local Map Reference: Grid Reference: Zone - 54 Easting - 308293.0 Northing - 6627183.0 Latitude: 30:28:20S Longitude: 139: 0:11E Elevation: 657.000

Lake Eyre Hydrology Appendices
SINCLAIR KNIGHT MERZ
I:\WCMS\Projects\WC03272\Deliverables\final report\LakeEyreHydrol_App_final.doc PAGE 91
10.00 Rainfall (mm) Recording 13/07/1997 to 18/02/2002 Daily total
H.3 Queensland (Department of Natural Resources and Mines)
For each record, - The first line shows site/station id, type (gauging station or miscellaneous sampling) and name. - The second line is the latitude, longitude and datum. Zeros mean location is not recorded. - Gauging stations... - Next lines show the variable id, name, units and date range for time series data. For example, 100 Stream Water Level Metres 01/DEC/48 to 17/APR/56 140 Stream Discharge Cumecs 01/DEC/48 to 17/APR/56 Site id Type Name ======= ======= ============================================= --------------------------------------------------------------- 001201A Gauging Georgina River at Lake Nash 21:1:0S 137:55:0E AGD84 100 Stream Water Level Metres 01/DEC/48 to 17/APR/56 140 Stream Discharge Cumecs 01/DEC/48 to 17/APR/56 --------------------------------------------------------------- 001203A Gauging Georgina River at Roxborough Downs 22:30:48S 138:50:30E AGD84 100 Stream Water Level Metres 18/NOV/67 to 30/SEP/88 140 Stream Discharge Cumecs 01/OCT/67 to 30/SEP/88 --------------------------------------------------------------- 001204A Gauging Georgina River at Camooweal 19:55:29S 138:6:48E AGD84 100 Stream Water Level Metres 13/FEB/70 to 30/SEP/88 140 Stream Discharge Cumecs 01/OCT/68 to 30/SEP/88 --------------------------------------------------------------- 001101A Gauging Eyre Creek at Glengyle 24:47:2.0022S 139:35:25.0134E GDA94 100 Stream Water Level Metres 10/DEC/66 to 22/MAY/90 140 Stream Discharge Cumecs 10/DEC/66 to 22/MAY/90 --------------------------------------------------------------- 001202A Gauging Burke River at Boulia 22:54:45S 139:54:46E AGD84 100 Stream Water Level Metres 08/NOV/66 to 01/OCT/88 140 Stream Discharge Cumecs 01/OCT/66 to 01/OCT/88 --------------------------------------------------------------- 002101A Gauging Diamantina River at Birdsville 25:54:12.0066S 139:22:31.0151E AGD84 100 Stream Water Level Metres 08/OCT/49 to 31/JAN/66 140 Stream Discharge Cumecs 01/OCT/49 to 30/SEP/66

Lake Eyre Hydrology Appendices
SINCLAIR KNIGHT MERZ
I:\WCMS\Projects\WC03272\Deliverables\final report\LakeEyreHydrol_App_final.doc PAGE 92
--------------------------------------------------------------- 002101B Gauging Diamantina River at Birdsville 25:54:30S 139:22:20E GDA94 100 Stream Water Level Metres 17/OCT/66 to 30/SEP/88 140 Stream Discharge Cumecs 01/OCT/66 to 30/SEP/88 --------------------------------------------------------------- 002102A Gauging Diamantina River at The Bluff 25:47:33.0139S 139:34:31.0055E AGD84 100 Stream Water Level Metres 24/DEC/48 to 31/JUL/57 140 Stream Discharge Cumecs 24/DEC/48 to 31/JUL/57 --------------------------------------------------------------- 002103A Gauging Diamantina River at Monkira 24:50:43.0015S 140:34:43.988E AGD84 100 Stream Water Level Metres 01/JAN/49 to 01/MAY/63 140 Stream Discharge Cumecs 01/JAN/49 to 31/OCT/63 --------------------------------------------------------------- 002104A Gauging Diamantina River at Diamantina Lake 23:42:45S 141:5:41E AGD84 100 Stream Water Level Metres 15/NOV/66 to 15/SEP/88 140 Stream Discharge Cumecs 15/NOV/66 to 30/SEP/88 --------------------------------------------------------------- 003102A Gauging Cooper Creek at Durham Downs 27:3:14.002S 141:54:9.0184E AGD84 100 Stream Water Level Metres 16/JUN/48 to 26/AUG/53 140 Stream Discharge Cumecs 01/JUN/48 to 31/AUG/53 --------------------------------------------------------------- 003103A Gauging Cooper Creek at Nappa Merrie 27:36:3S 141:5:42E AGD84 100 Stream Water Level Metres 14/MAR/49 to 17/NOV/04 140 Stream Discharge Cumecs 14/MAR/49 to 17/NOV/04 --------------------------------------------------------------- 003101A Gauging Cooper Creek at Currareva 25:22:18S 142:44:30E AGD84 100 Stream Water Level Metres 21/OCT/39 to 23/JUN/88 140 Stream Discharge Cumecs 01/OCT/39 to 23/JUN/88 --------------------------------------------------------------- 003203A Gauging Thomson River at Stonehenge 24:20:7.6S 143:15:18.8E AGD84 100 Stream Water Level Metres 02/DEC/66 to 14/FEB/05 140 Stream Discharge Cumecs 02/DEC/66 to 22/APR/04 --------------------------------------------------------------- 003301A Gauging Barcoo River at Retreat 25:10:47S 143:14:51E AGD84 100 Stream Water Level Metres 05/OCT/48 to 20/DEC/50 --------------------------------------------------------------- 003301B Gauging Barcoo River at Retreat 25:11:7.5S 143:16:52.5E AGD84 100 Stream Water Level Metres 03/DEC/99 to 15/FEB/05

Lake Eyre Hydrology Appendices
SINCLAIR KNIGHT MERZ
I:\WCMS\Projects\WC03272\Deliverables\final report\LakeEyreHydrol_App_final.doc PAGE 93
140 Stream Discharge Cumecs 03/DEC/99 to 15/FEB/05 --------------------------------------------------------------- 003202A Gauging Thomson River at Longreach 23:24:35.5S 144:13:43.4E AGD84 100 Stream Water Level Metres 29/MAY/69 to 23/OCT/04 140 Stream Discharge Cumecs 29/MAY/69 to 23/OCT/04 --------------------------------------------------------------- 003205A Gauging Darr River at Darr 23:12:57.8S 144:4:49.8E AGD84 100 Stream Water Level Metres 17/JUN/69 to 13/FEB/05 140 Stream Discharge Cumecs 17/JUN/69 to 13/FEB/05 --------------------------------------------------------------- 003204A Gauging Cornish Creek at Bowen Downs 22:28:56.6S 145:1:27.3E AGD84 100 Stream Water Level Metres 02/DEC/67 to 11/FEB/05 140 Stream Discharge Cumecs 02/DEC/67 to 11/FEB/05 --------------------------------------------------------------- 003206A Gauging Torrens Creek at Torrens Creek 20:49:0S 145:2:0E AGD84 100 Stream Water Level Metres 08/DEC/76 to 30/SEP/88 140 Stream Discharge Cumecs 24/APR/76 to 30/SEP/88 --------------------------------------------------------------- 003302A Gauging Alice River at Barcaldine 23:39:57.5S 145:12:57.6E AGD84 100 Stream Water Level Metres 05/DEC/67 to 16/FEB/05 140 Stream Discharge Cumecs 05/DEC/67 to 16/FEB/05 --------------------------------------------------------------- 003303A Gauging Barcoo River at Blackall 24:26:29.9913S 145:27:58.0097E AGD84 100 Stream Water Level Metres 01/MAY/69 to 24/OCT/04 140 Stream Discharge Cumecs 01/MAY/69 to 24/OCT/04 --------------------------------------------------------------- 003305A Gauging Mistake Creek at Wololla 23:38:2.0143S 145:57:3.99E AGD84 100 Stream Water Level Metres 12/SEP/74 to 27/AUG/88 140 Stream Discharge Cumecs 12/SEP/74 to 30/SEP/88 ---------------------------------------------------------------