Embed Size (px)
Citation preview

HYDROLOGY
Annual Monitoring Report 2005-2006 Northland Regional Council
1
HYDROLOGY The Northland Regional Council operates a hydrometric network (refer page 2) consisting of river, groundwater, tidal and lake water level and rainfall stations throughout Northland. There are a total of 200 stations on the hydrometric network of which 63 are automated, while the rest are manually read. Of the 63 automated stations 39 (62%) are on a radio/cellphone telemetry network (refer page 5). These networks and the work of the Council’s Hydrology team met relative performance targets (refer page 17) in 2005-2006. In the 2005-2006 financial year two new telemetered water level stations were installed. These included one in the Kaihu River catchment at Parore to record flood levels and flows in the lower Kaihu River, and the other in the Victoria River catchment north of the Mangamuka Hills to enable flood modelling to be carried out for the Awanui River Management Plan as well as provide improved flood warning capabilities for Kaitaia. From July 2005 to June 2006 thirteen severe weather warnings were issued, compared to a total of six warnings issued in 2004-2005. Three severe weather warnings produced significant flooding in various parts of the region. For the Northland region the annual rainfall (refer page 7) totals for 2005-2006 varied between 78% and 130% of the mean annual rainfall. Compared to 2004-2005 where annual rainfall varied between 50% and 92%. The 2005-2006 annual rainfall patterns match very close to the expected annual rainfall amounts. There was a significant variability in climate conditions throughout the year. Major events throughout the seasons included; during winter high rainfall intensities from 32 to 53 mm/hr and dry conditions throughout August; during spring thunderstorm activity, hailstorms, gale force winds, stormy seas, flooding and low rainfall recorded during November; and during summer, heavy rain events during December and January and a dry February, River flows (refer page 10) in 2005-2006 were characterised by below average monthly flows during August, September, November and December. Lower flows were recorded in the far north areas from November to February than elsewhere in the region. Near average to above average flows were recorded in July, October and January through to May.
Flow gauging on Waipoua River

HYDROLOGY
Annual Monitoring Report 2005-2006 Northland Regional Council
2
The Hydrometric Network The Northland Regional Council maintains a comprehensive network of hydrometric stations (such as rainfall, water level, flow and some climatic stations). Monitoring and obtaining information about Northland’s climate and water resources is important so that short and long term changes in climate can be detected. Hydrometric stations have been selected to provide region-wide coverage. Stations are selected to target key river systems that can be used for flood warning purposes and for low water-flow monitoring. The map below shows all the automatic hydrometric stations in Northland including water level, rainfall and groundwater stations operated by NRC, NIWA and MetService.

HYDROLOGY
Annual Monitoring Report 2005-2006 Northland Regional Council
3
The Northland Regional Council’s hydrometric network during 2005-2006 comprised the following: Rainfall Stations
• 60 manual rainfall stations (rainfall recorded daily by voluntary readers) and
• 21 automatic rainfall recorder stations (shown on the map below) There was a 1.15% loss in data for the 21 automatic rainfall stations from July 2005 to June 2006 (compared to 2.1% in the previous year). The loss of record was mainly attributed to faulty instrumentation. The installation of the automatic rainfall stations on Pouto Peninsula and at Omapere have been delayed until next financial year and should be completed by late 2006. Water level stations
• 29 automatic water level stations - (shown on the map below),
• Five automatic tidal water level stations (shown on the map below) and
• 14 lake level stations (manually read by NRC staff on a monthly basis) In 2005-2006 1.41% of the data record for the 34 automated water level stations was missed (compared to 2.4% in 2004-2005). This was attributed to mainly faulty equipment and telemetry communication problems. A new telemetered water level station was installed in the upper catchment of the Victoria River. This was the final station installation to enable flood modelling to be carried out for the Awanui River Management Plan as well as provide improved flood warning capabilities for Kaitaia. Monitoring equipment in the Awanui River catchment now includes seven automatic water level stations and three automatic rainfall stations, which meets the performance targets (refer to page 16) in Hazards and Emergency Management. The water level stations on the Tarawhataroa Stream, Whangatane Spillway and Awanui at Ben Gunn Wharf have been upgraded to cellphone telemetry. All stations in the Awanui River catchments now have telemetry capabilities. Similarly, a new telemetered water level station was installed in the lower Kaihu River at Parore in February 2006, as shown in the photographs below. This station will provide water levels and flows in times of extreme flood events in relation to the Kaihu River Management Plan.
The Regional Council also operate five automatic water level recorders in tidal environments. These are located on the east coast at Rangaunu Harbour, Marsden Point and Opua, and the West Coast at Pouto Point and Dargaville. Water levels are continually recorded at either five minute (Marsden Point and Pouto) or 15-minute intervals (Rangaunu Harbour, Opua and Dargaville) over the full range of tidal cycles.

HYDROLOGY
Annual Monitoring Report 2005-2006 Northland Regional Council
4
Barometric pressure, wind speed, wind direction and rainfall are also measured at the Dargaville station and barometric pressure at Pouto Point. During periods of extreme high tides, there is potential for flooding in low lying coastal areas and Dargaville Township. During such an event water level, wind and barometric information is gathered via the telemetry system and regularly forwarded to the NRC Emergency Management Officer. Groundwater Stations
• Eight automatic water level recorder stations (shown on the map below) and
• 63 manual sites (of which 27 sites are monitored quarterly and 36 monthly) Three ground water bores are measuring water level and conductivity in selected bores predominantly to measure saline intrusion within the groundwater system. These include bores at Mangonui, Russell and Ruawai. The installation of automatic rainfall stations at Mangawhai and Coopers Beach have been delayed until suitable groundwater bores can be selected. Installations are scheduled for early in 2006-2007. Water Quality Stations
• One automatic dissolved oxygen and temperature recorder station is located in the Waipao River catchment and
• Conductivity and temperature recorder stations to monitor groundwater in Russell, Ruawai and Mangonui areas as discussed above
NIWA and MetService stations Stations operated by NIWA and MetService complement the Northland Regional Council’s hydrometric network. These include:
• Four rainfall and eight water level stations operated by NIWA, Whangarei and
• Seven automatic climate and 24 daily rainfall stations operated by NZ MetService

HYDROLOGY
Annual Monitoring Report 2005-2006 Northland Regional Council
5
The Telemetry Network The Northland Regional Council operates a radio and cellular phone telemetry network comprising of 17 rainfall and 27 water level stations from the hydrometric network. These telemetered sites provide a real-time picture of the state of Northland’s water resources during both drought and flood conditions. The map below shows all the telemetered hydrometric stations operated by NRC in Northland including those operated by NIWA, Whangarei and the NZ MetService.
During periods of extreme rainfall, the telemetered sites play an important role in ensuring that both the Civil Defence and the public are kept informed (via media releases) of flooding in Northland. During periods of drought, water levels are monitored and, when a low threshold is reached, a low flow-gauging programme is undertaken in the affected river catchments. These manual measurements enable the flow to be accurately determined and are used to monitor water usage. During 2005-06, a total of 124 flow measurements were carried out in the region, mainly between low and mean flows with the exception of a series of flood gaugings carried out in the Awanui catchment for flood modelling purposes. The photograph below shows flood gauging in Awanui River in November 2005.
HYDROLOGY
Annual Monitoring Report 2005-2006 Northland Regional Council
6
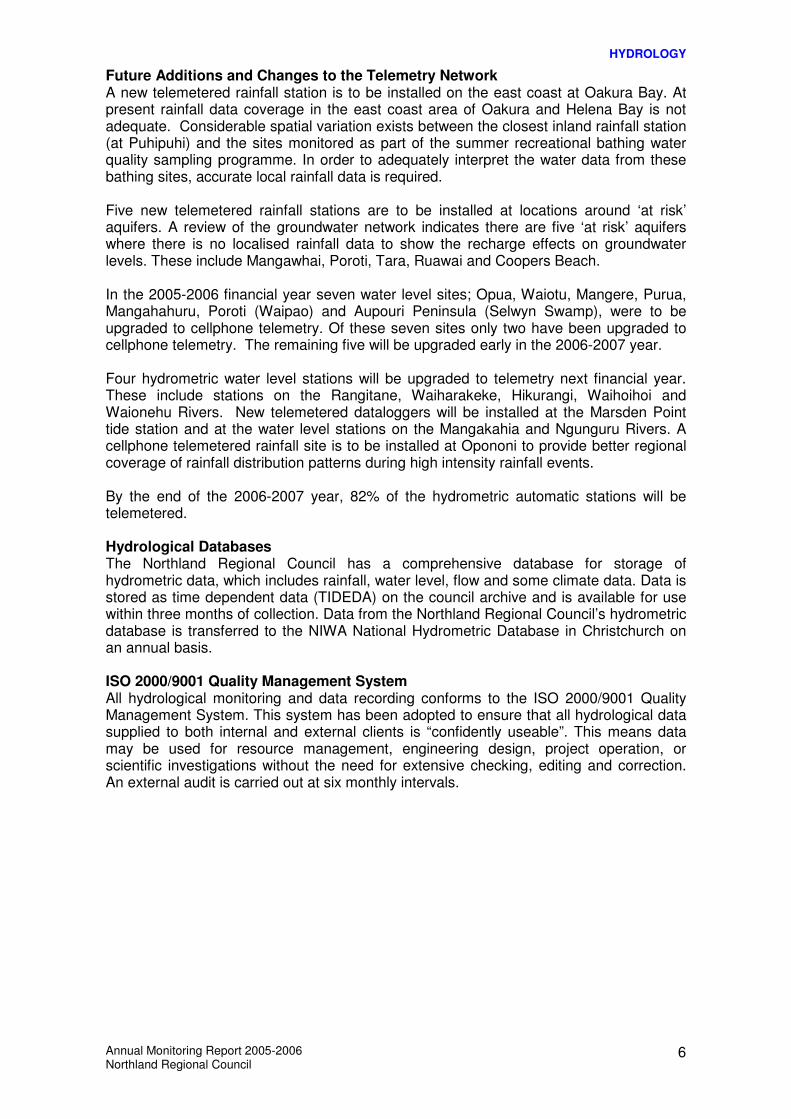
Future Additions and Changes to the Telemetry Network A new telemetered rainfall station is to be installed on the east coast at Oakura Bay. At present rainfall data coverage in the east coast area of Oakura and Helena Bay is not adequate. Considerable spatial variation exists between the closest inland rainfall station (at Puhipuhi) and the sites monitored as part of the summer recreational bathing water quality sampling programme. In order to adequately interpret the water data from these bathing sites, accurate local rainfall data is required. Five new telemetered rainfall stations are to be installed at locations around ‘at risk’ aquifers. A review of the groundwater network indicates there are five ‘at risk’ aquifers where there is no localised rainfall data to show the recharge effects on groundwater levels. These include Mangawhai, Poroti, Tara, Ruawai and Coopers Beach. In the 2005-2006 financial year seven water level sites; Opua, Waiotu, Mangere, Purua, Mangahahuru, Poroti (Waipao) and Aupouri Peninsula (Selwyn Swamp), were to be upgraded to cellphone telemetry. Of these seven sites only two have been upgraded to cellphone telemetry. The remaining five will be upgraded early in the 2006-2007 year. Four hydrometric water level stations will be upgraded to telemetry next financial year. These include stations on the Rangitane, Waiharakeke, Hikurangi, Waihoihoi and Waionehu Rivers. New telemetered dataloggers will be installed at the Marsden Point tide station and at the water level stations on the Mangakahia and Ngunguru Rivers. A cellphone telemetered rainfall site is to be installed at Opononi to provide better regional coverage of rainfall distribution patterns during high intensity rainfall events. By the end of the 2006-2007 year, 82% of the hydrometric automatic stations will be telemetered. Hydrological Databases The Northland Regional Council has a comprehensive database for storage of hydrometric data, which includes rainfall, water level, flow and some climate data. Data is stored as time dependent data (TIDEDA) on the council archive and is available for use within three months of collection. Data from the Northland Regional Council’s hydrometric database is transferred to the NIWA National Hydrometric Database in Christchurch on an annual basis. ISO 2000/9001 Quality Management System All hydrological monitoring and data recording conforms to the ISO 2000/9001 Quality Management System. This system has been adopted to ensure that all hydrological data supplied to both internal and external clients is “confidently useable”. This means data may be used for resource management, engineering design, project operation, or scientific investigations without the need for extensive checking, editing and correction. An external audit is carried out at six monthly intervals.

HYDROLOGY
Annual Monitoring Report 2005-2006 Northland Regional Council
7
Rainfall Topographical variation across Northland causes rainfall distribution patterns to differ considerably over relatively small areas. As a consequence, the hydrological team maintains an extensive rainfall-monitoring network supplemented by NIWA and MetService rainfall sites. Northland experiences high intensity rainfall associated with the passage of tropical or sub-tropical storms that pass over Northland from November to March. These summer cyclone and thunderstorm events give rise to very high intensity rainfalls, leading to sudden flooding. Such rainstorms can yield up to 100 to 150 mm of rainfall per hour. The MetService provides Regional Councils with frequent warnings of approaching potentially adverse weather systems. From July 2005 to June 2006 thirteen severe weather warnings were issued, compared to a total of six warnings issued in 2004-2005. Three severe weather warnings produced significant flooding in various parts of the region. The annual rainfall totals for 2005-2006 varied between 78% and 130% of the mean annual rainfall. Compared to 2004-2005 where annual rainfall varied between 50% and 92%. The maps below show a comparison of the mean annual rainfall for Northland (in mm) on the left and the annual rainfall amounts for 2005-2006 on the right. The 2005-2006 annual rainfall patterns match very close to the expected annual rainfall amounts.
Northland experienced a range of climatic patterns during the year varying from a record dry August, a dry November and February to very wet conditions in July, January, March April and May. During winter there were extremes in weather patterns. In July, high rainfall intensities between 35 mm/hr and 53 mm/hr were recorded at Puhipuhi and Mangawhai (Tara) as a result of a slow moving northerly front. Conversely, August was the driest since 1981, receiving only 43% of the expected rainfall. More information on the hydrological conditions in July and August 2005 is documented in case study one (refer page 12). Spring weather conditions were marked by a whole range of climatic conditions such as intense thunderstorm activity, hail storms, gale force winds, stormy seas, elevated spring
HYDROLOGY
Annual Monitoring Report 2005-2006 Northland Regional Council
8
tides, flood warnings and low rainfall amounts recorded for November. During mid September a series of storm events over 5 days produced gale force winds of 100 km/hr with gusts to 140 km/hr recorded at Cape Reinga. The Barometric pressure recorded at Dargaville dropped to 983hPa causing elevated spring tides. Minor flooding was experienced at Dargaville. Localised thunderstorms associated with hail and intense rainfall developed in the southern areas near Hakaru, Mangawhai and Kaiwaka. More information on the hydrological conditions that occurred in spring is documented in case study two (refer page 13). During December rainfall amounts were slightly below normal. Two north easterly fronts produced isolated, heavy rainfall during mid December and late January. There was a relatively stable period of fine weather between these events. February was relatively dry where rain fell over an average of 6 days during the month. Northland experienced a wet autumn, commencing with two severe weather warnings issued by MetService during March. The remnants of Cyclone Whati brought storm force easterly winds and persistent rain to the Northland region over two days. Well above average rainfall was recorded for April with rain falling over 22 days during early, mid and late April. On 24 April, intense rainfall of up to 112 mm over six hours and a maximum of 34 mm/hr caused severe flooding on SH1 at Rangiahua and SH10 at Kaeo. Flood warnings were issued. May was also wet, with rain falling over 22 days. By contrast, June rainfall was below normal, however, frequent cold southerly winds were predominant bringing very cold conditions to the region. More information on the hydrological conditions in autumn is documented in case study three (refer page 15). The figures on the next page show the mean monthly rainfall in 2005-06 (blue bar) compared to the historical mean monthly rainfall (red line) for various areas in Northland.

HYDROLOGY
Annual Monitoring Report 2005-2006 Northland Regional Council
9
Fig A. Aupouri Rainfall
July 2005 to June 2006
0
50
100
150
200
250
J A S O N D J F M A M JMonth
Rain
fall
(m
m)
Fig B. Kaeo Rainfall
July 2005 to June 2006
0
50
100
150
200
250
300
J A S O N D J F M A M JMonth
Rain
fall
(m
m)
Fig C. Ohaeawai Rainfall
July 2005 to June 2006
0
50
100
150
200
250
300
J A S O N D J F M A M JMonth
Rain
fall
(m
m)
Fig E. Puhipuhi Rainfall
July 2005 to June 2006
0
100
200
300
400
500
J A S O N D J F M A M J
Month
Rain
fall
(m
m)
Fig H. Tara Rainfall
July 2005 to June 2006
0
50
100
150
200
250
300
J A S O N D J F M A M J
Month
Rain
fall
(m
m)
Fig D. Opononi Rainfall
July 2005 to June 2006
0
50
100
150
200
250
J A S O N D J F M A M JMonth
Rain
fall
(m
m)
Fig F Whangarei Rainfall
July 2005 to June 2006
0
50
100
150
200
250
J A S O N D J F M A M J
Month
Rain
fall
(m
m)
Fig I. Dargaville Rainfall
June 2005 to July 2006
0
50
100
150
200
J A S O N D J F M A M J
Month
Rain
fall
(m
m)

HYDROLOGY
Annual Monitoring Report 2005-2006 Northland Regional Council
10
River Flows Northland is characterised by a large number of small catchments and short, meandering streams of gentle slope. Most of the major rivers flow into estuarine environments rather than directly to the open coast. These rivers and streams play an important role in Northland, often providing water for stock, industry and domestic use. Climate and geology influence the flow regimes of Northland’s rivers. Northland’s marked seasonal rainfall pattern is reflected in the broad pattern of higher flows during winter months and lower flows during summer months. Most rivers flow at only 10 - 20% of their yearly average flow in summer. Droughts occur as a result of lower than usual rainfall causing prolonged periods of unusually low river-flow. During drought months (most typically January to March) more accurate monitoring of stream flow is undertaken to establish levels at which water use restrictions may occur. Northland rivers in 2005-2006 were characterised by below average monthly flows during August, September, November and December. Lower flows were recorded in the far north areas compared to elsewhere. From January through to June, river flows were generally average or above average as shown in the figures below. The figures on the next page show the mean monthly flow in 2005-06 (blue bar) compared to the historical mean monthly flow (red line) for various rivers in Northland.

HYDROLOGY
Annual Monitoring Report 2005-2006 Northland Regional Council
11
Fig B. Mean monthly flow (l/s) for
Punakitere River 2005-2006
0
5000
10000
15000
20000
J A S O N D J F M A M J
Month
Flo
w (
l/s)
Fig C. Mean monthly flow (l/s) for
Kaihu River 2005-2006
0
2000
4000
6000
8000
10000
J A S O N D J F M A M J
Month
Flo
w (
l/s)
Fig G. Mean monthly flow (l/s) for
Manganui River 2005-2006
0
10000
20000
30000
40000
J A S O N D J F M A M J
Month
Flo
w (
l/s)
Fig H. Mean monthly flow (l/s) for
North River 2005-2006
0
1000
2000
3000
4000
J A S O N D J F M A M JMonth
Flo
w (
l/s)
Fig A. Mean monthly flow (l/s) for
Aw anui River 2005-2006
0
5000
10000
15000
20000
J A S O N D J F M A M J
Month
Flo
ws (
l/s)
Fig D. Mean monthly flow (l/s)
Mangakahia River 2005-2006
0
10000
20000
30000
40000
50000
60000
J A S O N D J F M A M JMonth
Flo
w (
l/s)
Fig E. Mean monthly flow (l/s) for
Wairua River 2005-2006
0
10000
20000
30000
40000
50000
60000
J A S O N D J F M A M JMonth
Flo
w (
l/s)
Fig F. Mean monthly flow (l/s) for
Waitangi River 2005-2006
0
5000
10000
15000
20000
25000
J A S O N D J F M A M J
Month
Flo
w (
l/s)

HYDROLOGY
Annual Monitoring Report 2005-2006 Northland Regional Council
12
Case Study One: A very wet July and dry August 2005 Above average rainfall was recorded in all areas of Northland in July 2005, mainly as a result of heavy rain falling over three days from 5 to 7 July. On 4 July the MetService issued a heavy rain warning for the Northland region due to a slow moving heavy band of rain developing north of the region. According to the MetService ‘the Northland region was to expect periods of heavy rain and a few thunderstorms with 80 to 100mm falling in some places, particularly in eastern areas. Rainfall intensities were expected to reach 25 to 35mm/hr’. On 5 and 6 July heavy rain was being recorded in the far north and eastern areas of Northland and as a result council staff issued a flood warning. The band of rain was very slow moving and over a period of three days the MetService had issued six updates. High rainfall intensities were recorded at Te Rore (north Mangamuka Hills) 21 mm/hr, Ohaeawai 18 mm/hr, Puhipuhi 35 mm/hr and Tara (Mangawhai) 53 mm/hr. Extensive surface flooding, overtopping of small streams and slips resulted. The following areas recorded the highest rainfall amounts over the three day period; Te Rore 142 mm, Kaeo 145 mm, Ohaeawai 165 mm, Puhipuhi 260 mm, Glenbervie 175 mm and Tara 184 mm. High river levels recorded in the Wairua and Mangakahia Rivers caused flooding of the low-lying river flats at Tangiteroria. High water levels were recorded in most Northland rivers during mid-July and consequently, river flows were above their normal July flows. The photographs below show Mangahahuru Stream, near Whangarei, on 13 July 2005 in high flows (on left) compared to typical low flows during summer (on right).
In contrast, Northland experienced a very dry August, with all rainfall stations recording well below their normal August rainfall amounts, varying from 32 mm recorded at Dargaville (the August average is 130 mm) to 130 mm in the Waima Range at Waimamaku (average 304 mm). Reports from some of the daily rainfall readers indicate that August 2005 was the driest since 1981. Generally, Northland received only 43% of the expected August rainfall. Similarly, river and streams flows were only 34% of their expected flows for August. At the end of May 2005, groundwater levels in the Kaikohe, Whangarei, and Mangawhai areas were at their lowest levels since monitoring commenced in 1980. Groundwater level monitoring from Kaikohe in the north to Mangawhai in the south indicated the lowest winter recharge since the early 1990’s. A rise in ground water levels was recorded during early July; however water levels receded again over August.

HYDROLOGY
Annual Monitoring Report 2005-2006 Northland Regional Council
13
Case Study Two: A stormy spring September 2005 Apart from some areas along the eastern hills, rainfall amounts were below normal for September 2005, varying from 63% of the normal September rainfall at Dargaville to 132% at Puhipuhi. Three moderate rainfall events produced most of September’s rainfall:
• Rainfall from a northeasterly front on 9 to 11 September resulted in localised, intense rainfall along the eastern hills, where rainfall amounts varied from 76 mm at Kaeo to 107 mm at Puhipuhi. While, only modest amounts of 10 to 40 mm were recorded elsewhere over the region.
• On the evening of 14 and 15 September thunderstorm activity produced localised, intense rainfall as the front moved southward in a period of twelve hours.
• On 17 September, MetService issued a severe weather warning. A deepening low had developed in the Tasman Sea, west of the North Island and was expected to bring heavy rain and gale force winds from Northland to the East Cape. As the system approached Northland, wind speeds of 100km/hr, gusting to 140 km/hr were recorded at Cape Reinga. From midday 17 September to midday 18 September the barometric pressure at Dargaville dropped from 1012 hPa to 983 hPa (normally is 1014 hPa). Both coasts of Northland were ‘battered’ by gale force winds, stormy seas and elevated spring tides. Minor flooding was experienced in some low areas of Dargaville as spring tides reached 0.3 metres above the predicted tide heights.
River flows improved from the low flows experienced during August, however flows were still 20% to 40% below their September averages. Groundwater level monitoring indicated that levels were near their lowest recorded for this time of year. October 2005 October was generally a wet month for Northland with rain falling, on average, over 21 days. Heavy rainfall was recorded in early and mid October. Total rainfall amounts varied from 93 mm at Kaitaia to 276 mm at Tutamoe. The MetService issued a severe weather watch on 19 October indicating that Northland could receive 50 to 80 mm in localised areas over a 24-hour period. Rainfall amounts from this event were recorded between 30 to 50mm, mainly in eastern and southern areas of the region. This event was not upgraded to a warning, although a warning was issued to farmers on the lower Wairoa River flats at Tangiteroria as a result of elevated water levels in the Mangakahia River. Apart from some coastal areas to the east of Kaitaia, Northland received 146% of the expected October rainfall. Similarly, river flows were generally normal or above their normal flows for this time of year. Analysis of the September groundwater level data for Northland indicated a trend in water level recovery at most sites. As a result of some heavy rainfall periods during October, particularly on 3 and 20 October, many of the groundwater stations showed a continuation of the water level recovery during October. Results from the automatic recorders showed that water levels at Ruawai, Taipa, Poroti West and Puriri Park (Maunu) were higher than normal for this time of year. The Tara and Mangawhai aquifers showed slightly lower levels. November 2005 November was a month of climatic contrasts for the Northland region. Very low rainfall amounts were recorded over the greater part of the region varying from 19 mm at Ohaeawai and in some coastal areas to the east of Kaitaia to 95 mm in the high west and east coasts hills. Low rainfall amounts (20 to 40 mm) were also recorded in areas from Kaitaia to Kerikeri.

HYDROLOGY
Annual Monitoring Report 2005-2006 Northland Regional Council
14
On 25 November 2005 a very localised thunderstorm associated with hail and intense rainfall developed over the Hakaru, Mangawhai and Kaiwaka area. The MetService issued a severe weather warning for areas between Whangarei to Auckland and the Coromandal Peninsular with expected rainfall of 60 to 80 mm and rainfall rates of 15 to 20 mm per hour. The total rainfall recorded at Hakaru near Kaiwaka on the 26 November was 150 mm. In contrast, the Council’s automatic rainfall station at Maungaturoto recorded only 17 mm for the same day. Annual rainfall amounts were significantly low for this time of year, for example Whangarei had received 1002 mm up to the end of November 2005. This is 32% below the expected, of 1463 mm. Similar results were recorded for far north areas near Kaitaia and Kaikohe. River flows were also low for this time of year, varying from 26% to 65% of their expected flows. Although the groundwater recharge over the winter period has recovered, levels are below their normal November levels. The Far North District Council were advised that groundwater levels were low in the Kaikohe area and that pumping should cease to enable levels to recover.

HYDROLOGY
Annual Monitoring Report 2005-2006 Northland Regional Council
15
Case Study Three: A stormy, wet autumn and cold, early winter March 2006 March rainfall amounts varied from average in the southern parts of Northland to 97% above average in the eastern hills at Puhipuhi. The MetService issued two severe weather warnings for Northland during March, on 7 and 26 March. The latter resulted from a deep depression associated with the remnants of Cyclone Wati (shown in the satellite image below taken at 1pm on 26 March). Strong north easterly winds (up to 140 km/hr recorded at Cape Reinga) brought consistent, heavy rain to the Northland region over two days. The maximum recorded total for the two day period was 191 mm at the Council’s Puhipuhi telemetry station. No flooding eventuated from either rainfall event. As a precaution, on 27 March, warnings of high river levels were issued to residents in the lower flood plains of the Mangakahia, Wairua and Northern Wairoa (Tangiteroria) Rivers. Most river flows were near or above their normal flows for this time of year.
April 2006 Northland experienced a very wet April, with rainfall amounts well above average. Rain fell, on average, over 22 days during April, with heavy rain recorded early, mid and late April. Typically river flows were significantly above their normal April flows. On 24 and 25 April isolated, intense rainfall was recorded in the far north areas around Kaeo and Kaikohe. Kaeo received 90 to 112 mm over a 6 hour period with maximum hourly intensities of 34 mm/hr. More rain fell over the high altitude areas in the Puketi Forest causing water levels in the Waipapa River to reach 5.1 metres at midnight on 24 April. Serious flooding resulted at Rangiahua where flood waters crossed SH1. Kaeo Township was also affected by flood waters from the Kaeo River extending over SH10 at Kaeo. Flood warnings were issued for the Mangakahia, Wairua and Northern Wairoa River catchments. The MetService did not issue a severe weather warning for this event. From 27 April to 2 May the MetService issued a series of severe weather watches and warnings for Northland (including the greater part of the North Island). These warnings were issued as a result of a large, deep depression which had remained relatively stationary in the mid Tasman Sea. A series of fronts accompanied with moist, warm air was expected to generate intense thunderstorm activity as this depression moved across New Zealand. These events were closely monitored while each front moved over Northland. Intense, thunderstorm activity and heavy rain was recorded at isolated areas throughout the region. For example, on 27 April, 55 mm was recorded in 45 minutes at the council’s rainfall station at Maungaturoto and an hour later 30 mm was recorded over

HYDROLOGY
Annual Monitoring Report 2005-2006 16
one hour. At Paparoa, only 7 kilometres to the west of Maungaturoto, the total rain recorded for the same period was only 23 mm. No serious flooding was reported from these isolated events. May 2006 Rain fell, on average, over 22 days during May, similarly to April. Rainfall amounts varied from 110 mm at Dargaville to 407 mm in the eastern hills north of Hikurangi. On 22 May a northerly front produced intense rain of up to 25 mm/hr. The front became stationary over an area from the Bay of Islands to Maungaturoto. During this period over 170 mm was recorded in the Glenbervie Hills and 120 mm at Puhipuhi. Other areas of Northland received 20 to 50 mm during this event. The heavy rain caused extensive surface flooding south of Kawakawa and the elevated river levels in the Mangakahia and Wairua Rivers resulted in flooding of low lying floodplains. On 26 May a larger band of rain resulted in widespread rain over the eastern parts of Northland. Rainfall amounts of 70 to 80 mm were recorded along the eastern hills from Kerikeri to Whangarei while remaining areas of the region received 20 to 40 mm. Typically river flows and ground water levels were higher than normal for May. June 2006 In contrast to April and May, rainfall amounts recorded over Northland during June were generally low, although some western areas near Dargaville and the high altitude areas of the Waima Range recorded near average rainfall amounts. The larger part of the region received 40 to 80% of the expected June rainfall, with the lowest rainfall recorded in the eastern area from Kaeo to Whangarei (40 to 60%). Low river flows were recorded in eastern areas, varying from 58% in the Wairua River to 68% in the Mangaparerua Stream west of Kerikeri. Patches of heavy isolated rain resulted in average river flows in the Waitangi, Waipapa, Kaihu and Ahuroa Rivers. According to the NIWA climate summary for June, “Anticyclones (highs) were much more frequent than average during June in the Australian Bight with ridges of high pressure extending into the south Tasman Sea. This pattern resulted in frequent cold southerly winds over New Zealand.” From the NIWA June statistics, Kerikeri recorded the second
lowest mean air temperature for June since records began in 1982, of 10.4ºC, while
Whangarei recorded the second lowest since 1968, of 10.7ºC. Although cold, sunshine hours were well above normal, for example, Dargaville recorded 150 hours; the highest recorded since 1943.

HYDROLOGY
Annual Monitoring Report 2005-2006 17
Performance Targets To continue to develop and implement a prioritised state of the environment monitoring programme based on the Regional Policy Statement and regional plans by:
• Operating a region-wide network for the measurement, recording, and reporting of rainfall, river-flows lake and groundwater and tide levels
There is also another performance target related to the telemetry network operated by the Regional Council’s Hydrology team, which comes under the Land Operations activity of Hazards and Emergency Management. This is to:
•••• Maintain telemetered rain gauges and telemetered river flow gauges within the Awanui River catchment as part of a flood warning system for Kaitaia.