Embed Size (px)
Citation preview

American Journal of Analytical Chemistry, 2015, 6, 145-155 Published Online January 2015 in SciRes. http://www.scirp.org/journal/ajac http://dx.doi.org/10.4236/ajac.2015.62013
How to cite this paper: Battu, S. and Pottabathini, V. (2015) Hydrolytic Degradation Study of Lansoprazole, Identification, Isolation and Characterisation of Base Degradation Product. American Journal of Analytical Chemistry, 6, 145-155. http://dx.doi.org/10.4236/ajac.2015.62013
Hydrolytic Degradation Study of Lansoprazole, Identification, Isolation and Characterisation of Base Degradation Product Satyanarayana Battu, Vasudev Pottabathini Department of Chemistry, University College of Science, Osmania University, Hyderabad, India Email: [email protected], [email protected] Received 21 December 2014; accepted 16 January 2015; published 20 January 2015
Copyright © 2015 by authors and Scientific Research Publishing Inc. This work is licensed under the Creative Commons Attribution International License (CC BY). http://creativecommons.org/licenses/by/4.0/
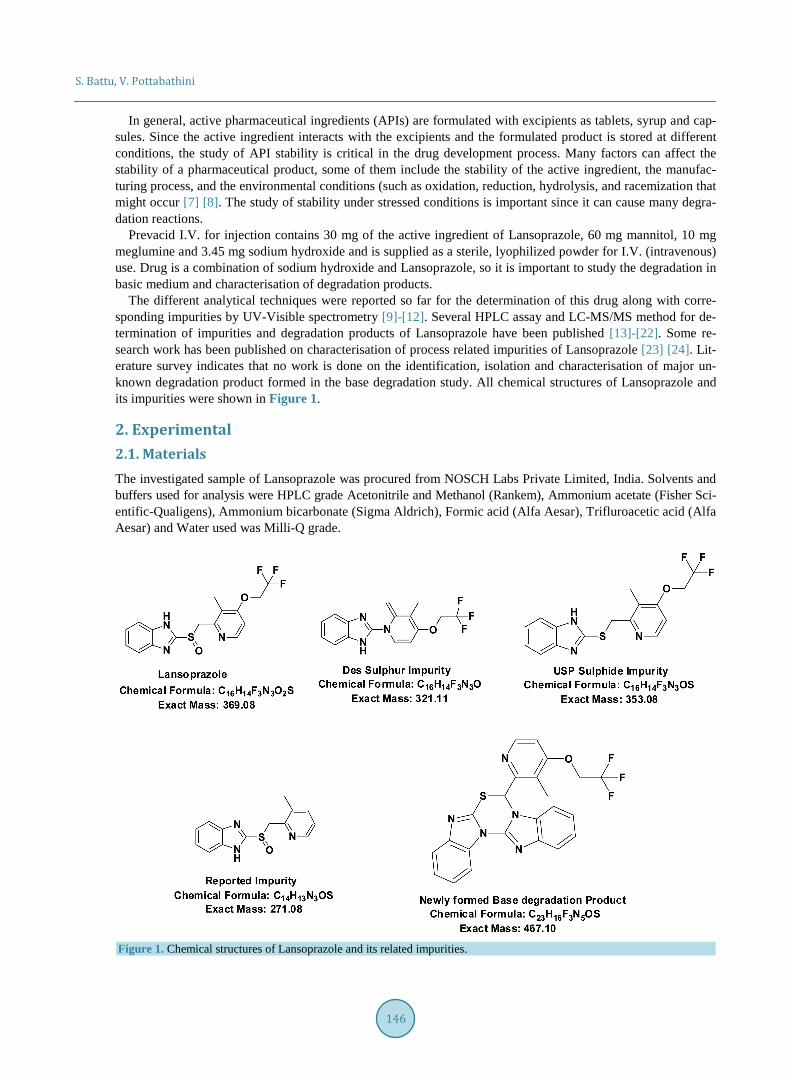
Abstract Lansoprazole degradation is accelerated in both acidic and basic medium in water. The present investigation deals with the hydrolytic degradation of Lansoprazole. Acidic medium degradation show all known impurities and degradation products whereas basic degradation studies show new impurity which has higher molecular weight than Lansoprazole. New impurity was identified, isolated using mass based auto purification system and characterised by 1H NMR, 13C NMR, HMBC, HSQC, NOE, COSY and HRMS experiments. Isolated impurity was showing molecular weight of 467.10, molecular formula of C23H16F3N5OS and its name is 7-(3-Methyl-4-(2,2,2-trifluoroethoxy) pyridin-2-yl)-7H-benzo[4,5]imidazo[2,1-b]benzo[4,5]imidazo[2,1-d][1,3,5]thiadiazine.
Keywords Lansoprazole, Hydrolytic Degradation, Isolation, Characterization, Preparative HPLC, 1H NMR, 13C NMR and 2 D NMR
1. Introduction Lansoprazole, 2-(((3-methyl-4-(2,2,2-trifluoroethoxy)pyridin-2-yl)methyl)sulfinyl)-1H-benzo[d]imidazole is a sub- stituted benzimidazole and is an anti-secretory and anti-ulcerativities. It is effective in treating various peptic diseases, especially those resistant to treatment with histamine H2 receptor antagonists. Therefore it is success- fully used for the treatment of duodenal ulcer, gastric ulcer, reflux oesophagits and Zollinger Ellison syndrome [1]-[6].
S. Battu, V. Pottabathini
146
In general, active pharmaceutical ingredients (APIs) are formulated with excipients as tablets, syrup and cap-sules. Since the active ingredient interacts with the excipients and the formulated product is stored at different conditions, the study of API stability is critical in the drug development process. Many factors can affect the stability of a pharmaceutical product, some of them include the stability of the active ingredient, the manufac-turing process, and the environmental conditions (such as oxidation, reduction, hydrolysis, and racemization that might occur [7] [8]. The study of stability under stressed conditions is important since it can cause many degra-dation reactions.
Prevacid I.V. for injection contains 30 mg of the active ingredient of Lansoprazole, 60 mg mannitol, 10 mg meglumine and 3.45 mg sodium hydroxide and is supplied as a sterile, lyophilized powder for I.V. (intravenous) use. Drug is a combination of sodium hydroxide and Lansoprazole, so it is important to study the degradation in basic medium and characterisation of degradation products.
The different analytical techniques were reported so far for the determination of this drug along with corre-sponding impurities by UV-Visible spectrometry [9]-[12]. Several HPLC assay and LC-MS/MS method for de-termination of impurities and degradation products of Lansoprazole have been published [13]-[22]. Some re-search work has been published on characterisation of process related impurities of Lansoprazole [23] [24]. Lit-erature survey indicates that no work is done on the identification, isolation and characterisation of major un-known degradation product formed in the base degradation study. All chemical structures of Lansoprazole and its impurities were shown in Figure 1.
2. Experimental 2.1. Materials The investigated sample of Lansoprazole was procured from NOSCH Labs Private Limited, India. Solvents and buffers used for analysis were HPLC grade Acetonitrile and Methanol (Rankem), Ammonium acetate (Fisher Sci- entific-Qualigens), Ammonium bicarbonate (Sigma Aldrich), Formic acid (Alfa Aesar), Trifluroacetic acid (Alfa Aesar) and Water used was Milli-Q grade.
Figure 1. Chemical structures of Lansoprazole and its related impurities.

S. Battu, V. Pottabathini
147
2.2. Equipment 2.2.1. Mass Mediated High Performance Liquid Chromatography A mass mediated preparative HPLC equipped with waters pump module 2545, UV detector module 2996, mass detector module 3100, sample manager module 2767 and Masslynx data handling system was used. This system was equipped with both analytical port and preparative port. Mass capillary voltage was maintained 3 KV, Source temperature 150˚C and desolvation temperature 350˚C for the proper ionisation. 0.1% formic acid is used in water: Methanol (90:10) as a makeup solvent to the mass detector through splitter.
Mass Mediated Analytical HPLC Parameters: Column: X-Select CSH C18 (150 × 4.6, 5µ); Mobile phase: 10 mM Ammonium bicarbonate (A): Acetonitrile (B); T/% of B: 0.01/10, 2/10, 11/90, 11.5/100, 13/100, 13.5/10, 15/10; Diluent: Mobile phase; UV detection: 285 nm.
2.2.2. HRMS (High Resolution Mass Spectrometry) Sample was analysed on the waters micro mass Q-TOF equipped with ESI ion source. Sample was analysed in positive mode. Leucine enkephalin (m/z: 555.62268 Da) was used as internal standard to calibrate the mass range and mass accuracy. Data was acquired in positive mode using Masslynx software.
2.2.3. Nuclear Magnetic Resonance Spectroscopy (1H &13C-NMR, COSY, NOE, HMBC, HSQC) The 1H and 13C NMR spectra of base degradation impurity were recorded in DMSO-d6 at 400 MHz, Bruker 400 MHz advance NMR spectrometer. The 1H and 13C chemical shift are reported on δ scale in ppm, relative to TMS (δ 0.00 ppm) and DMSO-d6 (δ 39.50 ppm) as internal standards respectively.
3. Hydrolytic Stress Methods 3.1. Acid Degradation Procedure Acid degradation studies were carried out as per the guidelines of ICH. 200 mg of standard drug was refluxed with 0.1 N HCl solution at 60˚C for 8 h to study acidic degradation. Normality of acidic solution increased gradually from 0.1 N to 2 N to achieve sufficient degradation. For analytical study, the resultant acid degrada- tion sample was dissolved in methanol and diluted with mobile phase and 10 µl injected into the system and the chromatograms were recorded to assess the stability of the sample.
3.2. Base Degradation Procedure Base degradation studies were carried out as per the guidelines of ICH. 200 mg of standard drug was refluxed with 0.1 N NaOH solution at 60˚C for 8 h to study basic degradation. Normality of base solution increased gradually from 0.1 N to 2 N to achieve sufficient degradation. For analytical study, the resultant base degrada-tion sample was dissolved in methanol and diluted with mobile phase and 10 µl injected into the system and the chromatograms were recorded to assess the stability of the sample.
4. Results and Discussion 4.1. Identification of New Base Degradation Product After acid and base degradation the crude sample was injected into the analytical column for the separation of degradation products from the drug peak. To obtain the baseline separation different mobile phases have been used like ammonium acetate, trifluro acetic acid, formic acid, ammonium bicarbonate. Various columns were screened to check the separation and symmetrical peak shape like YMC ODS, YMC Triart, Sunfire, X-terra, X-bride, Agilent zorbax CN, X-Select. Finally desired separation was achieved using the 10 mM ammonium bi- carbonate and acetonitrile as a mobile phase and X-Select column (150 × 4.6 mm, 5µ). In the developed me- thod observed peaks, retention times, molecular weights and area percentages were shown in below tables (Table 1 and Table 2).
From Table 1 and Table 2, it was clearly observed that in acid degradation study observed all peaks are re-

S. Battu, V. Pottabathini
148
Table 1. Degradation products formed in acid forced degradation.
S. No Peak label Retention time Area% Observed mass About the peak
1 Peak-1 8.0 10.59 322.02 (M + H) Des sulphur impurity
2 Peak-2 9.28 55.0 370.05 (M + H) Lansoprazole
3 Peak-3 10.47 24.48 354.03 (M + H) Sulphide impurity
Acid forced degradation products of Lansoprazole. Table 2. Degradation products formed in base forced degradation.
S. No Peak label Retention time Area% Observed mass About the peak
1 Peak-1 6.93 7.37 271.98 (M + H) Reported impurity
2 Peak-2 9.25 37.35 370.05 (M + H) Lansoprazole
3 Peak-3 10.38 8.8 354.03 (M + H) Sulphide impurity
4 Peak-4 11.27 9.9 Mixture of masses 407.13 (M + H), 502.10 (M + H) Unresolved unknown impurities
5 Peak-5 12.63 16.86 468.11 (M + H) Well resolved unknown impurity
Base forced degradation products of Lansoprazole. ported in literature. In base degradation study well resolved unknown major peak of m/z 468.11 (M + H) was not reported in literature. So we intended to isolate m/z 468.11 by using mass mediated auto purification system. Standard chromatogram of Lansoprazole, acid degradation, base degradation chromatograms and mass spec- trums were shown in Figures 2-6.
4.2. Isolation of Base Degradation Product Base degradation study clearly indicates that the peak observed at 12.63 min retention time and having mass m/z 468.11 (M + H) was new entity in base degradation and remaining peaks were matching with the already re-ported impurities. To separate this novel impurity formed in base degradation condition, we scaled up the ana-lytical method to preparative scale. Using the same mobile phase and column having dimensions (150 × 19 mm, 5µ) and a flow rate of 19 ml∙min−1 degradation product has been isolated. In mass based preparative system splitter has been used after the column through which flow has been splitted in the ratio of 1000:1. The one part of the flow is passed through mass detector by diluting with make pump using 1 ml∙min−1 flow rate. For the proper ionisation of the desired impurity 0.1% formic acid has been used as it is more volatile and enhances the ionisation. The delay time of the fraction collector has been investigated by using dye at same flow rate and the same parameters have been given as a input to get the good recovery. The crude sample was neutralised with HCl solution, diluted with mobile phase and injected into the preparative column in three consecutive injections. The fractions have been collected on the basis of mass threshold parameters of total ion chromatogram. After completion of purification collected all fractions of mass 468.11 (M + H) pooled together and lyophilized to get free solid.
5. Structure Elucidation of Base Degradation Product Compound m/z: 468.11 obtained from lyophilization characterized by using HRMS, NMR (1H-NMR, 13C NMR, HMBC, HSQC, NOE and COSY).
5.1. High Resolution Mass Spectrometry From the mass spectrum it was showing:
1) Monoisotopic mass with even electron ions (m/z: 468.0966 (M + H)); 2) Elements observed: C: 0-23 H: 0-17 N: 0-5 O: 0-1 S: 0-1; 3) Molecular formula: C23 H17 N5O S (M + H). From information provided by HRMS report it is matching with expected structure of base degradation product. HRMS report of base degradation product was shown in Figure 7.

S. Battu, V. Pottabathini
149
Figure 2. Standard chromatogram of Lansoprazole.
Figure 3. Acid degradation chromatogram of Lansoprazole.
Figure 4. Mass spectrum of acid degradation chromatogram.

S. Battu, V. Pottabathini
150
Figure 5. Base degradation chromatogram of Lansoprazole.
Figure 6. Mass spectrum of base degradation chromatogram.

S. Battu, V. Pottabathini
151
Figure 7. Mass elemental composition report of base degradation product.
5.2. Nuclear Magnetic Resonance (1H & 13C-NMR, HMBC, HSQC, COSY, NOE) The numbering scheme for the NMR assignments and HMBC correlation for critical singlet proton at 7.914 ppm are shown in Figure 8. The 1H NMR, 13C NMR spectral data of degradation product was compared with those of Lansoprazole. In 1H NMR, one set of –CH2 (Methylene) group protons in Lansoprazole are missing in degra-dation product. As well, in 13C NMR one set of –CH2 (Methylene) group carbon in Lansoprazole missing in degradation product. NMR chemical shifts and 2 D NMR (HSQC, HMBC Correlations) of base degradation pro- duct are shown in Table 3. In NOE study, while irradiating proton chemical shift at 7.914 (Label 11) enhancing signals which are spatially closed signals of methyl protons (Label 9) and aromatic proton (Label 28). It clearly indicates presence of benzimidazoles substituted [1,3,5] Thiadiazine. (HMBC, HSQC, NOE and all other NMR data enclosed in supplementary data). 1H NMR spectrum, 13C NMR spectrum, purity chromatogram of degrada-tion product of Lansoprazole and COSY correlation spectrum were shown in Figures 9-12.
From HMBC, Proton of chemical shift at 7.914 singlet (Label 11) giving correlations to the carbons of labels 8, 10, 13, 22 and 29. The above correlation clearly indicates presence of benzimidazoles substituted [1,3,5] Thiadiazine.
From COSY (1H-1H) study, assumed structure of base degradation product contains four aromatic doublets and four aromatic triplets in two benzimidazole rings and two doublets in pyridine ring. From cosy spectrum it clearly shows correlations with adjacent protons.
Lable-2 (7.793, d) Lable-3 (6.945, d) Lable-19 (8.533, d) Lable-18 (7.501, t) Lable-16 (7.680, d) Lable-17 (7.394, t) Lable-25 (7.742, d) Lable-26 (7.296, t) Lable-28 (7.547, d) Lable-27 (7.254, t) From the above information obtained from the HRMS, 1H NMR, 13C NMR and 2D NMR spectral data it is
clearly matching the assumed structure of base degradation product.
6. Conclusion The fast, simple and sensitive method has been optimised for the separation of degradation product of Lanso-

S. Battu, V. Pottabathini
152
Figure 8. Numbering scheme and HMBC correlation structures of base degradation product.
Figure 9. 1H NMR spectrum of degradation product in DMSO.
Figure 10. 13C NMR spectrum of base degradation product.
N OF
F
FN
S
NN
N
1
2 3
4 5
6
78
9101112
1314
15
16
1718
19
2021 22
2324
25
26
272829
30
N OF
F
FN
S
NN
N

S. Battu, V. Pottabathini
153
Table 3. NMR chemical shifts and HMBC, HSQC correlations.
S. No Label 1H Chemical
Shift (in PPM) 13C Chemical Shift
(in PPM) HSQC HMBC
1 1 - - - -
2 2 7.793 (d) 148.052 7.793 (1H), 148.052 (13C) 161.160, 107.994
3 3 6.945 (d) 107.994 6.945 (1H), 107.994 (13C) 161.160, 118.158
4 4 - 161.160 161.160 (13C, quartenary) -
5 5 - - - -
6 6 4.878 (q) 64.596 4.478 (1H), 64.596 (13C) 161.160, 123.024
7 7 - 123.024 123.024 (13C, quartenary) -
8 8 - 118.158 118.158 (13C, quartenary) -
9 9 2.475 (s) 9.842 2.475 (1H), 9.842 (13C) 118.158, 161.160, 154.261
10 10 - 154.261 154.261(quartenary) -
11 11 7.914 (s) 54.295 7.914 (1H), 54.295 (13C) 154.261, 118.158, 131.670, 142.936, 144.780
12 12 - - - -
13 13 - 144.780 144.780 (quartenary) -
14 14 - - - -
15 15 - 142.313 142.313 (quartenary) -
16 16 7.680 (d) 118.796 7.680 (1H), 118.796 (13C) 124.178, 131.913
17 17 7.394 (t) 124.178 7.394 (1H), 124.178 (13C) 113.437, 142.313
18 18 7.501 (t) 124.178 7.501 (1H), 124.178 (13C) 131.913, 118.796
19 19 8.533 (d) 113.437 8.533 (1H), 113.437 (13C) 124.178, 142.313
20 20 - 131.913 131.913 (quartenary) -
21 21 - - - -
22 22 - 142.936 142.936 (quartenary)
23 23 - - - -
24 24 - 140.552 140.552 (quartenary) -
25 25 7.742 (d) 118.796 7.742 (1H), 118.796 (13C) 122.774, 131.670
26 26 7.296 (t) 122.774 7.296 (1H), 122.774 (13C) 109.998, 140.552
27 27 7.254 (t) 122.774 7.254 (1H), 122.774 (13C) 118.796, 131.670
28 28 7.547 (d) 109.998 7.547 (1H), 109.998 (13C) 122.774, 140.552
29 29 - 131.670 131.670 (qurtenary) -
30 30 - - - -
Figure 11. Purity chromatogram of degradation product.

S. Battu, V. Pottabathini
154
Figure 12. COSY [1H-1H] correlations. prazole in hydrolytic stressed condition. The impurity of Lansoprazole formed in base degradation was identi-fied and isolated using a mass mediated preparative HPLC system equipped analytical and preparative ports. Isolated degraded product was characterized by HRMS and NMR (1H, 13C and HMBC, HSQC, NOE and COSY) techniques. The HRMS and NMR spectral data of isolated product was confirmed to have a mass of 467.10 and with molecular formula of C23H16F3N5OS. It was further confirmed that the isolated base degradation impurity from this method is different from all the reported impurities of Lansoprazole in the literature, having chemical name of 7-(3-Methyl-4-(2,2,2-trifluoroethoxy)pyridin-2-yl)-7H-benzo[4,5]imidazo[2,1-b]benzo[4,5]imidazo [2,1-d]- [1,3,5]thiadiazine.
References [1] Richter, J.E., Campbell, D.R., Kahrilas, P.J., Huang, B. and Fludas, C. (2000) Lansoprazole Compared with Ranitidine
for the Treatment of Nonerosive Gastroesophageal Reflux Disease. Archives of Internal Medicine, 160, 1803-1809. http://dx.doi.org/10.1001/archinte.160.12.1803
[2] Brummer, R.J., Geerling, B.J. and Stockbrugger, R.W. (1997) Initial and Chronic Gastric Acid Inhibition by Lanso-prazole and Omeprazole in Relation to Meal Administration. Digestive Disease and Sciences, 42, 132-137.
[3] Tang, G., Serfaty-Lacronsniere, C., Camilo, M.E. and Russell, R.M. (1996) Gastric Acidity Influences the Blood Re-sponse to a Beta-Carotene Dose in Humans. American Journal of Clinicle Nutrition, 64, 22-26.
[4] Tolman, K.G., Sanders, S.W., Buchi, K.N., Karol, M.D., Jennings, D.E. and Ringham, G.L. (1997) The Effects of Oral Doses of Lansoprazole and Omeprazole on Gastric pH. Journal of Clinicle Gastroenterology, 24, 65-70. http://dx.doi.org/10.1097/00004836-199703000-00003
[5] Fitton, A. and Wiseman, L. (1996) Pantoprazole: A Review of Its Pharmacological Properties and Therapeutic Use in Acid- Related Disorders. Drugs, 51, 460-482. http://dx.doi.org/10.2165/00003495-199651030-00012
[6] Matheson, A.J. and Jarvis, B. (2001) Lansoprazole: An Update of Its Place in the Management of Acid-Related Disor-ders. Drugs, 61, 1801-1833. http://dx.doi.org/10.2165/00003495-200161120-00011
[7] Nudelman, N.S. and Estabilidad de (1975) Medicamentos. EI Ateno, Buenos Aires.

S. Battu, V. Pottabathini
155
[8] Kommanaboyina, B. and Rhodes, C.T. (1999) Trends in Stability Testing, with Emphasis on Stability during Distribu-tion and Storage. Drug Development and Industrial Pharmacy, 25, 857-868. http://dx.doi.org/10.1081/DDC-100102246
[9] Karljikovic-Rajic, K., Novovic, D., Marinkovic, V. and Agbaba, D. (2003) Journal of Pharmaceutical and Biomedical Analysis, 32, 1019-1027.
[10] Anil Kumar, A., Venkata Ramana, K., Narasimha Raju, C.H. and Sudhakara Rao, G. (2012) A Simple UV Spectrophoto- metric Method for Determination of Lansoprazole in Bulk and Pharmaceutical Dosage Forms. International Journal of Pharmaceutical, Chemical and Biological Sciences, 2, 524-528.
[11] Alagar raja, M., Yadav, S.K., Rai, A. and Mishra, S. (2011) Analytical Estimation of Lansoprazole and Validation of Simple Spectrophotometric in Bulk and Capsule Formulation. International Journal of Research in Pharmaceutical Sciences, 2, 521-524.
[12] Okram, Z.D., Kanakapura, B., Jagannathamurthy, R.P. and Basavaiah, V.K. (2012) Development of a Simple UV-Spec- trophotometric Method for the Determination of Lansoprazole and Study of Its Degradation Profile. Química Nova, 35, 386-391. http://dx.doi.org/10.1590/S0100-40422012000200027
[13] Rao, P.V., Kumar, M.N. and Kumar, M.R. (2013) A Novel, Validated Stability-Indicating UPLC Method for the Esti-mation of Lansoprazole and Its Impurities in Bulk Drug & Pharmaceutical Dosage Forms. Scientia Pharmaceutica, 81, 183-193. http://dx.doi.org/10.3797/scipharm.1210-09
[14] Al-Momani, I.F. and Rababah, M.H. (2010) Validation of HPLC and FIA Spectrophotometric Methods for the Deter-mination of Lansoprazole in Pharmaceutical Dosage Forms and Human Plasma. American Journal of Analytical Che- mistry, 1, 34-39. http://dx.doi.org/10.4236/ajac.2010.11005
[15] Muthu Kumar, S., Selva Kumar, D., Raj Kumar, T., Udhaya Kumar, E., Suba Geetha, A. and Diwedi, D. (2010) De-velopment and Validation of RP-HPLC Method for the Estimation of Lansoprazole in Tablet Dosage Form. Journal of Chemical and Pharmaceutical Research, 2, 291-295.
[16] Luo, Y.F., Xu, L.S., Xu, M., Feng, J. and Tang, X. (2012) A Validated Specific, Stability Indicating HPLC Method for Determination of Lansoprazole Enteric Coated Capsules and Related Impurities. Asian Journal of Pharmaceutical Sci- ences, 7, 149-154.
[17] Patel, B., Dedani, Z., Dedani, R., Ramolia, C., Sagar, V. and Mehta, R.S. (2009) Simultaneous Estimation of Lansopra- zole and Domperidone in Combined Dosage Form by RP-HPLC. Asian Journal of Research in Chemistry, 2, 210-212.
[18] Brown, S.D., Connor, J.D., Smallwood, N.C. and Lugo, R.A. (2011) Quantification of Lansoprazole in Oral Suspen-sion by Ultra-High-Performance Liquid Chromatography Hybrid Ion-Trap Time-of-Flight Mass Spectrometry. Inter-national Journal of Analytical Chemistry, 2011, Article ID: 832414. http://dx.doi.org/10.1155/2011/832414
[19] Katsuki, H., Hamada, A., Nakamura, C., Arimori, K. and Nakano, M. (2011) High-Performance Liquid Chromato- graphic Assay for the Simultaneous Determination of Lansoprazole Enantiomers and Metabolites in Human Liver Mi-crosomes. Journal of Chromatography B, 757, 127-133. http://dx.doi.org/10.1016/S0378-4347(01)00135-9
[20] Cirilli, R., Ferretti, R., Gallinella, B., Turchetto, L., Zanitti, L. and La Torre, F. (2009) Development and Validation of an Enantioselective and Chemoselective HPLC Method Using a Chiralpak IA Column to Simultaneously Quantify(R)- (+)- and (S)-(−)-Lansoprazole Enantiomers and Related Impurities. Journal of Pharmaceutical and Biomedical Analy-sis, 50, 9-14. http://dx.doi.org/10.1016/j.jpba.2009.03.021
[21] Petkovska, R., Cornett, C. and Dimitrovska, A. (2008) Chemometrical Approach in Lansoprazole and Its Related Com- pounds Analysis by Rapid Resolution RP-HPLC Method. Journal of Liquid Chromatography & Related Technologies, 31, 2159-2173. http://dx.doi.org/10.1080/10826070802225478
[22] Srinivas, K.S.V., Mukkanti, K., Buchireddy, R. and Srinivasulu, P. (2010) Detection, Isolation and Characterisation of Principal Synthetic Route Indicative Impurity in Lansoprazole. E-Journal of Chemistry, 7, 844-848.
[23] Reddy, G.M., Mukkanti, K., Laxmi Kumar, T., Moses Babu, J. and Reddy, P.P. (2008) Synthesis and Characterization of Metabolites and Potential Impurities of Lansoprazole, an Antiulcerative Drug. Synthetic Communications, 38, 3477- 3489. http://dx.doi.org/10.1080/00397910802162934
[24] Ramulu, K., Rao, B.M. and Someswara Rao, N. (2013) Identification, Isolation and Characterization of Potential Deg-radation Product in Lansoprazole Drug Substance. Rasayan Journal of Chemistry, 6, 274-283.