Embed Size (px)
Citation preview

7/23/2019 Hydrostratigraphic Analysis of the Northern Salinas Valley 2004
http://slidepdf.com/reader/full/hydrostratigraphic-analysis-of-the-northern-salinas-valley-2004 1/112
Kennedy/Jenks Consultants
622 Folsom StreetSan Francisco, California 94107
415-243-2150415-896-0999 (Fax)
www.KennedyJenks.com
FINAL REPORT
Hydrostratigraphic Analysis
of the
Northern Salinas Valley
14 May 2004
Prepared for
Monterey County
Water Resources Agency 893 Blanco Circle
Salinas, California 93901
K/J Project No. 035901.00

7/23/2019 Hydrostratigraphic Analysis of the Northern Salinas Valley 2004
http://slidepdf.com/reader/full/hydrostratigraphic-analysis-of-the-northern-salinas-valley-2004 2/112
Kennedy Jenks onsultants
FINAL REPORT
HYDROSTRATIGRAPHIC ANALYSIS
OF THE NORTHERN SALINAS
VALLEY
14 May 2004
Project No. 035901.00
This report was prepared by Kennedy/Jenks Consultants,
Inc
.
under the direction of the Monterey County Water
Resources Agency (Agency) , the only intended beneficiary
of
this work. No other party should rely on the information
presented herein without the consent
of
the Agency.
The findings, recommendations, specification, or
professional opinions are presented within the limits
described by the client, in accordance with generally
accepted professional engineering and geologic practice.
No warranty is expressed or
implied.
Leslie L Chau
Principal Hydrogeologist, Project Manager
Geologist
Michael L cleod , R.G. (CA 5977)
Geologist

7/23/2019 Hydrostratigraphic Analysis of the Northern Salinas Valley 2004
http://slidepdf.com/reader/full/hydrostratigraphic-analysis-of-the-northern-salinas-valley-2004 3/112
Kennedy/Jenks Consultants
Final Report – Hydrostratigraphic Analysis of the Northern Salinas Valley ip:\isg-proj\mcwra final rpt\mcwra_final_14may2004.doc
Table of Contents
List of Tables................................................................................................................................ iv
List of Figures............................................................................................................................... iv
List of Appendices........................................................................................................................ iv
Executive Summary ................................................................................................................ES-1
Section 1: Introduction ..................................................................................1
1.1 Project Background and Study Goals ....................................................1
1.2 Scope of Work........................................................................................2
1.3
Approach ................................................................................................ 2
1.4
Hydrostratigraphic Cross-Sections.........................................................3
1.5
Previous Studies ....................................................................................3
Section 2: Background Hydrogeology ...........................................................5
2.1 Geographic and Hydrologic Settings......................................................5
2.2 Pressure and East Side Subareas .........................................................5
2.3 Stratigraphy of the Northern Salinas Valley ...........................................6
2.3.1
Recent Alluvium..........................................................................6
2.3.2
Valley Fill ....................................................................................6
2.3.3 Aromas Sand..............................................................................6
2.3.4
Paso Robles Formation..............................................................6 2.3.5 Older and Deeper Geologic Formations that Underlie the
Pressure 400-Foot Aquifer .........................................................7
2.3.5.1 Purisima Formation...................................................7
2.3.5.2 Santa Margarita Formation .......................................7
2.3.5.3 Monterey Formation..................................................7
2.4 Hydrostratigraphic Units.........................................................................7
2.4.1
Shallow Aquifer...........................................................................7
2.4.2 Salinas Valley Aquitard...............................................................7
2.4.3 Pressure 180-Foot Aquifer .........................................................8
2.4.4
Pressure 180/400-Foot Aquitard ................................................8
2.4.5
Pressure 400-Foot Aquifer .........................................................8
2.4.6
Pressure 400-Foot/Pressure Deep Aquitard ..............................9 2.5 Depositional Environments of the Pressure and East Side
Subareas................................................................................................9
Section 3:
Discussion - Pressure Subarea Hydrogeology...........................11
3.1 Pressure Subarea Hydrostratigraphy...................................................11
3.1.1
Shallow Ground Water Aquifer.................................................11
3.1.2
Salinas Valley Aquitard.............................................................11

7/23/2019 Hydrostratigraphic Analysis of the Northern Salinas Valley 2004
http://slidepdf.com/reader/full/hydrostratigraphic-analysis-of-the-northern-salinas-valley-2004 4/112
Kennedy/Jenks Consultants
Table of Contents Cont'd
Final Report – Hydrostratigraphic Analysis of the Northern Salinas Valley iip:\isg-proj\mcwra final rpt\mcwra_final_14may2004.doc
3.1.3
Pressure 180-Foot Aquifer .......................................................12
3.1.4 Pressure 180/400-Foot Aquitard ..............................................12
3.1.4.1 Absence of Confining Clay Unit .............................. 12
3.1.5
Pressure 400-Foot Aquifer .......................................................14
3.1.5.1 Locations of the Thickest Sand Zones....................14
3.1.6
Pressure 400-Foot/Pressure Deep Aquitard ............................15
3.2 Ground Water Elevations .....................................................................15
Section 4:
Discussion - East Side Subarea Hydrogeology..........................17
4.1
East Side Subarea Geologic Setting....................................................17
4.2
East Side Subarea Hydrostratigraphy..................................................17
4.3
Depositional Facies in the Pressure/East Side Transition Zone ..........18 4.3.1 Alluvial Fan Facies ................................................................... 18
4.3.1.1 Proximal Alluvial Fan Facies...................................19
4.3.1.2
Alluvial Plain Facies ................................................ 19
4.3.2
Fluvial Facies............................................................................19
4.3.2.1
Fluvial Channel Facies ...........................................19
4.3.2.2 Fluvial Overbank Facies .........................................20
4.4 East Side Subarea Ground Water........................................................20
4.4.1
Aquifer Zones ...........................................................................20
4.4.2
Ground Water Recharge ..........................................................20
4.4.3
Well Yields................................................................................20
4.4.4 Water Quality............................................................................21
Section 5:
Transition Between Pressure and East Side Subareas.............22
5.1 Boundary Between the Pressure and East Side Subareas..................22
5.1.1
Boundary as Defined by Earlier Studies...................................22
5.1.2
Boundary as Defined in the Study............................................22
5.2 Transition Zone Between Pressure and East Side Subareas –Stratigraphic Characteristics ................................................................23
5.2.1
Stratigraphic Facies Scenarios.................................................23
5.2.2
Characteristics of the Pressure 180-Foot and Pressure400-Foot Aquifers Near the Transition Zone ............................24
5.3 Depositional Model...............................................................................25
5.3.1 Sediment Sources in the Northern Salinas Valley....................25
5.3.2
Glacio-Eustatic Control of Depositional Facies ........................25
5.3.3
Interaction Between Fluvial and Alluvial Fan DepositionalSystems....................................................................................26
5.3.4 Sediment Provenance and the Southward Progressionof Alluvial Fans .........................................................................26
5.3.5
Distribution of Depositional Facies ...........................................27
5.4 Hydraulic Connectivity of East Side Subarea and TransitionZone .....................................................................................................28

7/23/2019 Hydrostratigraphic Analysis of the Northern Salinas Valley 2004
http://slidepdf.com/reader/full/hydrostratigraphic-analysis-of-the-northern-salinas-valley-2004 5/112
Kennedy/Jenks Consultants
Table of Contents Cont'd
Final Report – Hydrostratigraphic Analysis of the Northern Salinas Valley iiip:\isg-proj\mcwra final rpt\mcwra_final_14may2004.doc
5.4.1
Depositional Facies Control of Hydraulic Connectivity.............28
5.4.2 Hydraulic Properties of Transition Zone ...................................29
5.4.3 Possible Areas of Horizontal and Vertical HydraulicConnectivity..............................................................................29
5.4.3.1 Horizontal Flow Across Pressure/East SideBoundary ................................................................29
5.4.3.2 Vertical Flow within the East Side Subarea ............30
5.4.3.3
Horizontal Flow within the Pressure Subarea.........30
Section 6:
Seawater Intrusion .....................................................................31
6.1
Mechanisms of Seawater Intrusion ......................................................31
6.1.1
Three Seawater Intrusion Mechanisms in the NorthernSalinas Valley...........................................................................31
6.2 Methods of Assessing the Rate of Seawater Intrusion.........................32
6.2.1
The Ghyben-Herzberg Principle...............................................33
6.2.2
Mapping of Chloride Front........................................................33
6.3
Regional Seawater Intrusion ................................................................34
6.4 Regional Seawater Intrusion in the Pressure 180-Foot Aquifer ...........34
6.5 Regional Seawater Intrusion in the Pressure 400-Foot Aquifer ...........36
6.6
Seawater Intrusion through Natural Aquitard Leakage ........................37
6.7
Hydraulic Communication between the Pressure and EastSubareas..............................................................................................38
6.8 Estimated Rates of Seawater Intrusion and Impacts to Water
Supply Wells ........................................................................................39
Section 7:
Conclusions ................................................................................41
7.1
Pressure Subarea Hydrostratigraphy...................................................41
7.2
East Side Subarea and Transition Zone Hydrostratigraphy.................42
7.3 Regional Seawater Intrusion ................................................................42
Section 8:
Recommendations......................................................................44
Section 9: Limitations..................................................................................46
Section 10: References.................................................................................. 47

7/23/2019 Hydrostratigraphic Analysis of the Northern Salinas Valley 2004
http://slidepdf.com/reader/full/hydrostratigraphic-analysis-of-the-northern-salinas-valley-2004 6/112
Kennedy/Jenks Consultants
Table of Contents Cont'd
Final Report – Hydrostratigraphic Analysis of the Northern Salinas Valley ivp:\isg-proj\mcwra final rpt\mcwra_final_14may2004.doc
List of Tables
1 List of Well Logs Used in Cross-Sections
2 Sedimentary and Hydraulic Characteristics of the Pressure and East Side Subareas
3 Pressure Subarea Estimated Seawater Intrusion Rates
List of Figures
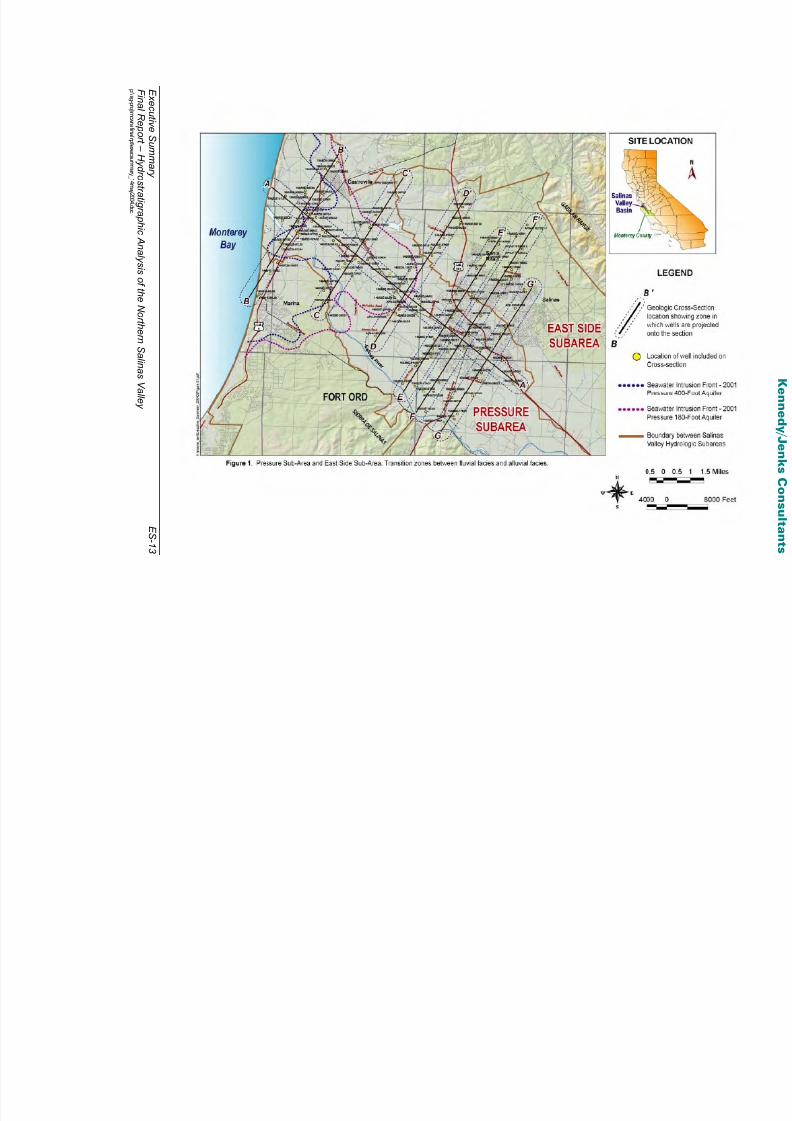
1 Study Area – Pressure and East Side Sub Areas
2 Cross-Section Location Map
3 Cross-Section A-A’
4 Cross-Section B-B’
5 Cross-Section C-C’
6 Cross-Section D-D’
7 Cross-Section E-E’
8 Cross-Section F-F’
9 Cross-Section G-G’
10 Possible Discontinuities in the Pressure 180/400-Foot Aquitard11 Generalized Fluvial and Alluvial Fan Facies of Northern Salinas Valley
12 Transition Zones Between Fluvial Facies and Alluvial Facies
13 Facies Scenario 1
14 Facies Scenario 2
15 Facies Scenario 3
16 Extent of Blue Clay (Salinas Aquitard) Facies and Alluvial Fan Facies
17 Distribution of Depositional Facies during Pressure 180-Foot Aquifer “Time”
18 Distribution of Depositional Facies during Pressure 400-Foot Aquifer “Time”
19 Historic Seawater Intrusion Map and Inferred Travel Paths, Pressure 180-Foot Aquifer
20 Historic Seawater Intrusion Map and Inferred Travel Paths, Pressure 400-Foot Aquifer
List of Appendices
A Report Glossary
B List of References Reviewed

7/23/2019 Hydrostratigraphic Analysis of the Northern Salinas Valley 2004
http://slidepdf.com/reader/full/hydrostratigraphic-analysis-of-the-northern-salinas-valley-2004 7/112
Kennedy/Jenks Consultants
Executive Summary ES-1Final Report – Hydrostratigraphic Analysis of the Northern Salinas Valleyp:\isg-proj\mcwra final rpt\execsummary_14may2004.doc
Executive Summary
Hydrostratigraphic Analysis of the Northern Salinas Valley
Introduction
The Monterey County Water Resources Agency (Agency), responsible for the management andplanning of water resources within Monterey County, uses a network of wells to monitor groundwater conditions in the Salinas Valley ground water basin (Figure 1). The progressiveadvancement of the seawater intrusion front into ground water zones and the understanding ofthe northern Salinas ground water basin hydrogeology have been documented by the Agencysince the 1950s. Only in the later 1990s and recently have there been sufficient well logs,
geophysical, and lithological data to support a three-dimensional (3-D) study of the inter-relatedancestral fluvial and alluvial-fan depositional environments that make up the present day groundwater bearing zones known as the Pressure 180-Foot and Pressure 400-Foot aquifers and theirimplications on seawater intrusion pathways.
Findings in this hydrostratigraphic study confirm that the main ground water bearing zones arelikely of fluvial origin which has a classic sequence of thick, well-defined beds of sand andgravel separated by blue clays. This sequence was formed by repeated glacio-eustatic sea levelfluctuations, which resulted in cycles of marine transgressions and valley fill incisions andsubsequent alluviation. Sequences of coarser sediments separated by brown clays of alluvialfan origin are observed along the northeastern edge of the elongate northern pressure zone.
These depositional environments were evaluated with the stratigraphic correlation of a series ofnortheast to southwest cross-sections sequentially located from the City of Salinas to the coastand then connected by a northwest-southeast profile. This study included a 3-D conceptualmodel of the lithostratigraphic makeup of the paleo-depositional environment (Figure 2). Theability to examine 3-D distributions of interbedded clays and coarse-grained sediments,particularly in a transition zone (Figure 2) from estuarine to alluvial fans, suggests lowerpermeability and slower ground water movements flows in the East Side Subarea whichconsists of interfinger fluvial overbanks, alluvial plain, and coarser alluvial sediments. Asimportantly, this analysis confirms areas of absence and thinning of aquitard materials thatseparate the Pressure 180- and Pressure 400-Foot aquifers in the Pressure Subarea.
The economic importance of a detailed rendition of hydrostratigraphic characteristics is to assistin the construction and placement of future water supply and monitoring wells within the studyarea. This is the primary area of interaction between intruding seawater and ground water of thePressure 180-Foot and the Pressure 400-Foot ground water aquifers. Seawater is intruding intothe ground water zones from the submarine outcrops of and directly into the Pressure 180- andPressure 400-Foot aquifers. Moreover, our stratigraphic analysis demonstrates with notablymore detailed lithologic data that mixing and vertical migration of seawater are highly possible inseveral localized areas between the coast and the City of Salinas. Vertical movement ofseawater/ground water is likely across leaky aquitard and areas of the absence of confining clay

7/23/2019 Hydrostratigraphic Analysis of the Northern Salinas Valley 2004
http://slidepdf.com/reader/full/hydrostratigraphic-analysis-of-the-northern-salinas-valley-2004 8/112
Kennedy/Jenks Consultants
Executive Summary ES-2Final Report – Hydrostratigraphic Analysis of the Northern Salinas Valleyp:\isg-proj\mcwra final rpt\execsummary_14may2004.doc
unit between the Pressure 180-Foot and Pressure 400-Foot Aquifers. It is therefore of
importance to the public water supply of the northern Salinas Valley that the 3-D permeabilitydistribution of the lithology be mapped with enough detail to assist in the design of futureengineering measures to mitigate the seawater intrusion problem.
Project Background and Study Goals
This study as intended by the Agency is the work of a focused analysis and update of thehydrogeologic interpretations to augment the ongoing assessment of rates of seawater intrusioninto the Pressure 180-Foot Aquifer and the Pressure 400-Foot Aquifers. The occurrence ofseawater intrusion into the Pressure 180-Foot Aquifer in the areas between the City of Salinasand the coast was first documented in 1933 by the State of California. Continued seawaterintrusion to present day is largely attributed to overdraft of ground water from the Pressure
180-Foot Aquifer. Withdrawals from both the Pressure 180-Foot Aquifer and the Pressure400-Foot Aquifer have lowered water levels below sea level. Seawater intrusion into thePressure 400-Foot Aquifer has been slower and less extensive than in the overlying Pressure180-Foot Aquifer because the Pressure 400-Foot Aquifer was not drawn upon until water qualityin the Pressure 180-Foot Aquifer had been significantly degraded. However, in recent studies,the integrity of the aquitard that separates the Pressure 180-Foot Aquifer and the Pressure400-Foot Aquifer has been the subject of detailed hydrogeologic interpretations using new dataand reinterpretations of previous results. This study examines evidence of localized thinning andabsence of the clay layer that likely results in interaquifer migration or downward gradient flow ofground water and seawater from the Pressure 180-Foot Aquifer to the Pressure 400-Foot Aquifer. Interaquifer contamination is considered as a significant seawater encroachment threatto the current water quality in and supply from primarily the Pressure 400-Foot Aquifer for this
area.
Approach
Our approach in this study was to construct a 3-D hydrogeologic conceptual model of thenorthern Salinas Valley. With the use of a 3-D geographic information system and a database ofover 700 wells, we present a comprehensive update of previous findings based on newlithologic data and introduce three possible scenarios of the ancestral deposition processes thatmake up the present day hydrogeologic structure. The objective is a focused assessment ofadjacent Pressure 180-Foot Aquifer and Pressure 400-Foot Aquifer that span the uppermost600 feet of sedimentary sequences and are part of the Valley Fill Deposits (Qvf) and theunderlying Aromas/Paso Robles Formation (Qar).
We focused our efforts in methodically depicting the hydrostratigraphic characteristics of thePressure 180-Foot Aquifer and Pressure 400-Foot Aquifer. Our goal in constructinghydrogeologic cross-sections is to identify areas of localized thinning and absence of confininglayers, such as the blue clay sequences between the Pressure 180- and Pressure 400-Foot Aquifers. Such details are of particular interest in assessing localized downward flow of groundwater.

7/23/2019 Hydrostratigraphic Analysis of the Northern Salinas Valley 2004
http://slidepdf.com/reader/full/hydrostratigraphic-analysis-of-the-northern-salinas-valley-2004 9/112
Kennedy/Jenks Consultants
Executive Summary ES-3Final Report – Hydrostratigraphic Analysis of the Northern Salinas Valleyp:\isg-proj\mcwra final rpt\execsummary_14may2004.doc
As importantly, historical differences in water levels between the Pressure Subarea and the
East Side hydrogeological “Subareas” suggest distinctions in stratigraphy and permeabilitybetween the two hydrogeologic regimes. Moreover, the hydrogeologic relationships in thetransition zone between these two subareas are assessed and depicted on cross-sections andon hydrogeologic maps.
Note: For brevity, cross-section AA’ through GG” panels prepared in this study areexcluded in this summary. They are presented in the Final Report and it is available tothe public upon request at the Agency. We have depicted our cross-sectionalinterpretations of the hydrogeologic features on maps and are presented herein asfigures.
Hydrogeology
The Salinas Valley Ground Water Basin is situated entirely within Monterey County, locatedalong the central California coast approximately 100 miles south of San Francisco (Figure 1). The northern Salinas Valley is divided into two subareas, the Pressure Subarea to the west andthe East Side Subarea to the east (Figure 1). The hydrogeology and ground water behavior ineach subarea is markedly different due to different depositional environments and geology.
Ground Water Elevations
Ground water elevations are monitored regularly by the Agency in the Salinas Valley inmonitoring wells and agricultural production wells. Historical ground water elevations reflectdrawdown and depressed ground water elevations during the summer irrigation season and
recovery of ground water elevations during the winter.
Data collected in 1999 from the Fort Ord area and the western Salinas Valley indicate thatground water elevations in the Pressure 180-Foot Aquifer and Pressure 400-Foot Aquifer werebelow sea level, with elevations in the Pressure 180-Foot Aquifer as low as –20.7 feet MSL nearthe Salinas River and elevations in the Pressure 400-Foot Aquifer as low as –51.4 feet MSLeast of the Salinas River. The lower ground water elevations in the Pressure 400-Foot Aquiferindicate that a vertical hydraulic gradient downward from the Pressure 180-Foot Aquifer to thePressure 400-Foot Aquifer exists.
The ground water elevations are below mean sea level in both the Pressure 180-Foot Aquiferand Pressure 400-Foot Aquifer have been consistent for many years, as has been the
difference in elevations between the two aquifers (Todd, 1989 and Harding ESE, 2001). Todd(1989) and Harding ESE (2001) suggest that this trend indicates that although the aquitardbetween the two aquifers may be discontinuous in places, the aquitard is sufficient toconsistently support a vertical head difference. The consistent below mean sea level groundwater elevations in both aquifers create a situation that promotes continued seawater intrusion.

7/23/2019 Hydrostratigraphic Analysis of the Northern Salinas Valley 2004
http://slidepdf.com/reader/full/hydrostratigraphic-analysis-of-the-northern-salinas-valley-2004 10/112
Kennedy/Jenks Consultants
Executive Summary ES-4Final Report – Hydrostratigraphic Analysis of the Northern Salinas Valleyp:\isg-proj\mcwra final rpt\execsummary_14may2004.doc
Pressure Subarea 180/400-Foot Aquitard
The Pressure 180-Foot Aquifer and Pressure 400-Foot Aquifer are separated by a zone of clay,or clay and sand layers (Monterey County Flood Control & Water Conservation District,MCFCWCD, 1960) referred to as the Pressure 180/400-Foot Aquitard. This barrier iswidespread in the Salinas Valley basin and varies in thickness and quality from thick layers ofblue clay to thin layers of brown clay (MCFCWCD, 1960).
Variability in thickness and quality of the Pressure 180/400-Foot Aquitard and the existence ofpossible gaps in the aquitard is well known and is the primary subject of this study. MCFCWCD(1960) describes two small “holes” in the aquitard, one under the Salinas River near Blanco andanother under the old Salinas River bed near the coast. The Pressure 180-Foot Aquifer and thePressure 400-Foot Aquifer also appear to be interconnected in places between Salinas andChualar (approximately 10 miles south of Salinas) and south of Chualar (MCFCWCD, 1960).
Brown (1986) describes the aquitard as generally lenticular in shape and discontinuous inplaces, notably near the mouth of the Salinas River and near Fort Ord (MCFCWCD, 1960).Todd (1989) indicates several areas between Castroville and the coast where the aquitard isthin or absent.
Seawater Intrusion
This study assesses the conditions of seawater intrusion by developing a time line of thelandward advancement of the seawater intrusion front relative to identified benchmarks such asthe City of Salinas and the East Side pumping wells. The 500 milligrams per liter (mg/L) chloridelevel has been used by the Agency to demarcate the landward edge of the seawater intrusionfront where the denser seawater body has intruded into ground water. This chloride ionconcentration is used as an indicator of impact to ground water and it is promulgated as aSecondary Drinking Water Standard upper limit for chloride.
The primary cause for seawater intrusion in this area is that the aquifers are in direct hydrauliccontact with the sea. The secondary cause for seawater mixing in the Pressure 180-Foot andPressure 400-Foot fresh water aquifers is that ground water levels in both aquifers are belowsea level and the normal seaward gradient had been reversed in the Pressure 180-Foot Aquiferzone since as the 1930s.
The pattern of encroaching seawater in ground water zones in the northern Salinas Valley - asrepresented by 500 mg/L chloride contours - is the result of three primary seawater intrusionmechanisms that have been studied by numerous investigators in this area: 1) seawaterinfiltrates the Pressure 180-Foot and Pressure 400-Foot Aquifers through the submarineoutcrops of aquifers offshore of Monterey Bay by way of a landward hydraulic gradient - regionalseawater intrusion; 2) seawater-blended ground water in the Pressure 180-Aquifer migratesdownward into the Pressure 400-Foot Aquifer - interaquifer seawater intrusion, and 3) seawatermovement between aquifers due to poor well constructions.

7/23/2019 Hydrostratigraphic Analysis of the Northern Salinas Valley 2004
http://slidepdf.com/reader/full/hydrostratigraphic-analysis-of-the-northern-salinas-valley-2004 11/112
Kennedy/Jenks Consultants
Executive Summary ES-5Final Report – Hydrostratigraphic Analysis of the Northern Salinas Valleyp:\isg-proj\mcwra final rpt\execsummary_14may2004.doc
Methods of Assessing the Rate of Seawater Intrusion
In this study we assess the expansion of intruded areas based on documented delineations ofthe chloride levels through time as contours of the front have been published by the MontereyCounty Flood Control District and now by the Agency since 1944. We place emphasis on thecumulative rates of seawater intrusion as estimated in this study (Todd 1989 and others) for thePressure 180-Foot and Pressure 400-Foot Aquifers. The rationale behind the use of cumulativerates is that the mapped front can occasionally jump ahead in a particular direction - asdiscussed in the Staal Gardner & Dunne Inc. 1993 study. Such occasional changes in intrudedareas are as likely due to addition of monitoring wells or data points landward of the intrusionfront as augmented pumping of ground water in certain locations and thereby lowering the waterlevels. Although the expansion of intrusion area(s) of seawater is based on data, acceleratedrates of encroachment may not be representative of the long term characteristics of seawateraffected ground water. There is no conclusive data in support of the use of “periodically higher”
seawater intrusion rates to estimate long-term movements of seawater in the Pressure areaaquifers – hence this study stresses cumulative rates of seawater intrusion.
We believe that the rate of expansion of intruded seawater can accelerate in a certain directiondue to increased pumping or short-term drops in ground water levels landward of the frontduring prolonged droughts. Likewise, a short-term reduction of intruding seawater can occur inwet years as ground water levels are correspondingly higher like in 1995 (Agency, 1997). Thereis however no information historically that suggests the overall expansion of intruded areasnorthward and southeastward have progressively increased. In fact, the aggregate rate ofseawater intrusion has been at around 500 feet per year for the Pressure 180-Foot Aquifer andabout 450 foot per year for the Pressure 400-Foot Aquifer.
According to the Ghyben-Herzberg principle, coastal aquifers with ground water levels belowsea level will be intruded by denser seawater. This means that ground water in most of the EastSide and Pressure Subareas west of the City of Salinas could have elevated levels of chlorideexceeding 500 mg/L – as a result of seawater blending with fresh water. However, this is clearlynot apparent as mapped intrusion fronts for both aquifers are located seaward of the City ofSalinas (Figures 3 and 4). The reason for this is because of the condition that ground water isflowing towards the coast and therefore maintaining a regional seaward gradient particularly inground water upstream or east of the City of Salinas.
A more representative characterization of seawater intrusion is the use of empirical rateestimations which would be to evaluate landward increases in chloride levels with time.Specifically, we calculate rates of advances of the 500 mg/L chloride contours by dividing the
maximum linear distance (feet) that the 500 mg/L chloride front has moved by thecorresponding time period of advancement (years).
7/23/2019 Hydrostratigraphic Analysis of the Northern Salinas Valley 2004
http://slidepdf.com/reader/full/hydrostratigraphic-analysis-of-the-northern-salinas-valley-2004 12/112
Kennedy/Jenks Consultants
Executive Summary ES-6Final Report – Hydrostratigraphic Analysis of the Northern Salinas Valleyp:\isg-proj\mcwra final rpt\execsummary_14may2004.doc
Discussion
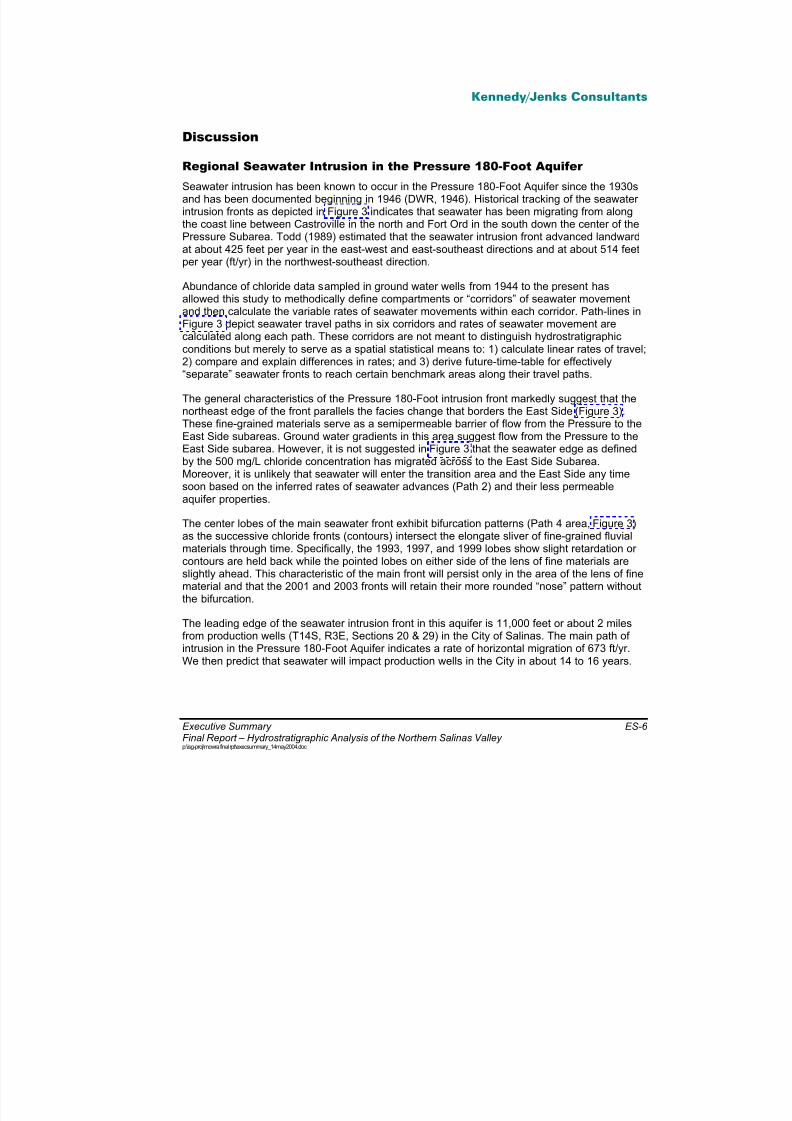
Regional Seawater Intrusion in the Pressure 180-Foot Aquifer
Seawater intrusion has been known to occur in the Pressure 180-Foot Aquifer since the 1930sand has been documented beginning in 1946 (DWR, 1946). Historical tracking of the seawaterintrusion fronts as depicted in Figure 3 indicates that seawater has been migrating from alongthe coast line between Castroville in the north and Fort Ord in the south down the center of thePressure Subarea. Todd (1989) estimated that the seawater intrusion front advanced landwardat about 425 feet per year in the east-west and east-southeast directions and at about 514 feetper year (ft/yr) in the northwest-southeast direction.
Abundance of chloride data sampled in ground water wells from 1944 to the present has
allowed this study to methodically define compartments or “corridors” of seawater movementand then calculate the variable rates of seawater movements within each corridor. Path-lines inFigure 3 depict seawater travel paths in six corridors and rates of seawater movement arecalculated along each path. These corridors are not meant to distinguish hydrostratigraphicconditions but merely to serve as a spatial statistical means to: 1) calculate linear rates of travel;2) compare and explain differences in rates; and 3) derive future-time-table for effectively“separate” seawater fronts to reach certain benchmark areas along their travel paths.
The general characteristics of the Pressure 180-Foot intrusion front markedly suggest that thenortheast edge of the front parallels the facies change that borders the East Side (Figure 3).These fine-grained materials serve as a semipermeable barrier of flow from the Pressure to theEast Side subareas. Ground water gradients in this area suggest flow from the Pressure to theEast Side subarea. However, it is not suggested in Figure 3 that the seawater edge as definedby the 500 mg/L chloride concentration has migrated across to the East Side Subarea.Moreover, it is unlikely that seawater will enter the transition area and the East Side any timesoon based on the inferred rates of seawater advances (Path 2) and their less permeableaquifer properties.
The center lobes of the main seawater front exhibit bifurcation patterns (Path 4 area, Figure 3)as the successive chloride fronts (contours) intersect the elongate sliver of fine-grained fluvialmaterials through time. Specifically, the 1993, 1997, and 1999 lobes show slight retardation orcontours are held back while the pointed lobes on either side of the lens of fine materials areslightly ahead. This characteristic of the main front will persist only in the area of the lens of finematerial and that the 2001 and 2003 fronts will retain their more rounded “nose” pattern withoutthe bifurcation.
The leading edge of the seawater intrusion front in this aquifer is 11,000 feet or about 2 milesfrom production wells (T14S, R3E, Sections 20 & 29) in the City of Salinas. The main path ofintrusion in the Pressure 180-Foot Aquifer indicates a rate of horizontal migration of 673 ft/yr.We then predict that seawater will impact production wells in the City in about 14 to 16 years.

7/23/2019 Hydrostratigraphic Analysis of the Northern Salinas Valley 2004
http://slidepdf.com/reader/full/hydrostratigraphic-analysis-of-the-northern-salinas-valley-2004 13/112
Kennedy/Jenks Consultants
Executive Summary ES-7Final Report – Hydrostratigraphic Analysis of the Northern Salinas Valleyp:\isg-proj\mcwra final rpt\execsummary_14may2004.doc
Seawater Intrusion Through Natural Aquitard Leakage
Historically, ground water elevations in the Pressure 180-Foot Aquifer have been higher (up to40 plus feet higher) than the piezometric surface of the Pressure 400-Foot Aquifer (Todd, 1989;Harding ESE, 2001). Such a downward hydraulic gradient would bring about ground watermovement from the Pressure 180-Foot Aquifer to the Pressure 400-Foot Aquifer. Interaquifer orcross-aquifer contamination is considered to a significant seawater encroachment threat to thecurrent water quality of the Pressure 400-Foot Aquifer for this area. Thin to absent confiningclay is observed in six of the seven cross-sections (all but G-G’, Figure 1).
Based on lithology depicted in the cross-sections and stratigraphic facies, we conclude thatthere are localized areas of aquitard thinning and absence. Data do not support theresemblance of spatially persistent paleo-channels that can be postulated as the genesis ofscour marks and resulting in thin to absent clay layers. The most notable thinning of the
Pressure 180/400-Foot Aquitard can be observed in the subsurface areas of the locations ofintersections between cross-sections A-A’ with E-E’, F-F’ and G-G’ (see red dotted wells inFigure 3 and 4). This particular area of aquitard thinning cannot be traced beyond well14S/03E-33Q01 on the northwest side of Cross-section G-G’.
Two probable scenarios of interaquifer flow is observed in this study; 1) spilling of degradedPressure 180-Foot Aquifer ground water into the Pressure 400-Foot Aquifer ; and 2) slowdownward movement of Pressure 180-Foot Aquifer ground water through sufficiently thin claylayers of the aquitard into the deeper Pressure 400-Foot Aquifer . Rates for either scenario areestimated to be from 0.1 to 0.25 foot per day dependent of the percentage of fine-grainedmaterials within the interaquifer zones where the aquitard is either discontinuous or very thin.Hence we estimate that seawater reaching the Pressure 180-Foot Aquifer can impact the
Pressure 400-Foot Aquifer ground water in one to four years over an interaquifer distance of100 to 500 vertical feet.
Regional Seawater Intrusion in the Pressure 400-Foot Aquifer
The advancement of the seawater intrusion front in the Pressure 400-Foot Aquifer through 2001is shown in Figure 4. These delineations of intruded areas are also presented in Todd 1989 andin the Fort Ord and western Salinas Valley area in Harding ESE (2001). The area of theseawater intrusion and the shape of the front are more irregular than the Pressure 180-Foot Aquifer (Figure 3), although the migration rate of the Pressure 400-Foot Aquifer is slower butcomparable (See Table below and in Todd, 1989).
A distinct lobe of the seawater intrusion front in the Pressure 400-Foot Aquifer extends fromMarina to wells 14S/2E-21N01, 14S/2E-21E01, and 14S/2E-21F02 (Path 4, Figure 4). According to Harding ESE (2001), that lobe advanced nearly one mile between 1997 and 1999,which was surprisingly rapid (Path 4 – 1997 to 1999).
The seawater intrusion front in the Pressure 180-Foot Aquifer reached this same area around1997. The wells 14S/2E-21N01 and 14S/2E-21E01 were constructed in the mid 1990s, and are

7/23/2019 Hydrostratigraphic Analysis of the Northern Salinas Valley 2004
http://slidepdf.com/reader/full/hydrostratigraphic-analysis-of-the-northern-salinas-valley-2004 14/112
Kennedy/Jenks Consultants
Executive Summary ES-8Final Report – Hydrostratigraphic Analysis of the Northern Salinas Valleyp:\isg-proj\mcwra final rpt\execsummary_14may2004.doc
constructed in the Pressure 400-Foot Aquifer and sealed through the Pressure 180-Foot Aquifer
and higher zones, so Harding ESE (2001) does not consider that improper well construction ledto cross-contamination of seawater from the Pressure 180-Foot Aquifer to the Pressure400-Foot Aquifer.
These wells are located at the southwest end of Cross-Section C-C’ (Figure 1), where apossible stratigraphic connection between the Pressure 180-Foot Aquifer and Pressure400-Foot Aquifer was observed (Figure 4, red dotted wells). Interaquifer communication mayhave been a factor in the rapid advance - one to four years.
The seawater intrusion rate as mapped by the chloride front for this same area in 2001 suggeststhat the advancement has slowed or halted (Figure 4); such that, no advancing distance wasinferred for the years 2000 and 2001. The resultant aggregate seawater intrusion rate is about578 ft/yr. This rate is the highest inferred from the five seawater travel paths in this aquifer. It isslower than the maximum rate in the Pressure 180-Foot zone but comparable.
The seawater intrusion rate appears to “accelerate” along Path 3 in years 2000 and 2001 inFigure 4 as chloride data are contoured for Well 14S/02E-16G01. It is uncertain at the time ofthis study whether this is an artifact of an additional data point during the recent two years oractual accelerated movement of seawater in the northeast direction.
The leading edge of the seawater intrusion front in this aquifer is 28,000 feet or about 5 milesfrom production wells (T14S, R3E, Sections 20 & 29) in the City of Salinas. It is unlikely thatdirectly intruded seawater in the Pressure 400-Foot aquifer from its submarine outcrops willreach the City of Salinas any time soon – estimated 49 years travel time.
Hydraulic Communication Between the Pressure and East Subareas
The stratigraphic analysis in this study supports previous findings that the aquifer materialmakeup of the East Side Subarea – although heterogeneous and much less correlatable thanthe Pressure Subarea - are spatially consistent along the direction of the Pressure / East Sideboundary. The consistency of stratigraphic facies are apparent in cross-sections C-C’, D-D’,E-E’, F-F’ and G-G’ starting from and northeast of wells 14S/02E-02C03, 14S/03E-07A01,-09P03, -22D01, and well APN-003851028, respectively. These wells and transition zonesnortheast of them are again presented within the transition zone hatches for both aquifers inFigure 1. The hydraulic conductivities corresponding to these materials in our opinion are atleast an order of magnitude lower than those of the aquifers in the Pressure Subarea.
We note that ground water flow direction is from the Pressure Subarea to the East SideSubarea east of the City of Salinas and along the transition zone (Agency 1997). The waterlevels in the Pressure 180-Foot Aquifer and the Shallow East Side Aquifer range from -20 to-70 feet MSL, respectively.
Water levels in the Pressure 400-Foot Aquifer and the Deep East Side Aquifer are between-20 feet to -60 feet MSL, respectively (Agency 1997). There is evidence in the stratigraphic

7/23/2019 Hydrostratigraphic Analysis of the Northern Salinas Valley 2004
http://slidepdf.com/reader/full/hydrostratigraphic-analysis-of-the-northern-salinas-valley-2004 15/112
Kennedy/Jenks Consultants
Executive Summary ES-9Final Report – Hydrostratigraphic Analysis of the Northern Salinas Valleyp:\isg-proj\mcwra final rpt\execsummary_14may2004.doc
cross-sections of hydraulic communications between these subareas. These semipermeable
and permeable zones of possible flow between the Pressure and East Side are depicted inFigures 3 and 4 along with the seawater intrusion fronts.
It is our opinion – with the above noted gradient of flow into the East Side – which denserseawater/freshwater mix will not readily flow into the East Side aquifers given the aquifermaterials of much lesser permeabilities. The juxtaposed edges of the seawater intrusion frontand the East Side boundary shown in Figure 3 support this conclusion.
Lastly, the mostly fine-grained materials in stratigraphic facies depicted in the cross-sectionsC-C’ through G-G’ of the East Side Subarea do not support a significant component of verticalflow. The likelihood of downward movement of blended seawater/ground water in the transitionzone and in the East Side Subarea is considered low. Hence, the postulated “return flow”scenario is unlikely. That is, seawater in the Pressure 180-Foot Aquifer flowing into the EastSide aquifers, migrating downward in the later, and eventually spilling back out into the Pressure400-Foot Aquifer is unlikely or the process would take a very long time.
Conclusion
Pressure Subarea Hydrostratigraphy
Interpretations of seven geologic cross-sections depict two general categories of sedimentswithin the northern Salinas Valley fill: fine-grained aquitards and coarse-grained aquifers. Claysto gravelly clays are classified as aquitards and sands to sand-gravel mixtures are considered tobe aquifer materials. Cross-section interpretations corroborate previous findings of the
configuration and occurrences of a shallow ground water aquifer perched on top of or locatedwithin the Salinas Valley Aquitard. The cross section interpretations also verify that the tops ofthe Pressure 180-Foot and Pressure 400-Foot Aquifers are generally encountered at -100 feetand -300 feet mean sea level (MSL), respectively. The prominent clay layer, commonly referredto as the Pressure 180/400-Foot Aquitard, is also observed in most of the cross-sectionsconstructed for this study.
The shapes of the sand bodies in the Pressure 180-Foot Aquifer appear to represent a fluvialdepositional environment. Meaning, the lenticular shapes of the sand bodies observed in cross-sections in the Pressure Subarea reflect deposition in a fluvial channel. In addition, the morelaterally extensive sand units were formed by the fluvial channel meandering and shiftinglaterally through time.
In general, the Pressure 400-Foot Aquifer has a larger component of sand and gravel than thePressure 180-Foot Aquifer, and the sand bodies are more laterally continuous than in thePressure 180-Foot Aquifer. The more continuous nature of the Pressure 400-Foot Aquifer isinterpreted to be the result of frequent meandering of the ancestral Salinas River across theriver valley, which resulted in the widespread deposition of sand and gravel. This aquifer zone ismore complex than the 180-Foot Aquifer with variable mix of coarse- and fine-grained depositsthat become more variable in depth and thickness and more discontinuous from southeast to

7/23/2019 Hydrostratigraphic Analysis of the Northern Salinas Valley 2004
http://slidepdf.com/reader/full/hydrostratigraphic-analysis-of-the-northern-salinas-valley-2004 16/112
Kennedy/Jenks Consultants
Executive Summary ES-10Final Report – Hydrostratigraphic Analysis of the Northern Salinas Valleyp:\isg-proj\mcwra final rpt\execsummary_14may2004.doc
northwest, i.e. in the downstream direction. This spatial transition is likely the remnants of a
higher energy fluvial depositional environment near the present location of the City of Salinas toa lower energy environment toward the Monterey coast.
Localized areas where the Pressure 180/400-Foot Aquitard is thin or absent have beenobserved in cross-sections and mapped in plan view (Figures 1, 3, and 4 red dots). Areas wherethis aquitard is absent and where possible direct communication can occur between thePressure 180-Foot Aquifer and Pressure 400-Foot Aquifer is observed in portions of all cross-sections except Cross-Section G-G’. Interaquifer impact is considered to be a significantseawater encroachment threat to the current water quality of the Pressure 400-Foot Aquifer forthe northern Salinas Valley area.
The most notable area of discontinuities in the aquitard is in the vicinity of Township 14S, Range3E, Sections 20, 29, and 30. The feature that is observed in this area cannot be traced tobeyond Cross-Sections D-D’ and G-G’. In general, we conclude that there are localized areas ofaquitard thinning and absence (Figures 1, 3, and 4 red dots). Data do not support theresemblance of a spatially continuous paleo-channel.
East Side Subarea and Transition Zone Hydrostratigraphy
The transition zone or boundary between the Pressure and East Side Subareas is defined inthis study by the transition from predominantly fluvial facies to predominantly alluvial fan facies.By characterizing the sedimentary facies and stratigraphic architecture of the transition zone, wehave filled in the missing link between the Pressure and East Side Subarea hydrogeology anddeveloped models of the paleo-depositional environments.
The fluvially generated Pressure 180-Foot and Pressure 400-Foot Aquifers of the PressureSubarea are not observed in the East Side Subarea. The sand and gravel beds of the East SideSubarea are generally thinner and less continuous than in the Pressure Subarea. This studycorroborates previous investigations that the East Side stratigraphy does not correlate wellbetween boreholes. We conclude and agree with other investigators that the gravel and sanddeposits represent complex remnants of streams feeding the alluvial fans, which resulted in acomplex record of sediment deposition and erosion.
Blue clay beds that form the principal aquicludes and aquitards in the Pressure Subarea arerarely observed within the East Side Subarea. Correlations completed in this study suggest thatthe blue clay spread through the northern Salinas Valley and onlapped the alluvial fans on theeast side of the Valley.
The sedimentary facies characteristics of the East Side Subarea suggest that the wells in thisarea would be lower yielding and that the hydraulic conductivities are at least an order ofmagnitude lower than the sediments comprising the Pressure 180-Foot Aquifer zone of thePressure Subarea. We also postulate that seawater intrusion would occur at a substantiallyslower rate, if at all, in the East Side Subarea than has been observed in the Pressure Subarea.

7/23/2019 Hydrostratigraphic Analysis of the Northern Salinas Valley 2004
http://slidepdf.com/reader/full/hydrostratigraphic-analysis-of-the-northern-salinas-valley-2004 17/112
Kennedy/Jenks Consultants
Executive Summary ES-11Final Report – Hydrostratigraphic Analysis of the Northern Salinas Valleyp:\isg-proj\mcwra final rpt\execsummary_14may2004.doc
Regional Seawater Intrusion
The primary cause of seawater intrusion in the northern Salinas Valley area is that the aquifersare in direct hydraulic contact with the sea. Accordingly, we have evidence of submarineoutcrops for both aquifers. The secondary cause of seawater mixing or intrusion in the freshwater aquifers is that ground water levels in both aquifers are below sea level with a developinglandward ground water gradient recorded since the 1930s.
The Pressure 180-Foot Aquifer seawater intrusion front noticeably follows the trend of thecoarse-grained fluvial facies, and is confined by the band of the less permeable fluvial facies(Figure 3). These fine-grained fluvial deposits serve as a semipermeable barrier of flow from thePressure to the East Side Subarea. Ground water gradients in this area suggest that flowoccurs from the Pressure to the East Side Subarea. However, we conclude that the seawaterintrusion front has not migrated across to the East Side Subarea. Moreover, it is unlikely that
seawater will enter the transition zone or the East Side Subarea any time soon based on theinferred rates of seawater advances and the less permeable aquifer properties of the East Sidesedimentary deposits.
The leading edge of the seawater front in the Pressure 400-Foot Aquifer is about five miles fromproduction wells (T14S, R3E, Sections 20 & 29) in the City of Salinas. It is unlikely that seawaterthat has intruded directly from submarine outcrops into the Pressure 400-Foot Aquifer will reachthe City of Salinas any time soon; the travel time is estimated to be 49 years, based on a rate of578 ft/yr. We do not anticipate abrupt accelerated advancement of seawater south of Castrovilleand in the Fort Ord area, where the two most prominent seawater intrusion fronts in this aquiferzone have been recorded to-date. We conclude that although regional seawater intrusionmechanism for the Pressure 400-Foot Aquifer is of importance for continued monitoring, it is
more likely that in the City of Salinas this aquifer and its production wells will be impacted byinteraquifer flow between the Pressure 180-Foot Aquifer and the Pressure 400-Foot Aquifersimilar to that observed in the Fort Ord area.
Recommendations
These recommendations are made based on the analyses of hydrostratigraphic sections andthe evaluation of seawater intrusion areas and rates of intrusion expansion. We also reviewedsuggestions from previous studies and included those that are relevant to the objective of thisstudy and in characterizing seawater intrusion in the northern Salinas valley. Recommendationslisted are in no order of importance.
1. Perform detailed evaluations of water chemistry signature to distinguish the origin andmechanism of seawater / fresh water mix in ground water; i.e. regionally intruded seawaterversus interaquifer contamination and well leakage. This can be done (as performed in Todd1989) by use of Trilinear diagrams of cation and anion distributions at specific well locations.This should be done in additional to chloride spatial and temporal trend analyses.

7/23/2019 Hydrostratigraphic Analysis of the Northern Salinas Valley 2004
http://slidepdf.com/reader/full/hydrostratigraphic-analysis-of-the-northern-salinas-valley-2004 18/112
Kennedy/Jenks Consultants
Executive Summary ES-12Final Report – Hydrostratigraphic Analysis of the Northern Salinas Valleyp:\isg-proj\mcwra final rpt\execsummary_14may2004.doc
2. Map vertical hydraulic gradients for the ground water data for the Pressure 180-Foot and
400-Foot Aquifers. Changes in ground water gradient provide an indication of the degree ofconfinement of the lower water-bearing zone by the Pressure 180/400 Aquitard. This in turncan infer the spatial variation of thicknesses of the aquitard. This approach will depend onthe availability of data and well completion records. These gradient maps should then becompared to hydrostratigraphic facies maps in this study.
3. Estimate the spatial distribution of ground water leakages (Darcy’s flux) across the Pressure/ East Side Subarea boundary
4. Map the distribution of interaquifer flow quantities
5. Estimate and map the quantity of well leakage where data are available.
6. Continue water quality sampling – specifically chloride and total dissolved solids - in bothaquifers to aid in modeling the future pattern of seawater and to distinguish mechanisms ofintrusion and seawater / fresh water mixing.
7. Use dual-density computer model to evaluate flow and seawater mixing with fresh water aspart of overall water resources planning.
8. Continue updating the Agency WRAIMS database in terms of ground water quality,elevations, and lithologic information. WRAIMS should be used to update the lithologiccross-sections whenever new data are available for reevaluation of the area’shydrostratigraphy.
WRAIMS should be upgraded with a computerized hydrostratigraphic analysis tool to allow
for more efficient review of cross-sections and ground water data. The most cost effectivesolution is to upgrade WRAIMS with a cross-section development tool as an extension to itsGIS.
9. Continue to evaluate and refine the boundary between the Pressure and East SideSubareas based on water quality, hydrostratigraphic understandings, and updatedinterpretations of the depositional environment as reported in this study that makeup thepresent day Salinas Valley.
10. Construct a three-dimensional model based on the hydrostratigraphic analysis reported inthis study. The amount of data used in this study and its findings merit the development of asolid 3-D model of: A) inferred permeabilities, B) lithology; and C) depiction of ground water
quality and elevations. The best approach to accomplish this is to digitally parameterize(populate) a 3-D numerical matrix - based on correlations in cross-sections. This 3-D model(matrix) can be used to calculate (map) flows and quantify ground water volumes by aquifersor by compartments like those used in evaluating the seawater pathways in this report.
7/23/2019 Hydrostratigraphic Analysis of the Northern Salinas Valley 2004
http://slidepdf.com/reader/full/hydrostratigraphic-analysis-of-the-northern-salinas-valley-2004 19/112
E x e c u t i v e S umm ar y
E S -1 3
F i n al R e p or t
–H y d r o s t r a t i gr a ph i c A n al y s i s of t h
eN or t h er n S al i n a s V al l e y
p: \ i s g- pr o j \ m c wr af i n al r p t \ ex e c s umm ar y _1 4 m a y 2 0 0 4 . d o c

7/23/2019 Hydrostratigraphic Analysis of the Northern Salinas Valley 2004
http://slidepdf.com/reader/full/hydrostratigraphic-analysis-of-the-northern-salinas-valley-2004 20/112
E x e c u t i v e S umm ar y
E S -1 4
F i n al R e p or t
–H y d r o s t r a t i gr a ph i c A n al y s i s of t h
eN or t h er n S al i n a s V al l e y
p: \ i s g- pr o j \ m c wr af i n al r p t \ ex e c s umm ar y _1 4 m a y 2 0 0 4 . d o c

7/23/2019 Hydrostratigraphic Analysis of the Northern Salinas Valley 2004
http://slidepdf.com/reader/full/hydrostratigraphic-analysis-of-the-northern-salinas-valley-2004 21/112
E x e c u t i v e S umm ar y
E S -1 5
F i n al R e p or t
–H y d r o s t r a t i gr a ph i c A n al y s i s of t h
eN or t h er n S al i n a s V al l e y
p: \ i s g- pr o j \ m c wr af i n al r p t \ ex e c s umm ar y _1 4 m a y 2 0 0 4 . d o c

7/23/2019 Hydrostratigraphic Analysis of the Northern Salinas Valley 2004
http://slidepdf.com/reader/full/hydrostratigraphic-analysis-of-the-northern-salinas-valley-2004 22/112
E x e c u t i v e S umm ar y
E S -1 6
F i n al R e p or t
–H y d r o s t r a t i gr a ph i c A n al y s i s of t h
eN or t h er n S al i n a s V al l e y
p: \ i s g- pr o j \ m c wr af i n al r p t \ ex e c s umm ar y _1 4 m a y 2 0 0 4 . d o c

7/23/2019 Hydrostratigraphic Analysis of the Northern Salinas Valley 2004
http://slidepdf.com/reader/full/hydrostratigraphic-analysis-of-the-northern-salinas-valley-2004 23/112
Kennedy/Jenks Consultants
Final Report – Hydrostratigraphic Analysis of the Northern Salinas Valley 1p:\isg-proj\mcwra final rpt\mcwra_final_14may2004.doc
Section 1: Introduction
This is a focused assessment of the hydrostratigraphy and updated interpretation of theancestral depositional environment in areas beneath the City of Salinas to the Monterey Bay(Figure 1). These findings will assist in ongoing efforts to estimate rates of seawater intrusion inthe aquifers beneath this area.
1.1 Project Background and Study Goals
The Monterey County Water Resources Agency (Agency), responsible for the management andplanning of water resources within Monterey County, uses a network of wells to monitor groundwater conditions in the Salinas Valley ground water basin. The Agency has documentedprogressive advancement of seawater into ground water zones and the understanding of the
northern Salinas ground water basin hydrogeology have been documented by the Agency sincethe 1950s. Only in the later 1990s and recently have there been sufficient well logs,geophysical, and lithological data to support a three-dimensional (3-D) study of the interrelatedancestral fluvial and alluvial fan depositional environments that make up the present day groundwater bearing zones. These zones are known as the Pressure 180-Foot Aquifer and thePressure 400-Foot Aquifer. The study also includes a detailed analysis of the seawater intrusionpathways within these ground water bearing zones.
This report as intended by the Agency is the work of a focused study and update of thehydrogeologic interpretations to augment the ongoing assessment of rates of seawater intrusioninto the Pressure 180-Foot Aquifer and the Pressure 400-Foot Aquifers. Specific goals in thisstudy are:
●
Examine the lithologic continuity of hydrostratigraphy in the Pressure and EastSide subareas;
● Characterize the hydrostratigraphic nature of the transition zone betweenPressure and East Side subareas;
● Provide detailed depiction of localized thinning and absence of clay sequences
that facilitate hydraulic communication between the Pressure 180–Foot Aquiferand the Pressure 400-Foot Aquifer; and
● Estimate rates of seawater intrusion and the advancement of seawaterencroachment towards the City of Salinas.
The occurrence of seawater intrusion into the Pressure 180-Foot Aquifer in the areas betweenthe City of Salinas and the coast was first documented in 1933 by the State of California.Continued seawater intrusion to present day is largely attributed to overdraft of ground waterfrom the Pressure 180-Foot Aquifer. Withdrawals from both the Pressure 180-Foot Aquifer andthe Pressure 400-Foot Aquifer have lowered water levels below sea level. Seawater intrusioninto the Pressure 400-Foot Aquifer has been slower and less extensive than in the overlyingPressure 180-Foot Aquifer because the Pressure 400-Foot Aquifer was not drawn upon until

7/23/2019 Hydrostratigraphic Analysis of the Northern Salinas Valley 2004
http://slidepdf.com/reader/full/hydrostratigraphic-analysis-of-the-northern-salinas-valley-2004 24/112
Kennedy/Jenks Consultants
Final Report – Hydrostratigraphic Analysis of the Northern Salinas Valley 2p:\isg-proj\mcwra final rpt\mcwra_final_14may2004.doc
water quality in the Pressure 180-Foot Aquifer had been significantly degraded. However, inrecent studies, the integrity of the aquitard that separates the Pressure 180-Foot Aquifer and thePressure 400-Foot Aquifer has been the subject of detailed hydrogeologic interpretations using
new data and reinterpretations of previous results. This report examines evidence of localizedthinning and absence of the clay layer that likely results in interaquifer migration or downwardgradient flow of ground water and seawater from the Pressure 180-Foot Aquifer to the Pressure400-Foot Aquifer.
1.2 Scope of Work
The scope of work authorized by the Agency is as follows:
Task 1 – Review of Literature and Preparation of Bibliography
Task 2 – Review of Well Logs and Available Cross-sections; Compilation of lithologic
database and 3-D geographic information system.
Task 3 – Selection of Optimum Locations of Cross-sections; Construct lithologiccross-sections and perform hydrostratigraphic correlations
Task 4 – Results Discussion of Hydrostratigraphy of the Pressure and East SideSubareas
Task 5 – Results Discussion of Hydrostratigraphy of the Transition Zone betweenPressure and East Side Subareas
Task 6 – Development of Seawater Intrusion Rates
Task 7 – Preparation of Final Report
1.3 Approach
Our approach in this study was to construct a 3-D hydrogeologic conceptual model of thenorthern Salinas Valley. With the use of a 3-D geographic information system (GIS) and adatabase of over 700 wells, we intend to present a comprehensive update of previous findings.This update will be based on previous and recently acquired lithologic data and will introducethree possible scenarios of the ancestral deposition processes that make up the present dayhydrogeologic structure. The objective of this study is a focused assessment of the adjacentPressure 180-Foot Aquifer and Pressure 400-Foot Aquifer. These aquifers span the uppermost
600 feet of sedimentary sequences and are part of the Valley Fill Deposits (Qvf) and theunderlying Aromas/Paso Robles Formation (Qar).
Seven cross-sections and hydrogeologic maps were used to depict the hydrostratigraphiccharacteristics of the Pressure 180-Foot Aquifer and Pressure 400-Foot Aquifer and thehydrogeologic relationships, and the inferred hydraulic properties in the transition zone betweenthe Pressure and East Side. The analysis of hydrostratigraphy, hydrogeologic conditions, and

7/23/2019 Hydrostratigraphic Analysis of the Northern Salinas Valley 2004
http://slidepdf.com/reader/full/hydrostratigraphic-analysis-of-the-northern-salinas-valley-2004 25/112
Kennedy/Jenks Consultants
Final Report – Hydrostratigraphic Analysis of the Northern Salinas Valley 3p:\isg-proj\mcwra final rpt\mcwra_final_14may2004.doc
ancestral deposition processes was performed with the goal of expanding the knowledge baseto enhance the ability to assess the threat and estimate rates of seawater encroachment.
One cross-section (A-A’) is oriented northwest-southeast, along the Salinas Valley axis, and sixcross-sections (B-B’ to G-G’) are oriented southwest-northeast. The cross-sections identifychanges in stratigraphy and permeability within and between the Pressure and East Sidesubareas. The differences in water levels between the Pressure Subarea and the East SideSubarea suggest that stratigraphy and permeability changes between the two subareas. Wellsincluded in cross-sections are identified with state well identifications (township/range/section)with the exception of those that are currently identified with assessor’s parcel number labels(APN labels). These wells have not been assigned state well identifications.
An equally important goal of the cross-sections is to identify areas of localized thinning andabsence of confining layers, such as the blue clay sequences. Such areas are of particularinterest in assessing localized downward flow of ground water. Interaquifer contamination is
considered as considerable localized seawater encroachment threat to the current water qualityin primarily the Pressure 400-Foot Aquifer for this area.
1.4 Hydrostratigraphic Cross-Sections
The cross-section locations are shown on Figure 2 and the cross-sections are included asFigure 3 through Figure 9. Cross-Section A-A’ extends northwest to southeast and provides alongitudinal or axial profile rendition of the valley sediments. Cross-Sections B-B’ through G-G’individually extend from southwest to northeast, parallel to each other and sub-perpendicular toCross-Section A-A’ and the axis of the Salinas River Valley.
The stratigraphy on the cross-sections is based on data from well logs provided in electronic
format and on paper copies of logs provided by the Agency (Table 1). The lithologic entries onthe paper logs were interpreted to conform to the GeoBase™ graphic system in use by the Agency; for example “sand and clay” on a driller’s log was interpreted as “sand/clay”(i.e. interbedded sand and clay) for presentation on the cross-sections.
The lithology shown on the cross-sections is based on Water Well Drillers Reports (DWR-188forms) filed by the well drillers with the State of California Department of Water Resources(DWR). In some cases the logs may be old, the depth resolution poor, or the lithologicdistinction suspect. In other cases the drilling method is not conducive to accurate logging. Thelithology shown on the well logs should not therefore be viewed as precise.
This study presents cross-sections that are positioned as straight lines (Figure 2) with lithology
projected onto each section. Wells with available lithologic logs within 1,000 feet of a cross-section were subjected to be included for stratigraphic correlation. We have assess the regionaland local attitudes of soil horizons and lithologic dip angles and concluded that attitudes of bothare nearly horizontal in the easterly / westerly directions – along the axis of the Northern Salinasvalley. Therefore, we have not corrected for dip angles in projecting lithologic unit depths ontocross-sections – i.e. no elevation corrections necessary.

7/23/2019 Hydrostratigraphic Analysis of the Northern Salinas Valley 2004
http://slidepdf.com/reader/full/hydrostratigraphic-analysis-of-the-northern-salinas-valley-2004 26/112
Kennedy/Jenks Consultants
Final Report – Hydrostratigraphic Analysis of the Northern Salinas Valley 4p:\isg-proj\mcwra final rpt\mcwra_final_14may2004.doc
1.5 Previous Studies
Sixty-five documents spanning the time period from 1904 to 2001 were reviewed as background
information, raw data resources, and relevant, up-to-date interpretations of the geology andhydrogeology of the northern Salinas Valley. These references are presented in bibliographyform in Appendix B. Twenty references are cited in this report and they are presented in thereferences Section 10. Reviews of previous work are summarized in Section 2, "BackgroundHydrogeology." This section is extensive and intended as a reference for this study.

7/23/2019 Hydrostratigraphic Analysis of the Northern Salinas Valley 2004
http://slidepdf.com/reader/full/hydrostratigraphic-analysis-of-the-northern-salinas-valley-2004 27/112
Kennedy/Jenks Consultants
Final Report – Hydrostratigraphic Analysis of the Northern Salinas Valley 5p:\isg-proj\mcwra final rpt\mcwra_final_14may2004.doc
Section 2: Background Hydrogeology
This section presents the geographic and hydrologic setting of the northern Salinas Valley. Thehydrologic subarea designations, stratigraphy, hydrostratigraphy, and depositional settings areintroduced and discussed.
2.1 Geographic and Hydrologic Settings
The Salinas Valley Ground Water Basin is situated entirely within Monterey County, locatedalong the central California coast approximately 100 miles south of San Francisco (Figure 1).The Salinas Valley is an elongate intermountain valley, extending from the northwest at theMonterey Bay to the southeast for about 80 miles inland. It is bounded by the Sierra De Salinasin the west and by the Gabilan and Diablo Ranges in the east. The valley ranges in width from
about 14 miles in the north at the City of Salinas (i.e. this Study Area, Figure 1) to about 2 milesat its southeastern end.
The narrow basin encompasses about 561 square miles and is distinguished by four subareasas described by the California Department of Public Works, Division of Water Resources (DWR)in DWR Bulletin 52 (DWR, 1946). These subareas were defined based on sources of groundwater recharge and the nature of the stratigraphy, and were depicted for analytical purposesonly. DWR (1946) noted that these areas are not sub-basins, and that the subareas arehydrologically connected.
The Pressure, East Side, Forebay, and Upper Valley subareas are hydrologically andhydraulically connected. Recharge to ground water is from percolation from the Salinas River
and its tributaries during and following the rainy season. Primary surface water featuresoverlying and recharging the basin’s ground water storage are the Salinas River, which runs theentire length of the ground water basin, and its tributaries. At the southeastern end of the basin,water from Nacimiento and San Antonio reservoirs is released into the Salinas River forrecharge into the basin. Two subareas that are within this project study area – northern SalinasValley - are shown in Figure 1 and briefly described in the following sections.
2.2 Pressure and East Side Subareas
The northern Salinas Valley is divided into two subareas, the Pressure Subarea to the west andthe East Side Subarea to the east (Figure 1). The hydrogeology and ground water behavior ineach subarea is markedly different due to different depositional environments and geology.
Much work has been conducted in the Pressure Subarea and the hydrostratigraphy anddepositional history is relatively well understood. Less work has been conducted in the EastSide Subarea, however, and the stratigraphy is much more complex, more variable, and lackswell-to-well correlation compared to the Pressure Subarea. The transition zone between thesesubareas as part of this study area has not been extensively studied in the past.

7/23/2019 Hydrostratigraphic Analysis of the Northern Salinas Valley 2004
http://slidepdf.com/reader/full/hydrostratigraphic-analysis-of-the-northern-salinas-valley-2004 28/112
Kennedy/Jenks Consultants
Final Report – Hydrostratigraphic Analysis of the Northern Salinas Valley 6p:\isg-proj\mcwra final rpt\mcwra_final_14may2004.doc
2.3 Stratigraphy of the Northern Salinas Valley
Sections 2.3.1 to 2.3.4 describe briefly the stratigraphic units that are within the stratigraphic
depths of this study – those include the Salinas Valley Aquitard (SVA) to the Pressure 400-Foot Aquifer - and they are presented from the youngest to oldest. Section 2.3.5 outlines the olderand deeper geologic formations that underlie the Pressure 400-Foot Aquifer.
2.3.1 Recent Alluvium
Recent alluvium in the Salinas Valley includes the upper 10 to 75 feet of alluvium deposited bythe Salinas River (DWR, 1973; Harding ESE, 2001). These deposits have low to moderatepermeability and include perched ground water zones. The perched ground water zones ingeneral have not been affected by seawater intrusion, but in some cases have been affected bypercolate from agriculture (Harding ESE, 2001). DWR (1973) identifies approximately 20 feet ofsandier material underlying the lower permeability zones as the base of the Recent Alluvium.
2.3.2 Valley Fill
This Pleistocene unit underlies the recent alluvium and is composed of alternating,interconnected, complex beds of fine-grained and coarser-grained estuarine and fluvialdeposits. It includes the SVA, which overlies and confines the Pressure 180-Foot Aquifer. TheValley Fill ranges from approximately 25 feet to 100 feet thick (DWR, 1973; Harding ESE,2001).
2.3.3 Aromas Sand
The Pleistocene Aromas Sand underlies the valley fill and consists mainly of cross-bedded sandwith some clayey layers (Harding ESE, 2001). The lower Aromas Sand near the contact with theunderlying Paso Robles Formation is commonly stained a distinct red or brownish color.
Previous reports also infer that the Aromas Sand is a continental deposit but these reports donot agree on the depositional origin. Harding ESE (2001) observes in one area of Marina / FortOrd, cross bedding and grain size suggests that the Aromas Sand was deposited in eolianconditions, but elsewhere on the site, Harding ESE reports that angular granitic clasts in thebasal Aromas Sand suggest a high-energy alluvial or alluvial fan depositional environment.Greene (1970) suggests deposition in a shoreline environment, and Greene (1977) and Dupre(1990) suggest an eolian depositional environment.
2.3.4 Paso Robles Formation
The middle to lower Pleistocene (Thorup, 1976) Paso Robles Formation consists of lenticularbeds of sand, gravel, silt, and clay. Harding ESE (2001) indicates that in the Marina / Fort Ordarea, the beds are laterally discontinuous and may indicate an alluvial fan or braided streamdepositional environment; Thorup (1976) indicates the Paso Robles Formation was depositedby the ancestral Salinas River. Greene (1970) suggests that the formation is upper Pliocene toPleistocene and includes alluvial fan, lake, and floodplain deposits.
7/23/2019 Hydrostratigraphic Analysis of the Northern Salinas Valley 2004
http://slidepdf.com/reader/full/hydrostratigraphic-analysis-of-the-northern-salinas-valley-2004 29/112
Kennedy/Jenks Consultants
Final Report – Hydrostratigraphic Analysis of the Northern Salinas Valley 7p:\isg-proj\mcwra final rpt\mcwra_final_14may2004.doc
2.3.5 Older and Deeper Geologic Formations that Underlie the
Pressure 400-Foot Aquifer
2.3.5.1 Purisima Formation
The Pliocene Purisima Formation directly beneath the lower Paso Robles Formation is ashallow marine unit composed of intercalated siltstone, sandstone, conglomerate (Greene,1977), clay, and shale (Harding ESE, 2001). In the Santa Cruz and Scotts Valley area (north ofthe study area), the Purisima Formation occurs in outcrop but in the Monterey Bay and SalinasValley area the Purisima only occurs in the subsurface, where it is conformably overlain by thePaso Robles Formation (Greene, 1977; Harding ESE, 2001).
Thorup (1976) identified approximately 1,420 feet of Pliocene sediment in Well 14S/02E-22K01,including Purisima and Santa Margarita Formation sediments.
2.3.5.2 Santa Margarita Formation
The Upper Miocene to Pliocene Santa Margarita Formation consists of friable arkosic sandstone(Greene, 1977) deposited in shallow marine conditions (Harding ESE, 2001). It underlies thePurisima Formation, in the Seaside Basin and may directly underlie the Paso Robles Formationin areas where the Purisima Formation is absent (Greene, 1977). Thorup (1976) identifiedPliocene material, including the Santa Margarita Formation, in Well 14S/02E-22K01.
2.3.5.3 Monterey Formation
The Monterey Formation is a Miocene-aged marine shale and mudstone (Green, 1970),generally composing the base of water-bearing sediments in the northern Salinas Valley area.
Extensive exposures of the Monterey Formation occur in the hills south of the study area andclasts are commonly observed in fluvial sediments (Staal, Gardner, & Dunne Inc., a.k.a. SGD1993). Thorup (1976) encountered the Monterey formation at approximately 1,675 feet belowground surface in Well 14S/02E-22K01.
2.4 Hydrostratigraphic Units
2.4.1 Shallow Aquifer
Ground water in the Pressure subarea shallow aquifers overlies the SVA in some areas(MCFCWCD, 1960). These aquifers typically have low to moderate permeability and range up to75 feet thick (DWR, 1973). The ground water is generally poor quality (MCFCWCD, 1960).
2.4.2 Salinas Valley Aquitard
The SVA is a series of blue or yellow sandy clay layers, with minor sand layers, overlying andconfining the Pressure 180-Foot Aquifer. In the Salinas Valley, the SVA extends fromapproximately Monterey Bay south to Chualar (approximately 10 miles south of Salinas), andfrom Fort Ord east to an irregular contact at the Pressure Subarea/East Side Subareaboundary. In general, the thickness ranges from approximately 100 feet in the area west of

7/23/2019 Hydrostratigraphic Analysis of the Northern Salinas Valley 2004
http://slidepdf.com/reader/full/hydrostratigraphic-analysis-of-the-northern-salinas-valley-2004 30/112
Kennedy/Jenks Consultants
Final Report – Hydrostratigraphic Analysis of the Northern Salinas Valley 8p:\isg-proj\mcwra final rpt\mcwra_final_14may2004.doc
Salinas, thinning to approximately 25 feet near Salinas (DWR, 1973), and pinching out east ofSalinas.
2.4.3 Pressure 180-Foot Aquifer
The uppermost laterally extensive aquifer in the northern Salinas Valley is known as the“180-Foot Aquifer” or the “Pressure 180-Foot Aquifer”, based on the depth where it is typicallyencountered (DWR, 1946). DWR (1970) and DWR (1973) indicate that it ranges from 50 to150 feet in thickness, with the top typically encountered between 100 and 150 feet belowground. The upper portion of the Pressure 180-Foot Aquifer is unconfined and the lower portionis confined by the SVA and is recharged where the SVA pinches out, e.g. the Forebay area, andis exposed on the floor of Monterey Bay (Todd, 1989). The Pressure 180-Foot Aquifer generallyconsists of hydraulically connected sand and gravel beds with intervening clay layers (HardingESE, 2001; Greene, 1970).
The location of this aquifer within the stratigraphic framework of the Salinas Valley is variableand evidently spans more than one stratigraphic unit. DWR (1970) and DWR (1973) correlatethis aquifer to lower valley terrace deposits and upper Aromas Sand; Leedshill-Herkenhoff, Inc.(1984) correlates the aquifer with the Paso Robles Formation; DWR (1973) and Harding ESE(2001) assign the Pressure 180-Foot Aquifer to Valley Fill; and Greene (1970) places it in thelower Valley Fill and upper Aromas Sands.
2.4.4 Pressure 180/400-Foot Aquitard
The Pressure 180-Foot Aquifer and Pressure 400-Foot Aquifer are separated by a zone of clay,or clay and sand layers (MCFCWCD, 1960) referred to as the Pressure 180/ 400-Foot Aquitard.This barrier is widespread in the Salinas Valley basin and varies in thickness and quality fromthick layers of blue clay to thin layers of brown clay (MCFCWCD, 1960).
Variability in thickness and quality of the Pressure 180/400-Foot Aquitard and the existence ofpossible gaps in the aquitard has been documented. MCFCWCD (1960) describes two small“holes” in the aquitard, one under the Salinas River near Blanco and another under the oldSalinas River bed near the coast. The Pressure 180-Foot Aquifer and the Pressure 400-Foot Aquifer also appear to be interconnected in places between Salinas and Chualar (approximately10 miles south of Salinas) and south of Chualar (MCFCWCD, 1960). Brown (1986) describesthe aquitard as generally lenticular in shape and discontinuous in places, notably near themouth of the Salinas River and near Fort Ord. Todd (1989) indicates several areas betweenCastroville and the coast where the aquitard is thin or absent.
2.4.5 Pressure 400-Foot Aquifer
The areally extensive layer of sand and gravel typically encountered between 270 and 470 feetbelow ground surface is referred to as the “400-Foot” or the “Pressure 400-Foot Aquifer”. Thedepth to the top of the aquifer, the thickness of the aquifer, and the degree of complexinterbedding with clay layers is quite variable between wells (Thorup, 1976). DWR (1970) andDWR (1973) indicate that near Salinas the aquifer consists of a single thick permeable bedapproximately 200 feet thick, which divides into two 25-foot thick sandy beds and one 100-foot

7/23/2019 Hydrostratigraphic Analysis of the Northern Salinas Valley 2004
http://slidepdf.com/reader/full/hydrostratigraphic-analysis-of-the-northern-salinas-valley-2004 31/112
Kennedy/Jenks Consultants
Final Report – Hydrostratigraphic Analysis of the Northern Salinas Valley 9p:\isg-proj\mcwra final rpt\mcwra_final_14may2004.doc
thick sandy bed, separated from each other by clay layers, northwest toward Castroville. DWR(1970) and DWR (1973) indicate that in some areas, uppermost beds of this aquifer merge andinterfinger with lower beds of the Pressure 180-Foot Aquifer.
In wells drilled near the Pressure/East Side boundary, SGD (1993) notes the sand layerscontain fragments of shale and porcelaneous chert sand and gravel derived from the MontereyFormation (Section 2.3.5.3). Because the Monterey Formation is exposed at the surface southof Salinas (upstream) and not in the hills near Salinas, the presence of these rock fragmentsindicates that the sediments were deposited in a fluvial environment. The clay beds separatingindividual sand layers are blue or brown and may contain shell fragments (SGD, 1993).
DWR (1970) and DWR (1973) suggest that the upper portion of the Pressure 400-Foot Aquifercorrelates to the Aromas Sand and the lower portion correlates to the Paso Robles Formation.Thorup (1976) correlates this aquifer with the Paso Robles Formation. Harding ESE (2001)indicates that recharge to the Pressure 400-Foot Aquifer is in the Arroyo Seco area; Thorup
(1976) indicates that recharge to the Paso Robles Formation is provided by infiltration from theSalinas River in the King City area, infiltration from the Arroyo Seco River in the Arroyo SecoCone area, and from precipitation runoff infiltration along the eastern edge of the Sierra deSalinas (Section 2.1).
2.4.6 Pressure 400-Foot/Pressure Deep Aquitard
The term Pressure Deep Aquifer includes the following aquifers: the 800-Foot Aquifer, 900-Foot Aquifer, 1,000-Foot Aquifer, and the 1,500-Foot Aquifer (Harding ESE, 2001). Thorup (1976)includes these aquifers in the Paso Robles Formation. The two aquifers are separated by anaquitard that can be several hundred feet thick.
2.5 Depositional Environments of the Pressure and East Side
Subareas
The hydrostratigraphy of the upper 500 feet of the Pressure Subarea reflects the effects of therepeated fluctuation of sea level resulting from climatic changes in the Quaternary (Tinsley,1975; Greene, 1977; SGD, 1993). The repeated cycle of sea level rise and fall, and thealternating periods of estuarine and fluvial deposition have created the sequence of aquitardsand aquifers.
Tinsley (1975) relates the cyclic deposition to marine transgressions and regressions associatedwith glacio-eustatic sea level fluctuations. In relating the elevations of the aquifers, the sea level
elevations during glaciation periods, the rates of sedimentation, and the rates of sea levelchanges, he demonstrated that the stratigraphy could be a product of marine transgressionsand regressions depositional processes during the Wisconsin-age glaciation. Tinsley (1975)argues that a fall in sea level during glaciation resulted in extensive higher-energy, coarser-grained fluvial deposits as the base level was lowered and the river system incised the valley fill.He also argued that the rate of sea level rise during glacial melting periods was faster than thesedimentation rate in the northern Salinas Valley, resulting in the “drowning” the Salinas RiverValley. This created lower-energy estuarine depositional environments similar to the present-day Elkhorn Slough, leading to the deposition of fine-grained aquitards.

7/23/2019 Hydrostratigraphic Analysis of the Northern Salinas Valley 2004
http://slidepdf.com/reader/full/hydrostratigraphic-analysis-of-the-northern-salinas-valley-2004 32/112
Kennedy/Jenks Consultants
Final Report – Hydrostratigraphic Analysis of the Northern Salinas Valley 10p:\isg-proj\mcwra final rpt\mcwra_final_14may2004.doc
Based on foraminiferal assemblages and the analysis of these glacial-related sea levelchanges, Tinsley (1975) concludes that the “blue clay” deposits (such as those within the SVAand those within the Pressure 180/400-Foot Aquitard) are likely estuarine deposits associated
with these marine transgressions. Depositional environments and their relation to depositionalfacies are described more fully in Sections 4 and 5.

7/23/2019 Hydrostratigraphic Analysis of the Northern Salinas Valley 2004
http://slidepdf.com/reader/full/hydrostratigraphic-analysis-of-the-northern-salinas-valley-2004 33/112
Kennedy/Jenks Consultants
Final Report – Hydrostratigraphic Analysis of the Northern Salinas Valley 11p:\isg-proj\mcwra final rpt\mcwra_final_14may2004.doc
Section 3: Discussion - Pressure Subarea Hydrogeology
This section discusses the geologic setting and hydrostratigraphy of the Pressure Subarea. Abrief description of the inferred depositional genesis and how they were defined in this study forthe purpose of correlating the northern Salinas Valley stratigraphy is also presented.
3.1 Pressure Subarea Hydrostratigraphy
The hydrostratigraphic discussion of the Pressure Subarea is based on previous work and onthe cross-sections developed for this study. The cross-section interpretations depict two generalcategories of sediments within the northern Salinas Valley fill: fine-grained aquitards andcoarse-grained aquifers:
●
Clays, sandy clays, and gravelly clays are shown as aquitards;
● Sands, gravels, and sand-gravel mixtures are shown as aquifers; and lastly
● Sediments logged as gravel/clay, sand/clay, and sand/gravel/clay are interpreted toconsist of interbedded coarse- and fine-grained deposits and are included with aquifermaterials.
3.1.1 Shallow Ground Water Aquifer
A shallow ground water aquifer perched on top of or located within the SVA can be observed onmost of the cross-sections. Scattered, thin, laterally discontinuous sandy layers are common,
rarely up to 100 feet thick but typically much less. In Cross-Section G-G’ (Figure 9), a laterallyextensive but discontinuous sand unit extends from approximately 50 feet above mean sea level(MSL) to –50 feet MSL. This uppermost ground water bearing zone is referred to as the UpperPressure 180-Foot Aquifer in the Fort Ord area (see also Section 3.1.3).
3.1.2 Salinas Valley Aquitard
The SVA appears on all of the cross-sections, typically extending from the ground surface toapproximately -100 to -150 feet MSL. In Cross-Section B-B’, the SVA apparently dips to thesouth and is covered by dune sands to the southwest. In Cross-Section C-C’ the SVA alsoapparently is covered by more recent deposits to the southwest (sands recorded in well logs,not labeled on cross-section).
The SVA can be seen to thin and pinch out near the Pressure Subarea/East Side Subareaboundary in Cross-Sections D-D’, E-E’, and F-F’. The Pressure Subarea/East Side Subareaboundary is roughly the demarcation of what we infer to as the transition zone between fluvialand alluvial fan facies and they are discussed in Sections 4 and 5.
In Cross-Section G-G’, SVA apparently thins and pinches out to the southwest but clay extendsto the northeast side of the cross-section, across the Pressure/East Side (subarea) boundary.

7/23/2019 Hydrostratigraphic Analysis of the Northern Salinas Valley 2004
http://slidepdf.com/reader/full/hydrostratigraphic-analysis-of-the-northern-salinas-valley-2004 34/112
Kennedy/Jenks Consultants
Final Report – Hydrostratigraphic Analysis of the Northern Salinas Valley 12p:\isg-proj\mcwra final rpt\mcwra_final_14may2004.doc
This likely represents commingling of the SVA and distal clays associated with the alluvial fanfacies.
Cross-Sections A-A’ and G-G’ suggest the presence of two possible windows or gaps in theSVA. In Cross-Section A-A’, the clay is absent between wells APN 227021014 and 142/2E-23H04, near the intersection of Cross-Section A-A’ and Cross-Section D-D’. In Cross-SectionG-G’, the SVA is apparently absent in well 15S/3E-04T50 (near distance marker 15000). Theabsence of SVA may create locally unconfined or partially confined conditions in the Pressure180-Foot Aquifer.
3.1.3 Pressure 180-Foot Aquifer
The sand bodies in the Pressure 180-Foot Aquifer are predominantly sand and gravel depositswith subordinate sand/clay and gravel/clay components.
The depth and thickness of the Pressure 180-Foot Aquifer are variable, but generally the top isencountered at about –100 feet MSL, increasing in depth slightly from southeast near Salinas tothe northwest near the ocean. Individual sand bodies within the aquifer are typically 100 to150 feet thick, although they range from less than 50 feet thick to greater than 200 feet thickwhere the Pressure 180-Foot Aquifer and Pressure 400-Foot Aquifer appear to be in contact(see Section 3.1.4).
The shapes of the sand bodies in the Pressure 180-Foot Aquifer appear to reflect their fluvialdepositional origin. In Cross-Section C-C’ and Cross-Section D-D’ especially, the lenticularshape of the sand bodies southwest of the East Side reflects deposition in a fluvial channel. Themore laterally extensive sand units were formed by the fluvial channel migrating and shiftinglaterally through time.
This permeable zone is sometimes referred to as the Pressure Lower 180-Foot Aquifer, whichcan be considered a confined system beneath the SVA. The Pressure Upper 180-Foot Aquiferis sometimes called the uppermost-perched zone or the Shallow Ground Water aquifer (seeSection 3.1.1).
3.1.4 Pressure 180/400-Foot Aquitard
The clay aquitard separating the Pressure 180-Foot Aquifer and Pressure 400-Foot Aquifer (thePressure 180/400-Foot Aquitard) varies in composition, depth, and thickness, and may beabsent in some areas. The Pressure 180/400-Foot Aquitard is rarely as much as 200 to 250 feetthick (see well 14S/2E-12E01 at distance marker 40,000 on Cross-Section A-A’), and more
commonly 50 to 100 feet thick. Several well logs located in the southeast part of the study area(see Cross-Sections G-G’ and A-A’) show the distinct blue clay, however over most of the areathe blue clay is uncommon and the aquitard is composed mainly of sandy clay or brown clay.
3.1.4.1 Absence of Confining Clay Unit
As observed in previous reports (e.g. Todd, 1989) and noted in this study, there are places inthe northern Salinas Valley where the Pressure 180/400-Foot Aquitard is thin or absent.Locations of wells with the absence of the aquitard are depicted with red dots in Figure 10.

7/23/2019 Hydrostratigraphic Analysis of the Northern Salinas Valley 2004
http://slidepdf.com/reader/full/hydrostratigraphic-analysis-of-the-northern-salinas-valley-2004 35/112
Kennedy/Jenks Consultants
Final Report – Hydrostratigraphic Analysis of the Northern Salinas Valley 13p:\isg-proj\mcwra final rpt\mcwra_final_14may2004.doc
Possible direct communication between the Pressure 180-Foot Aquifer and Pressure 400-Foot Aquifer where this aquitard is absent can be observed on every cross-section except Cross-Section G-G’. The areas of potential hydraulic communication are discussed below.
● Northwest part of Cross-Section A-A’ and Cross-Section B-B’:
On these two cross-sections, possible communication between the Pressure 180-Foot Aquifer and Pressure 400-Foot Aquifer can be observed in approximately seven well logsfrom just west of the Salinas River channel to east of Castroville. Possible communicationbetween the aquifers is suggested by several observations:
■
A long sequence of sand and gravel without an intervening clay in Cross-Section B-B’(e.g. 14S/2E-18E01 near distance marker 10,000);
■ A mix of clay and either sand or gravel (GeoBase™ symbols sand/clay or
sand/gravel/clay) but without a distinct clay layer in Cross-Section B-B’ (e.g. 14S/2E-06J03 near distance marker 18000), possibly reflecting interbedded clay and sand orclay and gravel;
■ Thin clay layers that cannot confidently be correlated to other wells in Cross-SectionB-B’ (e.g. 13S/2E-28M02 to 13S/2E-29J01 near distance marker 30,000).
Todd (1989) also noted that the Pressure 180/400-Foot Aquitard is thin or absent nearCross-Section B-B’. As shown on Figure 10, several of the wells where interaquifercommunication may exist are located within the Pressure 400-Foot Aquifer seawaterintrusion front; it is uncertain if interaquifer communication was a factor in the seawaterintrusion front movement in this area.
● Cross-Section C-C’:
On the southwest side of Cross-Section C-C’, southwest of the Salinas River, the clayseparating the Pressure 180-Foot Aquifer and Pressure 400-Foot Aquifer appears to exist,but is thin and correlation of this clay between wells 14S/2E-21N01 and 14S/2E-21E01(between distance marker 2000 and distance marker 5000) is tenuous. The 2001 seawaterintrusion front in the Pressure 400-Foot Aquifer makes a distinct eastward extension fromMarina to this part of Cross-Section C-C’ and nearly matches the seawater intrusion front inthe Pressure 180-Foot Aquifer. It is possible that communication between the Pressure180-Foot Aquifer and Pressure 400-Foot Aquifer in this area influenced the seawaterintrusion front migration (see Sections 6.4 and 6.5).
●
Cross-Section D-D’:
Similar to Cross-Section C-C’, the Pressure 180/400-Foot Aquitard is thin or absent towardthe southwest side of the cross-section near wells 14S/2E-25D03 and 14S/2E-26J03(between distance marker 5000 and distance marker 10,000). Thin clay layers are shown inthe log for APN-14021010 (near distance marker 1500) but it is unknown if these layersextend northeast towards 14S/2E-26J03. These wells are located near the front of the 2001seawater intrusion front in the Pressure 180-Foot Aquifer.

7/23/2019 Hydrostratigraphic Analysis of the Northern Salinas Valley 2004
http://slidepdf.com/reader/full/hydrostratigraphic-analysis-of-the-northern-salinas-valley-2004 36/112
Kennedy/Jenks Consultants
Final Report – Hydrostratigraphic Analysis of the Northern Salinas Valley 14p:\isg-proj\mcwra final rpt\mcwra_final_14may2004.doc
● Cross-Section E-E’, Cross-Section F-F’, and nearby areas of Cross-Section A-A’:
In the central Pressure Subarea near the intersection of Cross-Section E-E’ and Cross-
Section F-F’ with Cross-Section A-A’, sand units of the Pressure 180-Foot Aquifer andPressure 400-Foot Aquifer appear to be in communication in a feature that may representstacked fluvial channel deposits (Well 14S/2E-29N02 to Well 14S/2E-F03, area betweendistance marker 15000 and 20,000) on Cross-Section E-E’ and Well 14S/3E-28M02 (neardistance marker 22000) on Cross-Section F-F’. Here, the bottom of the Pressure 180-Foot Aquifer is slightly deeper than typical and where intervening clay is absent, resulting in athick succession of sand and gravel from depths of approximately –100 feet MSL to-400 feet MSL. Cross-Section A-A’ in this area (drawn generally parallel to the former fluvialchannel) also suggests that clay layers are somewhat laterally discontinuous.
This paleo-channel like depositional feature cannot be traced to Cross-Section G-G’ (wherethe Pressure 180-Foot Aquifer and Pressure 400-Foot Aquifer appear to be distinct) nor to
Cross-Section D-D’, although in Cross-Section D-D’ the separation between the aquifers isthin.
3.1.5 Pressure 400-Foot Aquifer
The sand bodies in the Pressure 400-Foot Aquifer consist mainly of sand and gravel with asubordinate amount of sand and clay or gravel and clay mixtures. In general, the Pressure400-Foot Aquifer has a larger component of sand and clay or gravel and clay mixturescompared to the Pressure 180-Foot Aquifer.
The top of the Pressure 400-Foot Aquifer is typically encountered at –300 to –350 feet MSL.The thickness of this aquifer is variable but typical sand beds are 50 to 100 feet thick and can
be up to more than 200 feet thick. The sand beds are especially thick in areas where thePressure 180-Foot Aquifer and the Pressure 400-Foot Aquifer are possibly conjoined.
The Pressure 400-Foot Aquifer zone consists of a complex and variable mix of coarse- and fine-grained deposits. In general, these layers become more variable in depth and thickness andmore discontinuous from southeast to northwest, i.e. in the downstream direction. Thisvariability is markedly characteristic by comparing Cross-Section G-G’ with Cross-Section C-C’and Cross-Section B-B’, and can be observed on Cross-Section A-A’. This transition may bedue to the transition from a higher energy fluvial depositional environment near the presentlocation of the City of Salinas to a lower energy environment toward the Monterey coast.
3.1.5.1 Locations of the Thickest Sand Zones
The thickest portion of this aquifer can be traced in all the northeast-southwest cross-sections,where the thicknesses of the sand zones are somewhat evenly distributed, unlike the Pressure180-Foot Aquifer. In the southeast part of the study area, the thicker sand bodies are located inthe central parts of Cross-Sections G-G’, F-F’, and E-E’ at about the crossings of A-A’. In Cross-Sections D-D’ and C-C’, the thicker sand deposits are located on the southwest side of thecross-sections, i.e. the southwest part of the Pressure Subarea.

7/23/2019 Hydrostratigraphic Analysis of the Northern Salinas Valley 2004
http://slidepdf.com/reader/full/hydrostratigraphic-analysis-of-the-northern-salinas-valley-2004 37/112
Kennedy/Jenks Consultants
Final Report – Hydrostratigraphic Analysis of the Northern Salinas Valley 15p:\isg-proj\mcwra final rpt\mcwra_final_14may2004.doc
In Cross-Section B-B’ located in the northwest part of the study area, thick sand deposits aremore prevalent than those in sections located further southwest (C-C’ through G-G’). Unlike theother sections, the East Side Subarea is not encountered in this cross-section. Thick sections of
sand are observed in the central part of the cross-section and in the northeastern end nearCastroville, i.e. the central and eastern portions of the Pressure Subarea, respectively.
The thicker sections of the Pressure 400-Foot Aquifer located in the southwest also coincidewith areas where the Pressure 180/400-Foot Aquitard is thin or absent (see Figure 10 and thediscussion in Section 3.1.4.1). Lastly, Cross-Section A-A’ is located along the depositional axis,so that it shows the sand/clay sequences near the center of the inferred ancestral channel. Thischannel can be thought of as a high-energy fluvial depositional environment in the southeasternsection and estuarine in its northwestern section toward Monterey Bay.
3.1.6 Pressure 400-Foot/Pressure Deep Aquitard
The clay layers separating the Pressure 400-Foot Aquifer and the Pressure Deep Aquifer canbe observed in Cross-Sections B-B’, F-F’, and G-G’. In Cross-Section B-B’, the aquitardencountered in well 14S/2E-18E01 (near distance marker 10,000) extends approximately 50feet below the Pressure 400-Foot Aquifer to a gravelly layer approximately 150 feet thick; theaquitard extends approximately 650 feet to the next sandy layer. In well 14S/2E-06L01 (neardistance marker 17000), the aquitard extends approximately 750 feet below the Pressure400-Foot Aquifer to the next sandy layer. In Cross-section F-F’ and Cross-Section G-G’, theaquitard is approximately 100 to 120 feet thick.
3.2 Ground Water Elevations
Ground water elevations are monitored regularly by the Agency in the Salinas Valley inmonitoring wells and agricultural production wells. Historical ground water elevations reflectdrawdown and depressed ground water elevations during the summer irrigation season andrecovery of ground water elevations during the winter.
Construction of ground water elevation contour maps is complex and difficult because manywells are constructed with long intake screens spanning both the Pressure 180-Foot Aquifer andPressure 400-Foot Aquifer, and many wells are located in or near the border with the East SideSubarea, where the transition between the subareas is complex. Ground water elevationcontour maps used in this study are therefore not included in this report.
Data collected in 1999 from the Fort Ord area and the western Salinas Valley are presented asground water elevation contours in the Harding ESE 2001 report. Those data indicate thatground water elevations in the Pressure 180-Foot Aquifer and Pressure 400-Foot Aquifer werebelow sea level, with elevations in the Pressure 180-Foot Aquifer as low as –20.7 feet MSL nearthe Salinas River and elevations in the Pressure 400-Foot Aquifer as low as –51.4 feet MSLeast of the Salinas River (near the intersection of Cross-Section A-A’ and Cross-Section C-C’).The lower ground water elevations in the Pressure 400-Foot Aquifer indicate that a verticalhydraulic gradient downward from the Pressure 180-Foot Aquifer to the Pressure 400-Foot Aquifer exists.

7/23/2019 Hydrostratigraphic Analysis of the Northern Salinas Valley 2004
http://slidepdf.com/reader/full/hydrostratigraphic-analysis-of-the-northern-salinas-valley-2004 38/112
Kennedy/Jenks Consultants
Final Report – Hydrostratigraphic Analysis of the Northern Salinas Valley 16p:\isg-proj\mcwra final rpt\mcwra_final_14may2004.doc
The sub-sea level elevations in both the Pressure 180-Foot Aquifer and Pressure 400-Foot Aquifer have been consistent for many years, as has been the difference in elevations betweenthe two aquifers (Todd, 1989 and Harding ESE, 2001). Todd (1989) and Harding ESE (2001)
suggest that this trend indicates that although the aquitard between the two aquifers may bediscontinuous in places, the aquitard is sufficient to consistently support a vertical headdifference. The consistent sub-sea level ground water elevations in both aquifers create asituation that promotes continued seawater intrusion.

7/23/2019 Hydrostratigraphic Analysis of the Northern Salinas Valley 2004
http://slidepdf.com/reader/full/hydrostratigraphic-analysis-of-the-northern-salinas-valley-2004 39/112
Kennedy/Jenks Consultants
Final Report – Hydrostratigraphic Analysis of the Northern Salinas Valley 17p:\isg-proj\mcwra final rpt\mcwra_final_14may2004.doc
Section 4: Discussion - East Side Subarea Hydrogeology
This section discusses the geologic setting and hydrostratigraphy of the East Side Subarea. Adescription of the depositional facies and how they were defined in this study for the purpose ofcorrelating the northern Salinas Valley stratigraphy is also presented. This section contains abrief discussion of the East Side Subarea ground water.
4.1 East Side Subarea Geologic Setting
The East Side Subarea extends along the east side of the northern Salinas Valley, fromapproximately Santa Rita (approximately three miles north of Salinas) to Gonzales(approximately 16 miles south of Salinas), and is generally bounded by the foothills of theGabilan Range on the northeast and Highway 101 on the southwest (Figure 1). The East Side
Subarea is presently characterized by a series of connected alluvial fans that are built up bysmall streams draining the west side of the Gabilan Range, creating a sloping, fan-shapedtopography that is visible today.
The East Side Subarea was originally defined by DWR (1946) as one of the four areas of theSalinas Valley that were designated according to their hydrologic properties and rechargeareas. The East Side was defined as the area bounded by the Pressure Subarea on the westand the Forebay Subarea on the south, containing unconfined ground water that was recharged(under appropriate pumping conditions) by streams draining the Gabilan Range and directlyfrom precipitation during wet years. The East Side Subarea was also defined inMCFCWCD (1960) as “…a region that does not have a continuous area wide aquifer nor acontinuous good quality aquiclude.”
4.2 East Side Subarea Hydrostratigraphy
The Quaternary stratigraphy of the East Side Subarea generally consists of a poorly beddedsequence of gravel, sand, silt, sandy and gravelly clay, and clay. Typical East Side sedimentsinclude red, brown, and yellow clay, gravelly or sandy clay, as well as “seepage” (defined bywell drillers as a sandy and gravelly clay type of material through which water seeps slowly;MCFCWCD, 1960). On the outwash slopes of the present-day alluvial fans in the East SideSubarea, red and yellow clays are currently being formed in discontinuous lenses by thedecomposition of alluvial gravels (MCFCWCD, 1968). Decomposed granite is also characteristicof the East Side Subarea sediments, reflecting the granitic provenance of the Gabilan Range(Figure 11). These Quaternary sediments, interpreted as alluvial fan deposits, grade into and
interfinger with fluvial sediments deposited by the ancient Salinas River that flowednorthwestward into the Monterey Bay.
The sand and gravel beds of the East Side Subarea are generally thinner and less continuousthan in the Pressure Subarea, and generally do not correlate well between boreholes. The EastSide Subarea is difficult to correlate due to the following stratigraphic characteristics:
● Relatively thin-bedded nature of the gravel and sand;
● Discontinuity of beds in both the lateral and down-dip direction; and

7/23/2019 Hydrostratigraphic Analysis of the Northern Salinas Valley 2004
http://slidepdf.com/reader/full/hydrostratigraphic-analysis-of-the-northern-salinas-valley-2004 40/112
Kennedy/Jenks Consultants
Final Report – Hydrostratigraphic Analysis of the Northern Salinas Valley 18p:\isg-proj\mcwra final rpt\mcwra_final_14may2004.doc
● Complex erosional nature of streams feeding the alluvial fans, which results in acomplex record of sediment deposition.
Blue clay beds form the principal aquicludes and aquitards in the Pressure Subarea are rarewithin the East Side Subarea. The blue clays are highly organic, unoxidized, and containmolluscan and foraminiferal faunal assemblages that are indicative of shallow marine tobrackish water estuarine environments (Tinsley, 1975). Stratigraphic correlations completed inthis study suggest that the blue clay spread through the northern Salinas Valley and onlappedthe alluvial fans on the east side of the northern Salinas Valley. A blue clay bed onlaps andpinches out onto alluvial fan facies in the East Side Subarea on Cross-Section D-D’ (Figure 6,distance marker 31,000) and Cross-Section F-F’ (Figure 8, distance marker 40,000).The depositional evolution of blue clay beds in the East Side Subarea is discussed inSections 5.2.1 and 5.3.2.
The fluvially generated Pressure 180-Foot and Pressure 400-Foot aquifers of the Pressure
Subarea are not observed in the East Side Subarea. However, the East Side sediments can bedivided into zones that are generally time-stratigraphically equivalent to the Pressure 180-Footand Pressure 400-Foot Aquifers (dashed lines designate these zones on the stratigraphic cross-sections, Figures 3 through 9). The designation of these stratigraphic zones was utilized foranalyzing the lateral connectivity of the aquifers between the Pressure and East Side subareas,and for determining the distribution of depositional facies during the 180-Foot Aquifer “time” andthe 400-Foot Aquifer “time”.
4.3 Depositional Facies in the Pressure/East Side Transition
Zone
This section provides a brief overview of the sedimentary depositional facies encountered in thetransition zone between the Pressure Subarea and the East Side Subarea. This section alsodescribes how these facies were identified in the stratigraphic correlations completed as part ofthis study.
4.3.1 Alluvial Fan Facies
Alluvial fans form at the base of a mountain front where emerging mountain streams transportand deposit sediments (Figure 11). As distributary streams and channels that drain themountains shift laterally through time, a fan-shaped sedimentary deposit (alluvial fan) is formed.Depositionally down dip from the mountain front, alluvial fans commonly grade into a fluvialsystem flowing longitudinally down a valley oriented parallel to the adjacent mountain range.
Alluvial fans can also build out into estuarine environments (as well as marine, lacustrine, andeolian environments).
Alluvial fan deposits commonly consist of a mixture of partly sorted streamflow deposits andunsorted debris-flow and mudflow deposits. A rapid downfan decrease in clast size and overallsediment grain size is also characteristic of alluvial fans. Sediments within a fan complex aregenerally oxidized, resulting in the characteristic sediment colors of red, brown, orange, andyellow.

7/23/2019 Hydrostratigraphic Analysis of the Northern Salinas Valley 2004
http://slidepdf.com/reader/full/hydrostratigraphic-analysis-of-the-northern-salinas-valley-2004 41/112
Kennedy/Jenks Consultants
Final Report – Hydrostratigraphic Analysis of the Northern Salinas Valley 19p:\isg-proj\mcwra final rpt\mcwra_final_14may2004.doc
The internal stratigraphic geometry of alluvial fan systems can be complex. Fans can prograderapidly following uplift of the source area, resulting in proximal facies overlying more distalfacies. Lateral shifting of distributary channels within the fans results in the coalescing of
adjacent alluvial fans (Figure 11), creating complex facies relationships. Where the distal faciesof the alluvial fan interfingers with a fluvial system (Figure 11), there may be complex faciesrelationships recording both depositional and erosional activities by both the alluvial fan systemand the fluvial system.
Alluvial fans can be divided into a proximal fan facies, deposited near the sediment source area(e.g., along the front of a mountain range), and a distal alluvial fan or alluvial plain facies,deposited more distally from the source and down dip from the proximal facies (Figure 11).
4.3.1.1 Proximal Alluvial Fan Facies
Proximal alluvial fan facies commonly consist of poorly sorted and generally angular clasts,
reflecting the proximity to the sediment source area. In the stratigraphic correlations completedas part of this study, the proximal alluvial fan facies were distinguished by the predominance ofcoarse-grained deposits (e.g., coarse gravel and sand). In addition, the thickness of thesecoarse-grained units thins in the down dip or southwest direction.
4.3.1.2 Alluvial Plain Facies
Alluvial plain facies are characterized by sedimentary deposits that are better sorted than theproximal alluvial fan facies, as evidenced in cross-sections (e.g., Cross-Section D-D’, Figure 6,distance markers 27,000 to 35,000 for Pressure 400-Foot Aquifer “time”; and Cross-SectionG-G’, Figure 9, distance marker 35,000). The alluvial plain facies generally lack poorly sortedand chaotic mudflow, debris-flow, and landslide deposits, and instead are characterized by
predominantly fine-grained, clay-rich deposits.
Within the study area, the transition from alluvial fan facies to alluvial plain facies is definedwhere the gravel and sand deposits transition into dominantly red, brown, and yellow clayfacies, as illustrated in Figure 11, and observed in Cross-Section E-E’ (Figure 7, distancemarkers 35,000 to 38,000 during Pressure 400-Foot Aquifer “time”).
4.3.2 Fluvial Facies
4.3.2.1 Fluvial Channel Facies
Gravel and coarse sand are transported as bedload by high-velocity flows within fluvial
channels. As the flow velocity decreases and/or the channel migrates laterally, coarse sand androunded gravel are deposited as channel-lag deposits.
Within the study area, thick sequences of gravel and sand deposits are interpreted as stackedand coalescing fluvial channel sediments deposited by the active river channel that meanderedback and forth across the Salinas Valley (Figure 11). This facies is common in the PressureSubarea.

7/23/2019 Hydrostratigraphic Analysis of the Northern Salinas Valley 2004
http://slidepdf.com/reader/full/hydrostratigraphic-analysis-of-the-northern-salinas-valley-2004 42/112
Kennedy/Jenks Consultants
Final Report – Hydrostratigraphic Analysis of the Northern Salinas Valley 20p:\isg-proj\mcwra final rpt\mcwra_final_14may2004.doc
4.3.2.2 Fluvial Overbank Facies
The overbank areas of the fluvial floodplain are characterized by the vertical accretion of fine-
grained sediment (Figure 11). In the Pressure Subarea, brown or yellow clay or gravelly claydeposits that correlate laterally with coarser grained fluvial channel deposits are characteristic ofoverbank facies. In the Pressure/East Side transition region, oxidized brown clays of the fluvialfloodplain or overbank facies can grade laterally into oxidized clays of the alluvial plain facies.
Note that as an active fluvial channel migrates laterally back and forth across a river valley,previously deposited fine-grained sediments of the floodplain can be eroded and redeposited,resulting in a complex mixture of both fine- and coarse-grained facies (Figure 11).
4.4 East Side Subarea Ground Water
4.4.1 Aquifer Zones As reported in SGD (1993), previous studies of the East Side Subarea (e.g., MCFCWCD, 1960;SGD, 1990; Hall, 1992; and J.M. Montgomery Engineers, 1993) have presented some evidencefor the designation of East Side shallow and East Side deep zones within the East SideSubarea, perhaps reflecting the changing climatic conditions that resulted in changes insediment deposition. However, as noted by SGD (1993), and confirmed in this study, noevidence exists for a discrete confining layer that defines a deep and a shallow zone. SGD(1993) states that it is more likely that confinement increases with depth as a result of theinterbedded nature of the stratigraphy.
4.4.2 Ground Water Recharge
Ground water recharge in the East Side Subarea occurs through percolation from small streamsthat flow from the Gabilan Range, and to a lesser degree, directly from precipitation during thewet years (DWR, 1946). Surface water is apparently slowly absorbed in the East Side Subarea,because pumping drawdown is large and fairly rapid (MCFCWCD, 1960).
Ground water from the East Side Subarea probably would migrate slowly into the Pressureaquifer in several places if the water table in the East Side Subarea were higher than thehydrostatic pressure head of the adjacent Pressure Subarea (MCFCWCD, 1960, p. 9). The EastSide Subarea appears to have been one of the natural sources of recharge to the adjacentPressure Subarea and ground water levels historically could have been higher than those in thePressure Subarea. However, in recent years, pumping overdraft in the East Side Subarea hascaused an apparent reversal of the ground water flow from the Pressure Subarea into the East
Side Subarea.
4.4.3 Well Yields
Water well yields in the East Side Subarea are extremely variable, reflecting the variability of thestratigraphy. The aquifers generally are unconfined, but as reported in DWR (1946), somepockets of water-bearing gravels are under slight pressure due to partial local confinement.Heavy yielding wells with slight drawdowns are generally obtained in these pockets of water-

7/23/2019 Hydrostratigraphic Analysis of the Northern Salinas Valley 2004
http://slidepdf.com/reader/full/hydrostratigraphic-analysis-of-the-northern-salinas-valley-2004 43/112
Kennedy/Jenks Consultants
Final Report – Hydrostratigraphic Analysis of the Northern Salinas Valley 21p:\isg-proj\mcwra final rpt\mcwra_final_14may2004.doc
bearing gravels, and yields in excess of 200 gallons per minute (gpm) per foot of drawdown arequite common. However, DWR (1946) also reports that there are some wells with low yield,which apparently were drilled in an alluvial plain (“…wells of low yield… are largely confined to
strips of overlap in the outwash of deltas of various tributaries on the east side of the valley.”[DWR, 1946, p. 15]).
4.4.4 Water Quality
The 500 milligrams per liter chloride contour line is used as a guide to identify and track theprogression of the seawater intrusion front. As shown on Figure 10, the seawater intrusionfronts in both the Pressure 180-Foot and Pressure 400-Foot Aquifers have not reached the EastSide Subarea.

7/23/2019 Hydrostratigraphic Analysis of the Northern Salinas Valley 2004
http://slidepdf.com/reader/full/hydrostratigraphic-analysis-of-the-northern-salinas-valley-2004 44/112
Kennedy/Jenks Consultants
Final Report – Hydrostratigraphic Analysis of the Northern Salinas Valley 22p:\isg-proj\mcwra final rpt\mcwra_final_14may2004.doc
Section 5: Transition Between Pressure and East Side
Subareas
This section defines the boundary between the Pressure and East Side Subareas, anddiscusses the types of stratigraphic relationships between the fluvial and alluvial fan faciesobserved in the transition zone. A generalized depositional model for the northern SalinasValley is presented in this section. In addition, this section discusses how the depositional originof the stratigraphic facies controls the hydraulic connectivity across the Pressure/East Sideboundary.
5.1 Boundary Between the Pressure and East Side Subareas
5.1.1 Boundary as Defined by Earlier Studies
The boundaries between subareas of the Salinas Valley were originally defined by DWR(1946, p. 12) in Bulletin 52 based on the source of ground water recharge for each subarea.However, Bulletin 52 also stated that the boundary between the Pressure Subarea and the EastSide Subarea was defined by the southerly limit of influence of the alluvial fan systemsoriginating in the eastern and northern watersheds. In Bulletin 52 (DWR, 1946), this limit wasbased on the distribution of blue clay in the drillers’ logs (with the blue clay considered to beindicative of estuarine depositional environments).
The boundaries between the subareas were slightly modified later by MCFCWCD (1960), andthe boundary of the East Side Subarea was modified in the area near Gonzales (approximately16 miles south of Salinas). The currently adopted boundary between the East Side andPressure Subareas as defined in the published literature (SGD, 1993) is shown in Figure 1.
5.1.2 Boundary as Defined in the Study
Rather than defining the boundary between the Pressure Subarea and the East Side Subareaby the distribution of blue clays as was done by DWR (1946), the boundary between thePressure and East Side Subareas is defined in this study by the transition from predominantlyfluvial facies (as defined in Section 4.3.2) to predominantly alluvial fan facies (as defined inSection 4.3.1). Specifically, the zone between the northeast extent of the fluvial channel faciesand the southwest extent of the alluvial fan facies (i.e., the interfingering fluvial floodplain andalluvial plain area) is designated as the transition zone between the Pressure and East Side
Subareas (Figure 11).
With this methodology put forth in defining the transition zone, we have proposed the locationand extent of the Pressure/East Side transition zone during deposition of both the Pressure180-Foot Aquifer (red hatched area) and the Pressure 400-Foot Aquifer (green hatched area),as shown in Figure 12.

7/23/2019 Hydrostratigraphic Analysis of the Northern Salinas Valley 2004
http://slidepdf.com/reader/full/hydrostratigraphic-analysis-of-the-northern-salinas-valley-2004 45/112
Kennedy/Jenks Consultants
Final Report – Hydrostratigraphic Analysis of the Northern Salinas Valley 23p:\isg-proj\mcwra final rpt\mcwra_final_14may2004.doc
5.2 Transition Zone Between Pressure and East Side
Subareas – Stratigraphic Characteristics
5.2.1 Stratigraphic Facies Scenarios
The stratigraphic characteristics of the transition zone are variable due to the differentstratigraphic relationships between fluvial and alluvial facies, as observed in the cross-sections.Three different stratigraphic facies scenarios were observed in the transition zone within thestudy area:
1. Permeable facies (i.e., gravel and sand deposits) of the Pressure Subarea are in contactwith permeable facies of the East Side Subarea (Figure 13, Scenarios 1A and 1B);
2. Impermeable or low permeability (i.e., clay) facies of the Pressure Subarea are incontact with impermeable or low permeability facies of the East Side Subarea(Figure 14, Scenario 2); and
3. Impermeable blue clay facies of the Pressure Subarea are in contact with permeable(i.e., gravel and sand) facies of the East Side Subarea (Figure 15, Scenarios 3Aand 3B).
Facies Scenario 1A occurs where the meandering of the Salinas River within the northernSalinas Valley has caused the river to incise the alluvial fan facies (Figure 13). This faciesscenario is observed in the Pressure 180-Foot Aquifer on Cross-Section D-D’ (Figure 6) atdistance markers 27,000 to 31,000. Alternatively, the facies geometry on Cross-Section D-D’could be interpreted to represent facies scenario 1B.
Facies Scenario 1B occurs where the alluvial fan system has prograded into the fluvial system(Figure 13). Scenario 1B would result in gravel and sand deposits of the fluvial system being indirect contact with the gravel and sand deposits of the alluvial fan system, which could allow theflow of ground water across the Pressure/East Side boundary. This facies scenario is observedto occur on Cross-Section E-E’ (Figure 7, distance markers 33,000 to 37,000; note thatdecomposed granite from the alluvial fan facies progrades out over fluvial channel facies). Asnoted above, facies scenario 1B could also be interpreted on Cross-Section D-D’ (Figure 6) atdistance markers 27,000 to 31,000.
Facies Scenario 2 occurs where the main active channel of the ancient Salinas River isseparated from the coarse-grained alluvial fan facies by both fluvial overbank/floodplaindeposits and by alluvial plain (i.e., distal alluvial fan) deposits (Figure 14). In this situation, the
clay-rich overbank facies are in contact with the clay-rich alluvial plain facies, creating a barrierto the lateral flow of ground water from the Pressure Subarea to the East Side Subarea. Thisfacies relationship is observed to occur within both the Pressure 180-Foot Aquifer and Pressure400-Foot Aquifer on Cross-Sections C-C’ (Figure 5, distance markers 25,000 to 30,000), F-F’(Figure 8, distance markers 33,000 to 36,000), and G-G’ (Figure 9, distance markers 32,000 to35,000). Facies scenario 2 occurs only within the Pressure 400-Foot Aquifer on Cross-SectionsD-D’ (Figure 6, distance markers 27,000 to 35,000) and E-E’ (Figure 7, distance markers 34,000to 36,000). However, it should be noted that interbedded sand/gravel/clay or sandy clay of thePressure Subarea most likely is in lateral contact with gravelly clay and sandy clay of the East

7/23/2019 Hydrostratigraphic Analysis of the Northern Salinas Valley 2004
http://slidepdf.com/reader/full/hydrostratigraphic-analysis-of-the-northern-salinas-valley-2004 46/112
Kennedy/Jenks Consultants
Final Report – Hydrostratigraphic Analysis of the Northern Salinas Valley 24p:\isg-proj\mcwra final rpt\mcwra_final_14may2004.doc
Side Subarea on Cross-Section E-E’ within the Pressure 400-Foot Aquifer (Figure 7, distancemarkers 34,000 to 37,000), and on Cross-Section C-C’ in both the Pressure 180-Foot andPressure 400-Foot Aquifers (Figure 5, distance markers 25,000 to 30,000). This facies
relationship may create only a restriction, rather than a barrier, to ground water flow across thePressure/East Side boundary.
Facies Scenario 3A is observed due to a relative sea level rise, which resulted in the “drowning”of the northern Salinas Valley (Figure 15). The subsequent development of estuarine orshallow-marine environments in the northern Salinas Valley resulted in the deposition oforganic-rich blue clay under anoxic or suboxic submarine conditions.
Facies Scenario 3B represents one possible facies relationship resulting from a relative rise insea level. In facies scenario 3B, blue clay onlaps both alluvial plain and alluvial fan facies(Figure 15). Blue clay facies that onlap alluvial facies deposited during the Pressure 180-Foot Aquifer “time” are observed on Cross-Section D-D’ (Figure 6, distance markers 29,000 to
32,000) and Cross-Section F-F’ (Figure 8, distance markers 39,000 to 44,000).
Another possible facies relationship in the transition zone (not illustrated in Figure 15) is that thealluvial fans prograded into an estuarine environment, resulting in alluvial gravel and sandinterfingering with estuarine mud (i.e., blue clay). This facies scenario would reduce the lateralflow of ground water across the Pressure/East Side boundary, and where the blue clay faciescaps a permeable facies, the vertical flow of water would also be impeded.
Blue clay facies do not appear to have been deposited during the Pressure 400-Foot Aquifer“time” in the East Side Subarea; alternatively, blue clay facies may have been deposited, butwere subsequently eroded.
5.2.2 Characteristics of the Pressure 180-Foot and Pressure
400-Foot Aquifers Near the Transition Zone
The Pressure 180-Foot Aquifer and the Pressure 400-Foot Aquifer are not in verticalcommunication with one another in the Pressure Subarea adjacent to the transition zone.However, as described in Section 3.1.4.1, there are locations within the Pressure Subareawhere discontinuities in the Pressure 180/400-Foot Aquitard, as depicted in the cross-sections,suggest that the two aquifers could be in hydraulic communication (Figure 10).
The fluvial channel deposits of the Pressure 180-Foot Aquifer appear to be more segmentedand lenticular than the Pressure 400-Foot Aquifer. This characteristic is most evident on Cross-Sections C-C’ (Figure 5, distance markers 7,000 to 26,000) and E-E’ (Figure 7, distance
markers 25,000 to 34,000). The isolated fluvial channel deposits of the Pressure 180-Foot Aquifer (versus the relatively thick and widespread sand bodies of the Pressure 400-Foot Aquifer) suggest that the Salinas River did not meander back and forth across the valley floorduring deposition of the Pressure 180-Foot Aquifer as frequently as it did during deposition ofthe Pressure 400-Foot Aquifer.
The fluvial channel deposits of the Pressure 180-Foot and Pressure 400-Foot Aquifers areseparated from the alluvial fan facies by a sandy clay and gravelly clay facies on Cross-Sections

7/23/2019 Hydrostratigraphic Analysis of the Northern Salinas Valley 2004
http://slidepdf.com/reader/full/hydrostratigraphic-analysis-of-the-northern-salinas-valley-2004 47/112
Kennedy/Jenks Consultants
Final Report – Hydrostratigraphic Analysis of the Northern Salinas Valley 25p:\isg-proj\mcwra final rpt\mcwra_final_14may2004.doc
C-C’ (Figure 5, distance markers 25,000 to 30,000) and E-E’ (Figure 7, distance markers 34,000to 37,000). These semipermeable facies may restrict but not totally stop the flow of groundwater across the Pressure/East Side boundary.
5.3 Depositional Model
5.3.1 Sediment Sources in the Northern Salinas Valley
The northern Salinas Valley during the Quaternary period was dominated by two sedimentsources: (1) alluvial fans building out along the borders of the Salinas Valley, and (2) the SalinasRiver system. Alluvial fans developed along the northeastern boundary of the Salinas Valley asa result of both uplift of the Gabilan Range and the discharge of streams into the valley. In theEast Side Subarea, during Pleistocene to Holocene time when the Pressure 180-Foot andPressure 400-Foot Aquifers were being deposited in the Pressure Subarea1, alluvial fans
building out from the Gabilan Range graded into the ancient Salinas River.
The ancient Salinas River flowed northwestward parallel to the Gabilan Range. Predominantlygravel and sand were deposited along the river channel, and finer sediments such as silt andclay were deposited as overbank deposits on the floodplain during flooding events. The ancientSalinas River frequently meandered back and forth across the valley floor, cutting through oldsedimentary beds and depositing new fluvial sediments. This meandering activity appears tohave been more common during deposition of the Pressure 400-Foot Aquifer than during thePressure 180-Foot Aquifer, as suggested by the relatively continuous sand bodies of thePressure 400-Foot Aquifer. This depositional process was punctuated by torrential floods thatcarved out new channels and deposited poorly sorted mixtures of boulders, gravel, sand, silt,and clay. The resulting fluvial sedimentary successions, comprising the Pressure 400-Foot and
Pressure 180-Foot Aquifers, are complex sequences of gravel and sand containingdiscontinuous beds of silt and clay.
5.3.2 Glacio-Eustatic Control of Depositional Facies
As noted by Tinsley (1975), the Salinas River eroded sediments and alluviated its channel inresponse to repeated glacio-eustatic sea level changes during the Quaternary period. Eustaticlowering of sea level during the onset of late Wisconsin (Pleistocene) glaciation caused theSalinas River and its tributaries to incise the sediments that filled the Salinas Valley. As theglaciers subsequently diminished and melted, the rate of sea level rise exceeded the rate atwhich sediment was deposited in the Salinas Valley. This relative rise in sea level caused asubstantial portion of the northern Salinas Valley to be “drowned”. It was during these marine
transgressions that blue clay, characteristic of the northern Salinas Valley aquitards, wasdeposited in estuarine or shallow-marine environments.
1 The age of the Pressure 180-Foot Aquifer has been estimated as Pleistocene to Holocene (Greene,1970; Manning, 1963), and the age of the Pressure 400-Foot Aquifer has been estimated as Plio-Pleistocene (Greene, 1970) or mid-Pleistocene (Manning, 1963).

7/23/2019 Hydrostratigraphic Analysis of the Northern Salinas Valley 2004
http://slidepdf.com/reader/full/hydrostratigraphic-analysis-of-the-northern-salinas-valley-2004 48/112
Kennedy/Jenks Consultants
Final Report – Hydrostratigraphic Analysis of the Northern Salinas Valley 26p:\isg-proj\mcwra final rpt\mcwra_final_14may2004.doc
During the Holocene, shallow submarine portions of the Salinas Valley possibly resembled themodern-day Elkhorn Slough or Tomales Bay. Confirmed evidence of estuarine conditions hasbeen found as far inland as Salinas (Tinsley, 1975), and stratigraphic correlations completed as
part of this study confirm that blue clay facies onlap the alluvial fan facies near northeasternSalinas. Figure 16 shows the northeasternmost extent of the blue clay facies above thePressure 180-Foot Aquifer within the study area. As suggested by Tinsley (1975), fresh watermarsh environments and/or possibly estuarine environments may have existed between Salinasand Gonzales (approximately 16 miles south of Salinas, i.e., outside of the study area),accounting for the less continuous aquiclude strata that are located there.
5.3.3 Interaction Between Fluvial and Alluvial Fan Depositional
Systems
The interaction between the alluvial fans and the Salinas fluvial system through time has
created an interesting and complex stratigraphic relationship along the boundary between thePressure Subarea and the East Side Subarea. In Tinsley’s (1975) study of alluvial fanmorphology within the northern Salinas Valley, he noted that in numerous locations, the toes ofmodern-day alluvial fans were eroded and sheared off by the lateral meandering of the SalinasRiver. Erosion of the toe of an alluvial fan would trigger the distributary drainages to react to alocally lowered base level by incising the alluvial fan. This event, in turn, would cause thedistributary channel to deposit new fans that prograde across the fluvial floodplain. Aggradationby the Salinas River would result in the burial of distal portions of alluvial fans by floodplaindeposits. These processes are occurring today, and most likely also occurred in the past. Thus,the Quaternary stratigraphic succession along the Pressure/East Side boundary records acomplex pattern of erosion and deposition and is characterized by intertonguing fluvial faciesdeposited by the Salinas River and alluvial fan facies deposited by distributary streams.
5.3.4 Sediment Provenance and the Southward Progression of
Alluvial Fans
The provenances of the clasts within the fluvial and alluvial fan gravel deposits have been usedto develop a conceptual model for deposition of the Salinas Valley fill (Tinsley, 1975). Alluvialfan deposits on the east side of the Salinas Valley contain clasts derived exclusively fromSalinian basement terranes in the Gabilan Range (similarly, alluvial fan deposits of the westside of the Salinas Valley contain clasts derived exclusively from Salinian basement terranes inthe Sierra de Salinas). Decomposed granite, which provides evidence of this graniticprovenance, is characteristic of the interpreted East Side alluvial fan deposits. Decomposedgranite is noted in logs included in Cross-Sections E-E’ (Figure 7, well 14S/03E-09P03, distance
marker 33,500) and F-F’ (Figure 8, well 14S03E02L50, distance marker 46,500) and has alsobeen noted in several drillers’ logs. In comparison, the provenance of the Salinas River depositsis predominantly Tertiary sedimentary rocks. The fluvial deposits commonly contain clasts ofsiliceous shale and porcelaneous chert and “chalk rock” from the Monterey Shale. In contrast,the alluvial fan deposits are notably void of clasts derived from Tertiary sedimentary rocks.
The lithology of clasts records the progression of the alluvial fans to the south and thedisplacement of the Salinas River to the south through time. According to SGD (1993), lithologicdata from wells in the Pressure Subarea indicate that both the Pressure 400-Foot Aquifer and

7/23/2019 Hydrostratigraphic Analysis of the Northern Salinas Valley 2004
http://slidepdf.com/reader/full/hydrostratigraphic-analysis-of-the-northern-salinas-valley-2004 49/112
Kennedy/Jenks Consultants
Final Report – Hydrostratigraphic Analysis of the Northern Salinas Valley 27p:\isg-proj\mcwra final rpt\mcwra_final_14may2004.doc
the Pressure 180-Foot Aquifer contain significant amounts of porcelaneous chert clasts derivedfrom the Monterey Shale. However, wells in the East Side Subarea (as defined by SGD [1993])contained porcelaneous chert clasts derived from the Monterey Shale in the Pressure 400-Foot
Aquifer, but Monterey Shale clasts were absent from the Pressure 180-Foot Aquifer. Thisrecords the progression of the alluvial fans to the south and the displacement of the SalinasRiver to the south through time.
The stratigraphic correlations completed as a part of this study also record the southwardprogression of the alluvial fan facies through time. The alluvial fan facies (as defined inSection 4.3.1) were correlated on the stratigraphic cross-sections, and the distribution of thealluvial fan facies was mapped for both Pressure 180-Foot and Pressure 400-Foot Aquifer“time” (Figure 16). The red-hatched pattern shows the extent of the alluvial fan facies duringdeposition of the Pressure 400-Foot Aquifer, and the green-hatched pattern represents theextent of the alluvial fan facies during deposition of the Pressure 180-Foot Aquifer (Figure 16). As inferred from the stratigraphic interpretations on Cross-Sections C-C’ through G-G’, the
alluvial fans deposited during Pressure 180-Foot Aquifer “time” extended (progressed) farthersouthwest than the alluvial fans deposited during Pressure 400-Foot Aquifer “time”.
5.3.5 Distribution of Depositional Facies
The fluvial, alluvial plain, and alluvial fan facies were interpreted and correlated on thestratigraphic cross-sections as part of this study. The distribution of these facies for bothPressure 180-Foot Aquifer “time” and Pressure 400-Foot Aquifer “time” are shown on Figures17 and 18, respectively.
During deposition of the Pressure 180-Foot Aquifer, the alluvial fan facies appears to haveprograded southwestward relative to where the alluvial fan facies were located during Pressure
400-Foot Aquifer “time” (Figure 17). The alluvial plain facies is relatively narrower than duringdeposition of the Pressure 400-Foot Aquifer, as shown on the facies distribution map(Figure 17). The fluvial channel may have incised the toes of the alluvial fan system, or thealluvial fan system may have prograded into the river system during the Pressure 180-Foot Aquifer “time”, as inferred from Cross-Sections D-D’ (Figure 6, distance markers 27,000 to31,000) and E-E’ (Figure 7, distance markers 33,000 to 37,000). The fluvial system that formedthe Pressure 180-Foot Aquifer is characterized by more persistent overbank areas than duringdeposition of the Pressure 400-Foot Aquifer. The overbank areas (characterized by clay faciesin cross-sections) are depicted as elongate bands of fluvial overbank deposits oriented parallelto the ancestral flow direction (NW) of the fluvial system (Figure 17). In addition, the sandbodies within the Pressure 180-Foot Aquifer near the transition zone are more segmented thanin the Pressure 400-Foot Aquifer, particularly on Cross-Sections C-C’ (Figure 5, distance
markers 25,000 to 26,000) and E-E’ (Figure 7, distance markers 25,000 to 34,000).
During deposition of the Pressure 400-Foot Aquifer, the alluvial fan facies were separated fromthe active fluvial channel facies by a relatively wide area comprised of alluvial plain and fluvialoverbank facies (Figure 18). The fluvial system was characterized by fluvial channels thatappear to have actively meandered back and forth across the river valley, depositingpredominantly coarse-grained sediments. Overbank areas that persisted throughout thedeposition of the entire Pressure 400-Foot Aquifer are present in limited areas of the easternpart of the study area (Figure 18).

7/23/2019 Hydrostratigraphic Analysis of the Northern Salinas Valley 2004
http://slidepdf.com/reader/full/hydrostratigraphic-analysis-of-the-northern-salinas-valley-2004 50/112
Kennedy/Jenks Consultants
Final Report – Hydrostratigraphic Analysis of the Northern Salinas Valley 28p:\isg-proj\mcwra final rpt\mcwra_final_14may2004.doc
5.4 Hydraulic Connectivity of East Side Subarea and
Transition Zone
This section describes the control that the depositional environments and depositional facieshave on the hydraulic connectivity of the Pressure and East Side Subareas. The hydraulicproperties of the transition zone are controlled by the interface between the fluvial and alluvialfan facies. This section also discusses the horizontal and vertical connectivity of the aquiferzones and possible ground water flow pathways, as controlled by sedimentary facies.
5.4.1 Depositional Facies Control of Hydraulic Connectivity
The transition zone marks the region where the relatively well defined and correlatablestratigraphy of the Pressure Subarea changes to the less predictable and more discontinuousstratigraphy of the East Side Subarea. Depositional environments control the sedimentary
facies, which, in turn, control the hydraulic properties of the two subareas.
The Pressure Subarea, in general, is dominated by relatively thick and continuous, permeablesand and gravel deposits of fluvial origin. In contrast, the East Side Subarea is dominated bydiscontinuous and lenticular sand and gravel beds and abundant clay deposited by alluvial fans.The sedimentary facies characteristics of the East Side Subarea would suggest that the wells inthis area would be lower yielding and that the hydraulic connectivity would be reduced relativeto the Pressure Subarea. This would also suggest that seawater intrusion would occur at asubstantially slower rate in the East Side Subarea than has been observed in the PressureSubarea. The depositional environments, sedimentary characteristics, and hydraulic propertiesof the Pressure and East Side Subareas are summarized in Table 2.
As stated by SGD (1993), sediments comprising the water-bearing zones of the East SideSubarea likely have hydraulic conductivities that are at least an order of magnitude lower thanthe sediments comprising the Pressure 180-Foot Aquifer zone of the Pressure Subarea. Asestimated by SGD (1993, p. 34), even under a gradient of twice that which drove the seawaterintrusion front to its current location, ground water velocities would be approximately 5 timesslower within the East Side Subarea than in the Pressure Subarea as a result of the reducedhydraulic connectivity.
The quality of aquicludes and aquifers has been defined by MCFCWCD (1960) based on thesedimentary facies comprising these aquicludes and aquifers. These descriptions are usefulwhen predicting hydraulic conductivities based on information presented in the stratigraphiccross-sections and in drillers’ logs. The categories of aquicludes and aquifers as defined byMCFCWCD (1960) are as follows:
● Impermeable – Good Aquicludes: Blue clay, gray clay, white clay, adobe
● Nearly Impermeable – Poor Aquicludes: Yellow, red, brown clay
● Semipermeable – Poor Aquicludes: Blue sandy clay, blue gravely clay, silty clays

7/23/2019 Hydrostratigraphic Analysis of the Northern Salinas Valley 2004
http://slidepdf.com/reader/full/hydrostratigraphic-analysis-of-the-northern-salinas-valley-2004 51/112
Kennedy/Jenks Consultants
Final Report – Hydrostratigraphic Analysis of the Northern Salinas Valley 29p:\isg-proj\mcwra final rpt\mcwra_final_14may2004.doc
● Semipermeable – Poor Aquifers: Yellow, red, or brown sandy or gravelly clays;sediment; “seepage”2, silt, silty sand
●
Permeable – Good Aquifers: Sand, sand & gravel, gravel, cobbles
5.4.2 Hydraulic Properties of Transition Zone
The hydraulic properties vary along the length of the boundary between the Pressure and EastSide Subareas based on the geometries of the intertonguing facies between the Pressure andEast Side Subareas. The three stratigraphic facies scenarios observed in the transition zoneand the resulting hydraulic properties are:
1. Permeable fluvial facies of the Pressure Subarea are in contact with permeable alluvialfan facies of the East Side Subarea: This situation creates hydraulic connectivity acrossthe Pressure/East Side boundary.
2. Impermeable or low permeability fluvial overbank facies of the Pressure Subarea are incontact with impermeable or low permeability alluvial plain facies of the East SideSubarea: This situation restricts the flow of ground water across the boundary.
3. Impermeable blue clay facies of the Pressure Subarea are in contact with permeablealluvial fan facies of the East Side Subarea: This impedes or stops the flow of groundwater across the boundary and/or in a vertical direction (although it should be noted thatthis scenario only affects the uppermost part of the Pressure 180-Foot Aquifer).
5.4.3 Possible Areas of Horizontal and Vertical Hydraulic
Connectivity
5.4.3.1 Horizontal Flow Across Pressure/East Side Boundary
Evidence for hydraulic connectivity across the Pressure/East Side boundary was noted by DWR(1946, p. 78): “Contours of ground water elevations indicate the main tongue of gravel depositsin several of the East Side Area deltas may be interconnected with the water-bearing formationsin the Pressure Area.”
The work completed in this study suggests that the potential exists for hydraulic connectivitythrough permeable sediments across the Pressure/East Side boundary within the Pressure180-Foot Aquifer in the vicinity of Cross-Sections D-D’ (Figure 6, distance markers 26,000 to32,000) and E-E’ (Figure 7, distance markers 33,000 to 37,000). The plan view of these areas is
illustrated in Figure 17.
There is also the potential for hydraulic flow across the boundary through semipermeablesediments within the Pressure 180-Foot and Pressure 400-Foot Aquifers in the vicinity of Cross-Section C-C’ (Figure 5, distance markers 25,000 to 30,000), and within the Pressure 400-Foot
2 “Seepage” is defined by well drillers as a sandy and gravelly clay material through which water seeps
slowly (MCFCWCD, 1960).

7/23/2019 Hydrostratigraphic Analysis of the Northern Salinas Valley 2004
http://slidepdf.com/reader/full/hydrostratigraphic-analysis-of-the-northern-salinas-valley-2004 52/112
Kennedy/Jenks Consultants
Final Report – Hydrostratigraphic Analysis of the Northern Salinas Valley 30p:\isg-proj\mcwra final rpt\mcwra_final_14may2004.doc
Aquifer of Cross-Section E-E’ (Figure 7, distance markers 34,000 to 37,000). The plan view ofthese areas are illustrated in Figures 17 and 18
5.4.3.2 Vertical Flow within the East Side Subarea
The East Side Subarea does not have a discrete confining layer that separates the East Sideshallow zone from the East Side deeper zone. Even so, the East Side Subarea, in general, doesnot appear to be characterized by high vertical hydraulic connectivity; the gravel and sand bedsare lenticular and thin rapidly in the down dip direction. In addition, sandy clay, gravelly clay,and interbedded sand and clay are common sedimentary facies within the East Side Subarea,which MCFCWCD (1960) defines as semipermeable deposits or “poor aquifers”.
5.4.3.3 Horizontal Flow within the Pressure Subarea
The fluvial facies were mapped for both the Pressure 180-Foot Aquifer (Figure 17) and the
Pressure 400-Foot Aquifer (Figure 18). These sand-rich facies are elongate in the northwest-southeast direction, parallel to the long axis of the Pressure Subarea. The sand-rich fairways,shown in yellow on Figures 17 and 18, represent areas of relatively high lateral hydraulicconnectivity and therefore represent the potential preferential pathways where seawaterintrusion might occur.
As shown in Figure 17 and discussed in Section 5.2.2, the Pressure 180-Foot Aquifer is moresegmented than the Pressure 400-Foot Aquifer, and is characterized by fluvial areas thatpersisted during the deposition of the Pressure 180-Foot Aquifer. Because these clay-richoverbank deposits are less permeable than the sand-rich fluvial channel deposits, theseelongate overbank areas would be expected to direct or focus the flow of ground water (andtherefore the migration of seawater) within the Pressure 180-Foot Aquifer. Accordingly,
Figure 17 shows that the 2001 seawater intrusion front in the Pressure 180-Foot Aquiferappears to conform to the boundary of the clay-rich facies of the fluvial overbank materials.

7/23/2019 Hydrostratigraphic Analysis of the Northern Salinas Valley 2004
http://slidepdf.com/reader/full/hydrostratigraphic-analysis-of-the-northern-salinas-valley-2004 53/112
Kennedy/Jenks Consultants
Final Report – Hydrostratigraphic Analysis of the Northern Salinas Valley 31p:\isg-proj\mcwra final rpt\mcwra_final_14may2004.doc
Section 6: Seawater Intrusion
The goal of this study in terms of assessing the conditions of seawater intrusion is to develop atime line of estimated impact by a seawater front to identified benchmarks such as the City ofSalinas and the East Side pumping wells. The 500 milligrams per liter (mg/L) chloride level isused as an indicator of degradation of ground water and it is promulgated as a SecondaryDrinking Water Standard upper limit for chloride. The Agency also uses this concentration todemarcate the landward edge of the seawater intrusion front where denser seawater hasintruded ground water.
The Agency samples dedicated monitoring and agricultural production wells each summer forchloride and other inorganic constituents in documenting the advancement of seawaterintrusion. The seawater intrusion fronts shown in Figures 19 and 20, as represented by the500 mg/L chloride contours for the Pressure 180-Foot and Pressure 400-Foot Aquifers, were
provided by the Agency and are based on results from the August 2001 sampling event, i.e., themost recent data available during this study.
6.1 Mechanisms of Seawater Intrusion
The core condition for seawater intrusion in this area is that the aquifers are in direct hydrauliccontact with the Monterey Bay. The secondary condition for seawater mixing in the Pressure180-Foot and Pressure 400-Foot fresh water aquifers is that ground water levels in bothaquifers are below sea level and the normal landward to seaward gradient had been reversedas seaward to landward in the Pressure 180-Foot Aquifer zone since the 1930s.
6.1.1 Three Seawater Intrusion Mechanisms in the Northern Salinas
Valley
The pattern of encroaching seawater in ground water zones in the northern Salinas Valley asrepresented by 500 mg/L contours is the result of three primary seawater intrusion mechanismsthat have been studied by numerous investigators in this area:
1. Commonly referred to as regional seawater intrusion, seawater infiltrates the Pressure180-Foot and Pressure 400-Foot Aquifers through the submarine outcrops of aquifersoffshore of Monterey Bay. As a result of ground water pumping in both aquifers, thewater table in the Pressure 180-Foot Aquifer and the piezometric surface of the Pressure400-Foot Aquifer have dropped below sea level (Section 3.2) thereby developing a
landward hydraulic gradient inducing seawater to invade the fresh water aquifers(e.g. DWR [1973] and Todd [1989]).
2. In the case of interaquifer seawater intrusion, the aquitard between the Pressure180-Foot Aquifer and Pressure 400-Foot Aquifer is thin to discontinuous in localizedareas and water in the aquifers can mix. This can allow seawater-blended ground waterin the Pressure 180-Aquifer to migrate downward into the Pressure 400-Foot Aquifer(e.g. DWR [1973]). This downward migration is due to ground water pumping in bothaquifers, which produced a downward gradient between the two aquifers. The head

7/23/2019 Hydrostratigraphic Analysis of the Northern Salinas Valley 2004
http://slidepdf.com/reader/full/hydrostratigraphic-analysis-of-the-northern-salinas-valley-2004 54/112
Kennedy/Jenks Consultants
Final Report – Hydrostratigraphic Analysis of the Northern Salinas Valley 32p:\isg-proj\mcwra final rpt\mcwra_final_14may2004.doc
difference was reported in 1989 to be about 30 to 40 feet (Todd, 1989; details presentedin Sections 3.2 and 6.6 of this report).
3. Poorly constructed wells or wells with long screen sections with improper seals can alsoresult in seawater intrusion. Some wells are screened in both the Pressure 180-Foot Aquifer and Pressure 400-Foot Aquifer (see Thorup [1976]), drawing ground water fromboth aquifers and thereby providing a conduit between aquifers (e.g. Todd [1988]).
This study focuses on the above mechanisms 1 and 2, which are related to hydrostratigraphicattributes in the Pressure 180-Foot and Pressure 400-Foot Aquifers that may allow regional andinteraquifer seawater intrusion. Communication between aquifers due to poor well constructionis not discussed in this report.
6.2 Methods of Assessing the Rate of Seawater Intrusion
In this study we assess the expansion of intruded areas based on documented delineations ofthe chloride concentrations through time as contours of the front have been published by theMonterey County Flood Control & Water Conservation District (MCFCWCD) now the MontereyCounty Water Resources Agency since 1944. We place emphasis on the cumulative rates ofintrusion as estimated separately for the Pressure 180-Foot and Pressure 400-Foot Aquifers inthis study, in Todd (1989), and others (including the Agency). The rationale behind the use ofcumulative rates is that the mapped front can occasionally jump ahead in a particular direction,as discussed in SGD (1993). Occasional jumps in intruded areas are as likely due to addition ofmonitoring wells or data points landward of the intrusion front. Although the expansion ofintrusion area(s) of seawater is based on data, the suggested increased rate of expansion maynot be realistic. We demonstrate in this study (Table 3) that there is no consistent trend in thedata to support the use of “periodically higher” seawater intrusion rates to estimate long-term
movements of seawater in the Pressure Subarea aquifers.
Table 3 is a database of seawater intrusion areas as published by the Agency in the form ofcontours for periods of time (e.g., 1944 to 1965). Intrusion distances are measured distance inthe GIS along a particular path line (6 paths in the 180-Foot and 5 paths in the Pressure 400-Foot Aquifer). Three different seawater intrusion rates (feet per year, ft/yr) are calculated bydividing these distances (feet) with the periods (years):
1. Periodic rate – based on the number of years and within a given period;
2. Intermediate rate – an average of all rates in what is considered as “pre-1993” for thePressure 180-Foot Aquifer and “pre-1997 for the Pressure 400-Foot Aquifer. Intrusionrates for years after these periods and considered as “recent intrusion periods” are alsolisted.
3. Cumulative rate – an average of all intrusion rates for a particular path.
We believe that the rate of expansion of intruded seawater can accelerate in a certain directiondue to increased pumping or short-term drops in ground water levels landward of the frontduring prolonged droughts. Likewise, a short-term reduction of intruding seawater can occur inwet years as ground water levels are correspondingly higher, like in 1995 (Agency, 1997).However, there is no historical information that suggests that the cumulative rate of seawater

7/23/2019 Hydrostratigraphic Analysis of the Northern Salinas Valley 2004
http://slidepdf.com/reader/full/hydrostratigraphic-analysis-of-the-northern-salinas-valley-2004 55/112
Kennedy/Jenks Consultants
Final Report – Hydrostratigraphic Analysis of the Northern Salinas Valley 33p:\isg-proj\mcwra final rpt\mcwra_final_14may2004.doc
intrusion in the northward and southeastward directions have increased. In fact, the “averaged”cumulative rate of seawater intrusion has been approximately 500 ft/yr for the Pressure 180-Foot Aquifer and about 450 ft/yr for the Pressure 400-Foot Aquifer.
We take the following steps to achieve our goal of developing a time line to characterize theexpansion of seawater intrusion:
1. Use the Ghyben-Herzberg Principle as a generalized model for regionally intrudingseawater in the coastal areas;
2. Use historic chloride levels to estimate the rate at which seawater has moved in alandward direction; and
3. Qualitatively estimate the combined effects of regional intrusion in both aquifers withinteraquifer flow as postulated in localized areas within the Pressure Subarea
(Section 3.1.4).
6.2.1 The Ghyben-Herzberg Principle
The bodies of fresh water in the Pressure 180-Foot Aquifer and the confined ground water in thePressure 400-Foot Aquifer conform to Archimedes’ law of buoyancy. This law implies that freshwater in the Pressure 180-Foot Aquifer will be displaced by its own weight of the medium inwhich it floats. The ground water within the Pressure 400-Foot Aquifer, which is confined by theoverlying aquitard, will be displaced landward to areas of lower piezometric heads such asthose areas within the ground water pumping trough beneath with the City of Salinas. Thisdisplacement mechanism between denser seawater and more buoyant fresh water is commonlyreferred to as the Ghyben-Herzberg Principle (Freeze and Cherry, 1979).
According to the Ghyben-Herzberg principle, coastal aquifers with ground water levels belowsea level will be intruded by denser seawater. This means that ground water in most of the EastSide and Pressure subareas west of the City of Salinas, where the water table is down to 20 to80 feet below sea level (Agency 1997) could have elevated levels of chloride exceeding500 mg/L – as a result of seawater blending with fresh water. However, this situation is clearlynot readily apparent as mapped intrusion fronts for both aquifers are located seaward of the Cityof Salinas (Figure 10). This is because ground water is flowing towards the coast and there issufficient ground water storage in both aquifers to maintain a regional seaward gradient. This isparticularly so for ground water upgradient or east of the City of Salinas.
6.2.2 Mapping of Chloride Front
A more representative characterization of seawater intrusion is the use of empirical rateestimations to evaluate landward increases in chloride levels with time. Specifically, wecalculate rates of advances of the 500 mg/L chloride contours by dividing the maximum lineardistance (feet) that the 500 mg/L front has moved by the corresponding time period ofadvancement (years).
7/23/2019 Hydrostratigraphic Analysis of the Northern Salinas Valley 2004
http://slidepdf.com/reader/full/hydrostratigraphic-analysis-of-the-northern-salinas-valley-2004 56/112
Kennedy/Jenks Consultants
Final Report – Hydrostratigraphic Analysis of the Northern Salinas Valley 34p:\isg-proj\mcwra final rpt\mcwra_final_14may2004.doc
6.3 Regional Seawater Intrusion
The submarine outcrop of the Pressure 180-Foot Aquifer and Pressure 400-Foot Aquifer
offshore of the Monterey coast was presented in Greene (1970) and analyzed in Todd (1989).Submarine outcrops are the main portals for seawater entry into the Pressure 180-Foot Aquiferand Pressure 400-Foot Aquifer. This mechanism is also referred to as regional seawaterintrusion.
The bathymetric findings presented in Greene (1970) indicate that deltaic sediments extendoffshore from the mouth of the Salinas River; these sediments are several hundred feet thicknear the shore and thin to the west. Greene (1970) correlates the offshore delta sediments withthe onshore Valley Fill deposits (in which he includes the Pressure 180-Foot Aquifer). Greene(1970) indicates that the Aromas Sand and Paso Robles Formation are seismicallyindistinguishable from each other, and are exposed on the floor of Monterey Bay west of theSalinas River delta deposits and also exposed for a small distance along the south side of
Monterey Canyon. Both Greene (1970) and Todd (1989) correlate the submarine deltaicdeposits with the Pressure 180-Foot Aquifer. Greene (1970) does not portray the outcrop of thePressure 400-Foot Aquifer on the floor of Monterey Bay, but Todd (1989) portrays the entiresubmarine outcrop of the combined Aromas Sand and Paso Robles Formation as correlatingwith and communicating with the Pressure 400-Foot Aquifer.
The area of the submarine exposure of the Pressure 180-Foot Aquifer as shown in Todd (1989)is approximately 7.0 square miles, and the submarine exposure of the Pressure 400-Foot Aquifer is approximately 9.1 square miles. The extent of the Pressure 180-Foot Aquifer asshown in Greene (1970) is approximately 6.7 square miles, and the exposure of the combined Aromas Sand and Paso Robles Formation is approximately 10.3 square miles.
Regional seawater intrusion (Mechanism 1) is discussed below in Sections 6.4 and 6.5 for thePressure 180-Foot and Pressure 400-Foot aquifers, respectively. The interaquifer seawaterintrusion (Mechanism 2) for the Pressure 180/400 Aquitard is discussed in Section 6.6.
6.4 Regional Seawater Intrusion in the Pressure 180-Foot
Aquifer
Seawater intrusion has been known to occur in the Pressure 180-Foot Aquifer since the 1930sand has been documented beginning in 1946 (DWR, 1946). Historical tracking of the seawaterintrusion fronts as depicted in Figure 19 indicates that seawater has been migrating from alongthe coast line between Castroville in the north and Fort Ord in the south down the center of thePressure Subarea. Todd (1989) estimated that the seawater intrusion front advanced landwardat about 425 ft/yr in the west to east and east to southeast directions. The rate is about 514 ft/yrin the northwest to southeast direction.
An abundance of chloride data in ground water samples taken from 1944 to the present hasallowed this study to methodically define compartments or “corridors” of seawater movementand then calculate the variable rates of seawater movements within each corridor. Path-lines inFigure 19 depict seawater travel paths in six corridors and rates of seawater movement arecalculated along each path. These corridors are not meant to distinguish hydrostratigraphic

7/23/2019 Hydrostratigraphic Analysis of the Northern Salinas Valley 2004
http://slidepdf.com/reader/full/hydrostratigraphic-analysis-of-the-northern-salinas-valley-2004 57/112
Kennedy/Jenks Consultants
Final Report – Hydrostratigraphic Analysis of the Northern Salinas Valley 35p:\isg-proj\mcwra final rpt\mcwra_final_14may2004.doc
conditions but merely to serve as a spatial statistical means to: 1) calculate linear rates of travel,2) compare and explain differences in rates, and 3) derive a future-time-table that predicts when“separate” seawater fronts to reach certain benchmark areas along their travel paths.
Table 3 presents detailed calculations of rates of seawater intrusions as delineated bysuccessive 500 mg/L contours in Figure 19. The Pressure 180-Foot Aquifer calculations are onthe left side of Table 3 and intrusion rates (ft/yr) are summarized below.
Summary of Seawater Intrusion Rates (ft/yr) – Pressure 180-Foot Aquifer
Path # 1 2 3 4 5 6
1944 -1993 253 374 566 458 477 612
1993 – 2001 0 0 188 958 733 0
Cumulative 202 299 440 673 587 205
Discussion
Paths 4 and 5 in Figure 19 are considered the axes of seawater intrusion in this aquifer zone.Path 4 has the highest rate of movement (673 ft/yr) and it is the most direct path of seawaterencroachment on the City of Salinas. Path 5 showing the second highest rate of seawatermovement (587 ft/yr) has a southwesterly direction towards Blanco Road and the Salinas River.Compared to other paths of seawater intrusion, Paths 4 and 5 have an apparent jump inseawater advancement (2,000 and 1,000 ft/yr, respectively) in the three years from 1997 to1999 (Table 3). However this apparent acceleration was not sustained and rates returned backto the typical 300 to 400 ft/yr after 1999 (Table 3).
Paths 1, 2, and 3 represent seawater advances towards Castroville and the East Side Subarea.These paths possess slower rates of intrusion (202 to 440 ft/yr) and are clearly defined bycontours showing pointed lobes directed toward the north and northeast (e.g. Path 2, 1985 andPath 3, 1993 intruded areas). Path 3 which points more towards the East Side Subarea shows aperiod of “apparent” accelerated advances from 1985 to 1993. Paths 1 and 2 do not suggestperiods of accelerated advances.
The outline of the Pressure 180-Foot intrusion front indicates that the northeast edge of the frontparallels the fluvial overbank facies near the East Side Subarea (Figure 19). These fluvialoverbank materials are fine-grained and serve as a semipermeable barrier of flow from thePressure to the East Side subareas. Ground water gradients in this area suggest flow from thePressure to the East Side subarea. However, it is not suggestive in Figure 19 that the seawaterintrusion front as defined by the 500 mg/L mixing with ground water has migrated across to theEast Side Subarea.
The center lobes of the main seawater front exhibit bifurcation patterns (Path 4 area, Figure 19)as the successive chloride fronts (contours) intersect the elongate sliver of fluvial overbankmaterials. Specifically, the 1993, 1997, and 1999 contours are slightly bowed where theyencounter the fluvial overbank facies, suggesting a slight retardation in the advancement of theseawater intrusion front. On the other hand, the contours on either side of the overbanksliver/lens are lobate suggesting a relatively higher rate of intrusion. This characteristic of the

7/23/2019 Hydrostratigraphic Analysis of the Northern Salinas Valley 2004
http://slidepdf.com/reader/full/hydrostratigraphic-analysis-of-the-northern-salinas-valley-2004 58/112
Kennedy/Jenks Consultants
Final Report – Hydrostratigraphic Analysis of the Northern Salinas Valley 36p:\isg-proj\mcwra final rpt\mcwra_final_14may2004.doc
main front persists only in the area of the overbank lens and as the front advanced further to thesoutheast and away from the overbank materials as characterized by post 1999 data that the2001 front assumes a more rounded “nose” pattern without the bifurcation.
The leading edge of the seawater intrusion front in this aquifer is 11,000 feet or about 2 milesfrom production wells (T14S, R3E, Sections 20 & 29) in the City of Salinas. The main path ofintrusion in the Pressure 180-Foot Aquifer indicates a rate of horizontal migration of 673 ft/yr.We then predict that seawater will impact production wells in the City in about 14 to 16 years.
6.5 Regional Seawater Intrusion in the Pressure 400-Foot
Aquifer
The advancement of the seawater intrusion front in the Pressure 400-Foot Aquifer through 2001is shown in Figure 20. These delineations of intruded areas are also presented in Todd 1989
and in the Fort Ord and western Salinas Valley area in Harding ESE (2001). The area of theseawater intrusion and the shape of the front are more irregular than the Pressure 180-Foot Aquifer (Figure 19), although the migration rate within the Pressure 400-Foot Aquifer is slowerbut comparable (See Table 3, summary data below, and in Todd [1989]).
Discussion
A distinct lobe of the seawater intrusion front in the Pressure 400-Foot Aquifer extends fromMarina to wells 14S/2E-21N01, 14S/2E-21E01, and 14S/2E-21F02 (Figure 20, Path 4). According to Harding ESE (2001), that lobe advanced nearly one mile between 1997 and 1999(Table 3, Path 4 – 1997 to 1999). The seawater intrusion front in the Pressure 180-Foot Aquiferreached this same area around 1997.
The wells 14S/2E-21N01 and 14S/2E-21E01 were constructed in the mid-1990s, and areconstructed in the Pressure 400-Foot Aquifer and sealed through the Pressure 180-Foot Aquiferand higher zones, so Harding ESE (2001) does not consider that improper well construction ledto cross-contamination of seawater from the Pressure 180-Foot Aquifer to the Pressure400-Foot Aquifer.
These three wells are located at the southwest end of Cross-Section C-C’, where a possiblestratigraphic connection between the Pressure 180-Foot Aquifer and Pressure 400-Foot Aquiferwas observed (Figure 20, red dotted wells). Interaquifer communication may have been a factorin the rapid advance, as discussed in the previous Section 6.4.
The seawater intrusion rate as mapped by the chloride front for this same area in 2001 suggeststhat the advancement has slowed or halted (Table 3); such that, no advancing distance wasinferred for the years 2000 and 2001. The resultant aggregate seawater intrusion rate is about578 ft/yr (summary data below). This rate is the highest inferred from the five seawater travelpaths in the Pressure 400-Foot Aquifer. It is slower than the maximum rate in the Pressure180-Foot zone (673 ft/yr) but comparable.

7/23/2019 Hydrostratigraphic Analysis of the Northern Salinas Valley 2004
http://slidepdf.com/reader/full/hydrostratigraphic-analysis-of-the-northern-salinas-valley-2004 59/112
Kennedy/Jenks Consultants
Final Report – Hydrostratigraphic Analysis of the Northern Salinas Valley 37p:\isg-proj\mcwra final rpt\mcwra_final_14may2004.doc
Summary of Seawater Intrusion Rates (ft/yr) – Pressure 400-Foot Aquifer
Path # 1 2 3 4 5
1944 -1995 299 442 322 297 570
1995 – 2001 650 0 607 1,000 0
Cumulative 416 354 436 578 285
The seawater intrusion area expanded to Well 14S/02E-16G01 along Path 3 in years 2000 and2001 (Figure 20). This expansion over 11 years (Table 3) indicates a reduction of intrusion rate(214 ft/yr) back to the typical values of 200 to 300 ft/yr.
The leading edge of the seawater intrusion front in this aquifer is 28,000 feet (about 5 miles)from production wells (T14S, R3E, Sections 20 & 29) in the City of Salinas. It is unlikely thatdirectly intruded seawater in the Pressure 400-Foot Aquifer from its submarine outcrops will
reach the City of Salinas in the near future. At the rate of 578 ft/yr along Path 4 (the most directpath, Figure 20) to the City of Salinas, it would take an estimated 49 years for the seawater toreach wells in the City.
6.6 Seawater Intrusion through Natural Aquitard Leakage
As described in Sections 2.4.4 and 3.1.4, the Pressure 180/400-Foot Aquitard varies inthickness and is very thin or absent in areas near the coast. Potential communication betweenthe Pressure 180-Foot Aquifer and the Pressure 400-Foot Aquifer is of concern due to thepotential for mixing of seawater-impacted ground water from the Pressure 180-Foot Aquifer touncontaminated portions of the Pressure 400-Foot Aquifer.
Historically, ground water elevations in the Pressure 180-Foot Aquifer have been higher (up to40 plus feet higher) than the piezometric surface of the Pressure 400-Foot Aquifer (Todd, 1989;Harding ESE, 2001). Such a downward hydraulic gradient would bring about ground watermovement from the Pressure 180-Foot Aquifer to the Pressure 400-Foot Aquifer. Interaquifer orcross-aquifer contamination is considered to be a significant localized seawater encroachmentthreat to the current water quality of the Pressure 400-Foot Aquifer for this area. As discussed inSection 3.1.4.1, thin to absent confining clay is observed in portions of six of the seven cross-sections (all but G-G’, Figure 10).
Based on lithology depicted in the cross-sections and stratigraphic facies discussed in Sections3 and 4, we conclude that there are localized areas where the aquitard is thin to absent(Figure 10). Data do not support the resemblance of spatially persistent paleo-channels that
could produce thin to absent clay layers due to “scouring” during deposition of channel deposits.The most notable thinning of the 180/400-Foot Aquitard can be observed in the subsurfaceareas of the intersections between Cross-Sections A-A’ with E-E’, F-F’, and G-G’ (see reddotted wells in Figure 10) and correlations in cross-sections (Figures 7 through 9). Thisparticular area of aquitard thinning cannot be traced beyond well 14S/03E-33Q01 on thenorthwest side of Cross-section G-G’.
Two probable scenarios of interaquifer flow is observed in this study; 1) spilling of degradedPressure 180-Foot ground water into the Pressure 400-Foot zone; and 2) slow downward

7/23/2019 Hydrostratigraphic Analysis of the Northern Salinas Valley 2004
http://slidepdf.com/reader/full/hydrostratigraphic-analysis-of-the-northern-salinas-valley-2004 60/112
Kennedy/Jenks Consultants
Final Report – Hydrostratigraphic Analysis of the Northern Salinas Valley 38p:\isg-proj\mcwra final rpt\mcwra_final_14may2004.doc
movement of Pressure 180-Foot ground water through sufficiently thin clay layers of theaquitard into the deeper Pressure 400-Foot zone. Rates for either scenario are estimated to befrom 0.1 to 0.25 foot per day dependent of the percentage of fine-grained materials within the
interaquifer zones where the aquitard is either discontinuous or very thin (details in Section 6.8).Hence we estimate that seawater reaching the Pressure 180-Foot Aquifer can impact thePressure 400-Foot Aquifer ground water in one to four years over an interaquifer distance(i.e., the total thickness of the aquitard) of 100 to 500 vertical feet.
6.7 Hydraulic Communication between the Pressure and East
Subareas
The stratigraphic analysis in this study supports previous findings that the sedimentarycharacteristics of the aquifer of the East Side Subarea – although heterogeneous and much lesscorrelatable than the Pressure Subarea - are spatially consistent along the length of the
Pressure/East Side boundary. The consistency of stratigraphic facies are apparent in Cross-Sections C-C’, D-D’, E-E’, F-F’ and G-G’ starting from and northeast of wells 14S/02E-02C03,14S/03E-07A01, -09P03, -22D01, and well 14S03E22J50, respectively. These wells andtransition zones northeast of them are again presented within the transition zone hatches forboth aquifers in Figure 12. We agree with previous studies that the hydraulic conductivitiescorresponding to the East Side sedimentary facies are at least an order of magnitude lower thanthose of the aquifers in the Pressure Subarea.
We note that ground water flow direction is from the Pressure Subarea to the East SideSubarea east of the City of Salinas and along the transition zone (Agency 1997). The waterlevels in the Pressure 180-Foot Aquifer and the Shallow East Side Aquifer range from -20 to-70 feet MSL, respectively.
Water levels in the Pressure 400-Foot Aquifer and the Deep East Side Aquifer range from -20 to-60 feet MSL, respectively (Agency 1997). The stratigraphic cross-sections show evidence ofhydraulic communications between these subareas, as discussed in Section 5.4.3.1. Thesesemipermeable and permeable zones of possible flow between the Pressure and East Side aredepicted in Figures 19 and 20.
Despite the above noted gradient of flow into the East Side Subarea, it is our opinion thatdenser saltwater/fresh water mix will not readily flow into the East Side Subarea aquifers, giventhe aquifer materials of much lower permeabilities in the East Side Subarea. The fact that theedge of the seawater intrusion front is following along the length of the clay-rich overbank faciesalso supports our conclusion (Figure 19). It is our opinion that the seawater front in the Pressure
180-Foot Aquifer will most likely follow the same path that it is currently taking, and will notbreach the overbank facies and reach the areas where permeable facies of the PressureSubarea are in communication with the permeable facies of the East Side Subarea (i.e., whereCross-Sections D-D’ and E-E’ intersect the transition zone (Figure 19).
Lastly, the mostly fine-grained materials in stratigraphic facies (Section 4.2) depicted in theCross-Sections C-C’ through G-G’ of the East Side Subarea do not support a significantcomponent of vertical flow. The likelihood of downward movement of blended seawater/groundwater in the transition zone and in the East Side Subarea is considered low. Hence, the

7/23/2019 Hydrostratigraphic Analysis of the Northern Salinas Valley 2004
http://slidepdf.com/reader/full/hydrostratigraphic-analysis-of-the-northern-salinas-valley-2004 61/112
Kennedy/Jenks Consultants
Final Report – Hydrostratigraphic Analysis of the Northern Salinas Valley 39p:\isg-proj\mcwra final rpt\mcwra_final_14may2004.doc
postulated “return flow” scenario is unlikely. The return flow scenario is seawater in the Pressure180-Foot Aquifer flowing into the East Side aquifers, migrating downward in the East Sideaquifer, and eventually spilling back out into the Pressure 400-Foot Aquifer. This scenario is
unlikely or at least the process would take a very long time.
6.8 Estimated Rates of Seawater Intrusion and Impacts to
Water Supply Wells
The 2001 seawater front in the Pressure 180-Foot Aquifer is about 11,000 feet, or about twomiles, from major production wells (T14S, R3E, Section 20 & 29) in the City of Salinas (Figure19). Utilizing the two main routes of seawater migration as defined by Paths 4 and 5 (primarilyPath 4) in Figure 19, we predict that the seawater intrusion front (500 mg/L) in the Pressure180-Foot Aquifer will impact production wells in the City in about 14 to 16 years from the year2001 at a horizontal migration rate of 673 ft/yr.
The front along Path 5 is currently 16,000 feet from the southern part of the City of Salinas. Thissoutheastern advancement of seawater suggests an arrival time of 27 years at a horizontal rateof 587 ft/yr. These estimates assume that the current ground water elevations for the Pressure180-Foot Aquifer are maintained and that the downward hydraulic gradient with the loweraquifer also does not change appreciably. We note that the rate of advancement could increaseas seawater approaches the City of Salinas where ground water gradients increase due topumping.
The travel-time for vertical interaquifer migration of seawater from the Pressure 180-Foot to thePressure 400-Foot Aquifer is much less than the horizontal migration. The vertical rate ofmigration from the Pressure 180-Foot Aquifer to the Pressure 400-Foot Aquifer is defined as
Darcy’s seepage velocity (i.e., linear velocity) of ground water flow. An aggregate verticalseepage rate of 32 ft/yr was estimated for silty sand with a typical hydraulic conductivity of0.26 ft/day, an effective formation porosity of 30 percent, and a vertical gradient of 0.1 ft/ftbetween the two aquifers. This means that seawater reaching areas of potential interaquifer flowin the Pressure 180-Foot Aquifer (Figures 19 and 20, red dotted wells) can impact the Pressure400-Foot Aquifer in just an additional one to six years depending on the thickness of theaquitard.
With the above, we view that the predicted horizontal seawater intrusion front arrival times atproduction wells in the Pressure 180-Foot Aquifer is more significant than the verticalmigrations, because: 1) the former must take place before the onset of interaquifer flow and 2)the range of vertical travel time [one to six years] is less important than determining the lateral
rates of seawater movements. The much longer travel path and travel time of horizontaladvancement over vertical migration of seawater - which has much shorter travel paths of about200 to 500 vertical feet of interaquifer distance - suggests that the monitoring program shouldemphasize detection of chloride ions advancing horizontally within each aquifer. We thenconclude that the main mechanism of seawater impact of production wells in the Pressure400-Foot Aquifer involves the combination of regional intrusion into the Pressure 180-Foot Aquifer and the interaquifer flows as blended seawater/fresh water in this zone move down intothe former through gaps in the aquitard (Sections 3.1.4 and 6.6).

7/23/2019 Hydrostratigraphic Analysis of the Northern Salinas Valley 2004
http://slidepdf.com/reader/full/hydrostratigraphic-analysis-of-the-northern-salinas-valley-2004 62/112
Kennedy/Jenks Consultants
Final Report – Hydrostratigraphic Analysis of the Northern Salinas Valley 40p:\isg-proj\mcwra final rpt\mcwra_final_14may2004.doc
The 2001 seawater front in the Pressure 180-Foot Aquifer is about 14,000 feet, or about twoand a half miles, from the major East Side Subarea production wells in Santa Rita (T14S, R3E,Sections 15 and 16). Utilizing the main route of seawater migration as defined by Path 3
(Figure 19), we predict that seawater can impact production wells in this area at the earliest inabout 33 years and utilizing a horizontal migration rate of 440 ft/yr. However, results presentedin Sections 6.7 and 4.4 do not suggest that the East Side Subarea would be impacted byseawater intrusion in the near future and possibly not at all because of much lower permeabilityaquifer materials in the East Side slowing flows from the Pressure to the East Side subarea.
7/23/2019 Hydrostratigraphic Analysis of the Northern Salinas Valley 2004
http://slidepdf.com/reader/full/hydrostratigraphic-analysis-of-the-northern-salinas-valley-2004 63/112
Kennedy/Jenks Consultants
Final Report – Hydrostratigraphic Analysis of the Northern Salinas Valley 41p:\isg-proj\mcwra final rpt\mcwra_final_14may2004.doc
Section 7: Conclusions
Stratigraphic characteristics of the aquifers, updated interpretations of the ancestral depositionalenvironments, and estimates of seawater intrusion rates are the focus of this study of thenorthern Salinas Valley hydrostratigraphy. Over 65 documents were reviewed as part of theproject scope, and these relevant and significant findings by previous investigators wereincorporated into this study.
With the use of a 3-D geographic information system (GIS) and a database of over 700 wells,the result is a three-dimensional (3-D) conceptual model of the interrelated ancestral fluvial andalluvial fan depositional environments that make up the present day ground water bearing zonesknown as the Pressure 180-Foot Aquifer and the Pressure 400-Foot Aquifer. This depositionalmodel forms the basis for predicting seawater pathways and for estimating seawater intrusionrates.
7.1 Pressure Subarea Hydrostratigraphy
Interpretations of seven geologic cross-sections depict two general categories of sedimentswithin the northern Salinas Valley fill: fine-grained aquitards and coarse-grained aquifers. Claysto gravelly clays are classified as aquitards and sands to sand-gravel mixtures are considered tobe aquifer materials. Cross-section interpretations corroborate previous findings of theconfiguration and occurrences of a shallow ground water aquifer perched on top of or locatedwithin the SVA. The cross-section interpretations also verify that the tops of the Pressure180-Foot and 400-Foot aquifers are generally encountered at -100 feet and -300 feet MSL,respectively. The prominent clay layer, commonly referred to as the Pressure 180/400-Foot
Aquitard, is also observed in most of the cross-sections constructed for this study.
The shapes of the sand bodies in the Pressure 180-Foot Aquifer appear to reflect their fluvialdepositional origin. That is, the lenticular shapes of the sand bodies observed in cross-sectionsin the Pressure Subarea reflect deposition in a fluvial channel. The more laterally extensivesand units were formed by the fluvial channel meandering and shifting laterally through time.
In general, the Pressure 400-Foot Aquifer has a larger component of sand and gravel than thePressure 180-Foot Aquifer, and the sand bodies are more laterally continuous than in thePressure 180-Foot Aquifer. The more continuous nature of the Pressure 400-Foot Aquifer isinterpreted to be the result of frequent meandering of the ancestral Salinas River across theriver valley, which resulted in the widespread deposition of sand and gravel. This aquifer zone ismore complex than the Pressure 180-Foot Aquifer, with a variable mix of coarse- and fine-grained deposits that become more variable in depth and thickness and more discontinuousfrom southeast to northwest (i.e. in the downstream direction). This spatial transition is likely theremnants of a higher-energy fluvial depositional environment near the present location of theCity of Salinas to a lower energy environment toward the Monterey coast.
Localized areas where the Pressure 180/400-Foot Aquitard is thin or absent have beenobserved in cross-sections and mapped in plan view and these areas are discussed in Section3.1.4. Areas where this aquitard are absent and where possible direct communication can occur

7/23/2019 Hydrostratigraphic Analysis of the Northern Salinas Valley 2004
http://slidepdf.com/reader/full/hydrostratigraphic-analysis-of-the-northern-salinas-valley-2004 64/112
Kennedy/Jenks Consultants
Final Report – Hydrostratigraphic Analysis of the Northern Salinas Valley 42p:\isg-proj\mcwra final rpt\mcwra_final_14may2004.doc
between the Pressure 180-Foot Aquifer and Pressure 400-Foot Aquifer is observed on portionsof every cross-section except Cross-Section G-G’. Interaquifer impact is considered to be asignificant localized seawater encroachment threat to the current water quality of the Pressure
400-Foot Aquifer for the northern Salinas Valley area.
The most notable area of discontinuities in the aquitard is in the vicinity of Township 14S, Range3E, Sections 20, 29, and 30. In general, we conclude that there are localized areas of aquitardthinning and absence (Figure 10). Data do not support the resemblance of a spatiallycontinuous paleo-channel.
7.2 East Side Subarea and Transition Zone Hydrostratigraphy
The transition zone or boundary between the Pressure and East Side Subareas is defined inthis study by the transition from predominantly fluvial facies to predominantly alluvial fan facies.By characterizing the sedimentary facies and stratigraphic architecture of the transition zone, wehave filled in the missing link between the Pressure and East Side Subarea hydrogeology anddeveloped models of the paleo-depositional environments.
The fluvially generated Pressure 180-Foot and Pressure 400-Foot Aquifers of the PressureSubarea are not observed in the East Side Subarea. The sand and gravel beds of the East SideSubarea are generally thinner and less continuous than in the Pressure Subarea. This studycorroborates previous investigations that the East Side stratigraphy does not correlate wellbetween boreholes. We conclude and agree with other investigators that the gravel and sanddeposits represent complex remnants of streams feeding the alluvial fans, which resulted in acomplex record of sediment deposition and erosion.
Blue clay beds form the principal aquicludes and aquitards in the Pressure Subarea, are rarely
observed within the East Side Subarea. Correlations completed in this study suggest that theblue clay spreads through the northern Salinas Valley and onlapped the alluvial fans on the eastside of the Valley.
The sedimentary facies characteristics of the East Side Subarea suggest that the wells in thisarea would have lower yields, and that the hydraulic conductivities are at least an order ofmagnitude lower than the sediments comprising the Pressure 180-Foot Aquifer zone of thePressure Subarea. We also postulate that seawater intrusion would occur at a substantiallyslower rate in the East Side Subarea than has been observed in the Pressure Subarea.
7.3 Regional Seawater Intrusion
The first condition for seawater intrusion in the northern Salinas Valley area is that the aquifersare in direct hydraulic contact between the aquifers and the sea. Accordingly, there evidence ofsubmarine outcrops for both aquifers in the northwest end of Cross-Section A-A’. Thesecondary condition for seawater mixing or intrusion in the fresh water aquifers is that groundwater levels in both aquifers are below sea level with a developing landward ground watergradient recorded since the 1930s.

7/23/2019 Hydrostratigraphic Analysis of the Northern Salinas Valley 2004
http://slidepdf.com/reader/full/hydrostratigraphic-analysis-of-the-northern-salinas-valley-2004 65/112
Kennedy/Jenks Consultants
Final Report – Hydrostratigraphic Analysis of the Northern Salinas Valley 43p:\isg-proj\mcwra final rpt\mcwra_final_14may2004.doc
The Pressure 180-Foot seawater intrusion front noticeably follows the trend of the fluvialchannel facies, and is confined by the band of the less permeable overbank facies (Figure 19).These fluvial overbank deposits are fine grained and serve as a semipermeable barrier of flow
from the Pressure to the East Side subarea (Section 5). Ground water gradients in this areasuggest a potential for flow from the Pressure to the East Side subarea. However, we concludethat the seawater intrusion front has not migrated across to the East Side Subarea based onchloride concentrations. We note that the water levels have risen in the CSIP service area andthat the corresponding changes in hydraulic gradient in this specific area have not beenaccounted for in this analysis.
The 2001 seawater front in the Pressure 180-Foot Aquifer is about two miles from potable watersupply wells (T14S, R3E, Section 20 & 29) in the City of Salinas (Figure 19). We predict thatseawater in the Pressure 180-Foot Aquifer will impact production wells in the City in about 14 to16 years at a horizontal migration rate of 673 ft/yr. These estimates assume that the currentground water elevations for the Pressure 180-Foot Aquifer are maintained and that the
downward hydraulic gradient with the lower aquifers also does not change appreciably.
The leading edge of the seawater front in the Pressure 400-Foot Aquifer is about five miles fromproduction wells (T14S, R3E, Sections 20 & 29) in the City of Salinas. It is unlikely that seawaterthat has intruded directly from submarine outcrops into the Pressure 400-Foot Aquifer will reachthe City in the near future; the travel time is estimated to be 49 years based on a rate of 578ft/yr. We do not anticipate abrupt accelerated advancement of seawater south of Castroville andin the Marina / Fort Ord area, where the two most prominent seawater intrusion fronts in thisaquifer zone have been recorded to-date. We conclude that although regional seawaterintrusion mechanism for the Pressure 400-Foot Aquifer is of importance for continuedmonitoring, it is more likely that in the City of Salinas this aquifer and its production wells will beimpacted by interaquifer flow from the Pressure 180-Foot Aquifer to the Pressure 400-Foot
Aquifer similar to that observed in the Fort Ord area. However, this scenario requires seawaterin the Pressure 180-Foot Aquifer to advance to areas of mapped aquitard discontinuities, andfor such areas in the City of Salinas, the predicted impact time is about 20 years to potablewater wells.

7/23/2019 Hydrostratigraphic Analysis of the Northern Salinas Valley 2004
http://slidepdf.com/reader/full/hydrostratigraphic-analysis-of-the-northern-salinas-valley-2004 66/112
Kennedy/Jenks Consultants
Final Report – Hydrostratigraphic Analysis of the Northern Salinas Valley 44p:\isg-proj\mcwra final rpt\mcwra_final_14may2004.doc
Section 8: Recommendations
These recommendations are made based on the analyses of hydrostratigraphic sections andthe evaluation of seawater intrusion areas and rates of intrusion expansion. We also reviewedsuggestions from previous studies and included those that are relevant to the objective of thisstudy and in characterizing seawater intrusion in the northern Salinas Valley. Recommendationslisted are not exhaustive and in no order of importance.
1. Continue to perform detailed evaluations of ground water chemistry signature to distinguishthe origin and mechanism of seawater and fresh ground water mixing; i.e. regionallyintruded seawater versus interaquifer contamination and well leakage. This can be done (asperformed in Todd 1989) by use of Trilinear diagrams of cation and anion distributions atspecific well locations. This should be done in additional to chloride spatial and temporaltrend analyses.
2. Map vertical hydraulic gradients of ground water in the Pressure 180-Foot and Pressure400-Foot Aquifers. Changes in ground water gradient provide an indication of the degree ofconfinement of the lower water bearing zone by the Pressure 180/400 Aquitard. This in turncan infer the relative and spatial variation of thicknesses of the aquitard. This approach willdepend on the availability of data and well completion records. These gradient maps shouldthen be compared to hydrostratigraphic facies maps in this and previous studies.
3. Based on Recommendation 2 mentioned above; a) estimate the spatial distribution ofground water leakages (Darcy’s flux) across the Pressure/East Side boundary, b) map thedistribution of interaquifer flow quantities, and c) estimate and map the quantity of wellleakage where data are available.
4. Continue water quality sampling – specifically chloride and total dissolved solids - in bothaquifers to aid in modeling the future pattern of seawater and to distinguish mechanisms ofintrusion and seawater/fresh water mixing. Emphasis should be given to locations of trigger-monitoring wells along the seawater intrusion pathways as discussed in Section 6.
5. Construct a three-dimensional model based on the hydrostratigraphic analysis reported inthis study. The amount of data used in this study and its findings merit the development of asolid three dimensional (3-D) model of: a) inferred permeabilities; b) lithology; andc) depiction of ground water quality and elevations. The best approach to accomplish this isto digitally parameterize (populate) a 3-D numerical matrix based on correlations in cross-sections. This 3-D model (matrix) can be used to calculate (map) flows and quantify groundwater volumes for each aquifer or for separate compartments like those used in evaluating
the seawater pathways discussed in Section 6.
6. Use dual-density computer model to evaluate flow and seawater mixing with fresh water aspart of overall water resources planning. A computer model will also be a preferred methodin providing more quantitative predictions of intrusion rates over the calculations in thisreport, particularly as the seawater front approaches the City of Salinas where ground watergradient and vertical migration magnitudes are greater.

7/23/2019 Hydrostratigraphic Analysis of the Northern Salinas Valley 2004
http://slidepdf.com/reader/full/hydrostratigraphic-analysis-of-the-northern-salinas-valley-2004 67/112
Kennedy/Jenks Consultants
Final Report – Hydrostratigraphic Analysis of the Northern Salinas Valley 45p:\isg-proj\mcwra final rpt\mcwra_final_14may2004.doc
7. Continue to update the Agency WRAIMS database in terms of ground water quality,elevations, and lithologic information. WRAIMS should be used to update the lithologiccross-sections whenever new data are available for reevaluation of the area’s
hydrostratigraphy.
WRAIMS should be upgraded with a computerized hydrostratigraphic analysis tool to allowfor more efficient review of cross-sections and ground water data. The most cost-effectivesolution is to upgrade WRAIMS with a cross-section construction tool as an extension to theWRAIMS GIS capability.
8. Continue to evaluate and redraw the boundary between the Pressure and East SideSubareas based on water quality, hydrostratigraphic understandings, and updatedinterpretations of the depositional environment as reported in this study.

7/23/2019 Hydrostratigraphic Analysis of the Northern Salinas Valley 2004
http://slidepdf.com/reader/full/hydrostratigraphic-analysis-of-the-northern-salinas-valley-2004 68/112
Kennedy/Jenks Consultants
Final Report – Hydrostratigraphic Analysis of the Northern Salinas Valley 46p:\isg-proj\mcwra final rpt\mcwra_final_14may2004.doc
Section 9: Limitations
This report, consisting of professional opinions and recommendations, has been made inaccordance with generally accepted principles and practices in the field of geology andhydrogeology. The interpretation of geologic conditions within the study area is based oninformation collected during the construction of water wells. The development of seven (7)sections distributed throughout the study area was included in the scope of work for this report.
The locations for the cross-sections were selected to provide a generalized representation ofgeologic conditions within the study area. The geologic cross-sections developed for this reportare based on information from the wells shown on the cross-sections. The geologic informationshown between the wells on each cross-section is an interpretation based on professionalopinion and may not be an accurate representation of subsurface conditions between wells.
Due to changes in geologic conditions within the study area, the information from the geologiccross-sections in this report should not be used as the means for determining site conditions forgeographic areas not included in a cross-section. Our data interpretation and data presentedherein do not provide a warranty as to the conditions that may exist beneath the entire studyarea. It is possible that variations in lithologic conditions and depth to ground water could existat the site and may require additional studies, consultation, and possible report revisions.

7/23/2019 Hydrostratigraphic Analysis of the Northern Salinas Valley 2004
http://slidepdf.com/reader/full/hydrostratigraphic-analysis-of-the-northern-salinas-valley-2004 69/112
Kennedy/Jenks Consultants
Final Report – Hydrostratigraphic Analysis of the Northern Salinas Valley 47p:\isg-proj\mcwra final rpt\mcwra_final_14may2004.doc
Section 10: References
Brown, Dick. 1986. Geologic Study of 13S/2E and 14S/2E of Salinas Valley, Draft Report.
Dupre, W.R. 1990. Quaternary Geology of the Monterey Bay Region, California in PacificSection of the American Association of Petroleum Geologists: Geology and Tectonics of theCentral California Coast Region Volume and Guidebook, pp. 185 – 191.
Freeze, Allan R. and Cherry, John A. 1979. Groundwater . Prentice-Hall Inc.
Greene, H. G. 1970. Geology of Southern Monterey Bay and its Relationship to the GroundWater Basin and Salt Water Intrusion. U.S. Geological Survey Open-File Report, 50 p.
Greene, H. G. 1977. Geology of Southern Monterey Bay Region. U.S. Geological Survey Open-
File Report 77-718, 347 p.
Hall, P. 1992. Selected Geological Cross-Sections in the Salinas Valley Using GEOBASE™.Prepared for the Monterey County Water Resources Agency.
Harding ESE. 2001. Final Report Hydrogeologic Investigation of the Salinas Valley Basin in theVicinity of Fort Ord and Marina Salinas Valley, California.
J.M. Montgomery Engineers, Inc. 1993. Salinas Basin Ground Water Model. Draft report to theMonterey County Water Resources Agency.
Leedshill-Herkenhoff, Inc. 1984. Salinas Valley Seawater Intrusion Study Preliminary Task
Report.
Manning, J. C. 1963. Resume of Ground Water Hydrology in Salinas Valley, California, in American Association of Petroleum Geologists – Society of Economic Paleontologists andMineralogists Annual Spring Field Trip Guidebook: Geology of the Salinas Valley and theSan Andreas Fault, p. 106-109.
Monterey County Flood Control and Water Conservation District (MCFCWCD). 1960. SalinasValley Geologic Investigation.
Monterey County Flood Control and Water Conservation District (MCFCWCD). 1968.Investigation of an East Side Canal Project, Salinas Valley.
Monterey County Water Resources Agency (Agency). 1997. Water Resources Data Report -Water Year 1994-1995.
Staal, Gardner, and Dunne, Inc. (SGD). 1990. Hydrogeologic Study – Rancho San Juan ADC Area. Report prepared for the Monterey County Flood Control and Water ConservationDistrict.

7/23/2019 Hydrostratigraphic Analysis of the Northern Salinas Valley 2004
http://slidepdf.com/reader/full/hydrostratigraphic-analysis-of-the-northern-salinas-valley-2004 70/112
Kennedy/Jenks Consultants
Final Report – Hydrostratigraphic Analysis of the Northern Salinas Valley 48p:\isg-proj\mcwra final rpt\mcwra_final_14may2004.doc
Staal, Gardner, and Dunne, Inc. (SGD). 1993. Hydrogeologic Study: Salinas Valley GroundWater Basin, Seawater Intrusion Delineation/Monitoring Well Construction Program,Pressure 180-Foot Aquifer, Salinas Area, California. Prepared for Monterey County Water
Resources Agency.
State of California, Department of Public Works, Division of Water Resources (DWR). 1946.Bulletin No. 52, Salinas Basin Investigation.
State of California, Department of Public Works, Division of Water Resources (DWR). 1970.Sea Water Intrusion Lower Salinas Valley Progress Report 1968-1969.
State of California, Department of Public Works, Division of Water Resources (DWR). 1973.Sea Water Intrusion Lower Salinas Valley.
Tinsley, J.C. III. 1975. Quaternary Geology of Northern Salinas Valley, Monterey County,
California. Ph.D. Dissertation, Stanford University.
Thorup, Richard R. 1976. Report on Castroville Irrigation Project Deep Test Hole AndFreshwater Bearing Strata Below the Pressure 400-Foot Aquifer, Salinas Valley, CA.
Todd, David Keith. 1989. Initial Assessment of Seawater Intrusion by Well Leakage into thePressure 400-Foot Aquifer, Castroville Area.
Todd, David Keith. 1989. Sources of Saline Intrusion in the Pressure 400-Foot Aquifer,Castroville Area, California.

7/23/2019 Hydrostratigraphic Analysis of the Northern Salinas Valley 2004
http://slidepdf.com/reader/full/hydrostratigraphic-analysis-of-the-northern-salinas-valley-2004 71/112

7/23/2019 Hydrostratigraphic Analysis of the Northern Salinas Valley 2004
http://slidepdf.com/reader/full/hydrostratigraphic-analysis-of-the-northern-salinas-valley-2004 72/112
Kennedy/Jenks Consultants
Table 1: List of Well Logs Used in Cross-Sections
Final Report – Hydrostratigraphic Analysis of the Northern Salinas Valley Page 1 of 4 p:\isg-proj\mcwra final rpt\table_1.doc
Well Name Easting NorthingCross-Section
Elevation(feet
MSL(a)
) Log Date Log Source
13S/02E-31L01 5744481 2170637 A-A’ 32.81 no date on log WRAIMS-excel
14S/02E-05G02 5751035 2166106 A-A’ 9.84 1/22/1959 WRAIMS-excel
14S/02E-05K01 5750118 2165251 A-A’ 9.84 8/30/1955 WRAIMS-excel
14S/02E-05R03 5752345 2163500 A-A’ 9.84 7/1/1964 WRAIMS-excel
14S/02E-08A01 5751809 2162218 A-A’ 13.12 10/5/1957 WRAIMS-excel
14S/02E-09D04 5753019 2162820 A-A’ 9.84 no date available WRAIMS-excel
14S/02E-09K02 5756034 2161092 A-A’ 13.12 10/17/1973 WRAIMS-excel
14S/02E-09L02 5754726 2161137 A-A’ 9.84 9/21/1956 WRAIMS-excel
14S/02E-12E01 5772580 2145645 A-A’ 32.81 no date on log MCWRA Fax -hardcopy
14S/02E-14L03 5764606 2154424 A-A’ 19.69 8/1/1990 MCWRA mail 2
14S/02E-15A01 5762051 2156980 A-A’ 19.69 5/9/1978 MCWRA mail 2
14S/02E-23H04 5767644 2150094 A-A’ 29.53 10/1/1962 MCWRA Fax -hardcopy
14S/02E-24J03 5772957 2148630 A-A’ 29.53 12/1/1957 WRAIMS-excel
14S/02E-24P02 5773211 2147410 A-A’ 42.65 11/13/1961 MCWRA Fax -hardcopy
14S/03E-29Q01 5780097 2141346 A-A’ 39.37 8/26/1977 CWS fax
14S/03E-33Q01 5786107 2137635 A-A’ 49.22 3/16/1961 CWS fax
15S/03E-03C01 5790880 2135425 A-A’ 59.06 no date on log WRAIMS-excel
15S/03E-03K02 5792868 2132488 A-A’ 62.34 6/1/1954 WRAIMS-excel
15S/03E-03R02 5793181 2130514 A-A’ 59.06 7/1/1963 WRAIMS-excel
APN-227021014 5766831 2153969 A-A’ 19.69 1/3/2001 Post 1998 fax
13S/02E-36F01 5768169 2170823 C-C’ 9.84 12/28/1949 WRAIMS-excel
14S/02E-02C03 5765130 2167461 C-C’ 68.9 7/16/1987 MCWRA Fax -hardcopy
14S/02E-02E02 5763845 2166608 C-C’ 45.93 11/21/1961 WRAIMS-excel
14S/02E-03K02 5760546 2164416 C-C’ 19.69 2/5/1982 WRAIMS-excel
14S/02E-03R02 5762516 2163909 C-C’ 19.69 9/15/1992 MCWRA mail 2
14S/02E-10H01 5761487 2160777 C-C’ 19.69 9/11/1985 WRAIMS-excel
14S/02E-15P01 5758703 2153476 C-C’ 45.93 9/5/1965 WRAIMS-excel
14S/02E-16A02 5757230 2156179 C-C’ 19.69 10/17/1973 WRAIMS-excel
14S/02E-16G01 5755861 2155827 C-C’ 19.69 no date available WRAIMS-excel
14S/02E-16H01 5756685 2155404 C-C’ 19.69 5/11/1976 WRAIMS-excel
14S/02E-21E01 5752647 2150365 C-C’ 101.71 8/23/1997 Fort Ord - excel
14S/02E-21F02 5753622 2151834 C-C’ 26.25 10/22/1956 WRAIMS-excel
14S/02E-21N01 5752593 2147797 C-C’ 134.52 no date available Fort Ord - excel
14S/02E-28C01 5753288 2145538 C-C’ 45.93 no date available Fort Ord - excel
APN-133013001 5768220 2173603 C-C’ 22.97 8/9/2002 Post 1998 fax

7/23/2019 Hydrostratigraphic Analysis of the Northern Salinas Valley 2004
http://slidepdf.com/reader/full/hydrostratigraphic-analysis-of-the-northern-salinas-valley-2004 73/112
Kennedy/Jenks Consultants
Table 1: List of Well Logs Used in Cross-Sections
Final Report – Hydrostratigraphic Analysis of the Northern Salinas Valley Page 2 of 4 p:\isg-proj\mcwra final rpt\table_1.doc
Well Name Easting NorthingCross-Section
Elevation(feet
MSL(a)
) Log Date Log Source
13S/03E-32Q01 5782441 2168308 D-D’ 144.36 6/21/1951 WRAIMS-excel
14S/02E-12Q01 5771550 2157101 D-D’ 39.37 1/1/1938 WRAIMS-excel
14S/02E-13F02 5770982 2154734 D-D’ 39.37 6/12/1993 MCWRA Fax -hardcopy
14S/02E-13G01 5772059 2155494 D-D’ 49.22 9/6/1978 MCWRA Fax -hardcopy
14S/02E-13P50 5770438 2152221 D-D’ 52.5 no date on log MCWRA Fax -hardcopy
14S/02E-25D03 5768820 2146345 D-D’ 29.53 9/18/1973 MCWRA Fax -hardcopy
14S/02E-25E02 5768033 2145602 D-D’ 29.53 12/3/1963 MCWRA Fax -hardcopy
14S/02E-26A06 5767267 2145928 D-D’ 29.53 12/20/1966 MCWRA Fax -hardcopy
14S/02E-26J03 5766831 2143917 D-D’ 32.81 6/30/1978 MCWRA Fax -hardcopy
14S/03E-05B02 5782001 2165414 D-D’ 118.12 no date available WRAIMS-excel
14S/03E-05T55 5781854 2164713 D-D’ 114.83 4/1/1976 WRAIMS-excel
14S/03E-06J02 5778772 2164188 D-D’ 88.59 3/24/1947 WRAIMS-excel
14S/03E-07A01 5778411 2161662 D-D’ 88.59 10/1/1937 WRAIMS-excel
14S/03E-07K51 5777551 2159616 D-D’ 36.09 11/1/1992 WRAIMS-excel14S/03E-07L01 5775637 2159478 D-D’ 68.9 3/14/1960 WRAIMS-excel
14S/03E-07P02 5775832 2157899 D-D’ 45.93 9/15/1982 MCWRA mail 2
APN-227062005 5768188 2147399 D-D’ 36.09 11/13/2002 Post 1998 fax
APN-414013005 5766469 2145232 D-D’ 32.81 7/28/2000 Post 1998 fax
APN-414021010 5763762 2140668 D-D’ 32.81 9/7/2002 Post 1998 fax
14S/03E-09B01 5788060 2161157 E-E’ 118.12 no date available WRAIMS-excel
14S/03E-09P03 5786267 2157511 E-E’ 91.87 3/11/1971 CWS fax
14S/03E-10N01 5789946 2157068 E-E’ 141.08 no date on log WRAIMS-excel
14S/03E-16E02 5785346 2155109 E-E’ 98.43 2/1/1991 WRAIMS-excel
14S/03E-16M01 5785214 2153016 E-E’ 91.87 2/1/1991 CWS fax
14S/03E-20C01 5780967 2149710 E-E’ 62.34 9/16/1960 CWS fax14S/03E-20M02 5779875 2147880 E-E’ 55.78 8/1/1978 CWS fax
14S/03E-21E03 5784456 2149594 E-E’ 78.74 9/1/1974 CWS fax
14S/03E-29C01 5780635 2145540 E-E’ 59.06 4/27/1981 WRAIMS-excel
14S/03E-29F03 5780127 2144557 E-E’ 39.37 3/31/1986 CWS fax
14S/03E-31B01 5776302 2140048 E-E’ 39.37 11/13/1931 MCWRA mail 2
14S/03E-31L01 5775962 2138054 E-E’ 42.65 5/15/1973 WRAIMS-excel
14S/03E-31P01 5775576 2136362 E-E’ 39.37 3/7/1980 CWS fax

7/23/2019 Hydrostratigraphic Analysis of the Northern Salinas Valley 2004
http://slidepdf.com/reader/full/hydrostratigraphic-analysis-of-the-northern-salinas-valley-2004 74/112
Kennedy/Jenks Consultants
Table 1: List of Well Logs Used in Cross-Sections
Final Report – Hydrostratigraphic Analysis of the Northern Salinas Valley Page 3 of 4 p:\isg-proj\mcwra final rpt\table_1.doc
Well Name Easting NorthingCross-Section
Elevation(feet
MSL(a)
) Log Date Log Source
15S/02E-01H02 5772322 2134327 E-E’ 36.09 12/1/1960 MCWRA mail 2
15S/02E-01K01 5769536 2130429 E-E’ 36.09 1/1/1935 WRAIMS-excel
15S/02E-12A01 5772139 2129923 E-E’ 39.37 5/5/1960 WRAIMS-excel
15S/03E-06D02 5773377 2135183 E-E’ 36.09 11/15/1958 WRAIMS-excel
APN-211181003 5790138 2160295 E-E’ 141.08 8/29/2002 Post 1998 fax
14S/03E-10B01 5793892 2161981 F-F’ 167.33 11/9/1957 WRAIMS-excel
14S/03E-10R02 5794256 2157152 F-F’ 137.8 12/23/1954 WRAIMS-excel
14S/03E-15G01 5792906 2154872 F-F’ 131.24 no date on log WRAIMS-excel
14S/03E-15K03 5792845 2152868 F-F’ 108.27 1/1/1949 WRAIMS-excel14S/03E-15P01 5790853 2151825 F-F’ 101.71 no date on log WRAIMS-excel
14S/03E-21L01 5785649 2148130 F-F’ 78.74 1/21/1950 WRAIMS-excel
14S/03E-22D01 5790071 2152141 F-F’ 98.43 11/1/1975 CWS fax
14S/03E-22E51 5790077 2149259 F-F’ 82.03 4/5/2002 CWS fax
14S/03E-28F02 5786239 2144995 F-F’ 36.09 12/10/1950 WRAIMS-excel
14S/03E-28M02 5784086 2142400 F-F’ 49.22 no date available WRAIMS-excel
14S/03E-28N03 5784086 2142499 F-F’ 45.93 5/17/1955 Hardcopy-Geobase
14S/03E-32N04 5779239 2137271 F-F’ 45.93 3/25/1966 WRAIMS-excel
15S/03E-06R01 5777305 2130632 F-F’ 39.37 2/15/1948 WRAIMS-excel
15S/03E-07F02 5773983 2128798 F-F’ 39.37 3/1/1965 WRAIMS-excel
15S/03E-18C02 5774492 2124373 F-F’ 42.65 4/1/1954 WRAIMS-excel15S/03E-07K51 5776189 2128628 F-F’ 39.37 6/22/2000 Post 1998 fax
14S/03E-11E50 5795166 2159299 F-F’ 154.21 7/8/1999 Post 1998 fax
14S/03E-11E51 5794824 2159292 F-F’ 154.21 1/6/1999 Post 1998 fax
14S/03E-02L50 5796224 2164437 F-F’ 170.61 6/6/2002 Post 1998 fax
14S/03E-22A01 5795569 2150706 G-G’ 101.71 10/27/1955 WRAIMS-excel
14S/03E-28B02 5791415 2142310 G-G’ 59.06 5/28/1962 WRAIMS-excel
14S/03E-33G01 5787201 2139358 G-G’ 39.37 2/28/1935 CWS fax
14S/03E-34C01 5790510 2140541 G-G’ 65.62 4/26/1968 CWS fax
15S/03E-04K03 5785725 2131199 G-G’ 55.78 1/9/1960 WRAIMS-excel
15S/03E-04Q01 5786592 2131145 G-G’ 59.06 3/30/1971 CWS fax
15S/03E-04T50 5786416 2132795 G-G’ 55.78 no date available WRAIMS-excel15S/03E-08B04 5780773 2128730 G-G’ 49.22 10/16/1978 WRAIMS-excel
15S/03E-08F05 5780190 2127283 G-G’ 49.22 7/6/1962 WRAIMS-excel
15S/03E-09E03 5784552 2127792 G-G’ 49.22 12/23/1946 WRAIMS-excel
15S/03E-17B03 5781255 2123885 G-G’ 49.22 5/1/1979 WRAIMS-excel
15S/03E-17G01 5780643 2122747 G-G’ 49.22 10/15/1982 WRAIMS-excel
15S/03E-17M01 5778444 2122174 G-G’ 39.37 6/23/1955 WRAIMS-excel
14S/03E-22J50 5793668 2146642 G-G’ 49.22 11/18/1999 Post 1998 fax

7/23/2019 Hydrostratigraphic Analysis of the Northern Salinas Valley 2004
http://slidepdf.com/reader/full/hydrostratigraphic-analysis-of-the-northern-salinas-valley-2004 75/112
Kennedy/Jenks Consultants
Table 1: List of Well Logs Used in Cross-Sections
Final Report – Hydrostratigraphic Analysis of the Northern Salinas Valley Page 4 of 4 p:\isg-proj\mcwra final rpt\table_1.doc
Well Name Easting NorthingCross-Section
Elevation(feet
MSL(a)
) Log Date Log Source
13S/02E-28B01 5755623 2177909 B-B’ 36.09 12/6/1960 MCWRA mail
13S/02E-28E01 5752984 2176435 B-B’ 32.81 9/14/1990 MCWRA mail
13S/02E-28M02 5753447 2175998 B-B’ 32.81 5/26/1986 MCWRA mail
13S/02E-29J01 5751472 2175785 B-B’ 32.81 5/1/1957 MCWRA mail
13S/02E-32E03 5748693 2171792 B-B’ 32.81 no date available WRAIMS-excel
13S/02E-32E05 5748672 2171138 B-B’ 32.81 10/15/1984 WRAIMS-excel
13S/02E-32J03 5752339 2171082 B-B’ 32.81 8/11/1962 MCWRA mail
13S/02E-32M02 5748673 2170965 B-B’ 32.81 12/5/1984 MCWRA mail
13S/02E-32P01 5749690 2170011 B-B’ 32.81 no date available WRAIMS-excel14S/01E-13J02 5741217 2154079 B-B’ 26.25 no date available Fort Ord - excel
14S/01E-24L05 5738662 2149679 B-B’ 49.22 no date available Fort Ord - excel
14S/01E-24L53 5738254 2149250 B-B’ 32.81 1/22/1996 MCWRA mail
14S/02E-06J03 5747145 2165043 B-B’ 9.84 5/3/1948 MCWRA mail
14S/02E-06L01 5743814 2165454 B-B’ 9.84 11/12/1976 WRAIMS-excel
14S/02E-06R02 5746853 2163230 B-B’ 9.84 2/25/1948 MCWRA mail
14S/02E-07A01 5747019 2162663 B-B’ 9.84 9/19/1974 MCWRA mail
14S/02E-07A02 5747125 2161693 B-B’ 9.84 2/1/1982 MCWRA mail
14S/02E-07F02 5743496 2160715 B-B’ 9.84 no date available Fort Ord - excel
14S/02E-07L04 5743780 2159328 B-B’ 9.84 8/23/1983 Fort Ord - excel
14S/02E-07L05 5743785 2160381 B-B’ 9.84 5/6/1988 Fort Ord - excel14S/02E-18E01 5742787 2156369 B-B’ 6.56 7/6/1974 Fort Ord - excel
14S/02E-10M02 5757983 2159568 A-A’,C-C’ 22.97 10/18/1965 WRAIMS-excel
14S/02E-15B01 5760095 2156465 A-A’,C-C’ 36.09 5/26/1982 WRAIMS-excel
14S/02E-15C02 5759335 2157212 A-A’,C-C’ 32.81 6/20/1978 MCWRA mail 2
14S/02E-23J50 5767802 2148880 A-A’,D-D’ 29.53 10/1/1990 MCWRA Fax -hardcopy
14S/02E-24D50 5768924 2151344 A-A’,D-D’ 32.81 9/28/1995 MCWRA Fax -hardcopy
14S/02E-24E01 5768287 2150314 A-A’,D-D’ 29.53 5/25/1951 WRAIMS-excel
14S/03E-29N02 5778559 2142474 A-A’,E-E’ 39.37 5/20/1959 CWS fax
14S/03E-28N01 5783795 2140837 A-A’,F-F 49.22 6/16/1948 MCWRA mail 2
14S/03E-32F01 5779603 2139186 A-A’,F-F 49.22 no date available WRAIMS-excel
14S/03E-32H02 5782760 2137999 A-A’,F-F’ 52.5 no date on log WRAIMS-excel
13S/02E-32N01 5747285 2169133 A-A’,B-B’ 32.81 5/1/1949 MCWRA mail
14S/02E-05C03 5749012 2167112 A-A’,B-B’ 9.84 4/14/1988 MCWRA mail
14S/02E-05F04 5749767 2166855 A-A’,B-B’ 9.84 3/26/1954 WRAIMS-excel
(a) MSL = Mean Sea Level

7/23/2019 Hydrostratigraphic Analysis of the Northern Salinas Valley 2004
http://slidepdf.com/reader/full/hydrostratigraphic-analysis-of-the-northern-salinas-valley-2004 76/112
Kennedy/Jenks Consultants
Table 2: Sedimentary and Hydraulic Characteristics of the Pressure and East
Side Subareas
Final Report – Hydrostratigraphic Analysis of the Northern Salinas Valley Page 1 of 1 p:\isg-proj\mcwra final rpt\table_2.doc
Characteristics Pressure Subarea East Side Subarea
Depositional Environment Fluvial Alluvial Fan
Predominant Sedimentary Facies Sand and gravel Clay with discontinuous sand andgravel deposits
Stratigraphic Architecture ofPermeable Units
Relatively thick and continuous(especially in the Pressure 400-Foot
Aquifer)
Discontinuous
Hydraulic Connectivity Higher Lower (at least one order ofmagnitude lower than the PressureSubarea)
Ground Water Velocities Faster Slower (possibly five times slowerthan the Pressure Subarea)

7/23/2019 Hydrostratigraphic Analysis of the Northern Salinas Valley 2004
http://slidepdf.com/reader/full/hydrostratigraphic-analysis-of-the-northern-salinas-valley-2004 77/112
Ke
Table 3: Pressure Subarea Estimated Seawater Intrusion Rates
Final Report – Hydrostratigraphic Analysis of the Northern Salinas Valley p:\isg-proj\mcwra final rpt\table_3.doc
Path Start Yr End Yr Years
Intrusion
Distance (ft)
Periodic
Rate (ft/y)
Intermediate
Rates (ft/y) Path Start Yr End Yr Years
Intru
Distanc
1 1944 1965 21 9200 438 1 1959 1975 16 6
1965 1975 10 400 40 1975 1985 10 4
1975 1985 10 200 20 1985 1990 5
1985 1993 8 4100 513 253 1990 1995 5 1
1993 2001 8 0 0 0 1995 1997 2 2
202 1997 2001 4 1
2 1944 1965 21 12000 571
1965 1975 10 2800 280 2 1975 1985 10 5
1975 1985 10 5200 520 1985 1990 5
1985 1993 8 1000 125 374 1990 1993 3 2
1993 2001 8 0 0 0 1993 1995 2
299 1995 2001 6
3 1944 1965 21 12500 595
1965 1975 10 3000 300 3 1975 1985 10 3
1975 1985 10 2800 280 1985 1990 5 1
1985 1993 8 8700 1088 566 1990 1997 7 2
1993 1999 6 450 75 1997 1999 2 2
1999 2001 2 600 300 188 1990 2001 11 2
440
4 1944 1965 21 12500 595 4 1975 1985 10
1965 1975 10 3400 340 1985 1990 5
1975 1985 10 2100 210 1990 1997 7 5
1985 1993 8 5500 688 458 1997 1999 2 4
1993 1997 4 2100 525 1990 2001 11
1997 1999 2 4000 2000
1999 2001 2 700 350 958
673 5 1975 1985 10 5
1985 2001 16
5 1944 1965 21 12500 595
1965 1975 10 3400 3401975 1985 10 2100 210
1985 1993 8 6100 763 477
1993 1997 4 3100 775
1997 1999 2 2000 1000
1999 2001 2 850 425 733
587
6 1975 1985 10 4100 410 612
1985 2001 16 0 0 0
205
Cumulative Seawater Intrusion Rate
Cumulative Seawater Intrusion Rate
Cumulative Seawater Intrusion Rate
Cumulative Seawater
Cumulative Seawater
Cumulative Seawater Intrusion Rate
Cumulative Seawater
Cumulative Seawater
Cumulative Seawater
Pressure 400-Foot APressure 180-Foot Aquifer
Cumulative Seawater Intrusion Rate
Cumulative Seawater Intrusion Rate

7/23/2019 Hydrostratigraphic Analysis of the Northern Salinas Valley 2004
http://slidepdf.com/reader/full/hydrostratigraphic-analysis-of-the-northern-salinas-valley-2004 78/112
Figures

7/23/2019 Hydrostratigraphic Analysis of the Northern Salinas Valley 2004
http://slidepdf.com/reader/full/hydrostratigraphic-analysis-of-the-northern-salinas-valley-2004 79/112

7/23/2019 Hydrostratigraphic Analysis of the Northern Salinas Valley 2004
http://slidepdf.com/reader/full/hydrostratigraphic-analysis-of-the-northern-salinas-valley-2004 80/112

7/23/2019 Hydrostratigraphic Analysis of the Northern Salinas Valley 2004
http://slidepdf.com/reader/full/hydrostratigraphic-analysis-of-the-northern-salinas-valley-2004 81/112
mcwra_swi\Report_200405\figure_03.pdf
SouNorthwest
E l e v a t i o n ( f e e t r e l a t i v e t o m e a n s e
a l e v e l )
Distance Along CrossSection (feet)Fine-grained Sediments
Coarse-grained Sediments,
or interbedded fine-grainedand coarse-grained
Sediments
S e c t i o n B - B '
S e c t i o n C - C '
S e c t i o n D - D '
S e c t i o n
E - E '
S e c t i o n
F - F '
S e c t i o n
G - G '
A
SALINASVALLEY
AQUITARD
180'
AQUIFER
180'
AQUIFER180'
AQUIFER
400'
AQUIFER
400'
AQUIFER
400'
AQUIFER
400'
AQUIFER
180'
AQUIFER
Monterey County Water Resources
Salinas, C
Cross-Sect
K/J 03
M
F
California State
Highway 1 Castroville Road Boronda Road Market StreetNashua Road Blanco Road

7/23/2019 Hydrostratigraphic Analysis of the Northern Salinas Valley 2004
http://slidepdf.com/reader/full/hydrostratigraphic-analysis-of-the-northern-salinas-valley-2004 82/112
NortheastSouthwest
E l e v a t i o n ( f e e t r e l a t i v e t o m e a n s e a l e
v e l ) E
l e
v a t i on ( f e e t r el a t i v e t om e an s e al ev el )
Distance Along Cross Section (feet)
Fine-grained Sediments
Coarse-grained Sediments,or interbedded fine-grainedand coarse-grainedSediments
Feet
B B'
C r o s s - S e c t i o n A - A '
SALINAS VALLEY AQUITARD
180' AQUIFER
DEEP AQUIFER
180' AQUIFER
DUNESAND
DEEP AQUIFER
DEEP AQUIFER
400' AQUIFER
400' AQUIFER
Monterey County Water Resources
Salinas, C
Cross-Sect
K/J 03
M
Fmcwra_swi\Report_200405\figure_04.pdf
Salinas River Molera Road California StateHighway1

7/23/2019 Hydrostratigraphic Analysis of the Northern Salinas Valley 2004
http://slidepdf.com/reader/full/hydrostratigraphic-analysis-of-the-northern-salinas-valley-2004 83/112
NortheastSouthwest
C C'
C r o s s - S e c t i o n A - A '
SALINAS VALLEY AQUITARD
180' AQUIFER
400' AQUIFER
400' AQUIFER
E l e v a t i o n ( f e e t r e l a t i v e t o m e a n s e a l e v e l ) E
l ev a t i on ( f e e t
r el a t i v e t om e an s e al ev el )
Distance Along Cross Section (feet)
Fine-grained Sediments
Coarse-grained Sediments,or interbedded fine-grainedand coarse-grainedSediments
Monterey County Water Resources
Salinas, C
Cross-Sect
K/J 03
M
Fmcwra_swi\Report_200405\figure_05.pdf
Salinas River Nashua Road Castroville Road Espinosa Road

7/23/2019 Hydrostratigraphic Analysis of the Northern Salinas Valley 2004
http://slidepdf.com/reader/full/hydrostratigraphic-analysis-of-the-northern-salinas-valley-2004 84/112
Distance Along Cross Section (feet)
NortheastSouthwest
E l e v a t i o n ( f e e t r e l a t i v e t o m e a n
s e a l e v e l )
Fine-grained Sediments
Coarse-grained Sediments,or interbedded fine-grainedand coarse-grainedSediments
D D'
C r o s s - S e c t i o n A - A '
SALINASVALLEY AQUITARD
180' AQUIFER
400' AQUIFER
Monterey County Water Resources
Salinas, C
Cross-Sect
K/J 03
M
Fmcwra_swi\Report_200405\figure_06.pdf
Blanco Road McFadden Road Castroville Road

7/23/2019 Hydrostratigraphic Analysis of the Northern Salinas Valley 2004
http://slidepdf.com/reader/full/hydrostratigraphic-analysis-of-the-northern-salinas-valley-2004 85/112
E l e v a t i o n ( f e e t r e l a t i v e t o m
e a n s e a l e v e l )
Distance Along Cross Section (feet)Fine-grained Sediments
Coarse-grained Sediments,or interbedded fine-grainedand coarse-grainedSediments
E
C r o s s - S e c t i o n
A - A '
NorthSouthwest
SALINAS VALLEY AQUITARD
180' AQUIFER
400' AQUIFER
Monterey County Water Resources
Salinas, C
Cross-Sect
K/J 03
M
Fmcwra_swi\Report_200405\figure_07.pdf
Salinas River Davis Road US Highway 101 Boronda RoadMarket Street

7/23/2019 Hydrostratigraphic Analysis of the Northern Salinas Valley 2004
http://slidepdf.com/reader/full/hydrostratigraphic-analysis-of-the-northern-salinas-valley-2004 86/112
NortSouthwest
E l e v a t i o n ( f e e t r e l a t i v e t o m e a n s e a l e v
e l )
Distance Along Cross Section (feet)Fine-grained Sediments
Coarse-grained Sediments,or interbedded fine-grained
and coarse-grainedSediments
F
C r o s s - S e c t i o n A - A '
These wells are interpreted to consist primarilyof alluvial fan facies based on the presence ofalluvial fan facies in the adjacent updip anddowndip wells. The lithologic descriptions of these 1950's-vintage wells appear to be biasedtoward clay facies.
SALINAS VALLEY
AQUITARD
180' AQUIFER
400'
AQUIFER
Monterey County Water Resources
Salinas, C
Cross-Sec
K/J 03
M
Fmcwra_swi\Report_200405\figure_08.pdf
Market Street US Highway 101 Boronda Road
1 4 S / 0 3 E - 1 1 E 5 1
1 4 S / 0 3 E - 1 1 E 5 0
1 4 S / 0 3 E - 0 2 L 5 0
1 5 S / 0 3 E - 0 7 K 5 1

7/23/2019 Hydrostratigraphic Analysis of the Northern Salinas Valley 2004
http://slidepdf.com/reader/full/hydrostratigraphic-analysis-of-the-northern-salinas-valley-2004 87/112
NortheaSouthwest
E l e v a t i o n ( f e e t r e l a t i v e t o m e a n s e a l e v e l )
Distance Along Cross Section (feet)Fine-grained Sediments
Coarse-grained Sediments,
or interbedded fine-grained
and coarse-grained
Sediments
G G
C r o s s - S e c t i o n A - A '
SALINAS VALLEY
AQUITARD
180'
AQUIFER
400'
AQUIFER
DEEP
AQUIFER
Monterey County Water Resources
Salinas, C
Cross-Sect
K/J 03
M
Fmcwra_swi\Report_200405\figure_09.pdf
Salinas River Blanco Road US Highway 101
1 4 S / 0 3 E - 2 2 J 5 0

7/23/2019 Hydrostratigraphic Analysis of the Northern Salinas Valley 2004
http://slidepdf.com/reader/full/hydrostratigraphic-analysis-of-the-northern-salinas-valley-2004 88/112

7/23/2019 Hydrostratigraphic Analysis of the Northern Salinas Valley 2004
http://slidepdf.com/reader/full/hydrostratigraphic-analysis-of-the-northern-salinas-valley-2004 89/112
H:\mcwra_swi\Report_200405\figure_11(01).pdf
r nite
G AB I L AN R AN G E
Tributary
Proximal alluvial fan facies
Coalescing of adjacent alluvial f
Distributary channel
Floodplain deposits
Active fluvial channel
Fluvial overbank area
Paleochannel deposits
Distal alluvialfan facies
A l l u v i a l P l a i n
A l l u v i a l F a n
C o m p l e x
S a l i n a s R i v e r
N W
EAST SIDE
SUBAREA
PRESSURE
SUBAREA
TRANSITION
ZONE
Not to scale
GENERALIZED FLUVIAL AND ALLUVIAL FAN FACIES
OF NORTHERN SALINAS VALLEY
Note : See Section 5.1.2 for definitions of the
transition zone and boundary between
the Pressure and East Side Subareas.
Fi
K/J 03
M
Monterey County Water Resources
Salinas, C
Generalized Fluvial and Alluv
Facies of Northern Salinas

7/23/2019 Hydrostratigraphic Analysis of the Northern Salinas Valley 2004
http://slidepdf.com/reader/full/hydrostratigraphic-analysis-of-the-northern-salinas-valley-2004 90/112

7/23/2019 Hydrostratigraphic Analysis of the Northern Salinas Valley 2004
http://slidepdf.com/reader/full/hydrostratigraphic-analysis-of-the-northern-salinas-valley-2004 91/112H:\mcwra_swi\Report_200405\figure_13(02).pdf
l
l
u
via
l
P
l
a
i
n
A l l u v i a l P l a i n
A l l u v i a l F a n
C o m
p l e x
P r o g r e s s i v e
A l l u v i a l F a n
C o m
p l e x
S a l i n a s R i v e r
S a l i n a s R i v e r
FACIES SCENARIO 1A
FACIES SCENARIO 1B
Facies Scenario 1: Permeable Facies of Pressure
Subarea in Contact with Permeable
Facies of East Side Subarea
Note: Not to Scale
Figure
K/J 035901
May 2
Monterey County Water Resources Age
Salinas, Califo
Facies Scenar

7/23/2019 Hydrostratigraphic Analysis of the Northern Salinas Valley 2004
http://slidepdf.com/reader/full/hydrostratigraphic-analysis-of-the-northern-salinas-valley-2004 92/112H:\mcwra_swi\Report_200405\figure_14(01).pdf
A l l u v i a l P
l a i n
A l l u v i a l F a n
C o m
p l e x
S a l i n a s R i v e r
Facies Scenario 2 : Impermeable/Low Permeability Facies
of Pressure Subarea in Contact with
Impermeable/Low Permeability of East
Side Subarea
Note: Not to Scale
Figure
K/J 035901
May 2
Monterey County Water Resources Age
Salinas, Califo
Facies Scenar

7/23/2019 Hydrostratigraphic Analysis of the Northern Salinas Valley 2004
http://slidepdf.com/reader/full/hydrostratigraphic-analysis-of-the-northern-salinas-valley-2004 93/112H:\mcwra_swi\Report_200405\figure_15(03).pdf
R e l a t i v e S e a L e
v e l R i s e
B l u e C l a y
FACIES SCENARIO 3A
FACIES SCENARIO 3B
Facies Scenario 3 : Impermeable Blue Clay Facies of
Pressure Subarea in Contact with
Permeable Facies of East Side
Subarea
Note: Not to Scale
Figure
K/J 035901
May 2
Monterey County Water Resources Age
Salinas, Califo
Facies Scenar
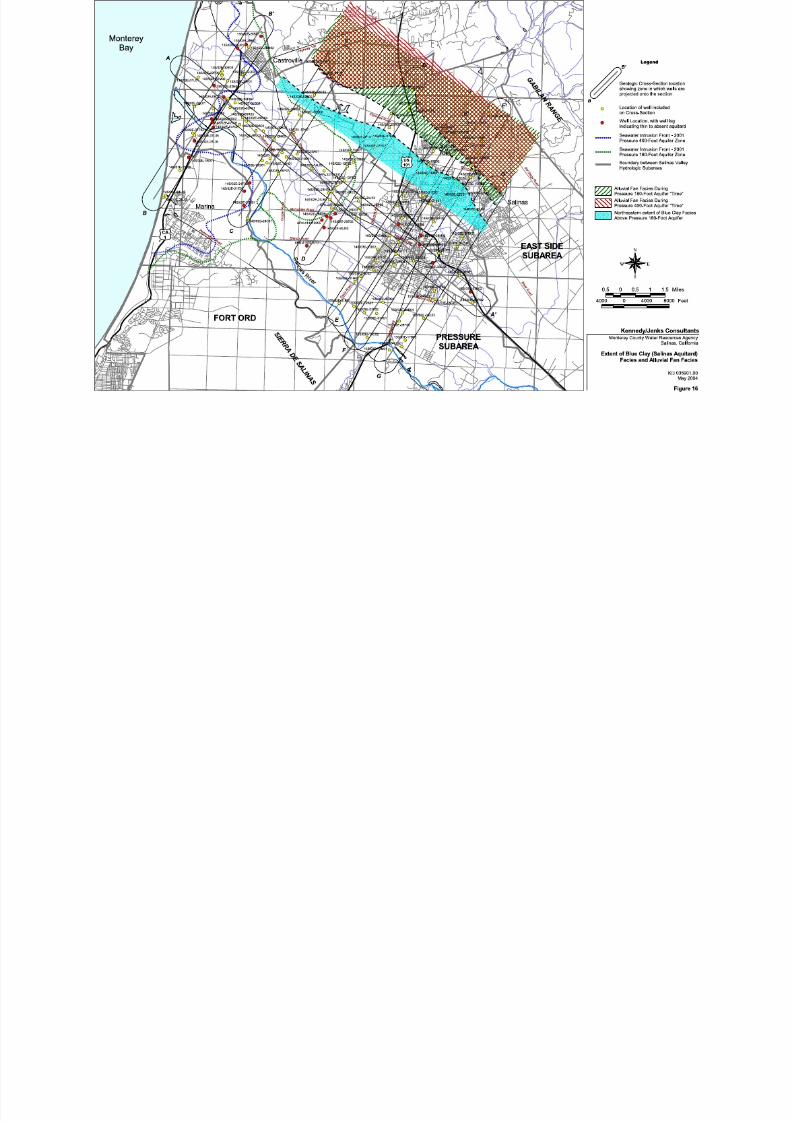
7/23/2019 Hydrostratigraphic Analysis of the Northern Salinas Valley 2004
http://slidepdf.com/reader/full/hydrostratigraphic-analysis-of-the-northern-salinas-valley-2004 94/112

7/23/2019 Hydrostratigraphic Analysis of the Northern Salinas Valley 2004
http://slidepdf.com/reader/full/hydrostratigraphic-analysis-of-the-northern-salinas-valley-2004 95/112
14S/03E-02L50
14S/03E-11E50
14S/03E-11E51
14S/03E-22J50
15S/03E-07K51
H i g h
w a y 6 8
Potential hydraulic
connectivity portal across
Pressure/Eastside Transition
Zone through semipermeable
sediments
Potential hydraulic
connectivity portal across
Pressure/Eastside Transition
Zone through permeable
sediments [FACIES SCENARIO 1]

7/23/2019 Hydrostratigraphic Analysis of the Northern Salinas Valley 2004
http://slidepdf.com/reader/full/hydrostratigraphic-analysis-of-the-northern-salinas-valley-2004 96/112

7/23/2019 Hydrostratigraphic Analysis of the Northern Salinas Valley 2004
http://slidepdf.com/reader/full/hydrostratigraphic-analysis-of-the-northern-salinas-valley-2004 97/112
Monterey
Bay
FORT OR
Potential hydraulic
connectivityportal acrots
Pmsure/EutsideTransition
Zone tllrough permeable
led lm n ts [FACIES SCENARIO 1
---
Legend
B
Geologic Cross Sec
showing zone in whic
projected onto the s
0
Location of well includ
on Cross Section
•
Well Location. with we
indicating thin to abse
-
Boundary between Sa
Hydrologic Subareas
Seawater Intrusion Pa
Depositional Facies Bo
Depositional Facies
m ll ll ll ll AllUV a Fan
ll l Alluvial Plain
CJ
Fluvial Channel
rn rn
tm
mmFluvial Overbank
Seawater Intrusion Front
I. I
1944
1955
1975
1985
1993
1997
1999
2001
0.5 0 0.5 1
__
4000 0 4000
1.5
80
Kenned
/Jenks
C
Monterey County Water Res
Sal
Historic Seawater Int
and Inferred T
Pressure 180-F

7/23/2019 Hydrostratigraphic Analysis of the Northern Salinas Valley 2004
http://slidepdf.com/reader/full/hydrostratigraphic-analysis-of-the-northern-salinas-valley-2004 98/112
14S/03E-02L50
14S/03E-11E50
14S/03E-11E51
14S/03E-22J50
15S/03E-07K51
H i g h
w a y 6 8
P1
P
P 5
P4
P
P 3
P1
P 2
Seawater Intrusion Pa
Possible hydraulic
connectivity portal across
Pressure/Eastside Transition
Zone through semipermeable
sediments
Depositional Facies B

7/23/2019 Hydrostratigraphic Analysis of the Northern Salinas Valley 2004
http://slidepdf.com/reader/full/hydrostratigraphic-analysis-of-the-northern-salinas-valley-2004 99/112
Appendix A
Report Glossary

7/23/2019 Hydrostratigraphic Analysis of the Northern Salinas Valley 2004
http://slidepdf.com/reader/full/hydrostratigraphic-analysis-of-the-northern-salinas-valley-2004 100/112
Kennedy/Jenks Consultants
Appendix A: Report GlossaryFinal Report – Hydrostratigraphic Analysis of the Northern Salinas Valley p:\isg-proj\mcwra final rpt\appendixa.doc
A-1
Appendix A: Report Glossary
Acre A measurement of area, equivalent to an area of 43,560 square feet.
Aggradation The building up of the Earth’s surface by deposition. A stream can aggrade byactively building up its channel or floodplain when it has more sediment load that it iscapable of transporting.
Alluvial A term used to describe material that has been deposited by a stream or runningwater.
Alluvial Fan An outspread, gently sloping mass of alluvium deposited where a stream flows from acanyon onto a valley floor.
Alluvial Plain A level or gently sloping land surface produced by extensive deposition of alluvium,usually adjacent to a river that periodically overflows its banks. The alluvial plain maybe situated on a floodplain, delta, or an alluvial fan.
Alluviation The deposition of alluvium along stream courses.
Alluvium A general term for clay, silt, sand, gravel, or similar unconsolidated material depositedduring comparatively recent geologic time by a stream or other body of running water.
Angular Having sharp edges and corners; specifically said of a sedimentary particle showinglittle or no evidence of abrasion from water, wind, or collision with other particles.
Anoxic Greatly reduced in oxygen concentration.
Aquiclude A saturated, but poorly permeable bed, formation, or group of formations that doesnot yield water freely to a well or spring. However, an aquiclude may transmitappreciable water to or from adjacent aquifers.
Aquifer A formation, group of formations, or part of a formation that contains sufficientsaturated permeable material to yield economical quantities of water to wells andsprings.
Aquitard A geologic formation, group of formations, or a part of a formation through whichvirtually no water moves.
Arkosic Rich in feldspar (a commonly occurring rock-forming mineral that makes up 60% of
the earth’s crust), used to describe sandstone made of disintegrated granite.
Bed The smallest unit of rock layering, commonly ranging in thickness from a centimeter toa meter or two and distinguishable from beds above and below.
Bedload The material on the bottom of a stream bed that is carried or rolled along by the forceof the stream. This does not include smaller particles that are held in suspension inthe water.

7/23/2019 Hydrostratigraphic Analysis of the Northern Salinas Valley 2004
http://slidepdf.com/reader/full/hydrostratigraphic-analysis-of-the-northern-salinas-valley-2004 101/112
Kennedy/Jenks Consultants
Appendix A: Report GlossaryFinal Report – Hydrostratigraphic Analysis of the Northern Salinas Valley p:\isg-proj\mcwra final rpt\appendixa.doc
A-2
Brackish Water with a salt and mineral content intermediate between that of normal sea waterand that of normal fresh water.
Braided Stream A stream that divides into a tangled network of several small branching and reunitingshallow channels separated from each other by channel bars. Such a stream cannotcarry all of its load, such as an overloaded stream flowing in a wide channel on afloodplain.
Channel The deepest portion of a stream, bay, or straight.
Channel-lag The material within a stream bed that has enough mass that the force of the waterdoes not move it.
Chert A hard, dense microcrystalline (any crystals that may have formed are so small theycannot be seen by the unaided eye) sedimentary rock, consisting chiefly of quartz (acommon rock-forming mineral composed of silica and oxygen).
Chloride A salt consisting of two elements, one of which is chlorine.
Clast An individual constituent found within a rock or rock layer. It could be a grain or afragment produced by the physical disintegration of a larger rock mass.
Clasts Grains or fragments of sedimentary rock.
Clay A mineral particle having a diameter smaller than 1/256 millimeters (mm), or anextremely fine-grained sediment or soft rock composed primarily of clay minerals.
Coalescing Forming a continuous union.
Coarse-grained When referring to sedimentary rock (in this report) it means the diameter of theaverage grain size larger than 2 mm.
Cone ofDepression
A depression in the ground water table or potentiometric surface that has the shape ofan inverted cone and develops around a well from which water is being withdrawn. Itdefines the area of influence of a well.
Confined Aquifer A formation in which the ground water is isolated from the atmosphere at the point ofdischarge by impermeable geologic formations; confined ground water is generallysubject to pressure greater than atmospheric.
Confining layers A body of impermeable or distinctly less permeable material stratigraphically adjacentto one or more aquifers.
Conformable Strata characterized by an unbroken sequence in which the layers are formed oneabove the other in parallel order by uninterrupted deposition.
Conglomerate A coarse-grained sedimentary rock composed of fragments from pre-existing rocks,consisting of rounded rock fragments larger than 2 mm in diameter (granules,pebbles, cobbles, boulders) cemented together in a fine-grained matrix of sand or silt,with calcium carbonate, iron oxide, silica, or hardened clay acting as the cementingagent.

7/23/2019 Hydrostratigraphic Analysis of the Northern Salinas Valley 2004
http://slidepdf.com/reader/full/hydrostratigraphic-analysis-of-the-northern-salinas-valley-2004 102/112
Kennedy/Jenks Consultants
Appendix A: Report GlossaryFinal Report – Hydrostratigraphic Analysis of the Northern Salinas Valley p:\isg-proj\mcwra final rpt\appendixa.doc
A-3
Connate Water trapped in the void spaces of sedimentary rock at the time the rock wasdeposited.
Contamination The degradation of natural water quality as the result of man's activities. There is noimplication of any specific limits, because the degree of permissible contaminationdepends upon the intended end use, or uses, of the water.
Contour A line on a map that connects points of equal value.
Cross-bedded Cross-bedding in sandstone is among the most common of all sedimentarystructures. The cross-bedding structure consists of thin layers that cross over eachother within a rock or rock layer. They typically consist of sand that has beendeposited by wind or water. The layers create a pattern that lets geologists know thedirection of the wind or water and which way was “up” during deposition.
Cross-Section A diagram or drawing that shows the features transected by a vertical plane. A
geologic cross-section shows the surface and subsurface geology in a verticaltransect through the Earth; the cross-section line indicates the location of the verticalplane.
Debris Flow A moving mass of rock fragments, soil, and mud.
Deposition The laying-down of rock-forming material, such as by the mechanical settling ofsediments from suspension in water.
Depositional Involving the laying-down of rock-forming material by any natural agent (such as windor water).
Depositional
Environment
The environmental setting (e.g., fluvial, estuarine, shallow marine, deep marine,
lacustrine, deltaic, etc.) in which sediments are deposited.
Detrital Formed from loose rock and mineral material produced by mechanical means (beingbroken down the contact with other particles carried by wind or water).
Dip The way the “steepness” of geologic features is defined. It is the angle that a stratumor planar feature makes with the horizontal, measured perpendicular to the strike (thelevel line across a sloping plane) and in the vertical plane.
Distal A deposit formed at a considerable distance from where it was deposited.
Distributary Stream A divergent stream flowing away from the main stream and not returning to it, such asin a delta or on an alluvial fan. (Antonym = tributary.)
Drainage Basin A region surrounded by elevated land whose drainage converges to a single stream.
Drawdown The distance between the static water level and the surface of the cone ofdepression.
Drilling Fluid A water- or air-based fluid used in the water well drilling operation to remove cuttingsfrom the hole, to clean and cool the bit, to reduce friction between the drill string andthe sides of the hole, and to seal the borehole.

7/23/2019 Hydrostratigraphic Analysis of the Northern Salinas Valley 2004
http://slidepdf.com/reader/full/hydrostratigraphic-analysis-of-the-northern-salinas-valley-2004 103/112
Kennedy/Jenks Consultants
Appendix A: Report GlossaryFinal Report – Hydrostratigraphic Analysis of the Northern Salinas Valley p:\isg-proj\mcwra final rpt\appendixa.doc
A-4
Dune sand A mound, ridge, or hill of wind-blown sand, either bare or covered with vegetation.
Eolian Pertaining to the wind; said of erosion and deposition accomplished by the wind.
Estuarine Of, pertaining to, or formed in a tidal mouth of a river valley where fresh water comesinto contact with sea water and where tidal effects are evident.
Estuarine Deposits Sedimentary deposits laid down in the brackish water of an estuary, characterized byfine-grained sediments (predominantly clay and silt) of marine and fluvial origin mixedwith decomposed terrestrial organic matter.
Estuary A partially enclosed coastal body of water where the tide meets the current of astream. The seaward end of a river valley where fresh water comes into contact withseawater and where tidal effects are evident.
Eustatic Pertaining to global changes in sea level that affect all oceans. Eustatic changes
during the past few million years were caused by variations in the volume ofcontinental ice caps.
Facies The characteristics of a rock unit, usually reflecting the conditions of its origin. Theoverall aspect or set of characteristics of a rock, which reflects its particulardepositional environment and distinguishes it from adjacent facies within the samerock unit.
Fauna The entire animal population, living or fossil, of a given area, environment, formation,or time span.
Fine-grained Rock or soil in which the particles have an average diameter less than 1/16 mm.
Floodplain The relatively flat portion of a river valley adjacent to a river channel that becomescovered with water when the river overflows its banks. It is built of alluvium carried bythe river during floods and deposited in the sluggish water beyond the influence of theswiftest current. Floodplain deposits commonly comprise abundant silt and clay.
Fluvial Pertaining to rivers or produced by the action of a stream or river.
Foraminifer A single-celled organism which can sometimes be used to tell how old a rock is.
Foraminiferal A protozoan belonging to the subclass Sarcodina, order Foraminifera, with a test(shell) that consists of secreted calcite or agglutinated particles.
Forebay An area where water may percolate through the underlying soils to recharge groundwater supplies.
Formation A body of rock identified by lithic characteristics and stratigraphic position.
Friable A rock or mineral that is easily crumbled.
Geographic Looking at different aspects of regions or areas of the earth’s surface.

7/23/2019 Hydrostratigraphic Analysis of the Northern Salinas Valley 2004
http://slidepdf.com/reader/full/hydrostratigraphic-analysis-of-the-northern-salinas-valley-2004 104/112
Kennedy/Jenks Consultants
Appendix A: Report GlossaryFinal Report – Hydrostratigraphic Analysis of the Northern Salinas Valley p:\isg-proj\mcwra final rpt\appendixa.doc
A-5
GeographicalInformation System(GIS)
A computer system used to capture, store, check, integrate, manipulate, analyze anddisplay data related to positions on the Earth's surface. Typically, GIS is used forhandling maps with multiple layers of information about a given area or region.
Geologic formation A body of rock that consists dominantly of a certain rock type or combination of rocktypes.
Ghyben-HerzbergPrinciple
A ratio describing the static relation of fresh ground water and saline ground water incoastal areas. For each foot of fresh water head above sea level, the salt watersurface is displaced to 40 feet below sea level, i.e., in a ratio of 1:40.
Glacio-eustatic Worldwide changes in sea level caused by the melting or freezing of glaciers.
Granitic Made of a plutonic rock (a rock that was formed from molten material at great depthbelow the earth’s surface). Granite consists of 10 to 50 percent quartz and 65 to 90percent feldspar (a very common rock-forming mineral that makes up sixty percent of
the earth’s crust).
Gravel Unconsolidated natural accumulation of rounded rock pieces, mostly of particleslarger than sand (greater than 2mm in diameter).
Ground WaterBasin
A subsurface structure having the character of a basin with respect to the collection,retention, and outflow of water.
Ground WaterTable
The surface between the zone of aeration (vadose zone) and the zone of saturation;the surface of an unconfined aquifer. Also referred to as “water table.”
Head Energy contained in a water mass, produced by elevation, pressure, or velocity.
Holocene An epoch of the Quaternary period, from the end of the Pleistocene (approximately10,000 years ago) to the present time. (Synonym = “Recent”.)
Hydraulic Moving of a fluid (especially water) under pressure.
Hydrauliccommunication
Fluid flow between varying basins or hydraulic compartments or types (such asbetween groundwater and surface water or between two different aquifers).
HydraulicConductivity
Permeability coefficient; the rate of flow of water in gallons per day through a cross-section of 1 square foot under a unit of hydraulic gradient.
Hydraulic gradient The difference in elevation of the surface of the groundwater at two (or more) pointsdivided by the distance of travel between the points.
Hydrogeologic Those factors that deal with subsurface waters and related geologic aspects ofsurface waters.
Hydrogeology The science of subsurface waters and geologic aspects of surface water.
Hydrostaticpressure
The pressure exerted by the water at any given point in a body of water at rest.

7/23/2019 Hydrostratigraphic Analysis of the Northern Salinas Valley 2004
http://slidepdf.com/reader/full/hydrostratigraphic-analysis-of-the-northern-salinas-valley-2004 105/112
Kennedy/Jenks Consultants
Appendix A: Report GlossaryFinal Report – Hydrostratigraphic Analysis of the Northern Salinas Valley p:\isg-proj\mcwra final rpt\appendixa.doc
A-6
Hydrostratigraphic Grouping of rock/sedimentary units based on the capacity of the rock, sediment, orsoil to transmit water.
Hydrostratigraphy The identification of units of rock or soil layers below the earth’s surface on the basisof hydraulic properties (aquifer/aquitards).
Igneous Rocks Rocks that solidified from molten or partly molten material, that is, from magma.
Incision The process whereby a downward-eroding stream deepens its channel or produces anarrow, steep-walled valley. Incision can occur as a result of a eustatic or relative fallin sea level, which lowers the base level of a stream or river flowing to the ocean.
Interbedded When rock layers or beds are lying between or alternating with others layers or bedsof different character.
Intercalated When layered material exists or is introduced between layers of a different character.
Interchannel The area between active fluvial channels. The interchannel area is part of thefloodplain, and is dominated by fine-grained sedimentary deposits.
Interfinger When a series of wedge-shaped layers are found within a material of a differentcharacter.
Inundation Covered, as with a flood.
Ion An electrically charged atom or group of atoms.
Isochlor Line of equal concentration of chloride ions.
Lacustrine Pertaining to, produced by, or formed in a lake.
Lenticular Resembling in shape the cross section of a lens (a shape that bulges in the middleand pinches out on either side).
Lithic Pertaining to or made of stone.
Lithofacies Lithological characteristics of a formation. A mappable subdivision of a designatedstratigraphic unit, distinguished from adjacent subdivisions on the basis of lithology,including all mineralogic, petrographic, and paleontologic characteristics that influencethe appearance, composition, or texture of the rock.
Lithology Physical character or description of rocks, such as color, grain size, and mineral
composition.
mg/l Milligrams per liter
Miocene An epoch of the early Tertiary period.
Mollusc An invertebrate belonging to the phylum Mollusca. Molluscs include gastropods (e.g.,snails), pelecypods (e.g., clams), and cephalopods (e.g., squids). (Also referred to asmollusks.)

7/23/2019 Hydrostratigraphic Analysis of the Northern Salinas Valley 2004
http://slidepdf.com/reader/full/hydrostratigraphic-analysis-of-the-northern-salinas-valley-2004 106/112
Kennedy/Jenks Consultants
Appendix A: Report GlossaryFinal Report – Hydrostratigraphic Analysis of the Northern Salinas Valley p:\isg-proj\mcwra final rpt\appendixa.doc
A-7
Morphology The shape of the earth’s surface (i.e. mountains and stream beds are part of themorphology).
MSL Mean sea level; the average height of the sea between high and low tides.
Mudstone A blocky fine-grained sedimentary rock like shale but it does not have the layeredcharacter of shale.
Onlap A unique rock layer that overlaps a different rock layer and is characterized by theregular and progressive pinching out, toward the margins or shores of a depositionalbasin, of the sedimentary units within a conformable sequence of rocks. Theboundary of each unit is transgressed by the next overlying unit and each unit in turnterminates farther from the point of reference. This is created when a depositionalbasin has an elevation gain at the end farthest from the source of deposition.Therefore the shape of the bottom of the deposition is created by the existing shapeof the basin.
Outcrop The part of a geologic formation or structure that appears at the surface of the earth.
Outwash Sand and gravel deposited by melt-water streams from an active glacier.
Overbank deposit Silt and clay deposited from suspension on a flood plain by floodwaters that flow overthe banks of the stream channel.
Overdraft Withdrawal of ground water in excess of replenishment.
Oxidizes Causes the process of combining with oxygen.
Perched
groundwater
Unconfined groundwater separated from the underlying main body of groundwater by
a restrictive layer (typically clay).
Percolate The act of water seeping or filtering through the soil without a definite channel.
Permeability The capacity for transmitting a fluid. This is a measurement of the relative ease inwhich fluid will flow through a given material.
Permeability The property or capacity of a porous rock, sediment, or soil for transmitting a fluid; it isa measure of the relative ease of fluid flow under unequal pressure.
PiezometricSurface
An imaginary surface representing the total head of ground water and defined by thelevel to which water will rise in a well. The water table is a particular piezometricsurface. (Synonym = potentiometric surface.)
Pleistocene An epoch of the Quaternary period that began 2-3 million years ago and lasted untilthe start of the Holocene approximately 10,000 years ago.
Pliocene The final epoch of the Tertiary period.
Porcelaneous chert A hard, opaque chert (a hard microcrystalline rock containing mostly quartz) having asmooth fracture surface and a typically china-white appearance resembling chinawareor glazed porcelain.

7/23/2019 Hydrostratigraphic Analysis of the Northern Salinas Valley 2004
http://slidepdf.com/reader/full/hydrostratigraphic-analysis-of-the-northern-salinas-valley-2004 107/112
Kennedy/Jenks Consultants
Appendix A: Report GlossaryFinal Report – Hydrostratigraphic Analysis of the Northern Salinas Valley p:\isg-proj\mcwra final rpt\appendixa.doc
A-8
PorcelaneousChert
Hard, opaque chert having a smooth surface and china-white appearance.
Porosity The percentage of the bulk volume of a rock or soil that is occupied by interstices,whether isolated or connected.
ppm Parts per million.
Prograde The building outward or forward of a succession of sediment (or delta, or alluvial fan,or shoreline) by deposition and accumulation of sediment.
Provenance A place of origin, specifically the area from which the constituent materials of asedimentary rock or facies are derived.
Proximal Said of a deposit formed close to were the constituents of that deposition havederived.
Quaternary A period of geologic time that began 2 to 3 million years ago and extends to thepresent.
Recharge Processes by which there is an addition of water to the aquifer.
Recharge The addition of water to the zone of saturation; also, the amount of water added.
Regression The retreat of the sea from land areas. (Antonym = transgression.)
RWQCB Regional Water Quality Control Board
Sand A detrital particle smaller than a granule and larger than a silt grain, having a diameter
in the range of 1/16 to 2 mm.
Sandstone A sedimentary rock composed of abundant rounded or angular fragments of sand setin a fine-grained matrix (silt or clay) and more or less firmly united by a cementingmaterial.
Sea Level A popular synonym for mean sea level.
Seawater Intrusion When seawater replaces fresher water within an aquifer.
Sediment Solid fragmental material (e.g., gravel, sand, silt, clay, etc.) that originates fromweathering of rocks and is transported or deposited by air, water, or ice.
Sedimentary Describes a rock or layer of rock that was formed by the deposition of particles thatbecome cemented together.
Sedimentary Rock A layered rock resulting from the consolidation of sediment.
Shale A fine-grained sedimentary rock, formed by the consolidation of clay, silt, or mud. It ischaracterized by finely laminated structure and is sufficiently indurated so that it willnot fall apart on wetting.

7/23/2019 Hydrostratigraphic Analysis of the Northern Salinas Valley 2004
http://slidepdf.com/reader/full/hydrostratigraphic-analysis-of-the-northern-salinas-valley-2004 108/112
Kennedy/Jenks Consultants
Appendix A: Report GlossaryFinal Report – Hydrostratigraphic Analysis of the Northern Salinas Valley p:\isg-proj\mcwra final rpt\appendixa.doc
A-9
Shale Fine-grained sedimentary rock with thin layers. It is formed by the compaction of clay,silt, or mud.
Siliceous Shale A hard, fine-grained sedimentary rock with as much as 85% silica.
Silt A particle finer than fine sand and coarser than clay.
Siltstone A rock made of silt having the texture and composition of shale but lacking its finelayering.
Static Water Level The level of water in a well that is not being affected by withdrawal of ground water.
Strata Layers of sedimentary rock.
Stratigraphy The study of rock strata, especially of their distribution, deposition, and age.
Suboxic Simultaneously low in oxygen and low in sulfide.
Terrane Rock or group of rocks and the area in which they crop out.
Tertiary The period of geologic time covering the span of time between 65 million years agoand 2 million years ago.
Total DissolvedSolids (TDS)
A term that expresses the quantity of dissolved material in a sample of water.
Transgression The spread of the sea over land areas; also known as a marine transgression. Atransgression can occur from a rise in eustatic sea level or a relative rise in sea level(e.g., a rise in sea level caused by the subsidence of land). (Antonym = regression.)
Tributary A stream that feeds, joins, or flows into a larger stream or lake. (Antonym =distributary.)
Unconfined Aquifer An aquifer where the water table is exposed to the atmosphere through openings inthe overlying materials.
Unconfinedgroundwater
Groundwater that has a free water table, meaning it is not confined under pressurebeneath relatively impermeable strata.
USGS United States Geological Survey
Water Table The surface between the zone of aeration (vadose zone) and the zone of saturation
(ground water). That surface of a body of unconfined ground water at which thepressure is equal to that of the atmosphere. Also referred to as “ground water table.”
Watershed A drainage basin.
Well Yield The volume of water discharge from a well in gallons per minute or cubic meters perday.

7/23/2019 Hydrostratigraphic Analysis of the Northern Salinas Valley 2004
http://slidepdf.com/reader/full/hydrostratigraphic-analysis-of-the-northern-salinas-valley-2004 109/112
Appendix B
List of References Reviewed

7/23/2019 Hydrostratigraphic Analysis of the Northern Salinas Valley 2004
http://slidepdf.com/reader/full/hydrostratigraphic-analysis-of-the-northern-salinas-valley-2004 110/112
Kennedy/Jenks Consultants
Appendix B: List of References ReviewedFinal Report – Hydrostratigraphic Analysis of the Northern Salinas Valley p:\isg-proj\mcwra final rpt\appendixb.doc
B-1
Appendix B: List of References Reviewed
Author Date Title
Anderson-Nichols/West November 1984 Salinas River Study Phase I Report River Morphologyand Behavior
Anderson-Nichols/West August 1985 Salinas Valley water Appropriation Study
Anderson-Nichols/West October 1985 Salinas River Study Phase II Report River Management
Anonymous 1909 Irrigation Edition Salinas Valley Rustler
Anonymous 8 February 1949 Groundwater in California with Particular Reference toSalinas Valley
Ares, Gene February 1982 A Study and Report of the Possible Long-term Effectsof Sodium on the Castroville Area Soils when Irrigatedwith Water from the 900 Foot Aquifer Pumped from
Monterey County’s Deep WellBond, L.D. Unk. The Role of Leakage in the Sea Water Intrusion of a
Confined Coastal Aquifer.
Boyle Engineering Corp. December 1987 Salinas Valley Ground Water Model Alternative Analysis
Brown, Dick 6 May 1986 Geologic Study of 13S/2E and 14S/2E of Salinas ValleyDraft Report
Bunte Jr., Loran 16 September 1959 Summary of Reports on Water Supply andDevelopment of Salinas Basin
Burns, Tom June 1976 Causes, Rates and Effects of Seawater Intrusion in theLower Salinas Valley, Monterey County, California.Senior Thesis
Cleath and Associates March 1991 Hydrogeologic Investigation Salinas Valley DispersedWell System Area
Conkling, Harold 1933 Report on Salinas Basin Preliminary Investigation
Department of Water Resources June 1970 Sea-Water Intrusion, Lower Salinas Valley ProgressReport 1968-1969
Department of Water Resources July 1973 Sea Water Intrusion, Lower Salinas Valley
Department of Water Resources 1946 Bulletin 52 Salinas Basin Investigation
Department of Water Resources July 1981 Sea Water Intrusion Salinas and Pajaro Rivers
Dupre, 1990 Quaternary Geology of the Monterey Bay Region,California
Earthware February 1992 Lithologic logs from Geobase Vol. I
Earthware February 1992 Lithologic logs from Geobase Vol. II
Earthware Unk. Borehole Log Templates
Earthware Unk. Getting Started with Geobase
Earthware Unk. Geobase v. 7.01
EDAW August 1994 Salinas River Basin Management Plan Alternatives Analysis
Fugro West, Inc. October 1994 Salinas River Basin Management Plan Hydrogeologic Assessment Report

7/23/2019 Hydrostratigraphic Analysis of the Northern Salinas Valley 2004
http://slidepdf.com/reader/full/hydrostratigraphic-analysis-of-the-northern-salinas-valley-2004 111/112
Kennedy/Jenks Consultants
Appendix B: List of References ReviewedFinal Report – Hydrostratigraphic Analysis of the Northern Salinas Valley p:\isg-proj\mcwra final rpt\appendixb.doc
B-2
Author Date Title
Fugro West, Inc. August 1995 Salinas River Basin Management Plan Salinas ValleyGeohydrologic Study
Grasty, James W June 1988 A Gravity and Magnetic Study of the Armstrong Ranch Area, Monterey County, California
Greene, H. Gary 1970 Geology of Southern Monterey Bay and its Relationshipto the Ground Water Basin and Salt Water Intrusion
Greene, H. Gary 1977 Geology of the Monterey Bay Region
Hall, Phillip May 1992 Selected Geologic Cross Sections in the Salinas Valleyusing Geobase
Hamlin, Homer 1904 Water Resources of the Salinas Valley, California
Hanson, R.T., Everett, R.H.,Newhouse, M.W., Crawford, S.M.,Pimentel, I.S.
2 April 2001 Preliminary Draft - Geohydrology of the DeepMonitoring Well at Marina, Monterey County, California(U.S. Geological Survey Water-ResourcesInvestigations Report 01-xxxx)
Harding ESE 12 April 2001 Final Report Hydrogeologic Investigation of the SalinasValley Basin in the Vicinity of Fort Ord and MarinaSalinas Valley, California
Heard, J.E. December 1992 Hydrogeology of High-Salinity Groundwater in the“180-foot” Pressure Aquifer, southwest Salinas,Monterey County, California Master’s Thesis
John Mann, Ph.D., Cleath and Associates
1 October 1991 Well Selection Studies Castroville Area Sea WaterIntrusion Project
Johnson, Michael July 1983 Ground Water in North Monterey County, California,1980 (U.S. Geological Survey Water ResourcesInvestigation Report 83-4023)
Kenneth D. Schmidt March 1985 Results of November 1994 Aquifer Test near Castroville
Kenneth D. Schmidt and Associates
July 1989 Results of Three-day Aquifer Test at Spreckels inJanuary 1989
Kenneth D. Schmidt and Associates
July 1989 Results of Three-day Aquifer Test at Spreckels inJanuary 1989
Leedshill-Herkenhoff, Inc. 1984 Salinas Valley Seawater Intrusion Study PreliminaryTask Report 1
Leedshill-Herkenhoff, Inc. January 1985 Salinas Valley Seawater Intrusion Study
Luhdorff and Scalmanini February 1986 State WRCB Groundwater “Hot Spots” Project WellTesting and Site Characterization Salinas Area FinalReport
Manning, J.C. 1963 Resume of Ground Water Hydrology in Salinas Valley,California (American Association of Petroleum
Geologists – Society of Economic Paleontologists andMineralogist Annual Spring Field Trip Guidebook:Geology of the Salinas Valley and the San AndreasFault.
Monterey County Flood Controland Water Conservation district
May 1960 Salinas Valley Geologic Investigation
Monterey County Flood Controland Water Conservation District
May 1968 Investigation of an East Side Canal Project SalinasValley

7/23/2019 Hydrostratigraphic Analysis of the Northern Salinas Valley 2004
http://slidepdf.com/reader/full/hydrostratigraphic-analysis-of-the-northern-salinas-valley-2004 112/112
Kennedy/Jenks Consultants
Author Date Title
Monterey County WaterResources Agency
May 1993 Approval of Change Order to MSA with Staal, Gardner& Dunne
Monterey County WaterResources Agency
January 1998 Compilation of Geologic Cross Sections of the SalinasValley
Monterey Peninsula WaterManagement District
July 1997 Technical Memorandum 97-04 summary of 1996Seaside Basin Monitor Well Installations
Pettit, Walt September 1993 Letter to Rick Antle: Salinas Valley Groundwater BasinSeawater Intrusion
Salinas Valley Groundwater BasinHydrology Conference
June 1995 Hydrogeology and Water Supply of Salinas Valley
Salinas Valley ReclamationProject Castroville SeawaterIntrusion Project
March 2001 Seawater Intrusion Program
Staal, Gardner & Dunne, Inc. July 1993 Hydrogeologic Study Salinas Valley Groundwater Basin
Seawater Intrusion Delineation/Monitoring WellConstruction Program
Staal, Gardner & Dunne, Inc. 9 March 1993 Proposal for Hydrogeologic Services
Thorup, Richard R. 20 April 1976 Report On Castroville Irrigation Project Deep Test Hole And Freshwater Bearing Strata Below the 400 Foot Aquifer, Salinas Valley, California
Thorup, Richard R. 20 March 1985 Summary Hydrogeological Report on the Relationshipof the 4 Recently Completed Water Wells On Fort OrdMilitary Reservation to the Salinas Valley 180 and400 Foot Aquifers
Tinsley III, John August 1975 Quaternary Geology of Northern Salinas Valley,Monterey County, California Dissertation
Todd, D.K. September 1988 Initial Assessment of Seawater Intrusion by WellLeakage into the 400-foot Aquifer, Castroville Area
Todd, D.K. June 1989 Sources of Saline Intrusion in the 400- Foot Aquifer,Castroville Area, California.
U.S. Army Corps of Engineers May 1979 Salinas-Monterey Bay Area Urban Study Draft Annex F
Y t E B 1988 Si l t d Eff t f G d t M t