Embed Size (px)
Citation preview
Hyosung Corporation and Subsidiaries Consolidated Financial Statements December 31, 2017 and 2016

Hyosung Corporation and Subsidiaries Index December 31, 2017 and 2016
Page(s)
Independent Auditor’s Report ........................................................................................................ 1 - 6
Consolidated Financial Statements ..................................................................................................... 7
Consolidated Statements of Financial Position....................................................................................... 8
Consolidated Statements of Profit or Loss .............................................................................................. 9
Consolidated Statements of Comprehensive Income ............................................................................ 10
Consolidated Statements of Changes in Equity.................................................................................... 11
Consolidated Statements of Cash Flows .............................................................................................. 12
Notes to Consolidated Financial Statements .................................................................... ……... 13 - 121

Independent Auditor’s Report
(English Translation of a Report Originally Issued in Korean) To the Board of Directors and Shareholders of Hyosung Corporation We have audited the accompanying consolidated financial statements of Hyosung Corporation and its subsidiaries (collectively referred to as the "Group"), which comprise the consolidated statements of financial position as at December 31, 2017 and 2016, and the consolidated statements of profit or loss, consolidated statements of comprehensive income, consolidated statements of changes in equity and consolidated statements of cash flows for the years then ended, and notes to the consolidated financial statements, including a summary of significant accounting policies and other explanatory information. Management’s Responsibilities for the Financial Statements Management is responsible for the preparation and fair presentation of the consolidated financial statements in accordance with International Financial Reporting Standards as adopted by the Republic of Korea (Korean IFRS) and for such internal control as management determines is necessary to enable the preparation of the consolidated financial statements that are free from material misstatement, whether due to fraud or error. Auditor’s Responsibilities Our responsibility is to express an opinion on the consolidated financial statements based on our audits. We conducted our audits in accordance with Korean Standards on Auditing. Those standards require that we comply with ethical requirements and plan and perform the audit to obtain reasonable assurance about whether the consolidated financial statements are free from material misstatement. An audit involves performing procedures to obtain audit evidence about the amounts and disclosures in the consolidated financial statements. The procedures selected depend on the auditor’s judgment, including the assessment of the risks of material misstatement of the consolidated financial statements, whether due to fraud or error. In making those risk assessments, the auditor considers internal control relevant to the entity’s preparation and fair presentation of the consolidated financial statements in order to design audit procedures that are appropriate in the circumstances, but not for the purpose of expressing an opinion on the effectiveness of the entity’s internal control. An audit also includes evaluating the appropriateness of accounting policies used and the reasonableness of accounting estimates made by management, as well as evaluating the overall presentation of the consolidated financial statements. We believe that the audit evidence we have obtained is sufficient and appropriate to provide a basis for our audit opinion.

2
Opinion In our opinion, the accompanying consolidated financial statements present fairly, in all material respects, the consolidated financial position of Hyosung Corporation and its subsidiaries as at December 31, 2017 and 2016, and its consolidated financial performance and its consolidated cash flows for the years then ended in accordance with Korean IFRS. Emphasis Matters1 Without qualifying our opinion, we draw attention to the following area of focus.
(1) Auditor's emphasis on the area of focus on construction contracts.
Area of focus on construction contracts in accordance with the Practical Guidance of Auditing Standard 2016-1 are those matters that, in the auditor’s professional judgment and communication with those charged with governance, were of most significance in the audit of the consolidated financial statements of the current period. These matters were addressed in the context of the audit of the consolidated financial statements as a whole, and in forming our opinion thereon, and we do not provide a separate opinion on these matters. We have addressed the output of the audit process for the area of focus as below in forming an audit opinion on the consolidated financial statements of Hyosung Corporation and its subsidiaries as a whole. A. General Information
Common information applied to the area of focus on construction contract described in this audit report are as follows: As explained in the Note 2 to the consolidated financial statements (Significant Accounting Policies), the Group recognizes contract revenue and contract costs associated with the construction contract as revenue and expense respectively based on the percentage of completion of the contract activity at the end of the reporting period when the outcome of a construction contract can be estimated reliably. The percentage of completion of the contract activity is the proportion that costs incurred to date, excluding any contract cost that does not reflect the work performed, bear to the estimated total costs of the contract. The Group presents the gross amount due from customers for contract work as an asset for all contracts in progress for which costs incurred plus recognized profits (less recognized losses) exceed progress billings, and presents the gross amount due to customers for contract work as a liability for all contracts in progress for which progress billings exceed costs incurred plus recognized profits (less recognized losses). The Group’s operating segments which apply accounting policies of construction contract are construction segment and part of heavy industrial segment. 1 This paragraph is being included in accordance with the Practical Guidance of Auditing Standard 2016-1, Practical Guidance for Special Consideration in Auditing Construction Contracts, prescribed by Korean Institute of Certified Public Accountants, and should not be considered as a communication of key audit matter described in the International Standards on Auditing 700 (Revised).

3
B. Input method
As explained in the Note 3 to the consolidated financial statements (Critical Accounting Estimates and Assumptions), total contract revenue is measured based on the initial amount of revenue agreed in the contract. However, the measurement of contract revenue is affected by a variety of uncertainties that depend on the outcome of future event; for example, the amount of contract revenue may increase as a result of variations in contract work, claims and incentive payments, on the other hand, the amount of contract revenue may decrease as a result of penalties arising from delays caused by the Group in the completion of the contract. The measurement of contract revenue is also affected by the percentage of completion measured based on the aggregated amount costs incurred. Total contract costs are estimated based on future estimates of material costs, labor costs, construction period and others. Uncertainty of estimating total contract revenue and the changes in estimated total contract revenue and costs may have negative impacts on the profit or loss for the current period (or for the succeeding year); therefore, we identified revenue recognition based on the input method as a significant risk. As at December 31, 2017, in respect of the Group’s revenue recognition based on the input method, we have performed the following audit procedures.
- We assessed whether the accounting policy of revenue recognition is appropriate. - We reviewed major contract terms and conditions. - We reviewed the Group’s internal control over reviews and approvals of new contracts by
personnel with appropriate authority. C. Uncertainty of estimated total contract costs (or estimated construction costs)
As explained in the Note 3 to the consolidated financial statements (Critical Accounting Estimates and Assumptions) and in the Note 29 to the consolidated financial statements (Construction Contracts), total contract costs are estimated based on future estimates of material costs, labor costs, construction period and others. When the estimated total contract costs increase by 5%, profit before income tax and net assets before income tax effects would decrease by \ 126,924 million.
The measurement of estimated contract costs is affected by variety of uncertainties such as changes in the specifications or design, changes in construction environment, the extension of construction period, fluctuation of material cost, and others. The impacts of changes in estimated total contract costs on the profit or loss for the current period (or for the succeeding year) are considered; therefore, we identified uncertainty of estimated total contract costs as a significant risk.

4
As at December 31, 2017, in respect of the Group’s uncertainty of estimated total contract costs, we have performed the following audit procedures.
- We tested for the internal control activity to approve of total contract cost. - We compared and performed analytical review procedures to determine the rate of cost of
sales (total construction cost / total contract revenue) of each construction site. - We checked whether there were final approvals of the total estimated contract costs and
compared the amounts with the total contract cost in the Group’s financial information systems.
- We reviewed the cause of change for projects with significant fluctuations in total contract costs.
- We made inquiries about the cause of the significant difference in the estimated total contract cost at the end of 2016 and the final cumulative cost incurred of the project which ended during 2017.
D. Measurement of percentage of completion The construction costs incurred of one site can be transferred to another site due to the variance in profit margins of sites and the identified factors causing the increase in the estimation of contract costs may not be reflected in the contract costs timely; therefore, we identified measurement of percentage of completion as a significant risk. As at December 31, 2017, in respect of the Group’s estimated total contract costs and aggregated cost incurred that have impacts on the measurement of percentage of completion, we have performed the following audit procedures.
- We tested the completeness and appropriateness of the aggregate costs incurred. - We reviewed the journal entries prepared for the transfer of incurred expenses between
construction sites. - We tested whether costs are attributed to the corresponding construction sites. - We recalculated the percentage of completion for construction contracts. - We tested internal control of the Group in relation to approval and reporting process of cost
incurred. E. Collectability of the gross amount due from customers for contract work As the collectability of the gross amount due from customers for contract work is in doubt in case of the increase of unsold housing due to the real estate market situation or the deterioration of the financial condition of customers, we identified collectability of the gross amount due from customers for contract work as a significant risk.
5
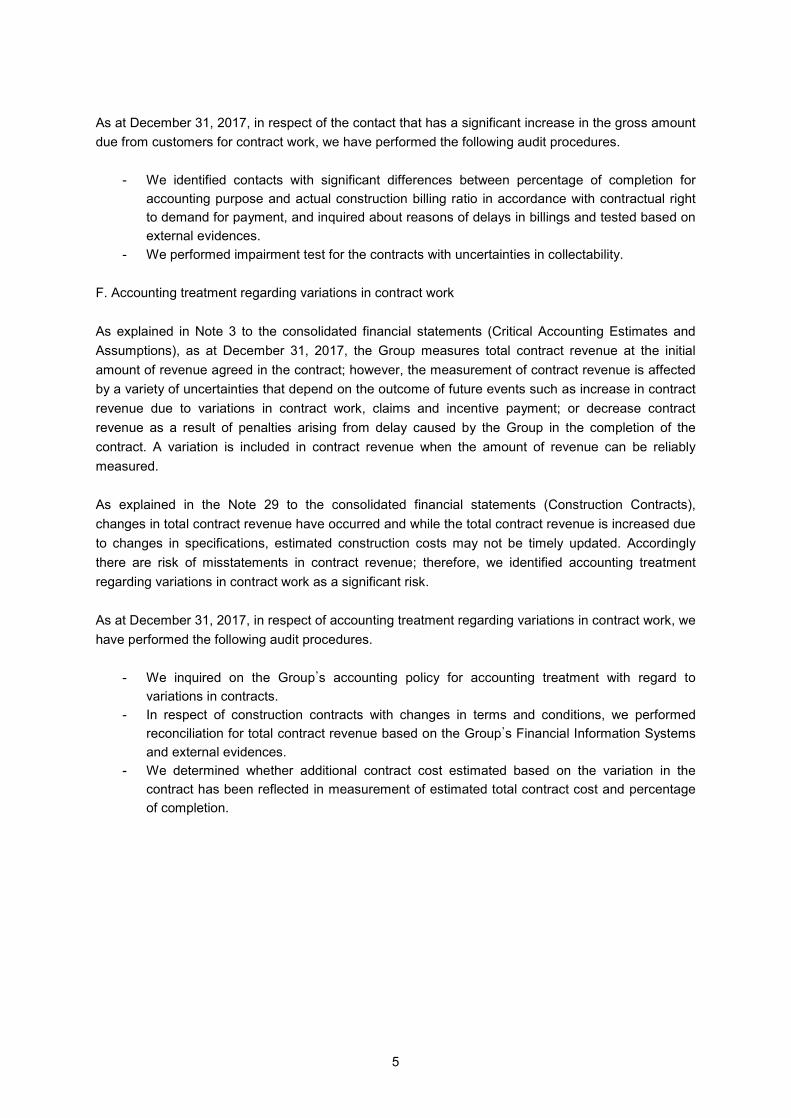
As at December 31, 2017, in respect of the contact that has a significant increase in the gross amount due from customers for contract work, we have performed the following audit procedures.
- We identified contacts with significant differences between percentage of completion for accounting purpose and actual construction billing ratio in accordance with contractual right to demand for payment, and inquired about reasons of delays in billings and tested based on external evidences.
- We performed impairment test for the contracts with uncertainties in collectability. F. Accounting treatment regarding variations in contract work As explained in Note 3 to the consolidated financial statements (Critical Accounting Estimates and Assumptions), as at December 31, 2017, the Group measures total contract revenue at the initial amount of revenue agreed in the contract; however, the measurement of contract revenue is affected by a variety of uncertainties that depend on the outcome of future events such as increase in contract revenue due to variations in contract work, claims and incentive payment; or decrease contract revenue as a result of penalties arising from delay caused by the Group in the completion of the contract. A variation is included in contract revenue when the amount of revenue can be reliably measured. As explained in the Note 29 to the consolidated financial statements (Construction Contracts), changes in total contract revenue have occurred and while the total contract revenue is increased due to changes in specifications, estimated construction costs may not be timely updated. Accordingly there are risk of misstatements in contract revenue; therefore, we identified accounting treatment regarding variations in contract work as a significant risk. As at December 31, 2017, in respect of accounting treatment regarding variations in contract work, we have performed the following audit procedures.
- We inquired on the Group’s accounting policy for accounting treatment with regard to variations in contracts.
- In respect of construction contracts with changes in terms and conditions, we performed reconciliation for total contract revenue based on the Group’s Financial Information Systems and external evidences.
- We determined whether additional contract cost estimated based on the variation in the contract has been reflected in measurement of estimated total contract cost and percentage of completion.

6
(2) Restatement of Prior Year Financial Statements
As explained in the Note 41, the Group has restated its prior year consolidated financial statements to correct the understatement of impairment losses on available-for-sale financial assets for the year ended December 31, 2013. As a result, the retained earnings and other comprehensive income as at December 31, 2016, decreased and increased respectively by \ 24,403 million and there is no impact on the prior year's consolidated statement of profit or loss.
Other Matter Auditing standards and their application in practice vary among countries. The procedures and practices used in the Republic of Korea to audit such financial statements may differ from those generally accepted and applied in other countries. Seoul, Korea February 26, 2018
This report is effective as of February 26, 2018, the audit report date. Certain subsequent events or circumstances, which may occur between the audit report date and the time of reading this report, could have a material impact on the accompanying consolidated financial statements and notes thereto. Accordingly, the readers of the audit report should understand that there is a possibility that the above audit report may have to be revised to reflect the impact of such subsequent events or circumstances, if any.

(Attachment) Consolidated Financial Statements
Hyosung Corporation and Subsidiaries
The 63th period
From January 1st, 2017 to December 31st, 2017
The 62th period
From January 1st, 2016 to December 31st, 2016
"The attached consolidated financial statements were prepared by the Company."
CEO Kyu-Young Kim of Hyosung Corporation
The seat of
headquarter :
Road name
address 119 Mapo-daero, Mapo-gu, Seoul, Korea.
Phone number (02) 707-7000

Hyosung Corporation and SubsidiariesConsolidated Statements of Financial Position December 31, 2017 and 2016
(in millions of Korean won) Notes
AssetsCurrent assets
Cash and cash equivalents 4, 7, 8, 9 \ 501,133 \ 431,707Trade and other receivables 4, 6, 7, 10, 19 2,013,675 1,736,071Due from customers for contract work 4, 7, 29 140,355 116,982Other financial assets 4, 7, 11 82,976 50,326Other current assets 13 190,579 169,152Inventories 14 1,679,932 1,524,770Current tax assets 22,330 19,438
4,630,980 4,048,446Non-current assets
Long-term trade and other receivables 4, 7, 10, 19 313,040 305,046Property, plant and equipment 5, 15 5,663,176 5,845,022Investment property 5, 16 550,217 628,823Intangible assets 5, 17 318,130 420,070Investments in associates 18, 19 117,238 115,373Other financial business assets 4, 7, 12 2,240,413 2,091,145Other non-current financial assets 4, 7, 9, 11 580,452 552,834Other non-current assets 13 65,686 62,766Deferred tax assets 23 55,646 51,276
9,903,998 10,072,355Total assets \ 14,534,978 \ 14,120,801
LiabilitiesCurrent liabilities
Trade and other payables 4, 7, 19, 21 \ 2,073,793 \ 1,786,517Due to customers for contract work 29 78,409 98,278Borrowings 4, 6, 7, 20 4,916,997 4,380,424Other financial liabilities 4, 7, 11 4,088 29,504Current tax liabilities 83,601 150,204Other current liabilities 24 444,292 438,150
7,601,180 6,883,077Non-current liabilities
Long-term trade and other payables 4, 7, 19, 21 400,492 376,166Long-term borrowings 4, 7, 20 2,345,089 2,662,171Post-employment benefit obligation 22 23,275 43,499Deferred tax liabilities 23 174,324 234,631Other non-current financial liabilities 4, 7, 11 593 7,226Other non-current liabilities 24 126,744 72,815
3,070,517 3,396,508Total liabilities 10,671,697 10,279,585
EquityEquity attributable to owners of the Parent Company
Share capital 25 175,587 175,587Share premium 130,826 130,826Retained earnings 26 3,143,153 2,996,260Other components of equity 11, 23, 27 203,950 316,536
3,653,516 3,619,209Non-controlling interest 39 209,765 222,007Total equity 3,863,281 3,841,216Total liabilities and equity \ 14,534,978 \ 14,120,801
2017 2016
The above consolidated statements of financial position should be read in conjunction with the accompanying notes.
8

Hyosung Corporation and SubsidiariesConsolidated Statements of Profit or LossYears Ended December 31, 2017 and 2016
Notes
Revenue 5, 19, 28, 29 \ 12,546,410 \ 11,929,113
Cost of sales 19, 29, 30 (10,654,352) (9,770,994)
Gross profit 1,892,058 2,158,119
Selling and administrative expenses 30, 31, 32 (1,003,612) (1,025,169)Research and development expenses 30 (117,639) (116,604)
Operating profit 5 770,807 1,016,346
Other income 33 66,841 66,276Other expenses 33 (395,203) (185,300)
Finance income 34 442,823 450,963Finance expenses 34 (509,378) (680,086)
Share of profit of associates accounted for using the equity method, net 18 6,938 28,315
Profit before income tax 382,828 696,514Income tax expense 23 (41,989) (221,112)
Profit for the year \ 340,839 \ 475,402
Profit is attributable to:Owners of the Parent Company 35 \ 325,574 \ 455,526Non-controlling interests 39 15,265 19,876
\ 340,839 \ 475,402
Earnings per share attributable to the equity holders of the Parent Company
Basic earnings per share 35 \ 9,786 \ 13,692
The above consolidated statements of profit or loss should be read in conjunction with the accompanying notes.
(in millions of Korean won, except per share amounts) 2017 2016
9

Hyosung Corporation and SubsidiariesConsolidated Statements of Comprehensive IncomeYears Ended December 31, 2017 and 2016
Notes 2017 2016
Profit for the year \ 340,839 \ 475,402Other comprehensive incomeItems that will not be reclassified to profit or loss
Remeasurements of net defined benefit liability 22 14,004 (2,814)Share of remeasurements of net defined benefit liabilities of associates (742) (295)
Items that may be subsequently reclassified to profit or lossChange in the fair value of available-for-sale financial assets 11, 27 (34,114) 15,360Share of other comprehensive income of associates 18, 27 96 (111)Exchange differences 27 (110,817) 19,170
Other comprehensive income for the year, net of tax (131,573) 31,310
Total comprehensive income for the year \ 209,266 \ 506,712
Total comprehensive income for the year is attributable to:Owners of the Parent Company \ 202,781 \ 483,932Non-controlling interest 6,485 22,780
\ 209,266 \ 506,712
The above consolidated statements of comprehensive income should be read in conjunction with the accompanying notes.
(in millions of Korean won)
10

Hyosung Corporation and SubsidiariesConsolidated Statements of Changes in EquityYears Ended December 31, 2017 and 2016
(in millions of Korean won)
Balance at January 1, 2016 \ 175,587 \ 130,826 \ 2,636,042 \ 315,803 \ 3,258,258 \ 213,855 \ 3,472,113 Total comprehensive income
Profit for the year - - 455,526 - 455,526 19,876 475,402Remeasurements of net defined benefit liability - - (1,618) - (1,618) (1,196) (2,814)Share of remeasurements of net defined benefit liabilities of associates - - (295) - (295) - (295)Change in fair value of available-for-sale financial assets - - - 14,402 14,402 959 15,361Share of other comprehensive income of associates - - - (111) (111) - (111)Exchange differences - - - 16,029 16,029 3,141 19,170
Transactions with ownersDividends paid - - (116,440) - (116,440) (18,480) (134,920)Changes in other additional capital - - - (27) (27) - (27)Others - - (1,358) (5,156) (6,514) 3,852 (2,662)
Balance at December 31, 2016 \ 175,587 \ 130,826 \ 2,971,857 \ 340,940 \ 3,619,210 \ 222,007 \ 3,841,217
Balance at January 1, 2017 \ 175,587 \ 130,826 \ 2,971,857 \ 340,940 \ 3,619,210 \ 222,007 \ 3,841,217 Total comprehensive income
Profit for the year - - 325,574 - 325,574 15,265 340,839 Remeasurements of net defined benefit liability - - 13,384 - 13,384 620 14,004Share of remeasurements of net defined benefit liabilities of associates - - (742) - (742) - (742)Change in fair value of available-for-sale financial assets - - - (33,940) (33,940) (174) (34,114)Share of other comprehensive income of associates - - - 96 96 - 96Exchange differences - - - (101,591) (101,591) (9,226) (110,817)
Transactions with ownersDividends paid - - (166,343) - (166,343) (20,130) (186,473)Changes in other additional capital - - - (149) (149) - (149)Others - - (577) (1,405) (1,982) 1,403 (579)
Balance at December 31, 2017 \ 175,587 \ 130,826 \ 3,143,153 \ 203,951 \ 3,653,517 \ 209,765 \ 3,863,282
Non-controllingInterest
Total EquityShare premiumShare capital Earnings of Equity Total
The above consolidated statements of changes in equity should be read in conjunction with the accompanying notes.
Attributable to owners of the Parent CompanyOther
Retained Components
11

Hyosung Corporation and SubsidiariesConsolidated Statements of Cash FlowsYears Ended December 31, 2017 and 2016
(in millions of Korean won) Notes
Cash flows from operating activitiesCash generated from operations 37 \ 857,417 \ 1,993,923 Income taxes paid (151,873) (142,842)Interest paid (179,904) (191,771)Interest received 150,841 141,127 Dividends received 8,141 12,501
Net cash inflow from operating activities 684,622 1,812,938
Cash flows from investing activitiesProceeds from sale of other receivables 3,751 54,966Proceeds from sale of other financial assets 100,125 130,927Proceeds from sale of long-term other receivables 101,855 155,892Proceeds from sale of property, plant and equipment 7,136 48,730Government grants received 343 1,269Proceeds from sale of investment property 56,419 5,416Proceeds from sale of intangible assets 1,670 7,471Proceeds from sale of investments in associates 724 2,958Proceed from acquistion of subsidiaries, net of cash owened (497) -Proceeds from sale of other non-current assets - 9Acquisition of other receivables (29,791) (96,317)Acquisition of other financial assets (119,546) (102,172)Acquisition of long-term other receivables (183,009) (52,253)Acquisition of other non-current financial assets (191,926) (115,295)Payments for property, plant and equipment (704,262) (903,271)Payments for investment properties (780) (4,326)Payments for intangible assets (11,626) (33,287)Acquisition of investments in associates (700) (8,750)Acquisition of other non-current assets (89) (300)
Net cash outflow from investing activities (970,203) (908,333)
Cash flows from financing activitiesProceeds from short-term borrowings 10,856,705 11,927,716Proceeds from long-term borrowings and issuance of debentures 1,575,293 2,394,653Government grants received 1,830 2,598Proceeds from long-term deposit received 15,670 -Repayment of short-term borrowings (10,367,253) (12,647,162)Repayment of long-term borrowings and debentures (1,525,308) (2,540,099)Dividends paid (166,343) (116,440)Change in non-controlling interest (20,130) (18,480)Repayment of government grants (1,849) (1,134)Repayment of deposit received - (739)
Net cash inflow (outflow) from financing activities 368,615 (999,087)
Effects of exchange rate changes on cash and cash equivalents (13,608) 12,927
Net increase (decrease) in cash and cash equivalents 69,426 (81,555)
Cash and cash equivalents at the beginning of the financial year 431,707 513,262 Cash and cash equivalents at the end of the year in
the consolidated statements of financial position \ 501,133 \ 431,707
2017 2016
The above consolidated statements of cash flows should be read in conjunction with the accompanying notes.
12

Hyosung Corporation and Subsidiaries Notes to Consolidated Financial Statements December 31, 2017 and 2016
13
1. General Information Hyosung Corporation (the “Company”) and its subsidiaries (collectively referred to as the “Group”) primarily manufactures and sells synthetic fiber products and electronic products, and is engaged in construction, financial business, and other related business activities. As at December 31, 2017, the Group has plants in Ulsan, Anyang, Yongyeon, Icheon, Jincheon, Gumi, Daegu, Changwon, and Daejeon. In addition, the Group has subsidiaries and branches all over the world. As at December 31, 2017, the Group’s major shareholders are Cho Hyun Joon (14.27%), and Cho Hyun Sang (12.21%) and Cho Seok Rae (10.18%). 1.1 Consolidated Subsidiaries Details of the consolidated subsidiaries as at December 31, 2017 are as follows:
Subsidiaries
Percentage of
Ownership1
Location
Reporting month
Main business
Gongdeokgyeongwoo development corporation 73.33% Korea December Construction
Forza Motors Korea Corp. 100% Korea December Automotive sale and service
Pohang Renewable Energy, Inc. 100% Korea December Power plant engineering
Somesevit Corparation 57.83% Korea December Service of real estate
Taeansolarfarm Corp. 100% Korea December Solar power generation HanaLandchip Private Real Estate Investment
Trust No.39 77.01% Korea December Service of real estate
Hyosung Goodsprings, Inc. 100% Korea December Manufacture of liquid pump
Hyosung Capital Co., Ltd. 97.15% Korea December Finance factoring
Nautilus Hyosung Inc. 54.02% Korea December Manufacture of ATM
ATM PLUS 28.69% KOREA December CD VAN BUSINESS
NAUTILUS HYOSUNG CMS INC. 54.02% Korea December Cash-in-transit of ATM
NAUTILUS HYOSUNG TECH INC. 54.02% Korea December Maintenance and interior of ATM
Hyosung FMS Inc. 54.02% Korea December Electronic payment agency
Nautilus Hyosung America Inc. 54.02% USA December Sale and maintenance of ATM
Hyosung Financial System (Huizhou) Co., Ltd. 54.02% China December Office machinery and equipment manufacturing
Hyosung Capital the 18th Securitization Specialty Co., Ltd.2 0.49% Korea December Other
Hyosung Capital the 20th Securitization Specialty Co., Ltd.2 0.49% Korea December Other
Hyosung Capital the 21th Securitization Specialty Co., Ltd.2 0.49% Korea December Other
Hyosung Capital the 22th Securitization Specialty Co., Ltd.2 0.49% Korea December Other
Hyosung Capital the 23th Securitization Specialty Co., Ltd.2 0.49% Korea December Other
Hyosung Capital the 24th Securitization Specialty Co., Ltd.2 0.49% Korea December Other
Hyosung Capital the 25th Securitization Specialty Co., Ltd.2 0.49% Korea December Other
HSC the 1st Co., Ltd.2 - Korea December Other HSC the 3rd Co., Ltd.2 0.97% Korea December Other HSCS the 1st Co., Ltd.2 - Korea December Other

Hyosung Corporation and Subsidiaries Notes to Consolidated Financial Statements December 31, 2017 and 2016
14
Subsidiaries
Percentage of
Ownership1
Location
Reporting month
Main business
Hyosung Investment & Development Corporation 58.75% Korea December Real estate development business
Hyosung Trans World Co., Ltd 100% Korea December Intermodal transport arrangements
Baoding Hyosung Tianwei Transformer Co., Ltd. 80% China December Transformer manufacturing
Central Trade Investment Ltd.3 - China December Other
CONSORCIOHYOSUNG-VIMAC,S.A. 100% Panama December Power & systems Performance Unit consortium
GST Global GmbH 100% Germany December Germany holding company
Global Safety Textiles GmbH 100% Germany December Manufacture and Sale of Air-bag cushion and Fabric
Global Safety Textiles LLC 100% USA December Manufacture and sale of air-bag cushion and fabric
GST Safety Textiles RO S.R.L. 100% Romania December Manufacture and sale of air-bag cushion and fabric
Global Safety Textiles U.S. Holdings, Inc. 100% USA December U.S.A holding company GST Automotive Safety Components International
LLC 100% USA December Manufacture and sale of air-bag cushion and fabric
GST Automotive Safety Components International LLC S.A.de C.V. 100% Mexico December
Manufacture and sale of air-bag cushion and fabric
GST Automotive Safety Poland Sp.z.oo 100% Poland December Manufacture and sale of air-bag cushion and fabric
GST Automotive Safety RO S.R.L. 100% Romania December Manufacture and sale of air-bag cushion and fabric
GST Automotive Safety South Africa (Proprietary) Limited 100% South Africa December
Manufacture and sale of air-bag cushion and fabric
GST Automotive Safety UK Limited 100% UK December England holding company
GST Automotive Safety (Changshu) Co., Ltd. 100% China December Manufacture and sale of air-bag cushion and fabric
GST China Investment Limited 100% China December Hong Kong holding company GST SAFETY TEXTILES MEXICO S. de R.L. de
C.V. 100% Mexico December Manufacture and sale of air-bag cushion and fabric
Hyosung Mexico S. de R.L. de C.V. 100% Mexico December Manufacture and sale of air-bag cushion and fabric
HICO America Sales & Tech. 100% USA December General trading
Hyosung (H.K) LIMITED 100% China December General trading Hyosung Brasil industria e comericio de fibras
LTDA 100% Brazil December Manufacture of spandex
Hyosung Brasil Participacoes Brasil LTDA 100% Brazil December Manufacture and sale of tire cords
Hyosung Chemical Fiber (Jiaxing) Co., Ltd. 100% China December Manufacture of polyesters thread and T/C
Hyosung Chemicals (Jiaxing) Co., Ltd. 100% China December Manufacture of chemical product
Hyosung Corporation India Private Limited 100% India December General trading
Hyosung RUS 100% Russia December General trading
Hyosung Europe SRL 100% Italy December General trading
Hyosung (Taiwan) Corporation 100% Taiwan December General trading
Hyosung Holdings USA 100% USA December U.S.A holding company
Hyosung International Trade (Jiaxing) Co., Ltd. 100% China December General trading
Hyosung International (HK) Ltd. 100% China December General trading
Hyosung Istanbul TEKSTIL LTD.STI 76.66% Turkey December Manufacture and sale of spandex
Hyosung Japan Co., Ltd. 100% Japan December General trading
Hyosung Luxembourg S.A 100% Luxembourg December Manufacture and sale of tire cords
Hyosung Resource (Australia) PTY Ltd. 100% Australia December Resources development
Hyosung Singapore PTE Ltd. 100% Singapore December General trading
Hyosung Spandex (GuangDong) Co., Ltd. 100% China December Manufacture and sale of spandex
Hyosung Spandex (Jiaxing) Co., Ltd. 100% China December Manufacture and sale of spandex
Hyosung Spandex (Zhuhai) Co., Ltd. 75% China December Manufacture and sale of spandex

Hyosung Corporation and Subsidiaries Notes to Consolidated Financial Statements December 31, 2017 and 2016
15
Subsidiaries
Percentage of
Ownership1
Location
Reporting month
Main business
Hyosung SRL 100% Romania December Manufacture and sale of tire cords
Hyosung Sumiden Steel Cord (Nanjing) Co., Ltd. 100% China December Manufacture and sale of steel cord
Hyosung Steel Cord (Qingdao) Co., Ltd. 100% China December Manufacture and sale of steel cord
Hyosung USA Inc. 100% USA December Manufacture and sale of tire cords
Hyosung Vietnam Co., Ltd. 88.21% Vietnam December Manufacture of tire cord, Manufacture and sales of spandex
Hyosung DongNai Co., Ltd. 76.66% Vietnam December Manufacture of tire cords and spandex
Hyosung Spandex (Quzhou) Co., Ltd. 88.34% China December Manufacture and sale of spandex Hyosung New Material & High Technology
(Quzhou) Co. Ltd. 88.16% China December Manufacture of chemical product
Hyosung T&D India Pvt Ltd. 100% India December Manufacture and sale of breaker
Luckfaith Investment LTD.3 - China December Other
Nantong Hyosung Transformer Co., Ltd. 100% China December Manufacture and sale of transformer
Hyosung South Africa (PTY) Ltd. 50% South Africa December Electric power sale
PT.HYOSUNG JAKARTA 99.90% Indonesia December General trading
Zhangjiagang Xiaosha Coil Service Co., Ltd. 64.50% China December Steel manufacturing and processing
1 Percentage of ownership is the effective percentage of ownership considering ownership ratio of subsidiaries. 2 Although the Group’s owns is less than 50% of voting rights, the Group has ability to materially impact the returns of the
investees and is exposed to variable returns of the investees. Accordingly, the Group is considered to have substantive
power over the entities. 3 These subsidiaries are included in the scope of consolidation due to de facto control.
Hyosung Corporation and Subsidiaries Notes to Consolidated Financial Statements December 31, 2017 and 2016
16
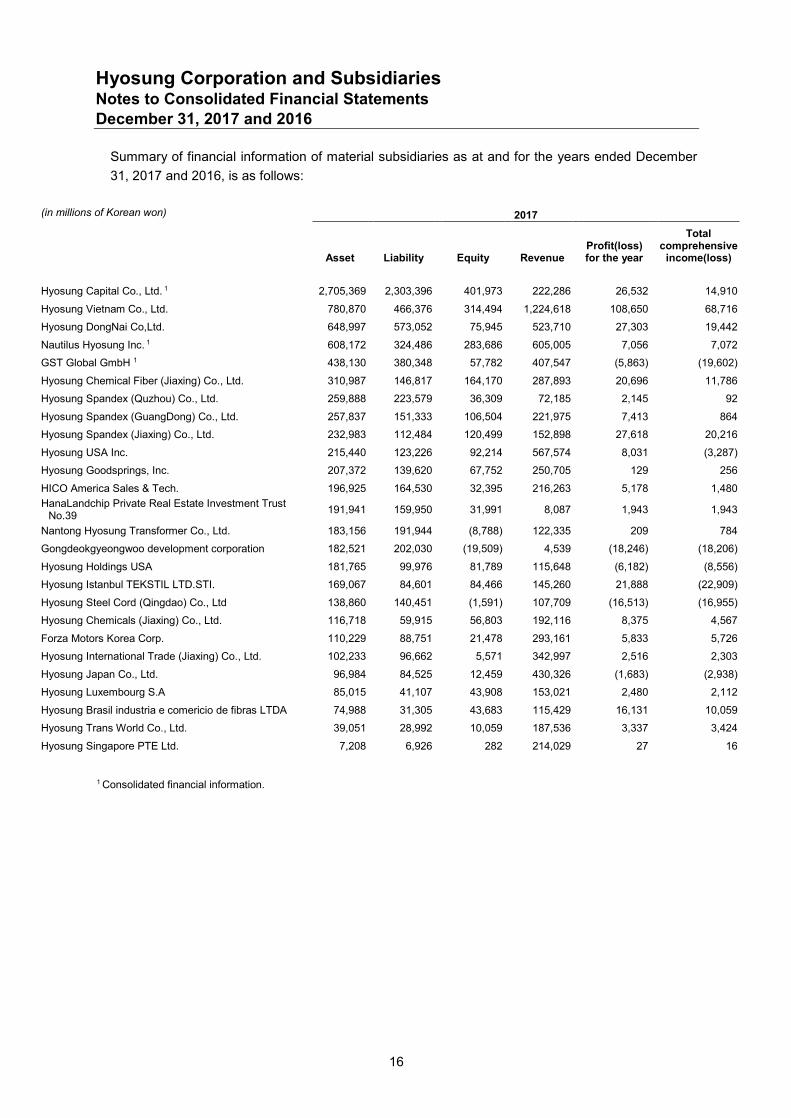
Summary of financial information of material subsidiaries as at and for the years ended December 31, 2017 and 2016, is as follows:
(in millions of Korean won) 2017
Asset
Liability
Equity
Revenue
Profit(loss) for the year
Total comprehensive
income(loss)
Hyosung Capital Co., Ltd. 1 2,705,369 2,303,396 401,973 222,286 26,532 14,910
Hyosung Vietnam Co., Ltd. 780,870 466,376 314,494 1,224,618 108,650 68,716
Hyosung DongNai Co,Ltd. 648,997 573,052 75,945 523,710 27,303 19,442
Nautilus Hyosung Inc. 1 608,172 324,486 283,686 605,005 7,056 7,072
GST Global GmbH 1 438,130 380,348 57,782 407,547 (5,863) (19,602)
Hyosung Chemical Fiber (Jiaxing) Co., Ltd. 310,987 146,817 164,170 287,893 20,696 11,786
Hyosung Spandex (Quzhou) Co., Ltd. 259,888 223,579 36,309 72,185 2,145 92
Hyosung Spandex (GuangDong) Co., Ltd. 257,837 151,333 106,504 221,975 7,413 864
Hyosung Spandex (Jiaxing) Co., Ltd. 232,983 112,484 120,499 152,898 27,618 20,216
Hyosung USA Inc. 215,440 123,226 92,214 567,574 8,031 (3,287)
Hyosung Goodsprings, Inc. 207,372 139,620 67,752 250,705 129 256
HICO America Sales & Tech. 196,925 164,530 32,395 216,263 5,178 1,480 HanaLandchip Private Real Estate Investment Trust
No.39 191,941 159,950 31,991 8,087 1,943 1,943
Nantong Hyosung Transformer Co., Ltd. 183,156 191,944 (8,788) 122,335 209 784
Gongdeokgyeongwoo development corporation 182,521 202,030 (19,509) 4,539 (18,246) (18,206)
Hyosung Holdings USA 181,765 99,976 81,789 115,648 (6,182) (8,556)
Hyosung Istanbul TEKSTIL LTD.STI. 169,067 84,601 84,466 145,260 21,888 (22,909)
Hyosung Steel Cord (Qingdao) Co., Ltd 138,860 140,451 (1,591) 107,709 (16,513) (16,955)
Hyosung Chemicals (Jiaxing) Co., Ltd. 116,718 59,915 56,803 192,116 8,375 4,567
Forza Motors Korea Corp. 110,229 88,751 21,478 293,161 5,833 5,726
Hyosung International Trade (Jiaxing) Co., Ltd. 102,233 96,662 5,571 342,997 2,516 2,303
Hyosung Japan Co., Ltd. 96,984 84,525 12,459 430,326 (1,683) (2,938)
Hyosung Luxembourg S.A 85,015 41,107 43,908 153,021 2,480 2,112
Hyosung Brasil industria e comericio de fibras LTDA 74,988 31,305 43,683 115,429 16,131 10,059
Hyosung Trans World Co., Ltd. 39,051 28,992 10,059 187,536 3,337 3,424
Hyosung Singapore PTE Ltd. 7,208 6,926 282 214,029 27 16
1 Consolidated financial information.

Hyosung Corporation and Subsidiaries Notes to Consolidated Financial Statements December 31, 2017 and 2016
17
(in millions of Korean won) 2016
Asset
Liability
Equity
Revenue
Profit(loss) for the year
Total comprehensive
income(loss)
Hyosung Capital Co., Ltd. 1 2,477,524 2,090,460 387,064 189,467 8,157 16,910
Hyosung Vietnam Co., Ltd. 966,444 583,687 382,757 1,131,331 148,795 169,927
Nautilus Hyosung Inc. 1 559,086 282,471 276,615 693,424 25,998 24,317
Hyosung DongNai Co,Ltd. 500,070 443,567 56,503 157,208 16,316 16,976
GST Global GmbH. 1 434,311 356,927 77,384 404,344 (16,663) (14,889)
Hyosung Chemical Fiber (Jiaxing) Co., Ltd. 294,892 142,508 152,384 283,711 (3,301) (8,392)
Hyosung Spandex (GuangDong) Co., Ltd. 276,203 157,115 119,088 212,400 (9,375) (13,440)
Doomi Construction Co. Ltd. 261,086 308,118 (47,032) 13,097 (17,440) (17,424)
Hyosung Spandex (Jiaxing) Co., Ltd. 247,747 123,647 124,100 140,572 21,705 17,385
Hyosung USA Inc. 214,543 119,042 95,501 586,074 4,248 7,162
Hyosung Goodsprings, Inc. 208,461 137,366 71,095 268,018 6,707 6,568
Nantong Hyosung Transformer Co., Ltd. 194,063 203,634 (9,571) 122,519 (14,317) (14,406) HanaLandchip Private Real Estate Investment Trust
No.39 191,944 159,950 31,994 8,065 1,945 1,945
Hyosung Istanbul TEKSTIL LTD.STI 185,267 92,844 92,423 160,142 30,847 34,899
Hyosung Holdings USA 185,093 86,223 98,870 74,116 267 973
Gongdeokgyeongwoo development corporation 174,770 176,074 (1,304) - (1,297) (1,298)
Hyosung Steel Cord (Qingdao) Co., Ltd. 174,736 159,372 15,364 128,977 (19,407) (20,095)
HICO America Sales & Tech. 152,134 121,216 30,918 240,125 6,815 7,838
Hyosung Chemicals (Jiaxing) Co., Ltd. 116,426 44,833 71,593 152,320 3,298 1,347
Forza Motors Korea Corp. 104,857 89,066 15,791 188,643 1,323 1,323
Hyosung Japan Co., Ltd. 95,718 80,320 15,398 421,716 388 1,616
Hyosung International Trade (Jiaxing) Co., Ltd. 95,551 92,283 3,268 313,963 (1,718) (1,773)
Hyosung Brasil industria e comericio de fibras LTDA 81,847 41,291 40,556 105,962 21,628 27,848
Hyosung Luxembourg S.A 47,920 10,599 37,321 150,408 4,936 4,552
Hyosung Trans World Co., Ltd. 35,644 26,309 9,335 188,086 3,558 3,630
Hyosung Singapore PTE Ltd. 4,650 4,383 267 209,914 69 70
1 Consolidated financial information.

Hyosung Corporation and Subsidiaries Notes to Consolidated Financial Statements December 31, 2017 and 2016
18
1.2 Changes in Scope for Consolidation
Subsidiaries newly included in the consolidation for the year ended December 31, 2017, are as follows:
Subsidiary
Description
Pohang Renewable Energy, Inc. Newly acquired Hyosung Capital the 25st Securitization Specialty Co., Ltd. Newly acquired Hyosung South Africa (PTY) Ltd. Establishment
Subsidiaries excluded from the consolidation for the year ended December 31, 2017, are as follows:
Subsidiary
Description
Hyosung Capital the 11th Securitization Specialty Co., Ltd. Liquidated
Hyosung Capital the 12th Securitization Specialty Co., Ltd. Liquidated
Hyosung Capital the 13th Securitization Specialty Co., Ltd. Liquidated
Hyosung Capital the 14th Securitization Specialty Co., Ltd. Liquidated
Hyosung Capital the 15th Securitization Specialty Co., Ltd. Liquidated
Lloyd Dynamowerke GmbH. Liquidated
Hyosung Engineering Co., Ltd. Merger
Doomi Construction Co., Ltd. Merger
SYHS the 1st co., Ltd. Liquidated
Galaxia Photonics Co., Ltd. Liquidated
Hyosung Capital the 17th Securitization Specialty Co., Ltd. Liquidated
Hyosung Capital the 19th Securitization Specialty Co., Ltd. Liquidated
Hyosung Wire Luxembourg S.A. Merger
HSC the 2nd Co., Ltd. Liquidated
1 During 2017, the Group recognize a gain of disposal of ₩ 233 million due to the loss of control and disposal of the
subsidiaries.
.

Hyosung Corporation and Subsidiaries Notes to Consolidated Financial Statements December 31, 2017 and 2016
19
2. Significant Accounting Policies The principal accounting policies applied in the preparation of these consolidated financial statements are set out below. These policies have been consistently applied to all the years presented, unless otherwise stated. 2.1 Basis of Preparation The Group maintains its accounting records in Korean won and prepares statutory financial statements in the Korean language (Hangul) in accordance with International Financial Reporting Standards as adopted by the Republic of Korea (Korean IFRS). The accompanying consolidated financial statements have been condensed, restructured and translated into English from the Korean language financial statements. Certain information attached to the Korean language financial statements, but not required for a fair presentation of the Group's financial position, financial performance or cash flows, is not presented in the accompanying consolidated financial statements. The consolidated financial statements of the Group have been prepared in accordance with Korean IFRS. These are the standards, subsequent amendments and related interpretations issued by the International Accounting Standards Board (IASB) that have been adopted by the Republic of Korea. The preparation of the consolidated financial statements requires the use of certain critical accounting estimates. It also requires management to exercise judgment in the process of applying the Group’s accounting policies. The areas involving a higher degree of judgment or complexity, or areas where assumptions and estimates are significant to the consolidated financial statements are disclosed in Note 3.

Hyosung Corporation and Subsidiaries Notes to Consolidated Financial Statements December 31, 2017 and 2016
20
2.2 Changes in Accounting Policy and Disclosures (a) New and amended standards adopted by the Group The Group has applied the following standards and amendments for the first time for their annual reporting period commencing January 1, 2017. The adoption of these amendments did not have any material impact on the consolidated financial statements. - Amendments to Korean IFRS 1007 Statement of Cash Flows Amendments to Korean IFRS 1007 Statement of Cash flows require to provide disclosures that enable users of consolidated financial statements to evaluate changes in liabilities arising from financing activities, including both changes arising from cash flows and non-cash flows (Note 37). - Amendments to Korean IFRS 1012 Income Tax Amendments to Korean IFRS 1012 clarify how to account for deferred tax assets related to debt instruments measured at fair value. Korean IFRS 1012 provides requirements on the recognition and measurement of current or deferred tax liabilities or assets. The amendments issued clarify the requirements on recognition of deferred tax assets for unrealized losses, to address diversity in practice. - Amendments to Korean IFRS 1112 Disclosures of Interests in Other Entities Amendments to Korean IFRS 1112 clarify when an entity’s interest in a subsidiary, a joint venture or an associate is classified as held for sales in accordance with Korean IFRS 1105, the entity is required to disclose other information except for summarized financial information in accordance with Korean IFRS 1112. (b) New standards and interpretations not yet adopted by the Group Certain new accounting standards and interpretations that have been published that are not mandatory for annual reporting period commencing January 1, 2017 and have not been early adopted by the Group are set out below. - Amendments to Korean IFRS 1028 Investments in Associates and Joint Ventures When an investment in an associate or a joint venture is held by, or its held indirectly through, an entity that is a venture capital organization, or a mutual fund, unit trust and similar entities including investment-linked insurance funds, the entity may elect to measure that investment at fair value through profit or loss in accordance with Korean IFRS 1109. The amendments clarify that an entity shall make this election separately for each associate of joint venture, at initial recognition of the associate or joint venture. These amendments will be effective for annual periods beginning on or after January 1, 2018, with early adoption permitted. The Group does not expect the amendments

Hyosung Corporation and Subsidiaries Notes to Consolidated Financial Statements December 31, 2017 and 2016
21
to have a significant impact on the consolidated financial statements because the Group is not a venture capital organization. - Amendment to Korean IFRS 1040 Transfers of Investment Property Paragraph 57 of Korean IFRS 1040 clarifies that a transfer to, or from, investment property, including property under construction, can only be made if there has been a change in use that is supported by evidence, and provides a list of circumstances as examples. The amendment will be effective for annual periods beginning on or after January 1, 2018, with early adoption permitted. The Group does not expect the amendment to have a significant impact on the consolidated financial statements. - Amendments to Korean IFRS 1102 Share-based Payment Amendments to Korean IFRS 1102 clarify accounting for a modification to the terms and conditions of a share-based payment that changes the classification of the transaction from cash-settled to equity-settled. Amendments also clarify that the measurement approach should treat the terms and conditions of a cash-settled award in the same way as for an equity-settled award. The amendments will be effective for annual periods beginning on or after January 1, 2018, with early adoption permitted. The Group does not expect the amendments to have a significant impact on the consolidated financial statements. - Enactment of Interpretation 2122 Foreign Currency Transaction and Advance Consideration According to the enactment, the date of the transaction for the purpose of determining the exchange rate to use on initial recognition of the related asset, expense or income (or part of it) is the date on which an entity initially recognizes the non-monetary asset or non-monetary liability arising from the payment or receipt of advance consideration. If there are multiple payments or receipts in advance, the entity shall determine a date of the transaction for each payment or receipt of advance consideration. The enactment will be effective for annual periods beginning on or after January 1, 2018, with early adoption permitted. The Group does not expect the enactments to have a significant impact on the consolidated financial statements. - Enactment of Korean IFRS 1116 Leases Korean IFRS 1116 Leases issued on May 22, 2017 is effective for annual periods beginning on or after January 1, 2019, with early adoption permitted. This standard will replace Korean IFRS 1017 Leases, Interpretation 2104 Determining whether an Arrangement contains a Lease, Interpretation 2015 Operating Leases-Incentives, and Interpretation 2027 Evaluating the Substance of Transactions Involving the Legal Form of a Lease. At inception of a contract, the entity shall assess whether the contract is, or contains, a lease. Also, at the date of initial application, the entity shall assess whether the contract is, or contains, a lease in accordance with the standard. However, the entity will not need to reassess all contracts with

Hyosung Corporation and Subsidiaries Notes to Consolidated Financial Statements December 31, 2017 and 2016
22
applying the practical expedient because the entity elected to apply the practical expedient only to contracts entered before the date of initial application. For a contract that is, or contains, a lease, the entity shall account for each lease component within the contract as a lease separately from non-lease components of the contract. A lessee is required to recognize a right-of-use asset representing its right to use the underlying leased asset and a lease liability representing its obligation to make lease payments. The lessee may elect not to apply the requirements to short-term lease (a lease term of 12 months or less at the commencement date) and low value assets (e.g. underlying assets below $ 5,000). In addition, as a practical expedient, the lessee may elect, by class of underlying asset, not to separate non-lease components from lease components, and instead account for each lease component and any associated non-lease components as a single lease component. Lessee accounting A lessee shall apply this standard to its leases either:
· retrospectively to each prior reporting period presented applying Korean IFRS 1008 Accounting Policies, Changes in Accounting Estimates and Errors (Full retrospective application); or
· retrospectively with the cumulative effect of initially applying the standard recognized at the date of initial application.’
The Group has not yet elected the application method. The Group will perform an impact assessment to identify financial effects of applying Korean IFRS 1116 during 2018. It is difficult to provide reasonable estimates of financial effects until the analyses are complete Lessor accounting The Group is in the process of analyzing the financial effects on the consolidated financial statements applying Korean IFRS 1116 as a lessor.

Hyosung Corporation and Subsidiaries Notes to Consolidated Financial Statements December 31, 2017 and 2016
23
- Enactment of Korean IFRS 1109 Financial Instruments
The new standard for financial instruments issued on September 25, 2015 are effective for annual periods beginning on or after January 1, 2018 with early application permitted. This standard will replace Korean IFRS 1039 Financial Instruments: Recognition and Measurement. The Group will apply the standards for annual periods beginning on or after January 1, 2018.
The standard requires retrospective application with some exceptions. For example, an entity is not required to restate prior period in relation to classification and measurement (including impairment) of financial instruments. The standard requires prospective application of its hedge accounting requirements for all hedging relationships except the accounting for time value of options and other exceptions.
Korean IFRS 1109 Financial Instruments requires all financial assets to be classified and measured on the basis of the entity’s business model for managing financial assets and the contractual cash flow characteristics of the financial assets. A new impairment model, an expected credit loss model, is introduced and any subsequent changes in expected credit losses will be recognized in profit or loss. Also, hedge accounting rules amended to extend the hedging relationship, which consists only of eligible hedging instruments and hedged items, qualifies for hedge accounting.
An effective implementation of Korean IFRS 1109 requires preparation processes including financial impact assessment, accounting policy establishment, accounting system development and the system stabilization. The impact on the Group’s consolidated financial statements due to the application of the standard is dependent on judgements made in applying the standard, financial instruments held by the Group and macroeconomic variables.
As at December 31, 2017, the Group is in the process of analyzing the financial effects on the consolidated financial statements applying Korean IFRS 1109. The following areas are likely to be affected consolidated financial statements in general.

Hyosung Corporation and Subsidiaries Notes to Consolidated Financial Statements December 31, 2017 and 2016
24
(a) Classification and Measurement of Financial Assets
When implementing Korean IFRS 1109, the classification of financial assets will be driven by the Group’s business model for managing the financial assets and contractual terms of cash flow. The following table shows the classification of financial assets measured subsequently at amortized cost, at fair value through other comprehensive income and at fair value through profit or loss. If a hybrid contract contains a host that is a financial asset, the classification of the hybrid contract shall be determined for the entire contract without separating the embedded derivative.
Business model for the contractual cash flows
characteristics
Solely represent payments of principal and interest
All other
Hold the financial asset for the collection of the contractual cash flows
Measured at amortized cost1
Recognized at fair value through profit or loss2 Hold the financial asset for the
collection of the contractual cash flows and sale
Recognized at fair value through other comprehensive income 1
Hold for sale Recognized at fair value through profit or loss
1 A designation at fair value through profit or loss is allowed only if such designation mitigates an accounting mismatch (irrevocable).
2 Equity investments not held for trading can be recorded in other comprehensive income (irrevocable).
With the implementation of Korean IFRS 1109, the criteria to classify the financial assets at amortized cost or at fair value through other comprehensive income are more strictly applied than the criteria applied with Korean IFRS 1039. Accordingly, the financial assets at fair value through profit or loss may increase by implementing Korean IFRS 1109 and may result an extended fluctuation in profit or loss.
As at December 31, 2017, the Group owns loans and receivables of \ 5,371,031 million, financial assets available-for-sales of \477,598 million and financial assets at fair value through profit or loss of \23,416 million. According to Korean IFRS 1109, a debt instrument is measured at amortized cost if: a) the objective of the business model is to hold the financial asset for the collection of the contractual cash flows, and b) the contractual cash flows under the instrument solely represent payments of principal and interest. As at December 31, 2017, the Group measured loans and receivables of \5,371,031million at amortized costs. However, in the case of debt instruments (loans and receivables), which are the main contracts of compound instruments, the contractual cash flows do not consist of payments of principal and interest on the principal amount outstanding. Therefore, it is probable that the instrument classified fair value through profit or loss and may result an extended fluctuation in profit or loss.

Hyosung Corporation and Subsidiaries Notes to Consolidated Financial Statements December 31, 2017 and 2016
25
According to Korean IFRS 1109, a debt instrument is measured at fair value through other comprehensive income if the objective of the business model is achieved both by collecting contractual cash flows and selling financial assets; and the contractual cash flows represents solely payments of principal and interest on a specific date under contract terms. As at December 31, 2017, the Group holds debt instruments of \ 1,110 million classified as financial assets available-for-sale.
Based on results from the preliminary impact assessment of Korean IFRS 1109, if Korean IFRS 1109 is applied for the above debt instruments classified as financial assets available-for-sale, the non-finance segment of Group expects the majority of the financial assets to be measured at fair value through other comprehensive income. However, when applied to debt instruments classified as available-for-sale financial assets in the finance segment of Group, most of them are classified as investment securities and beneficiary certificates, and the contractual cash flows do not consist of payments of principal and interest on the principal amount outstanding. Therefore, it is probable that the instrument classified fair value through profit or loss and may result an extended fluctuation in profit or loss. According to Korean IFRS 1109, equity instruments that are not held for trading, the Group can make an irrevocable election at initial recognition to classify the instruments as assets measured at fair value through other comprehensive income, which all subsequent changes in fair value being recognized in other comprehensive income and not recycled to profit or loss. As at December 31, 2017, the Group holds equity instruments of \ 476,488 million classified as financial assets available-for-sale and recycled unrealized gain or loss of \ (8,305) million arose from the equity instruments to profit or loss. Based on results from the preliminary impact assessment of Korean IFRS 1109, the Group plans to designate equity instruments, which are classified in financial assets available-for-sale, as instruments measured at fair value through other comprehensive income for long-term investment purpose or collecting bonds purpose. Also, listed stocks held for investment are likely to be classified as fair value through profit or loss and may result an extended fluctuation in profit or loss. According to Korean IFRS 1109, debt instruments those contractual cash flows do not represent solely payments of principal and interest and held for trading, and equity instruments that are not designated as instruments measured at fair value through other comprehensive income are measured at fair value through profit or loss. As at December 2017, the Group holds equity instruments classified as financial assets at fair value through profit or loss that amount to \ 23,416 million.

Hyosung Corporation and Subsidiaries Notes to Consolidated Financial Statements December 31, 2017 and 2016
26
(b) Classification and Measurement of Financial Liabilities
Korean IFRS 1109 requires the amount of the change in the liability’s fair value attributable to changes in the credit risk to be recognized in other comprehensive income, unless this treatment of the credit risk component creates or enlarges a measurement mismatch. Amounts presented in other comprehensive income are not subsequently transferred to profit or loss. However, the amount of change in the fair value of the financial liability that is attributable to changes in the credit risk of that liability recognized with other comprehensive income would create or enlarge an accounting mismatch, the Group recognizes all gains or losses on that liability in profit or loss.
Under Korean IFRS 1039, all financial liabilities designated at fair value through profit or loss recognized their fair value movements in profit or loss. However, under Korean IFRS 1109, certain fair value movements will be recognized in other comprehensive income and as a result profit or loss from fair value movements may decrease.
(c) Impairment: Financial Assets and Contract Assets
The new impairment model requires the recognition of impairment provisions based on expected credit losses (ECL) rather than only incurred credit losses as is the case under Korean IFRS 1039. It applies to financial assets classified at amortized cost, debt instruments measured at fair value through other comprehensive income, lease receivables, contract assets, loan commitments and certain financial guarantee contracts.
Under Korean IFRS 1109 ‘expected loss’ model, a credit event (or impairment ‘trigger’) no longer has to occur before credit losses are recognized. The Group will always recognize (at a minimum) 12-month expected credit losses in profit or loss. Lifetime expected losses will be recognized on assets for which there is a significant increase in credit risk after initial recognition.
Stage1 Loss allowance
1 No significant increase in credit risk after initial recognition2
12-month expected credit losses (expected credit losses that result from those default events on the financial
instrument that are possible within 12 months after the reporting date)
2 Significant increase in credit risk after initial recognition Lifetime expected credit losses (expected credit losses
that result from all possible default events over the life of the financial instrument) 3 Credit-impaired
1 A loss allowance for lifetime expected credit losses is required for a financial instrument if the credit risk on that financial instrument has increased significantly since initial recognition. It is also required for contract assets or trade receivables that are not, according to Korean IFRS 1115 Revenue from Contracts with Customers, considered to contain a significant financing component. Additionally, the Group can elect an accounting policy of recognizing lifetime expected credit losses for all contract assets and/or all trade receivables, including those that contain a significant financing component.

Hyosung Corporation and Subsidiaries Notes to Consolidated Financial Statements December 31, 2017 and 2016
27
2 If the financial instrument has low credit risk at the end of the reporting period, the Group may assume that the credit risk has not increased significantly since initial recognition.
Under Korean IFRS 1109, the asset that is credit-impaired at initial recognition would recognize all changes in lifetime expected credit losses since the initial recognition as a loss allowance with any changes recognized in profit or loss. As at December 31, 2017, the Group owns debt investment carried at amortized cost of \ 5,621,115 million (loans and receivables of \ 5,621,115 million). And the Group recognized loss allowance of \ (250,084) million for these assets. - Enactment of Korean IFRS 1115 Revenue from Contracts with Customers
Korean IFRS 1115 Revenue from Contracts with Customers issued on November 6, 2015 will be effective for annual reporting periods beginning on or after January 1, 2018, with early adoption permitted. This standard replaces Korean IFRS 1018 Revenue, Korean IFRS 1011 Construction Contracts, Interpretation 2031 Revenue-Barter Transactions Involving Advertising Services, Interpretation 2113 Customer Loyalty Programs, Interpretation 2115 Agreements for the Construction of Real Estate and Interpretation 2118 Transfers of assets from customers. The Group must apply Korean IFRS 1115 Revenue from Contracts with Customers within annual reporting periods beginning on or after January 1, 2018, and will elect the modified retrospective approach which will recognize the cumulative impact of initially applying the revenue standard as an adjustment to retained earnings as at January 1 2018, the period of initial application. Korean IFRS 1018 and other current revenue standard identify revenue as income that arises in the course of ordinary activities of an entity and provides guidance on a variety of different types of revenue, such as, sale of goods, rendering of services, interest, dividends, royalties and construction contracts. However, the new standard is based on the principle that revenue is recognized when control of a good or service transfers to a customer so the notion of control replaces the existing notion of risks and rewards. A new five-step process must be applied before revenue from contract with customer can be recognized:
ž Identify contracts with customers
ž Identify the separate performance obligation
ž Determine the transaction price of the contract
ž Allocate the transaction price to each of the separate performance obligations, and
ž Recognize the revenue as each performance obligation is satisfied
As at December 31, 2017, the Group has prepared for improvement of internal management process or initiated to adjust accounting system in relation to implementation of Korean IFRS 1115.

Hyosung Corporation and Subsidiaries Notes to Consolidated Financial Statements December 31, 2017 and 2016
28
Also, the Group is in the process of analyzing effects on consolidated financial statements of applying the standard. The Group has identified the impact of applying the new standard. (a) Identify performance obligation With implementation of Korean IFRS 1115, the Group have to identify the performance obligations in the contract with customer. The Group’s recognition timing of revenue may change whether each performance obligation satisfies over time or satisfies at a point in time. (b) A performance obligation is satisfied over time In accordance with Korean IFRS 1115, the revenue is recognized over time by measuring progress only if the Group’s performance creates or enhances an asset that the customer controls as the asset is created or enhanced or the Group’s performance does not create an asset with an alternative use to the Group and the Group has an enforceable right to payment for performance completed to date. (c) Incremental costs of obtaining a contract In accordance with Korean IFRS 1115, the Group shall recognize as an asset the incremental costs of obtaining a contract with a customer if the Group expects to recover those costs. Incremental costs of obtaining a contract are those costs that an entity incurs to obtain a contract with a customer that it would not have incurred if the contract had not been obtained. Costs to obtain a contract that would have been incurred regardless of whether the contract was obtained shall be recognized as an expense when incurred, unless those costs are explicitly chargeable to the customer regardless of whether the contract is obtained. (d) Variable consideration With implementation of Korean IFRS 1115, the Group estimates an amount of variable consideration by using the expected value which the Group expects to better predict the amount of consideration. The Group recognize revenue with transaction price including variable consideration only to the extent that it is highly probable that a significant reversal in the amount of cumulative revenue recognized will not occur when the refund period has lapsed. The refund liability is measured at the amount of consideration received (or receivable) for which the Group does not expect to be entitled. (e) Significant financing component in the contract With implementation of Korean IFRS 1115, In determining the transaction price, if the timing of payments agreed to by the parties to the contract provides the customer or the entity with a significant benefit of financing the transfer of goods or services to the customer, the Group recognize revenue at an amount that reflects the prices that a customer would have paid for the promised goods or services if the customer had paid cash for those goods or services.

Hyosung Corporation and Subsidiaries Notes to Consolidated Financial Statements December 31, 2017 and 2016
29
2.3 Consolidation The Group has prepared the consolidated financial statements in accordance with Korean IFRS 1110 Consolidated Financial Statements.
(a) Subsidiaries Subsidiaries are all entities over which the Group has control. The Group controls the corresponding investee when it is exposed, or has rights, to variable returns from its involvement with the investee and has the ability to affect those returns through its power over the investee. The consolidation of a subsidiary begins from the date the Group obtains control of a subsidiary and ceases when the Group loses control of the subsidiary. The Group applies the acquisition method to account for business combinations. The consideration transferred is measured at the fair values of the assets transferred, and identifiable assets acquired and liabilities and contingent liabilities assumed in a business combination are initially measured at their fair values at the acquisition date. The Group recognizes any non-controlling interest in the acquiree on an acquisition-by-acquisition basis in the event of liquidation, either at fair value or at the non-controlling interest’s proportionate share of the recognized amounts of acquiree’s identifiable net assets. All other non-controlling interests are measured at their acquisition-date fair values, unless another measurement basis is required by IFRSs. Acquisition-related costs are expensed as incurred.
Goodwill is recognized as the excess of the aggregate of the consideration transferred, the amount of any non-controlling interest in the acquiree, and the acquisition-date fair value of the acquirer’s previously held equity interest in the acquiree over the identifiable net assets acquired. If this consideration is lower than the fair value of the net assets of the subsidiary acquired, the difference is recognized in profit or loss. Balances of receivables and payables, income and expenses and unrealized gains on transactions between the Group subsidiaries are eliminated. Accounting policies of subsidiaries have been changed where necessary to ensure consistency with the policies adopted by the Group. (b) Associates Associates are all entities over which the Group has significant influence, and investments in associates are initially recognized at acquisition cost using the equity method. Unrealized gains on transactions between the Group and its associates are eliminated to the extent of the Group’s interest in the associates. If there is any objective evidence that the investment in the associate is impaired, the Group recognizes the difference between the recoverable amount of the associate and its book value as impairment loss.

Hyosung Corporation and Subsidiaries Notes to Consolidated Financial Statements December 31, 2017 and 2016
30
2.4 Segment Reporting Information of each segment is reported in a manner consistent with the internal reporting provided to the chief operating decision-maker (Note 5). The chief operating decision-maker is responsible for allocating resources and assessing performance of the operating segments. 2.5 Foreign Currency Translation (a) Functional and presentation currency Items included in the financial statements of each of the Group’s entities are measured using the currency of the primary economic environment in which the each entity operates (the “functional currency”). The consolidated financial statements are presented in Korean won, which is the Parent Company’s functional and presentation currency. (b) Transactions and balances Foreign currency transactions are translated into the functional currency using the exchange rates prevailing at the dates of the transactions or valuation where items are re-measured. Foreign exchange gains and losses resulting from the settlement of such transactions and from the translation at year-end exchange rates of monetary assets and liabilities denominated in foreign currencies are recognized in profit or loss.
2.6 Financial Assets (a) Classification and measurement The Group classifies its financial assets in the following categories: financial assets at fair value through profit or loss, available-for-sale financial assets, loans and receivables, and held-to-maturity financial assets. Regular purchases and sales of financial assets are recognized on the trade date. Regular purchases and sales of financial assets are recognized on the trade date. At initial recognition, financial assets are measured at fair value plus, in the case of financial assets not carried at fair value through profit or loss, transaction costs. Transaction costs of financial assets carried at fair value through profit or loss are expensed in the statements of profit or loss. After the initial recognition, available-for-sale financial assets and financial assets at fair value through profit or loss are subsequently carried at fair value. Loans and receivables, and held-to-maturity investments are subsequently carried at amortized cost using the effective interest rate method. Changes in fair value of financial assets at fair value through profit or loss are recognized in profit or loss and changes in fair value of available-for-sale financial assets are recognized in other comprehensive income. When the available-for-sale financial assets are sold or impaired, the fair value adjustments recorded in equity are reclassified into profit or loss.

Hyosung Corporation and Subsidiaries Notes to Consolidated Financial Statements December 31, 2017 and 2016
31
(b) Impairment The Group assesses at the end of each reporting period whether there is objective evidence that a financial asset or a group of financial assets is impaired. A financial asset or a group of financial assets is impaired and impairment losses are incurred only if there is objective evidence of impairment as a result of one or more events that occurred after the initial recognition of the asset (a ‘loss event’) and that loss event (or events) has an impact on the estimated future cash flows of the financial asset or a group of financial assets that can be reliably estimated. Impairment of loans and receivables is presented as a deduction in an allowance account. Impairment of other financial assets is directly deducted from their carrying amount. The Group writes off financial assets when the assets are determined to be no longer recoverable. The objective evidence that a financial asset is impaired includes significant financial difficulty of the issuer or obligor; a breach of contract, such as a default or delinquency in interest or principal payments; or the disappearance of an active market for that financial asset because of financial difficulties. In addition, a significant decline in the fair value of an available-for-sale equity instrument from its cost or a prolonged decline below its cost is also objective evidence of impairment. (c) Derecognition If the Group transfers a financial asset and the transfer does not result in derecognition because the Group has retained substantially all the risks and rewards of ownership of the transferred asset due to a recourse in the event the debtor defaults, the Group continues to recognize the transferred asset in its entirety and recognizes a financial liability for the consideration received. The related financial liability is classified as ‘borrowings or long-term borrowings’ in the statement of financial position (Note 6). (d) Offsetting of financial instruments Financial assets and liabilities are offset and the net amount reported in the consolidated statements of financial position where there is a legally enforceable right to offset the recognized amounts and there is an intention to settle on a net basis or realize the assets and settle the liability simultaneously. The legally enforceable right must not be contingent on future events and must be enforceable in the normal course of business and in the event of default, insolvency or bankruptcy of the Group or the counterparty. 2.7 Derivative Instruments Derivatives are initially recognized at fair value on the date when a derivative contract is entered into and are subsequently re-measured at their fair value. Changes in the fair value of the derivatives that are not qualified for hedge accounting are recognized in the statement of profit or loss within 'other income (expenses)' according to the nature of transactions.

Hyosung Corporation and Subsidiaries Notes to Consolidated Financial Statements December 31, 2017 and 2016
32
2.8 Inventories Inventories are stated at the lower of cost and net realizable value. Cost is determined using the moving-weighted average method (the gross-weighted average method or the first-in, first-out (FIFO) method in some subsidiaries) except for in-transit inventories which are determined using the specific identification method.
2.9 Property, Plant and Equipment Property, plant and equipment are stated at cost less accumulated depreciation and accumulated impairment losses. Historical cost includes expenditures that is directly attributable to the acquisition of the items. Land is not depreciated. Depreciation on other assets is calculated using the straight-line method to allocate the difference between their cost and their residual values over their estimated useful lives, as follows:
Estimated Useful Lives Estimated Useful Lives Buildings 10 - 60 years Vehicles 3 - 10 years
Structures 5 - 40 years Tools and equipment 3 - 15 years
Machinery 3 - 30 years Others 2 - 10 years
The depreciation method, residual values and useful lives of property, plant and equipment are reviewed at the end of each reporting period and, if appropriate, accounted for as changes in accounting estimates. 2.10 Borrowing Costs
Borrowing costs incurred in the acquisition or construction of a qualifying asset are capitalized in the period when it is prepared for its intended use, and investment income earned on the temporary investment of borrowings made specifically for the purpose obtaining a qualifying asset is deducted from the borrowing costs eligible for capitalization during the period. Other borrowing costs are recognized as expenses for the period in which they are incurred.
2.11 Government Grants
Government grants are recognized at their fair values when there is reasonable assurance that the grant will be received and the Group will comply with the conditions attaching to it. Government grants related to assets are presented by deducting the grants in arriving at the carrying amount of the assets, and grants related to income are deferred and presented by deducting the related expenses for the purpose of the government grants.

Hyosung Corporation and Subsidiaries Notes to Consolidated Financial Statements December 31, 2017 and 2016
33
2.12 Intangible Assets
Goodwill is measured as explained in Note 2.3.(1) and carried at its cost less accumulated impairment losses. Intangible assets, except for goodwill, are initially recognized at its historical cost and carried at its cost less accumulated amortization and accumulated impairment losses. Internally generated software development costs are the aggregate costs recognized after meeting the asset recognition criteria, including technical feasibility, and determined to have future economic benefits. Membership rights are regarded as intangible assets with indefinite useful life and not amortized because there is no foreseeable limit to the period over which the assets are expected to be utilized. Intangible assets with definite useful life that are amortized using the straight-line method over their estimated useful lives, are as follows:
Estimated Useful Lives Industrial rights 5 - 20 years Other intangible assets 3 - 50 years
2.13 Investment Property
Property held to earn rentals or for capital appreciation or both is classified as investment property. Investment property is measured initially at its cost. After recognition as an asset, investment property is carried at cost less accumulated depreciation and impairment losses. Investment property, except for land, is depreciated using the straight-line method over 40 years.
2.14 Lease
A lease is an agreement, whereby the lessor conveys to the lessee, in return for a payment or series of payments, the right to use an asset for an agreed period of time. Leases where all the risks and rewards of ownership are not transferred to the Group are classified as operating leases. Lease payments under operating leases are recognized as expenses on a straight-line basis over the lease term.
Leases where the Group has substantially all the risks and rewards of ownership are classified as finance leases and recognized as lease assets and liabilities at the lower of the fair value of the leased property and the present value of the minimum lease payments on the opening date of the lease period.
A lease is classified as a finance lease if it transfers substantially all the risks and rewards incidental to ownership at the inception of the lease. A lease other than a finance lease is classified as an operating lease. Lease income from operating leases is recognized in income on a straight-line basis over the lease term. Initial direct costs incurred by the lessor in negotiating and arranging an operating lease is added to the carrying amount of the leased asset and recognized as an expense over the lease term on the same basis as the lease income.

Hyosung Corporation and Subsidiaries Notes to Consolidated Financial Statements December 31, 2017 and 2016
34
2.15 Impairment of Non-financial Assets
Goodwill or intangible assets with indefinite useful lives are not subject to amortization and are tested annually for impairment. Assets that are subject to amortization are reviewed for impairment whenever events or changes in circumstances indicate that the carrying amount may not be recoverable. An impairment loss is recognized for the amount by which the asset’s carrying amount exceeds its recoverable amount. The recoverable amount is the higher of an asset’s fair value less costs to sell and value in use. Non-financial assets, other than goodwill, that suffered impairment are reviewed for possible reversal of the impairment at the end of each reporting period.
2.16 Financial Liabilities
(a) Classification and measurement
Financial liabilities at fair value through profit or loss are financial instruments held for trading. Financial liabilities are classified in this category if incurred principally for the purpose of repurchasing them in the near term. Derivatives that are not designated as hedges or bifurcated from financial instruments containing embedded derivatives are also categorized as held-for-trading. The Group classifies non-derivative financial liabilities, except for financial liabilities at fair value through profit or loss, financial guarantee contracts and financial liabilities that arise when a transfer of financial assets does not qualify for derecognition, as financial liabilities carried at amortized cost and presented as ‘(long-term) trade payables’, ‘(long-term) borrowings’, and ‘other (non-current) financial liabilities’ in the statement of financial position.
Preferred shares that provide for a mandatory redemption at a particular date are classified as liabilities. Interest expenses on these preferred shares calculated using the effective interest method are recognized in the statement of profit or loss as ‘finance expenses’, together with interest expenses recognized on other financial liabilities.
(b) Derecognition
Financial liabilities are removed from the statement of financial position when it is extinguished, for example, when the obligation specified in the contract is discharged, cancelled or expired or when the terms of an existing financial liability are substantially modified.

Hyosung Corporation and Subsidiaries Notes to Consolidated Financial Statements December 31, 2017 and 2016
35
2.17 Financial Guarantee Contracts
Financial guarantees contracts provided by the Group are initially measured at fair value on the date the guarantee was given. Subsequent to initial recognition, the Group’s liabilities under such guarantees are measured at the higher of the amounts below and recognized as ‘trade and other payables’:
(a) The amount determined in accordance with Korean IFRS 1037 Provisions, Contingent Liabilities and Contingent Assets; or
(b) The initial amount, less accumulated amortization recognized in accordance with Korean IFRS1018 Revenue.
2.18 Provisions
Provisions are measured at the present value of the expenditures expected to be required to settle the obligation and the increase in the provision due to passage of time is recognized as interest expense.
2.19 Current and Deferred Tax
The tax expense for the period consists of current and deferred tax. Tax is recognized on the profit for the year in the statement of profit or loss, except to the extent that it relates to items recognized in other comprehensive income or directly in equity. The tax expense is calculated on the basis of the tax laws enacted or substantively enacted at the end of the reporting period. Management periodically evaluates tax policies that are applied in tax returns in which applicable tax regulation is subject to interpretation. The Group recognizes current income tax on the basis of the amount expected to be paid to the tax authorities. Deferred tax is recognized for temporary differences arising between the tax bases of assets and liabilities and their carrying amounts as expected tax consequences at the recovery or settlement of the carrying amounts of the assets and liabilities. However, deferred tax assets and liabilities are not recognized if they arise from initial recognition of an asset or liability in a transaction other than a business combination that at the time of the transaction affects neither accounting nor taxable profit or loss. Deferred tax assets are recognized only to the extent that it is probable that future taxable profit will be available against which the deductible temporary differences can be utilized. Deferred tax liability is recognized for taxable temporary differences associated with investments in subsidiaries, associates, and interests in joint ventures, except to the extent that the Group is able to control the timing of the reversal of the temporary difference and it is probable that the temporary

Hyosung Corporation and Subsidiaries Notes to Consolidated Financial Statements December 31, 2017 and 2016
36
difference will not reverse in the foreseeable future. In addition, deferred tax asset is recognized for deductible temporary differences arising from such investments to the extent that it is probable the temporary difference will reverse in the foreseeable future and taxable profit will be available against which the temporary difference can be utilized. Deferred tax assets and liabilities are offset when there is a legally enforceable right to offset current tax assets against current tax liabilities and when the deferred income taxes assets and liabilities relate to income taxes levied by the same taxation authority on either the same taxable entity or different taxable entities where there is an intention to settle the balances on a net basis.
2.20 Employee Benefits
(a) Post-employment benefits The Group has both defined contribution and defined benefit plans. A defined contribution plan is a pension plan under which the Group pays fixed contributions into a separate entity. The contributions are recognized as employee benefit expense when an employee has rendered service. A defined benefit plan is a pension plan that is not a defined contribution plan. Typically defined benefit plans define an amount of pension benefit that an employee will receive on retirement, usually dependent on one or more factors such as age, years of service and compensation. The liability recognized in the statement of financial position in respect of defined benefit pension plans is the present value of the defined benefit obligation at the end of the reporting period less the fair value of plan assets. The defined benefit obligation is calculated annually by independent actuaries using the projected unit credit method. The present value of the defined benefit obligation is determined by discounting the estimated future cash outflows using interest rates of high-quality corporate bonds and that have terms to maturity approximating to the terms of the related pension obligation. The remeasurements of the net defined benefit liability are recognized in other comprehensive income. If any plan amendments, curtailments, or settlements occur, past service costs or any gains or losses on settlement are recognized as profit or loss for the year.

Hyosung Corporation and Subsidiaries Notes to Consolidated Financial Statements December 31, 2017 and 2016
37
2.21 Revenue Recognition
Revenue is measured at the fair value of the consideration received or receivable for the sale of goods or rendering of services arising from the normal activities of the Group. It is stated as net of value added taxes, returns, rebates and discounts, after elimination of intra-company transactions. The Group recognizes revenue when the amount of revenue can be reliably measured; when it is probable that future economic benefits will flow to the entity; and when specific criteria have been met for each of the Group’s activities, as described below. The Group bases its estimate on historical results, taking into consideration the type of customer, the type of transaction and the specifics of each arrangement.
(a) Sale of goods
Revenue from the sale of goods is recognized when products are delivered to the purchaser. (b) Rendering of services
When the outcome of the transaction involving the rendering of services can be estimated reliably, revenue is recognized using the percentage of completion. When the outcome of the transaction involving the rendering of services cannot be estimated reliably, revenue is recognized only to the extent of the expenses recognized that are recoverable. (c) Royalty income
Royalty income is recognized on an accrual basis in accordance with the substance of the relevant agreements. (d) Interest income
Interest income is recognized using the effective interest method according to the time passed. When a loan and receivable is impaired, the Group reduces the carrying amount to its recoverable amount and continues unwinding the discount as interest income. Interest income on impaired loans and receivables is recognized using the original effective interest rate. (e) Dividend income
Dividend income is recognized when the right to receive payment is established.
2.22 Construction Contracts
A construction contract is defined by Korean IFRS 1011 Construction Contracts, as a contract specifically negotiated for the construction of an asset. When the outcome of a construction contract can be estimated reliably and it is probable that the

Hyosung Corporation and Subsidiaries Notes to Consolidated Financial Statements December 31, 2017 and 2016
38
contract will be profitable, contract revenue is recognized over the period of the contract by reference to the stage of completion. Contract costs are recognized as expenses by reference to the stage of completion of the contract activity at the end of the reporting period. When it is probable that total contract costs will exceed total contract revenue, the expected loss on the construction contract is immediately recognized as an expense. When the outcome of a construction contract cannot be estimated reliably, contract revenue is recognized only to the extent of contract costs incurred that are likely to be recoverable. The contract revenue is included if it is probable that the customer will approve the amount of revenue arising from the variation and the amount of revenue can be reliably measured. Contract costs are recognized as an expense in the period in which they are incurred. The Group uses the ‘percentage-of-completion method’ to determine the appropriate amount to recognize in a given period. The stage of completion is measured by reference to the contract costs incurred up to the end of the reporting period as a percentage of total estimated costs for each contract. Costs incurred in the year in connection with future activity on a contract are excluded from contract costs in determining the stage of completion. These amounts are recognized as inventory, advance payments or other assets.
On the statement of financial position, the Group reports the net contract position for each contract as either an asset or a liability. A contract represents an asset where costs incurred plus recognized profits (less recognized losses) exceed progress billings (due from customers for contract work); a contract represents a liability where the opposite is the case (due to customers for contract work). Meanwhile, profits from off-plan sales are recognized by using the percentage-of-completion method according to Q&A of Korea Accounting Institute, 2011-I-KQA. This accounting standard is applicable for Companies that have adopted Korean IFRS of Laws on External Audit of a Corporation (Article 13, Section 1 and Paragraph 1). 2.23 Non-current Assets (or Disposal Group) Held for sale
Non-current assets (or disposal group) are classified as held for sale when their carrying amount will be recovered principally through a sale transaction rather than through continuing use and a sale is considered highly probable. The assets are measured at the lower amount between their carrying amount and the fair value less costs to sell. 2.24 Approval of Issuance of the Financial Statements
The issuance of the December 31, 2017 consolidated financial statements of the Group was approved by the Board of Directors on February 22, 2018, which is subject to change with the approval of the shareholders at their annual shareholders’ meeting.

Hyosung Corporation and Subsidiaries Notes to Consolidated Financial Statements December 31, 2017 and 2016
39
3. Critical Accounting Estimates and Assumptions The Group makes estimates and assumptions concerning the future. Estimations and assumptions are continuously evaluated with consideration to factors such as events reasonably predictable in the foreseeable future within the present circumstance according to historical experience. The resulting accounting estimates will, by definition, seldom equal the related actual results. The estimates and assumptions that have a significant risk of causing a material adjustment to the carrying amounts of assets and liabilities within the next financial year are addressed below. (a) Estimated impairment of goodwill The Group tests annually whether goodwill has suffered any impairment. The recoverable amounts of cash-generating units have been determined based on value-in-use calculations (Note 17). (b) Income taxes The Group is operating in numerous countries and the income generated from these operations is subject to income taxes based on tax laws and interpretations of tax authorities in numerous jurisdictions. There are many transactions and calculations for which the ultimate tax determination is uncertain (Note 23). If certain portion of the taxable income is not used for investments or increase in wages or dividends in accordance with the Tax System For Recirculation of Corporate Income, the Group is liable to pay additional income tax calculated based on the tax laws. The new tax system is effective for three years from 2015. Accordingly, the measurement of current and deferred income tax is affected by the tax effects from the new tax system. As the Group’s income tax is dependent on the investments, increase in wages and dividends, there is an uncertainty measuring the final tax effects. (c) Fair value of financial instruments The fair value of financial instruments that are not traded in an active market is determined by using valuation techniques. The Group uses its judgment to select a variety of methods and make assumptions that are mainly based on market conditions existing at the end of each reporting period (Note 4).

Hyosung Corporation and Subsidiaries Notes to Consolidated Financial Statements December 31, 2017 and 2016
40
(d) Provisions As described in Note 24, the Group recognizes provisions for warranties, repairs and estimated returns as at the reporting date. The amounts are estimated based on historical data.
(e) Net defined benefit liabilities The present value of net defined benefit liabilities depends on a number of factors that are determined on an actuarial basis using a number of assumptions including the discount rate (Note 22). (f) Uncertainty of the estimated total contract revenue Total contract revenue is measured based on contractual amount initially agreed. The contract revenue can be increased by additional contract work, claims and incentive payments in the course of construction, or decreased by the penalty when the completion of contract is delayed due to the Group’s fault. Therefore, this measurement of contract revenue is affected by the uncertainty of the occurrence of future events. The change in contract revenue is recognized when it is probable that the customer will approve the increase in revenue due to the changes in contract work, or when it is probable that the Group will be able to satisfy the performance requirements, and the amount can be estimated reliably. (g) Estimated total contract costs Construction revenue is recognized according to the percentage of completion, which is measured on the basis of the gross amount incurred to date. Total contract costs are estimated based on future estimates of material costs, labor costs, construction period and others.

Hyosung Corporation and Subsidiaries Notes to Consolidated Financial Statements December 31, 2017 and 2016
41
4. Financial Risk Management 4.1 Financial Risk Factors The Group’s activities expose it to a variety of financial risks: market risk (including currency risk, price risk and interest rate risk), credit risk and liquidity risk. The Group’s overall risk management program focuses on the unpredictability of financial markets and seeks to minimize potential adverse effects on the Group’s financial performance. The Group uses derivative financial instruments to hedge certain risk exposures. Risk management is carried out under policies approved by the Board of Directors. The Board reviews and approves written principles for overall risk management, as well as written policies covering specific areas, such as foreign exchange risk, interest rate risk, credit risk, use of derivative financial instruments and non-derivative financial instruments, and investment of excess liquidity.
(a) Market risk i) Foreign exchange risk The Group operates internationally and is exposed to foreign exchange risk arising from various currency exposures, primarily with respect to the US dollar, Europe Euro, Chinese yuan and other currencies; such as, the Japanese yen, Turkish lira and Singapore dollar. Foreign exchange risk arises from future commercial transactions, recognized assets and liabilities and net investments in foreign operations. Management has set up a policy to require group companies to manage their foreign exchange risk against their functional currency. The Group has certain investments in foreign operations, whose net assets are exposed to foreign currency translation risk.
The impact of weakened/strengthened Korean won by 10% against foreign currencies with all other variables held constant on the pre-tax profit for the year as at December 31, 2017 and 2016, is as follows:
(in millions of Korean won) Impact on pre-tax profit
2017 2016
USD Strengthened \ (109,678) \ (101,364) Weakened 109,678 101,364
EUR Strengthened (23,178) (26,020) Weakened 23,178 26,020
JPY Strengthened (2,794) (7,770) Weakened 2,794 7,770
Others Strengthened 2,637 1,238 Weakened (2,637) (1,238)

Hyosung Corporation and Subsidiaries Notes to Consolidated Financial Statements December 31, 2017 and 2016
42
ii) Price risk The Group is exposed to equity securities price risk because of investments held by the Group and classified on the consolidated statement of financial position either as available-for-sale or at fair value through profit or loss. The Group’s investments in equity of other entities that are publicly traded are included in one of the following two equity indexes: KOSPI equity index and KOSDAQ equity index. As at December 31, 2017 and 2016, the impact of increases/decreases of the stock price by 30% with all other variables held constant on the Group’s equity is as follows:
(in millions of Korean won) Impact on equity 2017 2016 KOSPI Increase \ 40,654 \ 52,703 Decrease (40,654) (52,703) KOSDAQ Increase 2,038 1,665 Decrease (2,038) (1,665)
iii) Interest rate risk Interest rate risk is defined as the risk that the interest income or expenses arising from deposits and borrowings will fluctuate because of changes in future market interest rate. The interest rate risk mainly arises through floating rate deposits and borrowings. The objective of interest rate risk management lies in maximizing corporate value by minimizing uncertainty caused by fluctuations in interest rates and minimizing net interest expense. The Group is exposed to interest rate risk due to its borrowings in fixed and floating interest rates. Borrowings issued at variable rates expose the Group to cash flow interest rate risk which is partially offset by cash held at variable rates. The Group’s policy is to review on interest rate fluctuation periodically so that they can manage whether to repay or renew the borrowings.
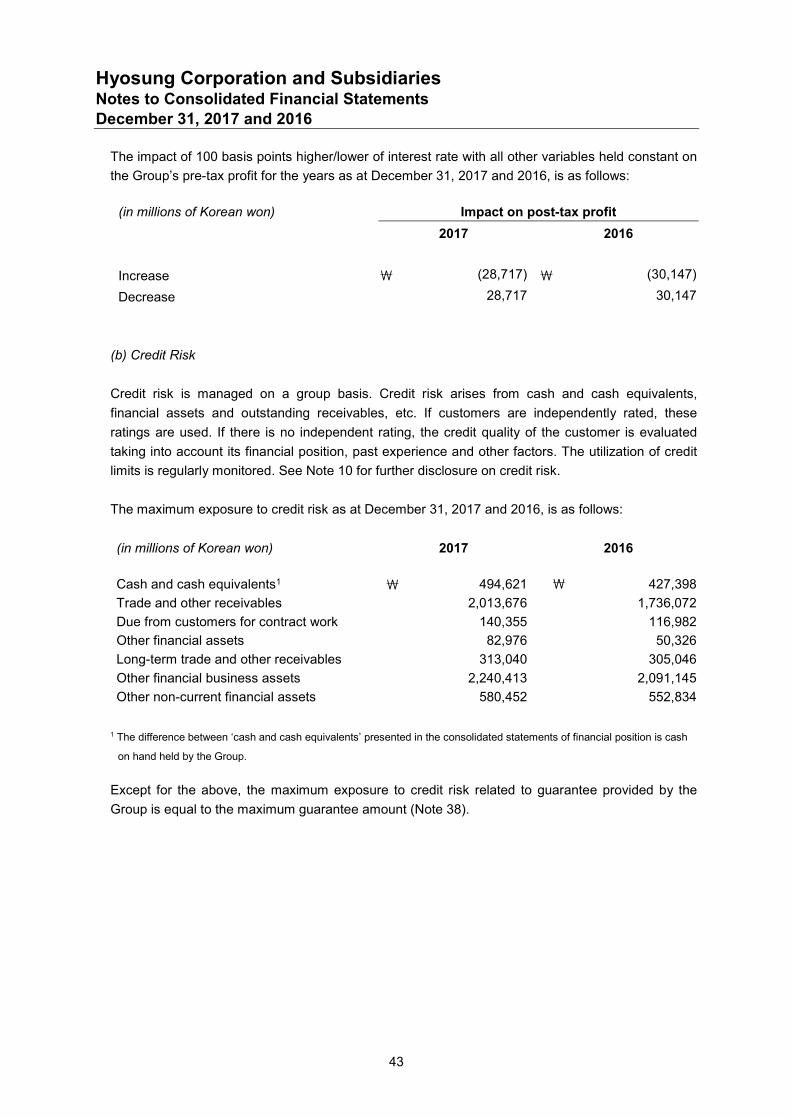
Hyosung Corporation and Subsidiaries Notes to Consolidated Financial Statements December 31, 2017 and 2016
43
The impact of 100 basis points higher/lower of interest rate with all other variables held constant on the Group’s pre-tax profit for the years as at December 31, 2017 and 2016, is as follows:
(in millions of Korean won) Impact on post-tax profit
2017 2016
Increase \ (28,717) \ (30,147)
Decrease 28,717 30,147 (b) Credit Risk Credit risk is managed on a group basis. Credit risk arises from cash and cash equivalents, financial assets and outstanding receivables, etc. If customers are independently rated, these ratings are used. If there is no independent rating, the credit quality of the customer is evaluated taking into account its financial position, past experience and other factors. The utilization of credit limits is regularly monitored. See Note 10 for further disclosure on credit risk. The maximum exposure to credit risk as at December 31, 2017 and 2016, is as follows: (in millions of Korean won) 2017 2016
Cash and cash equivalents1 \ 494,621 \ 427,398 Trade and other receivables 2,013,676 1,736,072 Due from customers for contract work 140,355 116,982 Other financial assets 82,976 50,326 Long-term trade and other receivables 313,040 305,046 Other financial business assets 2,240,413 2,091,145 Other non-current financial assets 580,452 552,834
1 The difference between ‘cash and cash equivalents’ presented in the consolidated statements of financial position is cash
on hand held by the Group.
Except for the above, the maximum exposure to credit risk related to guarantee provided by the Group is equal to the maximum guarantee amount (Note 38).

Hyosung Corporation and Subsidiaries Notes to Consolidated Financial Statements December 31, 2017 and 2016
44
(c) Liquidity Risk The Group monitors rolling forecasts of the Group’s liquidity requirements to ensure it has sufficient cash to meet operational needs while maintaining sufficient headroom on its committed borrowing facilities at all times so that the Group does not breach borrowing limits or covenants (where applicable) on any of its borrowing facilities. Such forecasting takes into consideration the Group’s short-term and long-term debt financing plans, covenant compliance and compliance with internal financial ratio targets. Details of the Group’s liquidity risk analysis as at December 31, 2017 and 2016, are as follows:
(in millions of Korean won) Less than
1 year Between 1 and
5 years
Over 5 years Total
2017
Trade and other payables \ 2,071,812 \ 407,220 \ 14,062 \ 2,493,094 Borrowings(including interest
expense)
5,064,704 2,475,929 19,972 7,559,696
Derivative liabilities1 4,681 - - 4,681
\ 7,141,197 \ 2,882,240 \ 34,034 \ 10,057,471
2016
Trade and other payables \ 1,788,737 \ 373,963 \ 25,286 \ 2,187,986 Borrowings(including interest
expense)
4,535,176 2,819,783 18,845 7,373,804
Derivative liabilities1 36,730 - - 36,730
\ 6,360,643 \ 3,193,746 \ 44,131 \ 9,598,520
1 Trading portfolio derivative instruments have been included at their fair value of \ 4,681 million (2016: \ 36,730 million)
within the less than 1 year time bucket. This is because the contractual maturities are not essential for an understanding of
the timing of the cash flows. These contracts are managed on a net fair value basis rather than by maturity date.
Except for the above, the Group has provided into payment guarantee agreements and capital supplement agreements. Therefore, an additional payment obligation may arise within one year if the guarantor fails to fulfill the obligation (Note 38). Certain amount of borrowings and PF guarantees could be adjusted for interest rates, maturities, etc. immediately when the Group's credit rating is decreased below a certain level or if it does not meet certain financial ratios. The Group determined that the possibility of the events is not high.

Hyosung Corporation and Subsidiaries Notes to Consolidated Financial Statements December 31, 2017 and 2016
45
4.2 Capital Risk Management The Group’s objectives when managing capital are to safeguard the Group’s ability to continue as a going concern in order to provide returns for shareholders and benefits for other stakeholders and to maintain an optimal capital structure to reduce the cost of capital. In order to maintain or adjust the capital structure, the Group may adjust the amount of dividends paid to shareholders, return capital to shareholders, issue new shares or sell assets to reduce debt. The Group monitors capital on the basis of the gearing ratio. This ratio is calculated as net debt divided by total capital. Net debt is calculated as total borrowings (including ‘short and long-term borrowings’ as shown in the consolidated statement of financial position) less cash and cash equivalents. Total capital is calculated as ‘equity’ as shown in the consolidated statement of financial position plus net debt. The gearing ratio as at December 31, 2017 and 2016, are as follows: (in millions of Korean won) 2017 2016
Total borrowings \ 7,262,086 \ 7,042,595 Less: cash and cash equivalents (501,133) (431,707) Net debt (A) 6,760,953 6,610,888 Total equity (B) 3,863,282 3,841,216 Total capital (A+B=C) \ 10,624,235 \ 10,452,104 Gearing ratio (A/C) 63.64% 63.25%
4.3 Fair Value 4.3.1 Fair Value of Financial Instruments by Category The carrying amount of financial instruments approximates to their fair value except for available-for-sale financial assets that are measured at cost as they do not have a quoted market price in an active market and their fair value cannot be measured reliably.

Hyosung Corporation and Subsidiaries Notes to Consolidated Financial Statements December 31, 2017 and 2016
46
4.3.2 Financial Instruments Measured at Cost Details of financial instruments measured at cost as at December 31, 2017 and 2016, are as follows:
(in millions of Korean won) 2017 2016 Available-for-sale financial assets (unlisted)
Oksan Ochang Highway Corporation \ 14,970 \ 14,970
Kumho & Company Incorporation 10,000 10,000
TransLink Capital Partners 1, L.P.
1,364
1,364
Doosan Capital Inc. - 537
The Korea Economic Daily 1,354
1,354 Others 6,764
2,559
Available-for-sale financial assets (investment in capital)
Hyosung Creative Economy Fund 10,000
10,000
Construction Guarantee Cooperative 4,552 3,498
Machinery Financial Cooperative 4,614 4,410 Korea Software Financial Cooperative 700 700
Korea Specialty Contractor Financial Cooperative 277 277
Korea Electrical Manufacturers’ Cooperative 156 156
Others 9,218 1,715
Government Bonds 1,110 689 \ 65,079 \ 52,229
The above equity instruments are measured at cost because they do not have quoted prices in an active market and their fair value cannot be measured reliably. The Group has no intention to dispose of the aforementioned equities in the near future. These equities will be measured at fair value when the Group can develop a reliable estimate of the fair value. 4.3.3 Fair Value Hierarchy Assets measured at fair value or for which the fair value is disclosed are categorized within the fair value hierarchy, and the defined levels are as follows:
§ Quoted prices (unadjusted) in active markets for identical assets or liabilities (Level 1). § Inputs other than quoted prices included within Level 1 that are observable for the asset or
liability, either directly (that is, prices) or indirectly (that is, derived from prices) (Level 2). § Inputs for the asset or liability that are not based on observable market data (that is,
unobservable inputs) (Level 3).

Hyosung Corporation and Subsidiaries Notes to Consolidated Financial Statements December 31, 2017 and 2016
47
Fair value hierarchy classifications of the financial assets and financial liabilities that are measured at fair value or its fair value is disclosed as at December 31, 2017 and 2016, are as follows:
2017 (in millions of Korean won) Level 1 Level 2 Level 3 Total Assets
Available-for-sale financial assets
\ 187,417
\ -
\ 225,102
\ 412,519
Derivative assets - 19,684 3,731 23,415 Other financial assets - 30,080 1,000 31,080
\ 187,417 \ 49,764 \ 229,833 \ 467,014 Liabilities
Derivative liabilities \ - \ 4,681 \ - \ 4,681 \ - \ 4,681 \ - \ 4,681
2016 (in millions of Korean won) Level 1 Level 2 Level 3 Total Assets
Available-for-sale financial assets
\ 238,772
\ -
\ 179,602
\ 418,374
Derivative assets 80 5,176 875 6,131 Other financial assets - 155 1,170 1,325
\ 238,852 \ 5,331 \ 181,647 \ 425,830 Liabilities
Derivative liabilities \ - \ 36,730 \ - \ 36,730 \ - \ 36,730 \ - \ 36,730
4.3.4 Details of changes in Level 3 of the fair value hierarchy for the recurring fair value measurements are as follows: (in millions of Korean won) Available-for-sale financial
assets Derivative assets
2017 2016 2017 2016
Beginning balance \ 179,602
\ 143,587
\ 875 \ 875
Purchases (disposal)
60,992
55,865
(875)
- Amount recognized in other
comprehensive income (10,777) 1,759 - -
Others
(4,715)
(21,609)
3,731
-
Ending balance \ 225,102
\ 179,602
\ 3,731 \ 875
There were no transfers between fair value hierarchy levels of recurring fair value measurements for the years ended December 31, 2017 and 2016.

Hyosung Corporation and Subsidiaries Notes to Consolidated Financial Statements December 31, 2017 and 2016
48
4.3.5 Valuation Technique and the Inputs Valuation techniques and inputs used in levels 2 and 3 fair value measurements are as follows:
(in millions of Korean won) 2017
Fair value Level Valuation
techniques Inputs
Level 3 range of inputs (weighted average)
Other financial assets
\ 31,080 2, 3
DCF method and others
Discount rate, Exchange rate and others
NA
Available-for-sale financial assets
225,102
3
DCF method, Comparable company analysis
Discount rate 5.90%~17.88%
Risk-adjusted discount rate model
Growth rate 1%
Derivatives
Derivative asset
19,684 2 Market approach Discount rate, Exchange rate and others
NA
3,731 3
Binominal model and others
Underlying asset Volatility and others
NA
Derivative liabilities 4,681 2
Market approach
Exchange rate and others
NA
4.3.6 Valuation Processes for Fair Value Measurements Categorized Within Level 3
The Group measures recurring, non-recurring fair value measurements and disclosed fair values categorized within Level 3 of the fair value hierarchy at the end of every reporting period. The Group discusses valuation processes and results with the chief financial officer (CFO).

Hyosung Corporation and Subsidiaries Notes to Consolidated Financial Statements December 31, 2017 and 2016
49
4.3.7 Sensitivity analysis for Recurring Fair Value Measurements Categorized as Level 3 Sensitivity analysis of financial instruments is performed to measure favorable and unfavorable changes in the fair value of financial instruments which are affected by the unobservable parameters, using a statistical technique. When the fair value is affected by more than two input parameters, the most favorable or most unfavorable amounts are presented. The results of the sensitivity analysis for the effect on profit or loss from changes in inputs for each financial instrument that categorized as level 3 and subject to sensitivity analysis, are as follows:
(in millions of Korean won) 2017
Profit or loss Other comprehensive
income of loss
Favorable
changes Unfavorable
changes Favorable changes
Unfavorable changes
Other financial assets(include derivative financial instruments)
\ 4 \ (2) \ - \ -
Available-for-sale financial assets - - 18,862 (10,643) \ 4 \ (2) \ 18,862 \ (10,643)

Hyosung Corporation and Subsidiaries Notes to Consolidated Financial Statements December 31, 2017 and 2016
50
5. Operating Segment Information (a) Operating segment information The management which makes strategic decisions has determined the operating segments. The management makes strategic decisions on allocation of resources to segments and assesses the performance of operating segments based on the operating profit. Product separation units in terms of type of goods were separated as fabric, industrial materials, chemicals, heavy industrial, construction, trading and others.
The Group’s operating segment information for the years ended and as at December 31, 2017 and 2016, is as follows:
2017 (in millions of
Korean won) Fabric Industrial materials Chemical
Heavy industrial Construction Trading Others
Consolidation adjustment Total
Total revenue \ 2,148,953 \ 2,411,355 \ 1,660,579 \ 2,252,072 \ 1,158,359 \ 2,533,444 \ 823,277 \ - \ 12,988,039 Inter-segment
revenue (11,535) (1,092) (159,561) (3,402) (5,389) (253,046) (7,604) - (441,629)
2,137,418 2,410,263 1,501,018 2,248,670 1,152,970 2,280,398 815,673 - 12,546,410
Operating
income(loss) 249,797 167,602 130,645 66,049 106,760 15,468 48,082 (13,596) 770,807 Depreciation and
amortization 191,500 156,772 175,439 45,141 6,482 7,153 68,578 13,483 664,548 Assets
Current assets 1,298,995 1,264,168 393,964 1,303,024 206,957 249,382 551,997 (637,506) 4,630,981 Non-current
assets 1,031,868 1,882,661 1,368,126 966,290 327,272 181,525 5,964,875 (1,816,620) 9,903,997 Investments in
associates - 14,328 14,230 14,361 - - 74,319 - 117,238 Acquisition of
non-current assets 316,990 176,019 132,212 24,211 18,025 3,887 275,687 1,010 948,041
Liabilities Current
liabilities 884,460 1,003,979 384,296 983,081 331,564 528,603 4,061,873 (576,677) 7,601,179 Non-current
liabilities 156,931 164,629 97,249 173,305 243,448 23,538 2,223,183 (11,765) 3,070,518

Hyosung Corporation and Subsidiaries Notes to Consolidated Financial Statements December 31, 2017 and 2016
51
2016 (in millions of
Korean won) Fabric Industrial materials Chemical
Heavy industrial Construction Trading Others
Consolidation adjustment Total
Total revenue \ 1,980,757 \ 2,383,859 \ 1,320,572 \ 2,580,477 \ 900,490 \ 2,290,517 \ 886,733 \ - \ 12,343,405 Inter-segment
revenue (1,653) - (126,320) (23,033) (8,245) (251,772) (3,269) - (414,292)
1,979,104 2,383,859 1,194,252 2,557,444 892,245 2,038,745 883,464 - 11,929,113
Operating
income(loss) 313,002 218,484 148,276 185,365 81,729 8,945 72,780 (12,234) 1,016,347 Depreciation and
amortization 147,506 199,220 144,908 47,157 5,557 5,604 69,928 3,483 623,363 Assets
Current assets 990,909 1,169,622 303,805 1,180,435 310,297 295,809 512,179 (714,609) 4,048,447 Non-current
assets 1,151,498 2,009,720 1,446,222 1,132,734 732,416 94,114 5,398,861 (1,893,210) 10,072,355 Investments in
associates - 15,311 14,969 12,333 - - 72,760 - 115,373 Acquisition of
non-current assets 391,366 224,621 279,058 67,146 89,596 7,542 74,374 (132,243) 1,001,460
Liabilities Current
liabilities 912,549 891,676 296,493 986,765 324,195 295,936 3,710,688 (535,225) 6,883,077 Non-current
liabilities 111,529 259,636 51,717 154,350 480,548 11,537 2,474,058 (146,867) 3,396,508
(b) Geographical segment information Geographical segment information of revenue and other for the years ended December 31, 2017 and 2016, is as follows: (in millions of
Korean won) 2017
Domestic North and
Central America
Asia Europe Others Total
Revenue \ 8,545,330 \ 888,928 \ 2,108,702 \ 885,861 \ 117,589 \ 12,546,410 Non-current assets 1 \ 4,393,550 \ 66,996 \ 1,714,982 \ 321,669 \ 34,326 \ 6,531,523
(in millions of
Korean won) 2016
Domestic North and
Central America
Asia Europe Others Total
Revenue \ 8,898,526 \ 664,154 \ 1,440,320 \ 821,290 \ 104,823 \ 11,929,113 Non-current assets 1 \ 4,760,083 \ 53,520 \ 1,699,648 \ 333,435 \ 47,229 \ 6,893,915
1 Sum of property, plant and equipment, intangible assets, and investment properties.
There is no external customer, who contribute more than 10% of the Group’s revenue for the years ended December 31, 2017and 2016.

Hyosung Corporation and Subsidiaries Notes to Consolidated Financial Statements December 31, 2017 and 2016
52
6. Transfers of Financial Assets
Trade receivables have been discounted through factoring agreements with banks for the years ended December 31, 2017 and 2016. In case of the customer’s default, the Group has an obligation to pay the related amounts to the bank. As a result, this transaction, which is treated as a transaction with recourse, has been accounted for as a collateralized borrowing (Notes 10, 20 and 38). Details of transferred financial assets that are not derecognized in their entirety as at December 31, 2017 and 2016, are as follows:
7. Financial Instruments by Category Categorizations of financial instruments as at December 31, 2017 are as follows:
(in millions of Korean won) 2017
Loans and receivables
Available-for- sale financial
assets
Financial assets at fair value through
profit or loss
Total Assets
Cash and cash equivalents \ 501,133 \ - \ - \ 501,133 Trade and other receivables 2,013,676 - - 2,013,676 Due from customers for contract work 140,355 - - 140,355 Other financial assets 64,671 - 18,305 82,976 Long-term trade and other receivables 313,040 - - 313,040
Other financial business assets 2,240,413 - - 2,240,413 Other non-current financial assets 97,743 477,598 5,111 580,452
\ 5,371,031 \ 477,598 \ 23,416 \ 5,872,045
(in millions of Korean won) 2017 2016 Loan and receivables Carrying amount of assets \ 672,846 \ 658,902
Carrying amount of associated liabilities (690,626) (658,902)
Net position \ (17,780) \ -
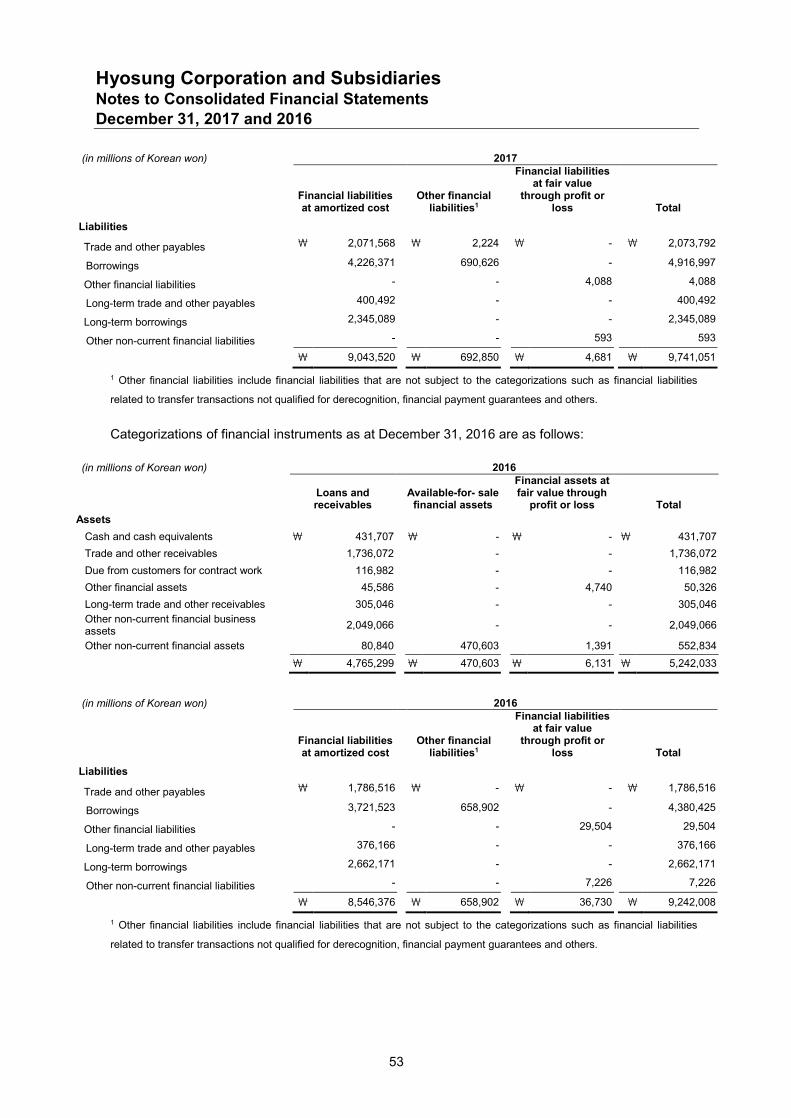
Hyosung Corporation and Subsidiaries Notes to Consolidated Financial Statements December 31, 2017 and 2016
53
(in millions of Korean won) 2017
Financial liabilities at amortized cost
Other financial liabilities1
Financial liabilities at fair value
through profit or loss Total
Liabilities
Trade and other payables \ 2,071,568 \ 2,224 \ - \ 2,073,792
Borrowings 4,226,371 690,626 - 4,916,997
Other financial liabilities - - 4,088 4,088
Long-term trade and other payables 400,492 - - 400,492
Long-term borrowings 2,345,089 - - 2,345,089
Other non-current financial liabilities - - 593 593
\ 9,043,520 \ 692,850 \ 4,681 \ 9,741,051
1 Other financial liabilities include financial liabilities that are not subject to the categorizations such as financial liabilities
related to transfer transactions not qualified for derecognition, financial payment guarantees and others.
Categorizations of financial instruments as at December 31, 2016 are as follows:
(in millions of Korean won) 2016
Loans and receivables
Available-for- sale financial assets
Financial assets at fair value through
profit or loss
Total Assets
Cash and cash equivalents \ 431,707 \ - \ - \ 431,707 Trade and other receivables 1,736,072 - - 1,736,072 Due from customers for contract work 116,982 - - 116,982 Other financial assets 45,586 - 4,740 50,326 Long-term trade and other receivables 305,046 - - 305,046 Other non-current financial business assets 2,049,066 - - 2,049,066
Other non-current financial assets 80,840 470,603 1,391 552,834
\ 4,765,299 \ 470,603 \ 6,131 \ 5,242,033
(in millions of Korean won) 2016
Financial liabilities at amortized cost
Other financial liabilities1
Financial liabilities at fair value
through profit or loss Total
Liabilities
Trade and other payables \ 1,786,516 \ - \ - \ 1,786,516
Borrowings 3,721,523 658,902 - 4,380,425
Other financial liabilities - - 29,504 29,504
Long-term trade and other payables 376,166 - - 376,166
Long-term borrowings 2,662,171 - - 2,662,171
Other non-current financial liabilities - - 7,226 7,226
\ 8,546,376 \ 658,902 \ 36,730 \ 9,242,008
1 Other financial liabilities include financial liabilities that are not subject to the categorizations such as financial liabilities
related to transfer transactions not qualified for derecognition, financial payment guarantees and others.

Hyosung Corporation and Subsidiaries Notes to Consolidated Financial Statements December 31, 2017 and 2016
54
Net gains or net losses on each category of financial instruments for the years ended December 31, 2017 and 2016, are as follows: (in millions of Korean won) 2017
2016
Loans and receivables
Gain (loss) on disposal (profit or loss) \ (1,758) \ (2,025) Interest income 4,535 7,306 Gain on foreign currency translation (68,647) 16,386 Bad debts expense (120,912) (53,441) Reversal of allowance for bad debt 941 129
Available-for-sale financial assets Gain on valuation (other comprehensive income(loss)) (38,534) 16,696 Gain on disposal (profit or loss)1 795 13,814 Impairment loss (profit or loss) (17,052) (1,492) Interest income 22 5 Dividend income 422 188
Financial liabilities at amortized cost Interest expenses (167,022) (161,264) Gain (loss) on foreign currency translation 132,914 (102,527)
Other financial liabilities2 Interest expenses (8,359) (9,022) Gain (loss) on foreign currency translation - 8,156
Derivative assets and liabilities Loss on valuation (profit or loss) 24,357 (19,324) Gain (loss) on transactions (profit or loss) 32,026 19,526
1 The amount reclassified from other comprehensive income to profit or loss. 2 Other financial liabilities include financial liabilities that are not subject to the categorizations such as financial liabilities
related to transfer transactions not qualified for derecognition, financial payment guarantees and others.

Hyosung Corporation and Subsidiaries Notes to Consolidated Financial Statements December 31, 2017 and 2016
55
8. Cash and Cash Equivalents Cash and cash equivalents in the consolidated statements of financial position as at December 31, 2017 and 2016, are identical to the cash and cash equivalents in the consolidated statements of cash flows: (in millions of Korean won) 2017 2016
Cash on hand \ 6,512 \ 4,309 Bank deposits 494,621 427,398
\ 501,133 \ 431,707 9. Restricted Financial Instruments
Restricted financial instruments as at December 31, 2017 and 2016, are as follows:
(in millions of Korean won) Description 2017 2016
Cash and cash equivalents Pledge for borrowings \ 3,766 \ 1,278
Others 9,172 12,883
Other non-current financial assets
Restricted for current deposits and lease deposits received 8,051 1,655
Pledge for borrowings 4,401 2,369 \ 25,390 \ 18,185
10. Trade and Other Receivables
Details of trade and other receivables as at December 31, 2017 and 2016, are as follows:
2017
(in millions of Korean won) Receivable amounts
Provisions for impairment Net book value
Trade receivables \ 1,839,840 \ (72,485) \ 1,767,355 Other receivables 249,641 (3,320) 246,321 Long-term trade receivables 25,480 (10,727) 14,753 Long-term other receivables 417,035 (118,748) 298,287
\ 2,531,996 \ (205,280) \ 2,326,716
2016
(in millions of Korean won) Receivable amounts
Provisions for impairment Net book value
Trade receivables \ 1,593,080 \ (49,142) \ 1,543,938 Other receivables 195,436 (3,303) 192,133 Long-term trade receivables 24,484 (10,725) 13,759 Long-term other receivables 352,804 (61,517) 291,287
\ 2,165,804 \ (124,687) \ 2,041,117

Hyosung Corporation and Subsidiaries Notes to Consolidated Financial Statements December 31, 2017 and 2016
56
The Group sells trade receivables at a discount to the financial institutions for the years ended December 31, 2017 and 2016. The amount of transferred financial assets that are not derecognized in their entirety as at December 31, 2017 is \ 672,846million (2016: \ 658,902 million). The Group may retain an obligation to compensate a financial institution for debtors’ failure to make payment when they become due, an obligation known as a ‘recourse obligation’. Recourse obligations related to the sales of receivables with recourse are accounted for as collateralized borrowings (Notes 6, 20 and 38) Details of other receivables as at December 31, 2017 and 2016, are as follows:
(in millions of Korean won) 2017 2016 Other receivables
Non-trade receivables \ 189,690 \ 165,003 Short-term loans
11,624 4,209 Accrued income 10,368 9,552 Deposits provided 34,639 13,369
246,321 192,133
Long-term other receivables Long-term non-trade
receivables 2,294 2 Long-term loans(Note 38) 112,250 63,254 Deposits provided 183,743 228,031
298,287 291,287 \ 544,608 \ 483,420
The fair value of long-term trade and other receivables is calculated by discounting nominal value of expected future cash inflow at discount rate which reflects credit risk.
2017 2016 Discount rate 1.60%~7.10% 1.80% ~ 5.00% The aging analysis of trade and other receivables as at December 31, 2017 and 2016, are as follows:
(in millions of Korean won) 2017
Past due but not impaired
Receivables not past due
Up to 3 months
4 to 6 months
7 to 12 months
Over 12 months
Impaired
Total
Trade receivables \ 1,368,446 \ 245,126 \ 54,788 \ 47,954 \ 75,331 \ 48,195 \ 1,839,840 Other receivables 236,788 1,841 1,080 2,368 3,448 4,116 249,641
Long-term trade receivables 4,274 - - - - 21,446 25,720
Long-term other receivables 213,253 382 - - 14 204,929 418,578
\ 1,822,761 \ 247,349 \ 55,868 \ 50,322 \ 78,793 \ 278,686 \ 2,533,779
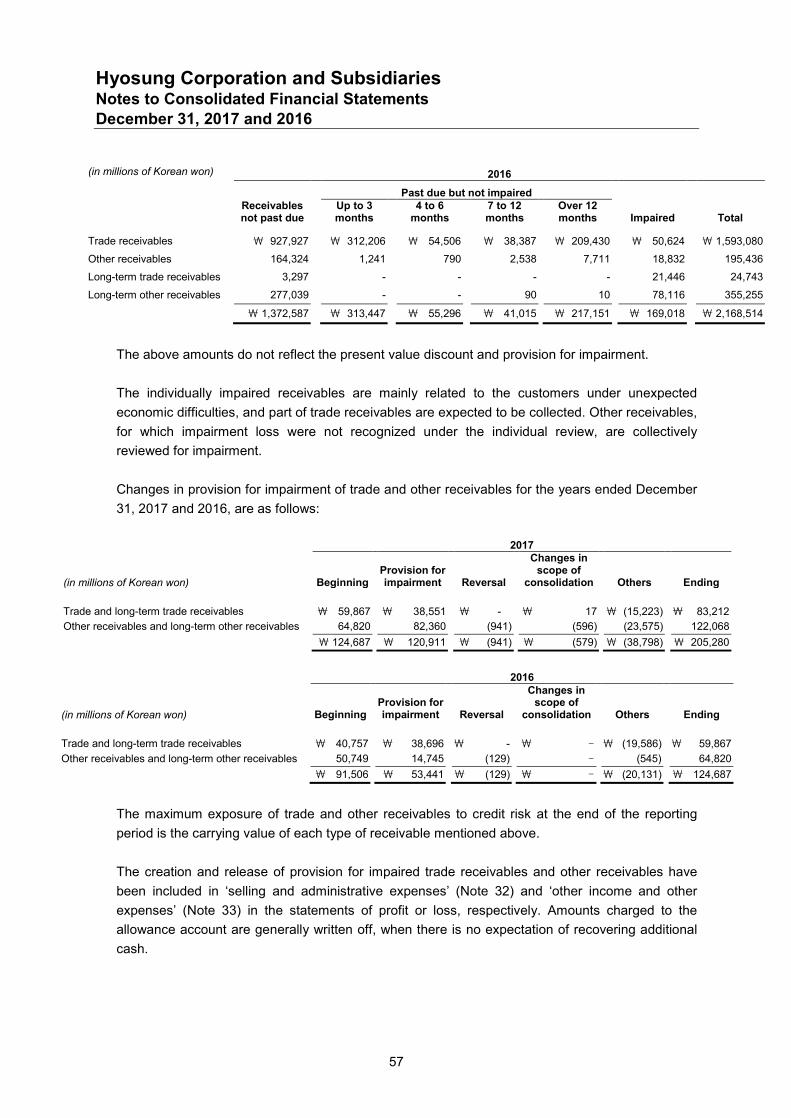
Hyosung Corporation and Subsidiaries Notes to Consolidated Financial Statements December 31, 2017 and 2016
57
(in millions of Korean won) 2016
Past due but not impaired
Receivables not past due
Up to 3 months
4 to 6 months
7 to 12 months
Over 12 months
Impaired
Total
Trade receivables \ 927,927 \ 312,206 \ 54,506 \ 38,387 \ 209,430 \ 50,624 \ 1,593,080
Other receivables 164,324 1,241 790 2,538 7,711 18,832 195,436
Long-term trade receivables 3,297 - - - - 21,446 24,743
Long-term other receivables 277,039 - - 90 10 78,116 355,255
\ 1,372,587 \ 313,447 \ 55,296 \ 41,015 \ 217,151 \ 169,018 \ 2,168,514
The above amounts do not reflect the present value discount and provision for impairment. The individually impaired receivables are mainly related to the customers under unexpected economic difficulties, and part of trade receivables are expected to be collected. Other receivables, for which impairment loss were not recognized under the individual review, are collectively reviewed for impairment. Changes in provision for impairment of trade and other receivables for the years ended December 31, 2017 and 2016, are as follows:
2017
(in millions of Korean won) Beginning
Provision for impairment
Reversal
Changes in scope of
consolidation
Others
Ending
Trade and long-term trade receivables \ 59,867 \ 38,551 \ - \ 17 \ (15,223) \ 83,212 Other receivables and long-term other receivables 64,820 82,360 (941) (596) (23,575) 122,068 \ 124,687 \ 120,911 \ (941) \ (579) \ (38,798) \ 205,280
2016
(in millions of Korean won) Beginning
Provision for impairment
Reversal
Changes in scope of
consolidation
Others
Ending
Trade and long-term trade receivables \ 40,757 \ 38,696 \ - \ - \ (19,586) \ 59,867 Other receivables and long-term other receivables 50,749 14,745 (129) - (545) 64,820 \ 91,506 \ 53,441 \ (129) \ - \ (20,131) \ 124,687
The maximum exposure of trade and other receivables to credit risk at the end of the reporting period is the carrying value of each type of receivable mentioned above. The creation and release of provision for impaired trade receivables and other receivables have been included in ‘selling and administrative expenses’ (Note 32) and ‘other income and other expenses’ (Note 33) in the statements of profit or loss, respectively. Amounts charged to the allowance account are generally written off, when there is no expectation of recovering additional cash.

Hyosung Corporation and Subsidiaries Notes to Consolidated Financial Statements December 31, 2017 and 2016
58
11. Other Financial Assets and Liabilities Other financial assets and liabilities as at December 31, 2017 and 2016, are as follows: (in millions of Korean won) 2017 2016 Other financial assets
Loans and receivables ₩ 162,415 ₩ 126,427 Available-for-sale financial assets 477,598 470,603 Derivative assets 23,415 6,131
663,428 603,161 Less: Current portion (82,976) (50,326)
₩ 580,452 ₩ 552,835
Other financial liabilities
Derivative liabilities ₩ 4,681 ₩ 36,730 Less: Current portion (4,088) (29,504)
₩ 593 ₩ 7,226
Details of loans and receivables as at December 31, 2017 and 2016, are as follows: (in millions of Korean won) 2017 2016 Short-term financial instruments ₩ 64,672 ₩ 45,587 Long-term financial instruments 97,743 80,840 ₩ 162,415 ₩ 126,427
Available-for-sale financial assets as at December 31, 2017 and 2016, are as follows: (in millions of Korean won) 2017 2016 Equity securities
Listed ₩ 187,417 ₩ 238,772 Unlisted 38,228 37,750 Equity investment 214,471 170,826 Beneficiary certificates 36,372 22,566
Debt securities Government bond 1,110 689
477,598 470,603 Less: Current portion - - ₩ 477,598 ₩ 470,603

Hyosung Corporation and Subsidiaries Notes to Consolidated Financial Statements December 31, 2017 and 2016
59
Equity securities in which the Group has more than 20% of voting rights but are not significantly influenced by the Group as at December 31, 2017 and 2016, are as follows: (in millions of Korean won) 2017 2016
Investee
Percentage of ownership
(%)
Acquisition cost
Book value
Book value
Listed stock Chin Hung International Inc.1, 48.17 \ 181,893 \ 135,141 \ 155,320
Unlisted stock
OKSAN OCHANG Highway Corporation2 30.00
14,970 14,970 14,970
\ 196,863 \ 150,111 \ 170,290
1 The shares have been provided as collateral to the Committee of Creditor Banks of Chin Hung International Inc. in
accordance with the special agreement for plans for normalization of the business of Chin Hung International Inc. (Note 38).
Also, although the Group holds more than 20% of total interest, the Group does not have significant influence over Chin
Hung International Inc. in accordance with the special agreement for plans for normalization of the business of Chin Hung
International Inc. Therefore, the shares are classified as available-for-sale financial assets. 2 Although the Group owns 30% ownership in Oksan Ochang Highway Corporation, considered that the Group does not
have significant influence over the entity since the decision for financial and operating policy is under the government’s
control. Therefore, the investment was classified as available-for-sale financial assets.
Changes in available-for-sale financial assets for the years ended December 31, 2017 and 2016, are as follows: (in millions of Korean won)
2017
2016
Beginning balance ₩ 470,603 ₩ 462,942
Acquisition 146,025 76,842
Disposals (75,130) (62,134)
Impairment loss of available-for-sale financial assets (17,053) (1,492)
Net gains (losses) transfer to equity (38,534) 16,696
Net gains (losses) transfer from equity (8,305) - Others
(8) (22,251) Ending balance \ 477,598 \ 470,603
Short-term available-for-sale financial assets \ - \ - Long-term available-for-sale financial assets
477,598 470,603
Changes in unrealized gain or loss on valuation of available-for-sale financial assets according to valuation of their fair values for the years ended from December 31, 2017 and 2016, are as follows: (in millions of Korean won) 2017 2016 Beginning balance ₩ 38,353 ₩ 23,951 Gain(loss) on valuation (46,839) 16,696 Tax effects and
Non-controlling Interests 12,900 (2,294)
Ending balance ₩ 4,414 ₩ 38,353

Hyosung Corporation and Subsidiaries Notes to Consolidated Financial Statements December 31, 2017 and 2016
60
Details of derivatives assets and liabilities as at December 31, 2017 and 2016, are as follows:
2017 2016 (in millions of Korean won) Assets Liabilities Assets Liabilities
Current
Forward exchange contracts ₩ 18,246 ₩ 4,088 ₩ 3,707 ₩ 23,140 Currency swaps 59 - 890 6,364 Other - - 143 -
18,305 4,088 4,740 29,504 Non-current
Forward exchange contracts 1,272 - 466 6,466 Currency swaps - 584 - - Other 3,838 9 925 760 5,110 593 1,391 7,226
₩ 23,415 ₩ 4,681 ₩ 6,131 ₩ 36,730
12. Other Financial Business Assets Details of other financial business assets as at December 31, 2017 and 2016, are as follows: (in millions of Korean won) 2017 2016
Loans and receivables ₩ 2,207,668 ₩ 2,049,066 Operating lease assets 32,745 42,079 ₩ 2,240,413 ₩ 2,091,145
Details of loans and receivables as at December 31, 2017 and 2016, are as follows: (in millions of Korean won) 2017 2016
Loans and receivables ₩ 2,252,472 ₩ 2,105,416 Less: Provision for impairment (44,804) (56,350) ₩ 2,207,668 ₩ 2,049,066
The aging analysis of loans and receivables as at December 31, 2017 and 2016, are as follows: (in millions of Korean won) 2017 2016
Up to 1 year ₩ 254,048 ₩ 312,180 1 to 5 years 1,998,424 1,793,236 ₩ 2,252,472 ₩ 2,105,416
The above amounts do not reflect the present value discount and provision for impairment.

Hyosung Corporation and Subsidiaries Notes to Consolidated Financial Statements December 31, 2017 and 2016
61
Movements on the provision for impairment of trade receivables for the years ended December 31, 2017 and 2016, are as follows: (in millions of Korean won) 2017 2016 Beginning balance ₩ 56,350 ₩ 33,554
Provision for impairment 50,753 45,964 Write-off (68,354) (20,775) Others 6,055 (2,393)
Ending balance ₩ 44,804 ₩ 56,350
The aging analysis of loans and receivables as at December 31, 2017 and 2016, are as follows: (in millions of Korean won) 2017 2016
Loans and receivables
Receivables not past due ₩ 2,060,754 ₩ 1,896,792 Past due but not impaired 43,434 38,927 Impaired 145,494 166,105
Total ₩ 2,249,682 ₩ 2,101,824
13. Other Assets Details of other assets as at December 31, 2017 and 2016, are as follows: (in millions of Korean won) 2017 2016
Other current assets Advance payments ₩ 142,841 ₩ 126,095 Provision for impairment (290) (290) Prepaid expenses 46,490 41,358 Other 1,538 1,989
190,579 169,152
Other non-current assets Long-term advance payments
7,225
-
Long-term prepaid expenses 23,943 28,426 Other investments 34,518 34,340
65,686 62,766 ₩ 256,265 ₩ 231,918

Hyosung Corporation and Subsidiaries Notes to Consolidated Financial Statements December 31, 2017 and 2016
62
14. Inventories Inventories as at December 31, 2017 and 2016, are as follows: 2017 (in millions of Korean won) Acquisition
cost Provision Net book
amount
Merchandise ₩ 320,708 ₩ (2,532) ₩ 318,176 Finished goods 614,995 (43,057) 571,938 Semi-finished goods 188,074 (8,018) 180,056 Work-in-process 91,461 (605) 90,856 Processing materials on trust 22 - 22 Raw materials 265,671 (8,257) 257,414 Sub-materials 53,350 (2,001) 51,349 Supplies 14,032 (556) 13,476 Packaging 8,778 (235) 8,543 Goods in transit 179,189 - 179,189 Cost accrued on construction contract 6,030 - 6,030 Temporary installations 65 - 65 Sites 4,920 (2,101) 2,819 ₩ 1,747,295 ₩ (67,362) ₩ 1,679,933
2016 (in millions of Korean won) Acquisition
cost Provision Net book
amount
Merchandise ₩ 351,539 ₩ (6,629) ₩ 344,910 Finished goods 419,082 (20,799) 398,283 Semi-finished goods 176,821 (3,654) 173,167 Work-in-process 102,506 - 102,506 Processing materials on trust 26 - 26 Raw materials 249,951 (7,938) 242,013 Sub-materials 43,937 - 43,937 Supplies 11,421 - 11,421 Packaging 8,441 - 8,441 Goods in transit 175,799 - 175,799 Cost accrued on construction contract 6,532 - 6,532 Temporary installations 65 - 65 Sites 25,945 (8,275) 17,670 ₩ 1,572,065 ₩ (47,295) ₩ 1,524,770
The cost of inventories recognized as expense and included in ‘cost of sales’ amounted to ₩ 6,960,329 million (2016: ₩ 6,054,103 million) for the year ended December 31, 2017. The Group recognized ₩ 20,067 million (2016: reversal of provision for inventories amounting to ₩ 23,952 million) of reversal of provision for inventories, and the expense has been included in ‘cost of sales’ in the consolidated statement of profit or loss.

Hyosung Corporation and Subsidiaries Notes to Consolidated Financial Statements December 31, 2017 and 2016
63
15. Property, Plant and Equipment Property, plant and equipment as at December 31, 2017 and 2016, are as follows: 2017 (in millions of Korean won) Acquisition cost Accumulated
depreciation1 Net book amount
Land ₩ 1,570,058 ₩ - ₩ 1,570,058 Building 1,744,262 (484,532) 1,259,730 Structures 374,894 (107,572) 267,322 Machinery 6,522,950 (4,515,089) 2,007,861 Vehicles 48,356 (36,695) 11,661 Tool and equipment 600,403 (449,293) 151,110 Others 164,322 (61,989) 102,333 Construction in progress 282,303 - 282,303 Machinery in transit 10,798 - 10,798 ₩ 11,318,346 ₩ (5,655,170) ₩ 5,663,176
2016 (in millions of Korean won) Acquisition cost Accumulated
depreciation1 Net book amount
Land ₩ 1,562,977 ₩ - ₩ 1,562,977 Building 1,546,771 (452,205) 1,094,566 Structures 357,496 (99,673) 257,823 Machinery 6,303,220 (4,160,054) 2,143,166 Vehicles 50,089 (36,860) 13,229 Tool and equipment 538,413 (406,280) 132,133 Others 174,302 (39,455) 134,847 Construction in progress 487,344 - 487,344 Machinery in transit 18,937 - 18,937 ₩ 11,039,549 ₩ (5,194,527) ₩ 5,845,022
1 Accumulated impairment losses are included

Hyosung Corporation and Subsidiaries Notes to Consolidated Financial Statements December 31, 2017 and 2016
64
Changes in property, plant and equipment for the years ended December 31, 2017 and 2016, are as follows:
2017 (in millions of Korean
won) Land Building Structure Machinery Vehicle Tool and
equipment Others Construction
in progress Machinery
in transit Total
Beginning balance ₩1,562,977 ₩ 1,094,566 ₩ 257,823 ₩ 2,143,166 ₩ 13,229 ₩ 132,133 ₩ 134,847 ₩ 487,344 ₩ 18,937 ₩ 5,845,022
Acquisition 7,572 4,785 1,964 43,786 2,250 44,463 3,799 535,019 85,516 729,154
Disposal (1,211) (469) (389) (577) (625) (3,543) (2,179) (8,997) - (17,970) Depreciation and
others1 - (51,975) (10,457) (467,507) (4,596) (49,964) (6,009) - - (590,508) Impairment loss2 - - (178) (80,415) - (1,824) (23,338) (827) - (106,582)
Transfers3 5,673 255,563 22,601 469,203 2,124 31,943 (372) (717,635) (92,560) (23,460) Government grants
received - (1,707) - (1,585) - (113) - - - (3,405)
Others (changes in exchange rate) (1,435) (40,800) (3,879) (97,143) (648) (1,997) (2,326) (12,601) (1,095) (161,924)
Changes in scope of consolidation (3,518) (233) (163) (1,087) (73) 12 (2,089) - - (7,151)
Ending balance ₩1,570,058 ₩1,259,730 ₩ 267,322 ₩2,007,861 ₩11,661 ₩ 151,110 ₩ 102,333 ₩ 282,303 ₩ 10,798 ₩ 5,663,176
1 Depreciation and others include \ 796 million of shrinkage loss from others and \ 947 million of supplies expenses. 2 Due to the accumulated operating loss, the Group has performed impairment test in order to review the recoverable
amount of the cash-generating unit. As a result, the carrying amount of property, plant and equipment exceeded the
recoverable amounts and recognized an impairment loss of POK business for \ 27,593 million, optical film segment for
\ 8,695 million, carbon material business for \ 36,125 million, Wellington business for \ 23,338 million and Tire cords
- Eongyang factory for \ 10,847 million. The impairment loss is presented as other expenses in the consolidated
statement of profit or loss. The amount includes impairment loss of intangible assets of \ 72 million and presented in
other expenses in the consolidated statement of profit or loss. The recoverable amount of the cash-generating unit is
determined based on the fair value less costs of disposal or value in use. The estimate of the fair value less costs of
disposal to be received for the disposal of an asset at the end of period is the amount that an entity expects to obtain
from the disposal of the asset in an arm’s length transaction between knowledgeable, willing parties, after deducting the
estimated costs of disposal. Value in use is determined by discounting expected future cash flows from continuing use of
the assets. The value of use is calculated by discounting the estimated future cash flow at an appropriate discount rate
and using an independent external valuation report. 3 Transfers include construction in progress, machinery in transit and investment property.

Hyosung Corporation and Subsidiaries Notes to Consolidated Financial Statements December 31, 2017 and 2016
65
2016 (in millions of Korean
won) Land Building Structure Machinery Vehicle Tool and
equipment Others Construction
in progress Machinery
in transit Total
Beginning balance ₩1,553 ,291 ₩ 1,066,230 ₩ 246,087 ₩ 2,098,030 ₩ 12,255 ₩ 136,414 ₩ 94,608 ₩ 419,372 ₩ 2,556 ₩ 5,628,843
Acquisition 7,998 22,987 2,111 37,662 3,427 26,511 4,898 639,902 130,221 875,717
Disposal (1,493) (24,449) (1,811) (9,445) (877) (3,426) (3,093) (1,949) - (46,543) Depreciation and
others1 - (44,488) (9,417) (438,446) (4,507) (50,575) (10,066) (3) - (557,502) Impairment loss2 - (11,886) (1,423) (25,448) (6) (425) - - - (39,188)
Transfers3 2,279 92,841 25,115 488,606 2,814 23,994 47,891 (573,625) (114,040) (4,125) Government grants
received - (8,010) - (11,278) - (370) - - - (19,658)
Others (changes in exchange rate) 902 3,465 982 7,669 136 215 609 3,647 200 17,825
Changes in scope of consolidation - (2,124) (3,821) (4,184) (13) (205) - - - (10,347)
Ending balance ₩1,562,977 ₩ 1,094,566 ₩ 257,823 ₩ 2,143,166 ₩ 13,229 ₩ 132,133 ₩ 134,847 ₩ 487,344 ₩ 18,937 ₩ 5,845,022
1 Depreciation and others include \ 1,105 million of shrinkage loss from others and \ 1,772 million of supplies expenses. 2 Due to the accumulated operating loss in the optical film segment, a separate cash-generating unit in the operating
segment of chemicals, the Group recognized impairment loss, amounting to \ 23,798 million, as other expenses. 3 Transfers include construction in progress, machinery in transit and investment property.
Depreciation expense of \ 552,699 million (2016: \ 516,536 million) has been charged to ‘cost of sales’, \ 24,133 million (2016: \ 25,306 million) to ‘selling and administrative expenses’, and \ 11,934 million (2016: \ 12,783 million) to ‘research and development expenses’ for the year ended December 31, 2017. The Group has capitalized borrowing costs amounting to \ 2,753 million (2016: \ 11,473 million) on qualifying assets for the year ended December 31, 2017. The capitalization rate of borrowings used to determine the amount of borrowing costs eligible for capitalization is 2.99~4.58 % (2016: 2.76~4.58%) for the year ended December 31, 2017. Certain amount of property, plant and equipment are provided as collaterals to financial institutions for borrowings (Notes 20 and 38).

Hyosung Corporation and Subsidiaries Notes to Consolidated Financial Statements December 31, 2017 and 2016
66
Details of minimum lease payments in relation to non-cancellable operating leases that are payable at the end of the reporting periods are as follows: (in millions of Korean won) 2017 2016
Up to 1 year ₩ 24,152 ₩ 40,275 1 to 5 years 57,700 46,071 Later than 5 years 315 221 ₩ 82,167 ₩ 86,567
Rental payments of \ 45,312 million (2016: \ 40,098 million) under the above operating lease are recognized in the consolidated statement of profit or loss In connection with the development of Polyketone materials and other national research projects, the Group entered into development agreements with the participants of the agreement, including the Korea Evaluation Institute of Industrial Technology, and is conducting R & D activities. As at December 31, 2017, the government grants related to assets is \ 29,957 million (2016 : \ 34,006 million) and government grants related to liabilities is \ 19,124 million (2016 : \ 19,739 million).

Hyosung Corporation and Subsidiaries Notes to Consolidated Financial Statements December 31, 2017 and 2016
67
16. Investment Property Details of investment property as at December 31, 2017 and 2016, are as follows: 2017
(in millions of Korean won) Acquisition cost Accumulated depreciation1 Net book value
Land \ 353,760 \ 0(3,485) \ 350,275 Building 256,123 (56,182) 199,941 \ 609,883 \ (59,667) \ 550,216 2016
(in millions of Korean won) Acquisition cost Accumulated depreciation1 Net book value
Land \ 384,149 \ 0(3,485) \ 380,664 Building 299,901 (51,742) 248,159 \ 684,050 \ (55,227) \ 628,823
1 Accumulated depreciation includes accumulated impairment loss.
Changes in investment property for the years ended December 31, 2017 and 2016, are as follows: (in millions of Korean won) 2017 2016
Land Building Total Land Building Total
Beginning balance \ 380,664 \ 248,159 \ 628,823 \ 366,571 \ 253,433 \ 620,004
Acquisition - 780 780
3,366
960
4,326
Disposal (33,429) (32,160) (65,589)
(4,208)
(2,408)
(6,616)
Depreciation - (20,072) (20,072)
-
(5,106)
(5,106)
Transfer 3,040 3,234 6,274
14,935
1,280
16,215
Ending balance \ 350,275 \ 199,941 \ 550,216 \ 380,664 \ 248,159 \ 628,823
During 2017, rental income from investment property is \ 40,238 million (2016: \ 38,192 million), and operating expenses (including depreciation) arising from investment property that generated rental income for the year are \ 41,468 million (2016: \ 21,937 million). Fair value of investment properties as at December 31, 2017 is \ 695,271 million (2016: \ 777,489 million). The valuation of investment properties is based on the official land price.
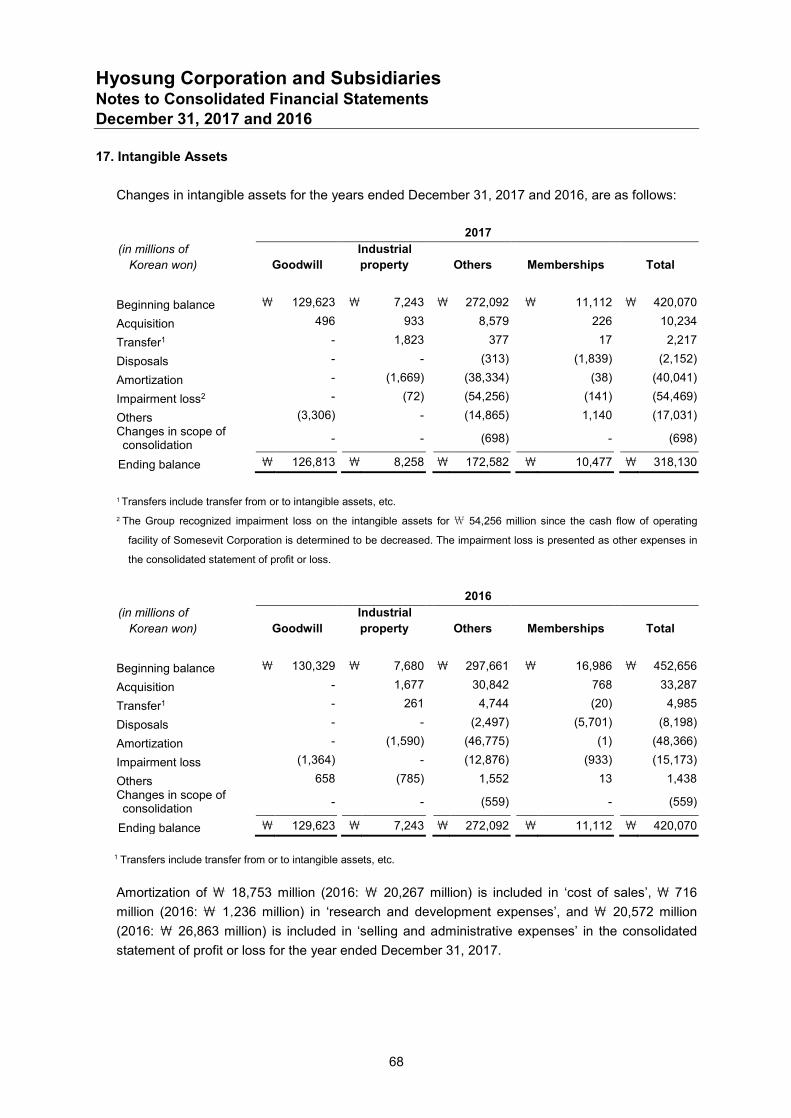
Hyosung Corporation and Subsidiaries Notes to Consolidated Financial Statements December 31, 2017 and 2016
68
17. Intangible Assets Changes in intangible assets for the years ended December 31, 2017 and 2016, are as follows:
2017 (in millions of
Korean won) Goodwill
Industrial property
Others
Memberships Total
Beginning balance \ 129,623 \ 7,243 \ 272,092 \ 11,112 \ 420,070
Acquisition 496 933 8,579 226 10,234
Transfer1 - 1,823 377 17 2,217
Disposals - - (313) (1,839) (2,152)
Amortization - (1,669) (38,334) (38) (40,041)
Impairment loss2 - (72) (54,256) (141) (54,469)
Others (3,306) - (14,865) 1,140 (17,031) Changes in scope of consolidation - - (698) - (698)
Ending balance \ 126,813 \ 8,258 \ 172,582 \ 10,477 \ 318,130
1 Transfers include transfer from or to intangible assets, etc. 2 The Group recognized impairment loss on the intangible assets for \ 54,256 million since the cash flow of operating
facility of Somesevit Corporation is determined to be decreased. The impairment loss is presented as other expenses in
the consolidated statement of profit or loss.
2016
(in millions of Korean won) Goodwill
Industrial property
Others
Memberships Total
Beginning balance \ 130,329 \ 7,680 \ 297,661 \ 16,986 \ 452,656
Acquisition - 1,677 30,842 768 33,287
Transfer1 - 261 4,744 (20) 4,985
Disposals - - (2,497) (5,701) (8,198)
Amortization - (1,590) (46,775) (1) (48,366)
Impairment loss (1,364) - (12,876) (933) (15,173)
Others 658 (785) 1,552 13 1,438 Changes in scope of consolidation - - (559) - (559)
Ending balance \ 129,623 \ 7,243 \ 272,092 \ 11,112 \ 420,070
1 Transfers include transfer from or to intangible assets, etc.
Amortization of \ 18,753 million (2016: \ 20,267 million) is included in ‘cost of sales’, \ 716 million (2016: \ 1,236 million) in ‘research and development expenses’, and \ 20,572 million (2016: \ 26,863 million) is included in ‘selling and administrative expenses’ in the consolidated statement of profit or loss for the year ended December 31, 2017.

Hyosung Corporation and Subsidiaries Notes to Consolidated Financial Statements December 31, 2017 and 2016
69
Impairment tests for goodwill Goodwill is monitored by the management at the operating segment or cash generating level. There is no changes in goodwill allocation method in 2017 and 2016. The following is a summary of goodwill allocation for each operating segment.
2017
(in millions of Korean won) Beginning Increase Disposals Impairment
loss Other
adjustments Ending Fabric \ 6,654 \ - \ - \ - \ - \ 6,654 Industrial Materials 44,027 - - - (3,306) 40,721 Heavy industrial - 496 - - - 496 Trading 2,216 - - - - 2,216 Others 76,726 - - - - 76,726
\ 129,623 \ 496 \ - \ - \ (3,306) \ 126,813
2016
(in millions of Korean won) Beginning Increase Disposals Impairment
loss Other
adjustments Ending Fabric \ 6,654 \ - \ - \ - \ - \ 6,654 Industrial Materials 44,041 - - (581) 567 44,027 Trading 2,216 - - - - 2,216 Others 77,418 - - (783) 91 76,726
\ 130,329 \ - \ - \ (1,364) \ 658 \ 129,623
Goodwill impairment reviews are undertaken annually. As a result of Impairment test, the carrying value of other operating segments does not exceed the recoverable amounts. The recoverable amounts have been determined based on value-in-use calculations. These calculations use pre-tax cash flow projections based on financial budgets approved by management covering a five-year period. Gross rate used for the projection of five-year period and perpetual growth rate used for the period after are stated below. The growth rates do not exceed the long-term average growth rate for the business in which the CGU operates. The key assumptions used for value-in-use calculations in 2017 are as follows:
Industrial materials1 Others
Gross margin
21.79% 46.94%
Growth rate2
9.63% 5.71%
Perpetual growth rate3
3.00% 1.00%
Pre-tax discount rate4
12.0%~15.5% 9.60%
1 It is applicable to particular cash-generating-unit in industrial materials department.
2 The average revenue growth rate, which is computed based on historical growth rate, is used to forecast five years of
cash flow. 3 Projected growth rate over five years. 4 Pre-tax discount rate applied to the cash flow projections.
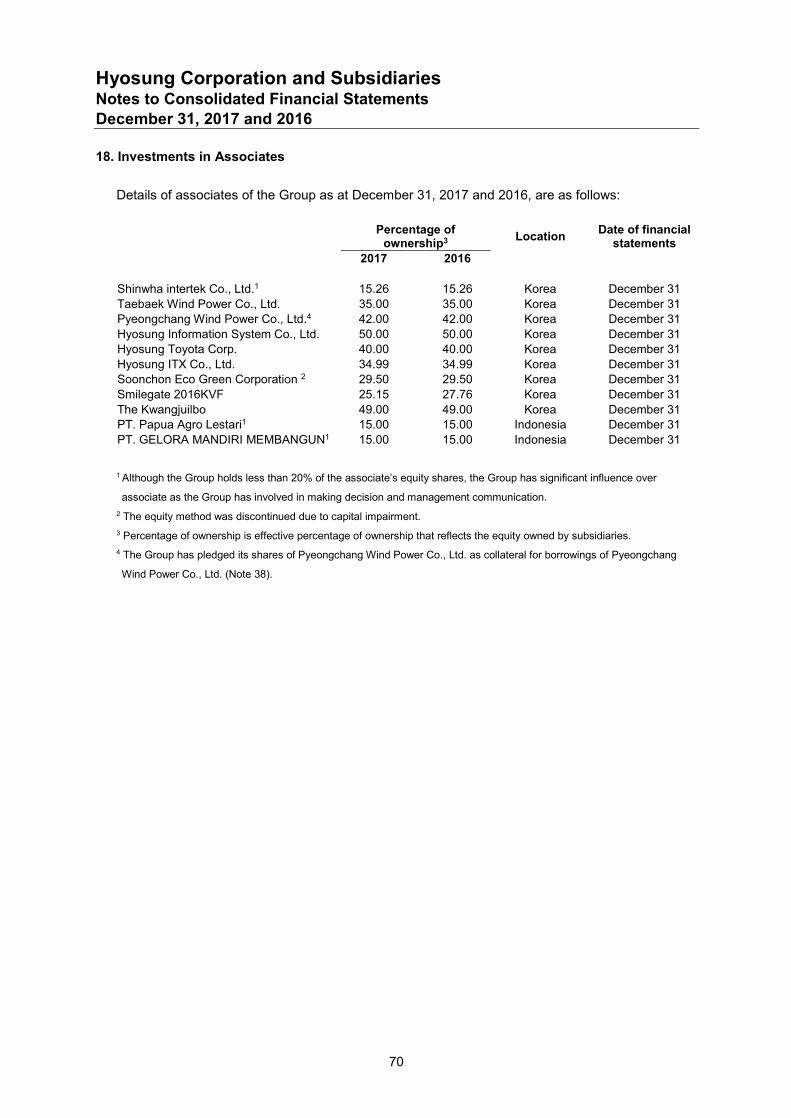
Hyosung Corporation and Subsidiaries Notes to Consolidated Financial Statements December 31, 2017 and 2016
70
18. Investments in Associates Details of associates of the Group as at December 31, 2017 and 2016, are as follows:
Percentage of
ownership3 Location Date of financial statements
2017 2016 Shinwha intertek Co., Ltd.1 15.26 15.26 Korea December 31 Taebaek Wind Power Co., Ltd. 35.00 35.00 Korea December 31 Pyeongchang Wind Power Co., Ltd.4 42.00 42.00 Korea December 31 Hyosung Information System Co., Ltd. 50.00 50.00 Korea December 31 Hyosung Toyota Corp. 40.00 40.00 Korea December 31 Hyosung ITX Co., Ltd. 34.99 34.99 Korea December 31 Soonchon Eco Green Corporation 2 29.50 29.50 Korea December 31 Smilegate 2016KVF 25.15 27.76 Korea December 31 The Kwangjuilbo 49.00 49.00 Korea December 31 PT. Papua Agro Lestari1 15.00 15.00 Indonesia December 31 PT. GELORA MANDIRI MEMBANGUN1 15.00 15.00 Indonesia December 31
1 Although the Group holds less than 20% of the associate’s equity shares, the Group has significant influence over
associate as the Group has involved in making decision and management communication.
2 The equity method was discontinued due to capital impairment. 3 Percentage of ownership is effective percentage of ownership that reflects the equity owned by subsidiaries. 4 The Group has pledged its shares of Pyeongchang Wind Power Co., Ltd. as collateral for borrowings of Pyeongchang
Wind Power Co., Ltd. (Note 38).
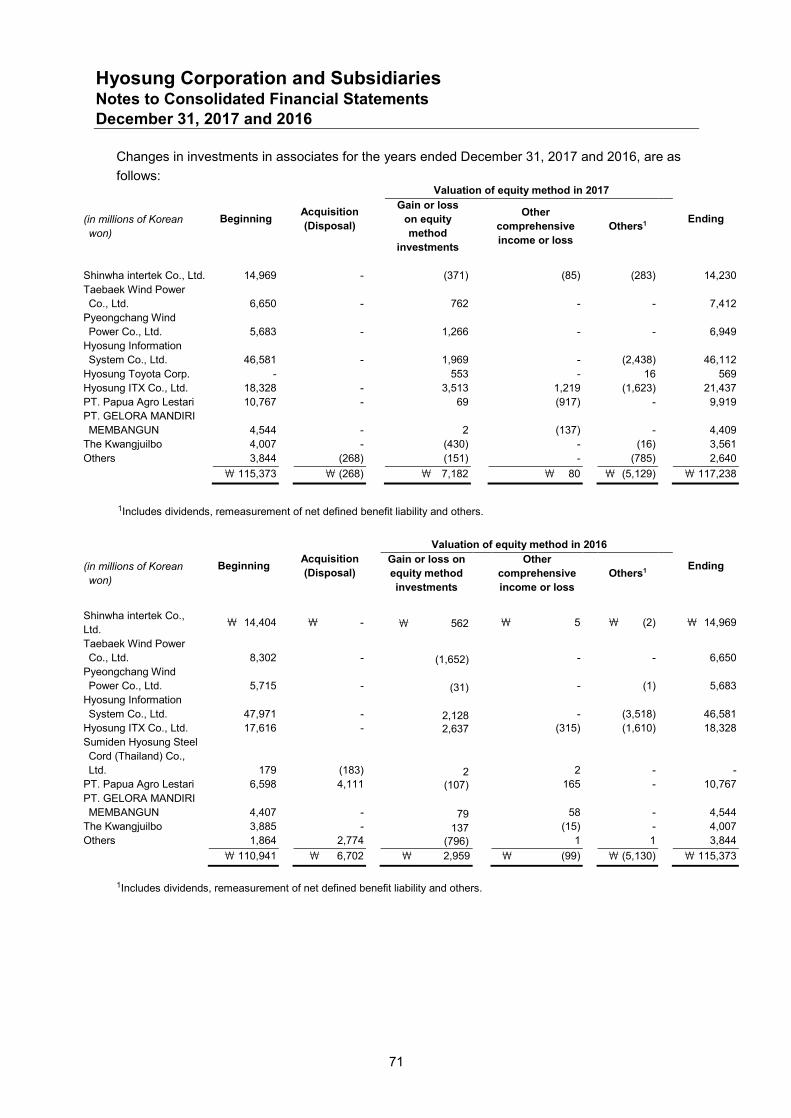
Hyosung Corporation and Subsidiaries Notes to Consolidated Financial Statements December 31, 2017 and 2016
71
Changes in investments in associates for the years ended December 31, 2017 and 2016, are as follows:
Beginning
Acquisition (Disposal)
Valuation of equity method in 2017
Ending (in millions of Korean won)
Gain or loss on equity method
investments
Other comprehensive income or loss Others1
Shinwha intertek Co., Ltd. 14,969
- (371) (85) (283) 14,230
Taebaek Wind Power Co., Ltd. 6,650 - 762 - - 7,412
Pyeongchang Wind Power Co., Ltd. 5,683 - 1,266 - - 6,949
Hyosung Information System Co., Ltd. 46,581 - 1,969 - (2,438) 46,112
Hyosung Toyota Corp. - 553 - 16 569 Hyosung ITX Co., Ltd. 18,328 - 3,513 1,219 (1,623) 21,437 PT. Papua Agro Lestari 10,767 - 69 (917) - 9,919 PT. GELORA MANDIRI MEMBANGUN 4,544 - 2 (137) - 4,409
The Kwangjuilbo 4,007 - (430) - (16) 3,561 Others 3,844 (268) (151) - (785) 2,640
\ 115,373
\ (268) \ 7,182 \ 80 \ (5,129) \ 117,238
1Includes dividends, remeasurement of net defined benefit liability and others.
Beginning
Acquisition (Disposal)
Valuation of equity method in 2016 Ending (in millions of Korean
won)
Gain or loss on equity method investments
Other comprehensive income or loss Others1
Shinwha intertek Co., Ltd.
\ 14,404 \ - \ 562 \ 5 \ (2) \ 14,969
Taebaek Wind Power Co., Ltd. 8,302 - (1,652) - - 6,650
Pyeongchang Wind Power Co., Ltd. 5,715 - (31) - (1) 5,683
Hyosung Information System Co., Ltd. 47,971 - 2,128 - (3,518) 46,581
Hyosung ITX Co., Ltd. 17,616 - 2,637 (315) (1,610) 18,328 Sumiden Hyosung Steel Cord (Thailand) Co., Ltd. 179 (183) 2 2 - -
PT. Papua Agro Lestari 6,598 4,111 (107) 165 - 10,767 PT. GELORA MANDIRI MEMBANGUN 4,407 - 79 58 - 4,544
The Kwangjuilbo 3,885 - 137 (15) - 4,007 Others 1,864 2,774 (796) 1 1 3,844
\ 110,941 \ 6,702 \ 2,959 \ (99) \ (5,130) \ 115,373
1Includes dividends, remeasurement of net defined benefit liability and others.

Hyosung Corporation and Subsidiaries Notes to Consolidated Financial Statements December 31, 2017 and 2016
72
Summary of condensed financial information of major associates, details of adjustments from the book amount of investments in associates, and dividends received from associates as at and for the years ended December 31, 2017 and 2016, are as follows:
(in millions of Korean won)
2017
Current assets
Non-current assets
Current liabilities
Non-current liabilities
Shinwha intertek Co., Ltd. \ 71,055 \ 125,213 \ 95,420 \ 7,595
Taebaek Wind Power Co., Ltd. 4,745 34,330 2,511 15,385 Pyeongchang Wind Power Co., Ltd. 9,123 67,886 880 59,583 Hyosung Information System Co., Ltd. 127,795 17,708 48,511 4,768 Hyosung Toyota Corp. 10,026 7,595 10,896 5,304 Hyosung ITX Co., Ltd.
105,202 36,472 72,732 7,541 PT. Papua Agro Lestari 31,951 30,862 4,013 13,949 PT. GELORA MANDIRI MEMBANGUN 1,998 44,303 4,214 35,493 The Kwangjuilbo 4,130 18,068 10,697 4,235
(in millions of Korean won) 2017
Revenue
Profit (loss) from
continuing operations
Other
comprehensive income
Total
comprehensive income (loss)
Dividends received
from associates
Shinwha intertek Co., Ltd. \ 176,569 \ (1,879) \ (557) \ (2,436) \ (222)
Taebaek Wind Power Co., Ltd. 7,056 2,215 - 2,215 -
Pyeongchang Wind Power Co., Ltd. 11,907 3,038 - 3,038 -
Hyosung Information System Co., Ltd. 1 197,460 5,318 - 5,318 (2,595) Hyosung Toyota Corp 79,022 3,235 - 3,235 - Hyosung ITX Co., Ltd. 1
395,062 10,013 3,486 13,499 (874) PT. Papua Agro Lestari 3,074 84 7 91 - PT. GELORA MANDIRI MEMBANGUN
- (434) 12 (422) - The Kwangjuilbo 8,329 (738) - (738) -

Hyosung Corporation and Subsidiaries Notes to Consolidated Financial Statements December 31, 2017 and 2016
73
(in millions of Korean won)
2016
Current assets
Non-current assets
Current liabilities
Non-current liabilities
Shinwha intertek Co., Ltd. \ 75,435 \ 131,404 \ 98,450 \ 10,304
Taebaek Wind Power Co., Ltd. 6,408 36,622 2,405 21,624 Hyosung Information System Co., Ltd. 179,697 19,294 101,025 4,806 Hyosung ITX Co., Ltd. 94,334 32,289 66,960 7,218 PT. Papua Agro Lestari 39,518 23,538 3,007 9,544 PT. GELORA MANDIRI MEMBANGUN 4,197 39,101 1,083 34,723 Pyeongchang Wind Power Co., Ltd. 2,707 72,621 298 61,500 The Kwangjuilbo 3,191 19,475 10,224 4,265
(in millions of Korean won) 2016
Revenue
Profit (loss) from
continuing operations
Other
comprehensive income
Total
comprehensive income (loss)
Dividends received
from associates
Shinwha intertek Co., Ltd. \ 215,890 \ (9,629) \ 8,260 \ (1,369) \ -
Taebaek Wind Power Co., Ltd. 5,741 (4,721) - (4,721) -
Pyeongchang Wind Power Co., Ltd. 226,817 4,256 432 4,688 (3,460)
Hyosung Information System Co., Ltd. 1 342,188 7,537 3,832 11,369 (439) Hyosung Toyota Corp 7,591 (712) (1,500) (2,212) - Hyosung ITX Co., Ltd. 1
2,601 528 449 977 - PT. Papua Agro Lestari 3,997 (75) - (75) - PT. GELORA MANDIRI MEMBANGUN 8,103 280 - 280 - The Kwangjuilbo
215,890 (9,629) 8,260 (1,369) -

Hyosung Corporation and Subsidiaries Notes to Consolidated Financial Statements December 31, 2017 and 2016
74
Details of adjustments from financial information of major associates to the book amount of investments in associates for the years ended December 31, 2017 and 2016, are as follows:
(in millions of Korean won) 2017
Net assets (a) Percentage of ownership (b)
Interests in net assets
(axb) Goodwill Inter-group
transactions Others Book
amount
Shinwha intertek Co., Ltd. \ 93,252 15.26% \ 14,230 \ - \ - \ - \ 14,230 Taebaek Wind Power Co., Ltd. 21,178 35.00% 7,412 - - - 7,412 Pyeongchang Wind Power Co.,
Ltd. 16,546 42.00% 6,949 - - - 6,949
Hyosung Information System Co., Ltd. 92,224 50.00% 46,112 - - - 46,112
Hyosung Toyota Corp 1,422 40.00% 569 - - 569 Hyosung ITX Co., Ltd. 61,400 34.99% 21,484 - - (47) 21,437 PT. Papua Agro Lestari 44,851 15.00% 6,728 3,191 - - 9,919 PT. GELORA MANDIRI MEMBANGUN 6,595 15.00% 989 3,420 - - 4,409
The Kwangjuilbo 7,266 49.00% 3,561 - - - 3,561
(in millions of Korean won) 2016
Net assets (a)
Percentage of
ownership (b)
Interests in net assets
(axb) Goodwill Inter-group
transactions Others Book
amount
Shinwha intertek Co., Ltd. \ 98,086 15.26% \ 14,969 \ - \ - \ - \ 14,969 Taebaek Wind Power Co., Ltd. 19,001 35.00% 6,650 - - 6,650 Hyosung Information System Co.,
Ltd. 93,161 50.00% 46,581 - - - 46,581 Hyosung ITX Co., Ltd. 52,445 34.99% 18,351 - - (23) 18,328 PT. Papua Agro Lestari 50,505 15.00% 7,576 3,191 - - 10,767 PT. GELORA MANDIRI MEMBANGUN 7,492 15.00% 1,124 3,420 - - 4,544
Pyeongchang Wind Power Co., Ltd. 13,531 42.00% 5,683 - - - 5,683
The Kwangjuilbo 8,177 49.00% 4,007 - - - 4,007

Hyosung Corporation and Subsidiaries Notes to Consolidated Financial Statements December 31, 2017 and 2016
75
Fair value of marketable investments in associates as at December 31, 2017 and 2016, is as follows:
(in millions of Korean won, except per market price per share)
2017
Number of shares
Market price per share
(in Korean won)
Fair value (in millions of Korean won)
Book value (in millions of Korean won)
Shinwha intertek Co., Ltd. 4,446,227 \ 2,415 \ 10,738 \ 14,230 Hyosung ITX Co., Ltd. 4,349,000 12,600 54,797 21,437
(in millions of Korean won, except per market price per share)
2016
Number of shares
Market price per share
(in Korean won) Fair value Book value
Shinwha intertek Co., Ltd. 4,446,227 \ 3,675 \ 16,340 \ 14,969 Hyosung ITX Co., Ltd. 4,349,000 11,700 50,883 18,328 Accumulated unrecognized changes in equity due to discontinued use of equity method for the year ended December 31, 2017, are as follows: (In millions of Korean won) 2017
Unrecognized loss
Unrecognized accumulated
losses
Soonchon Eco Green Corporation
\ (392) \ (392)

Hyosung Corporation and Subsidiaries Notes to Consolidated Financial Statements December 31, 2017 and 2016
76
19. Related Party Transactions Details of associates and other related parties as at December 31, 2017, are as follows: Associates
Location
Name of entity
Domestic
Soonchon Eco Green Corporation, Shinwha intertek Co., Ltd., The Kwangjuilbo, Taebaek Wind Power Co., Ltd., Pyeongchang Wind Power Co., Ltd., Hyosung Information System Co., Ltd., Hyosung Toyota Corp., Hyosung ITX Co., Ltd., Smilegate2016KVF , Pathfinder Youth’s Investment Foundation Association
Asia PT. Papua Agro Lestari, PT. Gelora Mandiri Membangun(GMM)
Other related parties Location Name of entity
Domestic
Galaxia Co., Ltd., Galaxia device Co., Ltd., Galaxia Micropayment Co.,Ltd., Galaxia Electronics Co., Ltd., Gongdeok Development Corporation, The Class Hyosung Corporation, The premium Hyosung Co., Ltd., Dong Ryung Co., Ltd., Shin Dong Jin Co., Ltd., A-SEUNG AUTOMOTIVE GROUP , ITX Marketing Co., Ltd, ITX M&S Co., Ltd., Trinity Asset Managemernt, Haengbokdoodrimi Co., Ltd. , Hyosung Premier Motors, ASC Co. Ltd., and others
China
Tianjin Galaxia Device Electronics. Co., Ltd., Huizhou Galaxia Device Electronics. Co. Ltd., Qingdao Galaxia Device Electronics. Co., Ltd., SHINWHA INTERTEK (SUZHOU) CO.,LTD, DONGGUAN SHINWHA INTERTEK CORP, DNS Technology Co., Ltd, Weihai newsolim Electronics Co., Ltd and others
Asia Galaxia Japan, Shinwha Intertek Corp and others Europe Shinwha Intertek Slovakia S.R.O and others
Others1
Location Name of entity
Domestic
Gabi Inc., Galaxia SM Inc., Galaxia Communications Co., Ltd., Shinsung Motors, Chin Hung International Inc., TAEUK CONSTRUCTION CO.,LTD., EveryShow Co., Ltd. and others
China IB China. Ltd. and others
Asia Galaxia Media Co., Ltd. and others America IB America, Inc. and others
1 Although the entity is not the related party of the Group in accordance with Korean IFRS 1024, the entity belongs to the Large Enterprise Group to which the Group also belongs in accordance with the Monopoly Regulation and Fair Trade Act.

Hyosung Corporation and Subsidiaries Notes to Consolidated Financial Statements December 31, 2017 and 2016
77
Significant transactions with related parties Significant transactions for the years ended December 31, 2017 and 2016, are as follows:
2017
(in millions of Korean won)
Revenue and others1
Dividends Purchases and others1
Acquisition of fixed assets
Associates Shinwha intertek Co., Ltd. ₩ 13,180 ₩ 222 ₩ 27 ₩ - Hyosung ITX Co., Ltd. 12,004 874 6,652 777 Hyosung Information System Co., Ltd.
231 2,595 148 1,593
Others 1,323 36 946 - 26,738 3,727 7,773 2,370 Other related parties
Galaxia Device Co., Ltd. 229 - 13,687 - Galaxia Electronics Co., Ltd. 40,501 - 20,258 1,255 Gongdeok Development Corporation 19 - 9,035 - Shin Dong Jin Co., Ltd. - - 6,347 - Huizhou Galaxia Device Electronics. Co., Ltd.
358 - 110,440 466
Others 4,610 - 461 991 45,717 - 160,228 2,712
Others Galaxia SM Inc. 5 - 6,607 - Chin Hung International Inc. 3,099 - - 2,000 Others 1,059 - 12 -
4,163 - 6,619 2,000 ₩ 76,618 ₩ 3,727 ₩ 174,620 ₩ 7,082
1 Revenue, rental income, interest income and others are included in revenue and others. Purchase of raw materials, export fees, service fees, interest expense and others are included in purchases and others.

Hyosung Corporation and Subsidiaries Notes to Consolidated Financial Statements December 31, 2017 and 2016
78
2016
(in millions of Korean won)
Revenue and others1
Dividends Purchases and others1
Acquisition of fixed assets
Associates Shinwha intertek Co., Ltd. ₩ 10,061 ₩ - ₩ 5 ₩ - Hyosung ITX Co., Ltd. 12,526 439 5,522 380 Hyosung Information System Co., Ltd.
246 3,460 502 1,073
Others 4,869 - 2,635 - 27,702 3,899 8,664 1,453 Other related parties
Galaxia device Co., Ltd. 458 - 16,804 13 Galaxia Electronics 15,118 - 22,105 5,358 Gongdeok Development Corporation - - 8,904 - Huizhou Galaxia Device Electronics. Co., Ltd.
8,893 - 75,621 222
Others 3,102 - 6,688 541 27,571 - 130,122 6,134
Others Galaxia Communications Co., Ltd. 1,134 - 52 - Chin Hung International Inc. 22,982 - 51,803 62,265 Others - - 1,182 102
24,116 - 53,037 62,367 ₩ 79,389 ₩ 3,899 ₩ 191,823 ₩ 69,954
1 Revenue, rental income, interest income and others are included in revenue and others. Purchase of raw materials, export fees, service fees, interest expense and others are included in purchases and others.

Hyosung Corporation and Subsidiaries Notes to Consolidated Financial Statements December 31, 2017 and 2016
79
2017
(in millions of Korean won) Trade
receivables Other
receivables1 Trade
payables Other
payables1 Associates
The Kwangjuilbo ₩ - ₩ 7,727 ₩ - ₩ 55 Shinwha intertek Co., Ltd. 2,718 - - 2,499 Hyosung ITX Co., Ltd. 958 - 1,157 2,746 PT. GELORA MANDIRI MEMBANGUN
-
4,738
-
-
Others 521 962 323 4,173 4,197 13,427 1,480 9,473 Other related parties
Galaxia Electronics 20,417 129 1,584 40 Gongdeok Development Corporation - 4,637 - 20 The Class Hyosung 85 5 - 5,733 Shin Dong Jin Co., Ltd. - 4,204 - 596 Huizhou Galaxia Device Electronics. Co., Ltd.
4,214
1,671
14,314
272
Others 61 2,885 2,078 - 24,777 13,531 17,976 6,661
Others Galaxia SM Inc. - 19 1,978 1,329 Chin Hung International Inc. 1 17,292 - 20,113 Others 16 - 3 693
17 17,311 1,981 22,135 ₩ 28,991 ₩ 44,269 ₩ 21,437 ₩ 38,269
2016
(in millions of Korean won) Trade
receivables Other
receivables1 Trade
payables Other
payables1 Associates
The Kwangjuilbo ₩ - ₩ 7,482 ₩ - ₩ 22 Shinwha intertek Co., Ltd. 4,806 2 - 102 Hyosung ITX Co., Ltd. 703 2 681 1,415 PT. GELORA MANDIRI MEMBANGUN
-
5,345
-
-
Others 2,350 118 235 313 7,859 12,949 916 1,852 Other related parties
Galaxia Electronics Co., Ltd. 3,265 17 6,292 3,466 Gongdeok Development Corporation - 4,637 - 7 Shin Dong Jin Co., Ltd. - 3,998 - 461 Huizhou Galaxia Device Electronics. Co. Ltd.
8,019
2,211
9,648
104
Others 81 598 1,219 902 11,365 11,461 17,159 4,940
Others Galaxia Communications Co., Ltd. 124 - 5 1,209 Chin Hung International Inc. 1,915 48 16,762 29,665 Others - - 29 254
2,039 48 16,796 31,128 ₩ 21,263 ₩ 24,458 ₩ 34,871 ₩ 37,920
1 Non-trade receivables, loans, deposits provided and others are included in other receivables. Non-trade payables, deposit received and others are included in other payables.
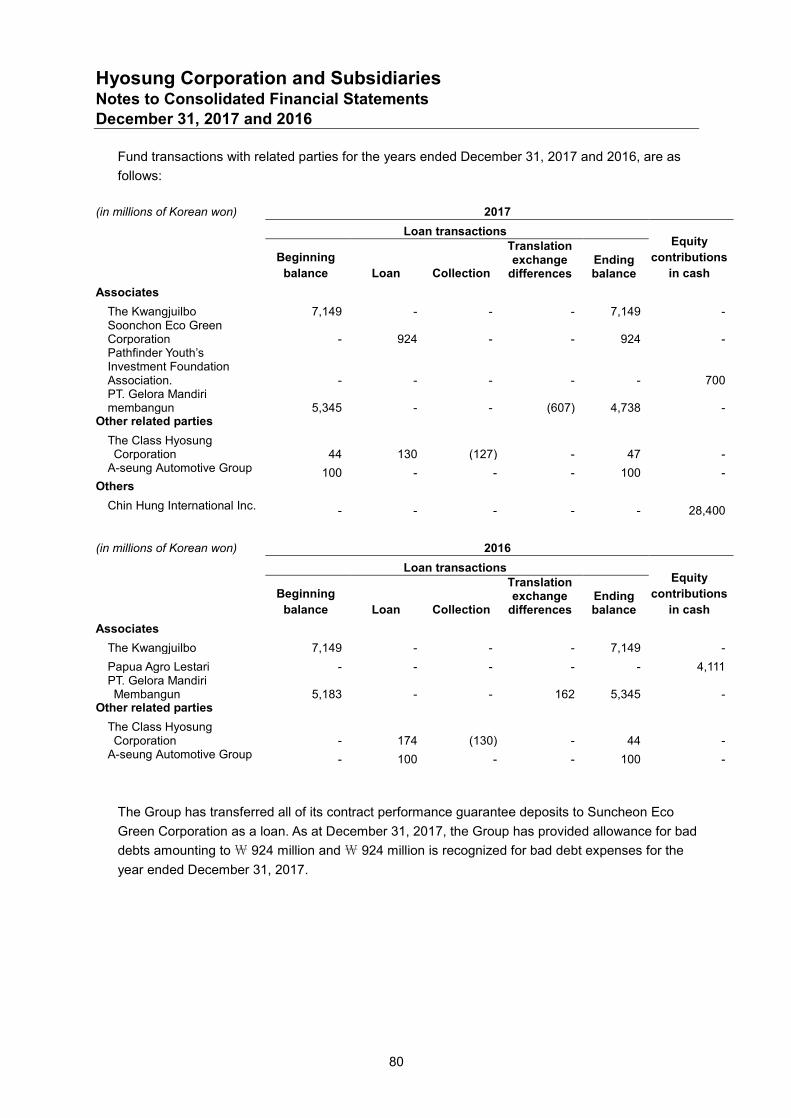
Hyosung Corporation and Subsidiaries Notes to Consolidated Financial Statements December 31, 2017 and 2016
80
Fund transactions with related parties for the years ended December 31, 2017 and 2016, are as follows:
(in millions of Korean won) 2017 Loan transactions
Equity contributions
in cash Beginning
balance Loan Collection
Translation exchange
differences Ending balance
Associates The Kwangjuilbo 7,149 - - - 7,149 - Soonchon Eco Green Corporation - 924 - - 924 - Pathfinder Youth’s Investment Foundation Association. - - - - - 700 PT. Gelora Mandiri membangun 5,345 - - (607) 4,738 -
Other related parties The Class Hyosung Corporation 44 130 (127) - 47 -
A-seung Automotive Group 100 - - - 100 - Others
Chin Hung International Inc. - - - - - 28,400 (in millions of Korean won) 2016 Loan transactions
Equity contributions
in cash Beginning
balance Loan Collection
Translation exchange
differences Ending balance
Associates The Kwangjuilbo 7,149 - - - 7,149 - Papua Agro Lestari - - - - - 4,111 PT. Gelora Mandiri Membangun 5,183 - - 162 5,345 -
Other related parties The Class Hyosung Corporation - 174 (130) - 44 -
A-seung Automotive Group - 100 - - 100 -
The Group has transferred all of its contract performance guarantee deposits to Suncheon Eco Green Corporation as a loan. As at December 31, 2017, the Group has provided allowance for bad debts amounting to \ 924 million and \ 924 million is recognized for bad debt expenses for the year ended December 31, 2017.

Hyosung Corporation and Subsidiaries Notes to Consolidated Financial Statements December 31, 2017 and 2016
81
The compensation paid or payable to key management for employee services for the years ended December 31, 2017 and 2016, consists of:
(in millions of Korean won) 2017 2016 Short-term employee benefits ₩ 5,843 ₩ 9,098 Post-employment benefits 383 980
₩ 6,226 ₩ 10,078
Details of collaterals provided by the Group for the related parties as at December 31, 2017, are as follows:
(in millions of
Korean won)
Carrying
amount
Secured
amount
Secured
asset Details
Amount of
borrowings Creditor Soonchon
Eco Green Corporation1
-
- Equity
securities
Operating capital
and others
39,391 IBK and others
PyeongchangWindPower
Co., Ltd.
₩ 6,949
₩ 6,510 Equity
securities Facility loan and
others
₩ 59,407 Woori bank and others
Hyosung Toyota Corp.2
31,469
3,200 PP&E
Operating capital
and others
- Toyota Motor Korea
Co., Ltd.
Chin Hung International Inc.3
135,141
135,141 Equity
securities -
- The Committee of Creditor Banks of Chin Hung International Inc.
₩ 173,120 ₩ 144,851 ₩ 98,798
1 In addition to providing the equity securities as described above, the Group has provided contractual execution
guarantees (\ 45,391 million) and supplementary financing arrangements (\ 3,000 million) and two pledged checks to
Soonchon Eco Green Corporation (Note 38). 2 Certain amounts of property, plant and equipment are provided as collaterals to TOYOTA Motor KOREA Co., Ltd. in
relation to the inventory financing of Hyosung Toyota Corp. Also, the Group provides capital supplement agreement of
\2,000 million for borrowing of Hyosung Toyota Corp. (Notes 15 and 38). 3 The equity shares of Chin Hung International Inc. are provided as collateral to the Committee of Creditor Banks of Chin
Hung International Inc. in accordance with the special agreement for plans for normalization of the business of Chin Hung
International Inc.(Notes 11 and 38).
Chin Hung International Inc. provides its shares of Somesevit Corporation as collateral for the Group amounting to \ 56,000 million relating to Somesevit Corporation’s borrowing of \ 79,900 million (Note 38).

Hyosung Corporation and Subsidiaries Notes to Consolidated Financial Statements December 31, 2017 and 2016
82
20. Borrowings Details of borrowings as at December 31, 2017 and 2016, are as follows: (in millions of Korean won) 2017 2016
Borrowings
Short-term borrowings \ 3,323,341 \ 2,738,096 Current portion of long-term borrowings 1,593,656 1,642,329
4,916,997 4,380,425 Long-term borrowings
Long-term borrowings 1,179,017 1,434,308 Debentures 1,166,072 1,227,863
2,345,089 2,662,171
\ 7,262,086 \ 7,042,596
Borrowings are collateralized with the Group’s available-for-sale financial assets and property, plant and equipment, and others (Notes 15 and 38).
Details of short-term borrowings as at December 31, 2017 and 2016, are as follows:
(in millions of Korean won) Creditor
Interest rate as at Dec. 31,
2017 (%) 2017 2016 Bank overdrafts Hana Bank Osaka 1.30 \ 6,427 \ 4,875
General loan Woori Bank and others 0.58 ~ 10.25 2,368,711 1,377,619
Collateralized borrowings 1 Woori Bank and others 0.80 ~ 3.44 690,626 658,902
Others Woori Bank and others 1.60 ~ 3.48 257,577 696,700 \ 3,323,341 \ 2,738,096
1 The Group sold trade receivables denominated in foreign currencies at a discount to the financial institutions for the years
ended December 31, 2017 and 2016. The Group may retain an obligation to compensate a financial institution for
debtors' failure to make payment when they become due, an obligation known as a `recourse obligation'. Recourse
obligations related to the sales of receivables with recourse are accounted for as collateralized borrowings (Notes 6 and
38).

Hyosung Corporation and Subsidiaries Notes to Consolidated Financial Statements December 31, 2017 and 2016
83
Details of long-term borrowings as at December 31, 2017 and 2016, are as follows:
(in millions of Korean won) Creditor
Interest rate as at Dec. 31,
2017 (%)
2017
2016 Hyosung Corp.
Local currency Korea Development Bank
and others 0.75 ~ 4.12 \ 419,947 \ 692,699
Foreign currency Korea Development Bank and others 1.97 ~ 3.59 219,334 246,726
Subsidiaries
Local currency The Export-Import Bank of
Korea and others
2.30 ~ 8.55 867,765 520,517
Foreign currency The Export-Import Bank of Korea and others 2.17 ~ 4.76 165,303 800,423 1,672,349 2,260,365
Less: Current portion (492,982) (825,529) Present value discounts (350) (528)
\ 1,179,017 \ 1,434,308
Above long-term borrowings are subject to installment repayment or lump-sum repayment at maturity date. Borrowings are collateralized with the Group’s available-for-sale financial assets and property, plant and equipment, and others (Notes 11, 15 and 38). Details of debentures as at December 31, 2017 and 2016, are as follows: (in millions of Korean won)
Maturity date
Interest rate as at Dec.
31, 2017 (%) 2017 2016 Hyosung Corp.
251-2nd Public subscription bond 2017-02-07 - - 60,000 253-2nd Public subscription bond 2018-02-21 3.75 30,000 30,000 254th Private bond 2017-05-02 - - 30,000 256-1st Public subscription bond 2017-02-25 - - 50,000 256-2nd Public subscription bond 2018-02-25 3.28 100,000 100,000 256-3rd Public subscription bond 2020-02-25 3.76 50,000 50,000 257-1st Public subscription bond 2018-06-26 2.90 130,000 130,000 257-2nd Public subscription bond 2020-06-26 3.97 70,000 70,000 258th Private bond 2018-12-29 0.70 28,473 31,104 259-1st Public subscription bond 2019-04-25 2.78 102,000 102,000 259-2nd Public subscription bond 2021-04-25 3.43 98,000 98,000 260-1st Public subscription bond 2019-12-27 2.70 120,000 120,000 260-2nd Public subscription bond 2021-12-28 3.44 30,000 30,000

Hyosung Corporation and Subsidiaries Notes to Consolidated Financial Statements December 31, 2017 and 2016
84
(in millions of Korean won) Maturity
date
Interest rate as at Dec.
31, 2017 (%) 2017 2016 Hyosung Capital Co., Ltd. 86th Debenture 2017-02-24 - - 30,000 90-2nd Debenture 2017-05-25 - - 30,000 95th Debenture 2017-09-26 - - 10,000 105th Debenture 2017-04-04 - - 20,000 110th Debenture 2018-01-02 4.61 15,000 15,000 117th Debenture 2017-04-10 - - 20,000 118-2nd Debenture 2017-05-21 - - 5,000 119th Debenture 2017-05-26 - - 20,000 121-2nd Debenture 2017-06-22 - - 20,000 122-2nd Debenture 2017-06-29 - - 10,000 126th Debenture 2017-09-30 - - 20,000 127th Debenture 2017-10-29 - - 20,000 128th Debenture 2018-12-31 4.19 3,000 3,000 129th Debenture 2018-03-28 4.01 20,000 20,000 130th Debenture 2018-04-23 4.12 20,000 20,000 132nd Debenture 2017-06-07 - - 8,000 133-1st Debenture 2018-06-14 4.06 20,000 20,000 133-2nd Debenture 2018-06-14 4.06 9,000 9,000 134th Debenture 2017-06-16 - - 29,000 135th Debenture 2017-03-23 - - 8,000 136th Debenture 2018-06-24 4.08 20,000 20,000 137th Debenture 2018-06-28 4.00 20,000 20,000 138th Debenture 2017-07-04 - - 14,000 139th Debenture 2018-07-18 4.00 10,000 10,000 140th Debenture 2017-01-23 - - 22,000 141-1st Debenture 2017-08-01 - - 20,000 141-2nd Debenture 2017-02-01 - - 5,000 142nd Debenture 2017-11-04 - - 10,000 143rd Debenture 2017-08-08 - - 10,000 144th Debenture 2017-11-12 - - 10,000 145-1st Debenture 2017-08-22 - - 30,000 145-2nd Debenture 2017-09-22 - - 14,000 145-3rd Debenture 2017-11-20 - - 10,000 146-1st Debenture 2017-11-30 - - 10,000 146-2nd Debenture 2018-01-30 3.83 3,000 3,000 146-3rd Debenture 2018-02-28 3.90 15,000 15,000 147-1st Debenture 2017-09-05 - - 10,000 147-2nd Debenture 2017-11-06 - - 10,000 147-3rd Debenture 2018-03-05 3.90 10,000 10,000 148th Debenture 2018-03-09 3.90 15,000 15,000 149th Debenture 2018-03-20 3.90 18,000 18,000 150-1st Debenture 2017-09-29 - - 20,000 150-2nd Debenture 2018-03-30 4.01 20,000 20,000 151st Debenture 2018-04-05 3.90 15,000 15,000 152-1st Debenture 2017-10-11 - - 5,000 152-2nd Debenture 2018-01-11 3.97 15,000 15,000 153-1st Debenture 2017-12-28 - - 20,000 153-2nd Debenture 2018-01-14 3.92 15,000 15,000 154-1st Debenture 2017-10-26 - - 20,000 154-2nd Debenture 2018-01-26 3.95 20,000 20,000
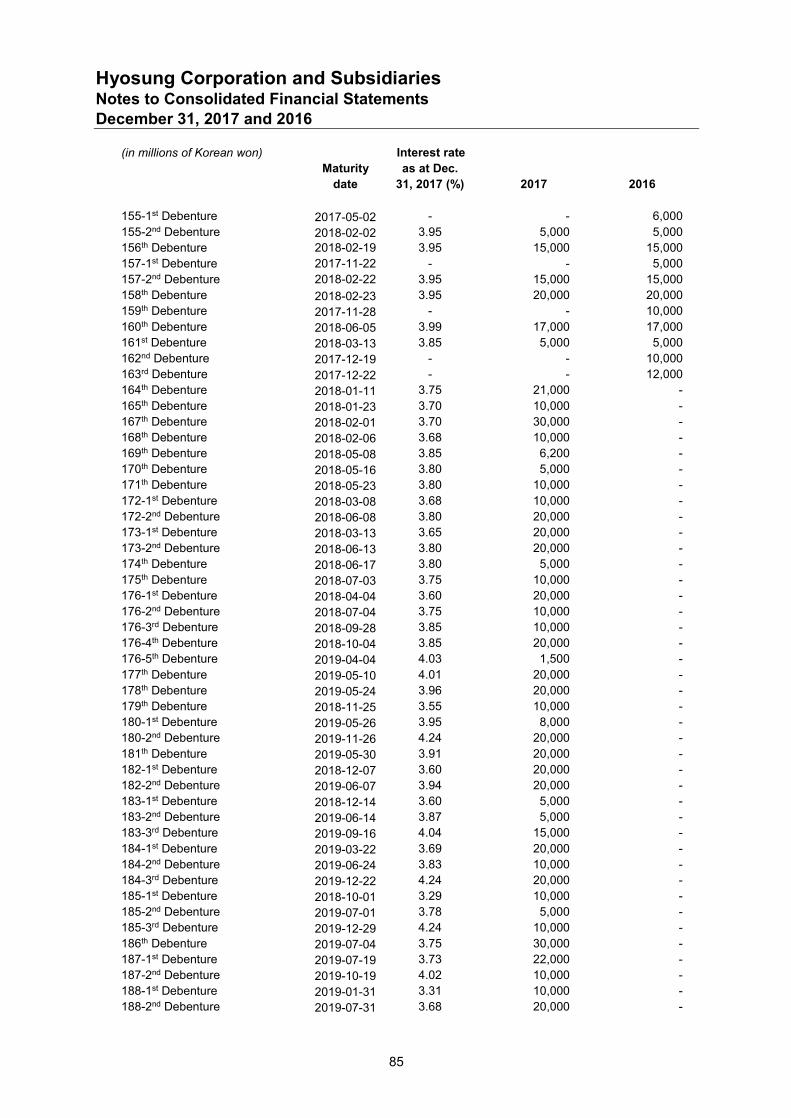
Hyosung Corporation and Subsidiaries Notes to Consolidated Financial Statements December 31, 2017 and 2016
85
(in millions of Korean won) Maturity
date
Interest rate as at Dec.
31, 2017 (%) 2017 2016 155-1st Debenture 2017-05-02 - - 6,000 155-2nd Debenture 2018-02-02 3.95 5,000 5,000 156th Debenture 2018-02-19 3.95 15,000 15,000 157-1st Debenture 2017-11-22 - - 5,000 157-2nd Debenture 2018-02-22 3.95 15,000 15,000 158th Debenture 2018-02-23 3.95 20,000 20,000 159th Debenture 2017-11-28 - - 10,000 160th Debenture 2018-06-05 3.99 17,000 17,000 161st Debenture 2018-03-13 3.85 5,000 5,000 162nd Debenture 2017-12-19 - - 10,000 163rd Debenture 2017-12-22 - - 12,000 164th Debenture 2018-01-11 3.75 21,000 - 165th Debenture 2018-01-23 3.70 10,000 - 167th Debenture 2018-02-01 3.70 30,000 - 168th Debenture 2018-02-06 3.68 10,000 - 169th Debenture 2018-05-08 3.85 6,200 - 170th Debenture 2018-05-16 3.80 5,000 - 171th Debenture 2018-05-23 3.80 10,000 - 172-1st Debenture 2018-03-08 3.68 10,000 - 172-2nd Debenture 2018-06-08 3.80 20,000 - 173-1st Debenture 2018-03-13 3.65 20,000 - 173-2nd Debenture 2018-06-13 3.80 20,000 - 174th Debenture 2018-06-17 3.80 5,000 - 175th Debenture 2018-07-03 3.75 10,000 - 176-1st Debenture 2018-04-04 3.60 20,000 - 176-2nd Debenture 2018-07-04 3.75 10,000 - 176-3rd Debenture 2018-09-28 3.85 10,000 - 176-4th Debenture 2018-10-04 3.85 20,000 - 176-5th Debenture 2019-04-04 4.03 1,500 - 177th Debenture 2019-05-10 4.01 20,000 - 178th Debenture 2019-05-24 3.96 20,000 - 179th Debenture 2018-11-25 3.55 10,000 - 180-1st Debenture 2019-05-26 3.95 8,000 - 180-2nd Debenture 2019-11-26 4.24 20,000 - 181th Debenture 2019-05-30 3.91 20,000 - 182-1st Debenture 2018-12-07 3.60 20,000 - 182-2nd Debenture 2019-06-07 3.94 20,000 - 183-1st Debenture 2018-12-14 3.60 5,000 - 183-2nd Debenture 2019-06-14 3.87 5,000 - 183-3rd Debenture 2019-09-16 4.04 15,000 - 184-1st Debenture 2019-03-22 3.69 20,000 - 184-2nd Debenture 2019-06-24 3.83 10,000 - 184-3rd Debenture 2019-12-22 4.24 20,000 - 185-1st Debenture 2018-10-01 3.29 10,000 - 185-2nd Debenture 2019-07-01 3.78 5,000 - 185-3rd Debenture 2019-12-29 4.24 10,000 - 186th Debenture 2019-07-04 3.75 30,000 - 187-1st Debenture 2019-07-19 3.73 22,000 - 187-2nd Debenture 2019-10-19 4.02 10,000 - 188-1st Debenture 2019-01-31 3.31 10,000 - 188-2nd Debenture 2019-07-31 3.68 20,000 -
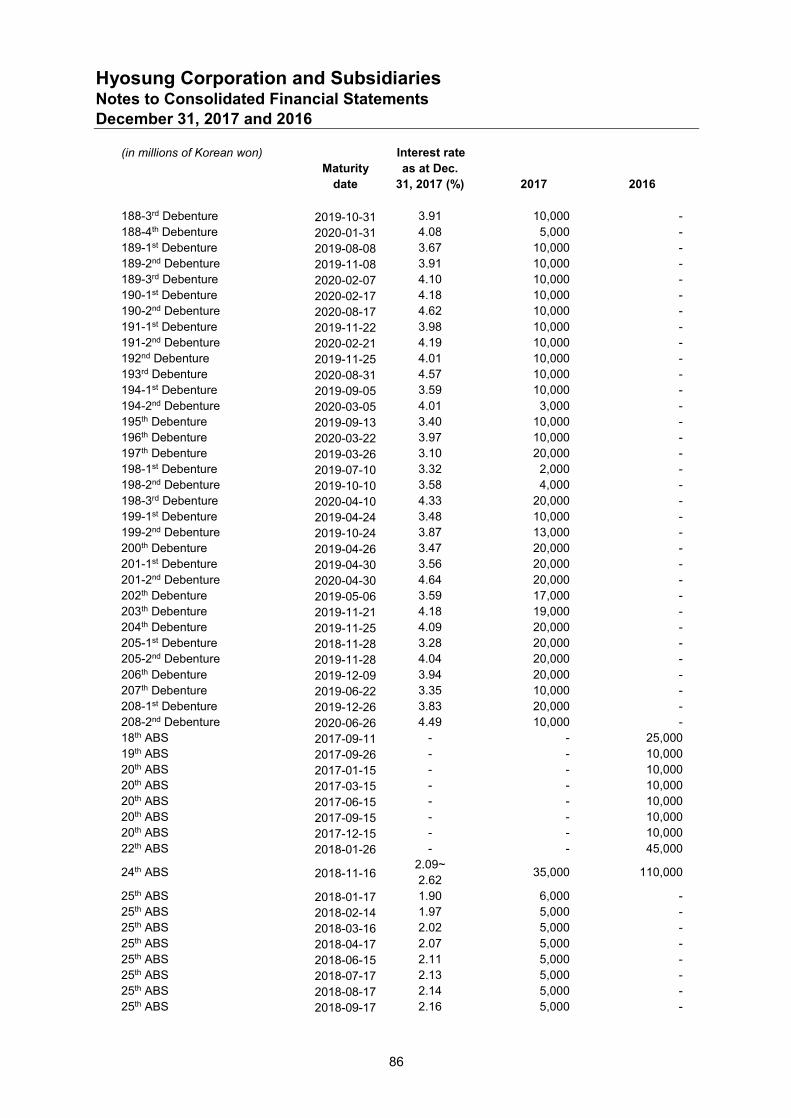
Hyosung Corporation and Subsidiaries Notes to Consolidated Financial Statements December 31, 2017 and 2016
86
(in millions of Korean won) Maturity
date
Interest rate as at Dec.
31, 2017 (%) 2017 2016 188-3rd Debenture 2019-10-31 3.91 10,000 - 188-4th Debenture 2020-01-31 4.08 5,000 - 189-1st Debenture 2019-08-08 3.67 10,000 - 189-2nd Debenture 2019-11-08 3.91 10,000 - 189-3rd Debenture 2020-02-07 4.10 10,000 - 190-1st Debenture 2020-02-17 4.18 10,000 - 190-2nd Debenture 2020-08-17 4.62 10,000 - 191-1st Debenture 2019-11-22 3.98 10,000 - 191-2nd Debenture 2020-02-21 4.19 10,000 - 192nd Debenture 2019-11-25 4.01 10,000 - 193rd Debenture 2020-08-31 4.57 10,000 - 194-1st Debenture 2019-09-05 3.59 10,000 - 194-2nd Debenture 2020-03-05 4.01 3,000 - 195th Debenture 2019-09-13 3.40 10,000 - 196th Debenture 2020-03-22 3.97 10,000 - 197th Debenture 2019-03-26 3.10 20,000 - 198-1st Debenture 2019-07-10 3.32 2,000 - 198-2nd Debenture 2019-10-10 3.58 4,000 - 198-3rd Debenture 2020-04-10 4.33 20,000 - 199-1st Debenture 2019-04-24 3.48 10,000 - 199-2nd Debenture 2019-10-24 3.87 13,000 - 200th Debenture 2019-04-26 3.47 20,000 - 201-1st Debenture 2019-04-30 3.56 20,000 - 201-2nd Debenture 2020-04-30 4.64 20,000 - 202th Debenture 2019-05-06 3.59 17,000 - 203th Debenture 2019-11-21 4.18 19,000 - 204th Debenture 2019-11-25 4.09 20,000 - 205-1st Debenture 2018-11-28 3.28 20,000 - 205-2nd Debenture 2019-11-28 4.04 20,000 - 206th Debenture 2019-12-09 3.94 20,000 - 207th Debenture 2019-06-22 3.35 10,000 - 208-1st Debenture 2019-12-26 3.83 20,000 - 208-2nd Debenture 2020-06-26 4.49 10,000 - 18th ABS 2017-09-11 - - 25,000 19th ABS 2017-09-26 - - 10,000 20th ABS 2017-01-15 - - 10,000 20th ABS 2017-03-15 - - 10,000 20th ABS 2017-06-15 - - 10,000 20th ABS 2017-09-15 - - 10,000 20th ABS 2017-12-15 - - 10,000 22th ABS 2018-01-26 - - 45,000
24th ABS 2018-11-16 2.09~2.62 35,000
110,000
25th ABS 2018-01-17 1.90 6,000 - 25th ABS 2018-02-14 1.97 5,000 - 25th ABS 2018-03-16 2.02 5,000 - 25th ABS 2018-04-17 2.07 5,000 - 25th ABS 2018-06-15 2.11 5,000 - 25th ABS 2018-07-17 2.13 5,000 - 25th ABS 2018-08-17 2.14 5,000 - 25th ABS 2018-09-17 2.16 5,000 -

Hyosung Corporation and Subsidiaries Notes to Consolidated Financial Statements December 31, 2017 and 2016
87
(in millions of Korean won) Maturity
date
Interest rate as at Dec.
31, 2017 (%) 2017 2016 25th ABS 2018-10-17 2.17 5,000 - 25th ABS 2018-11-16 2.27 5,000 - 25th ABS 2019-01-17 2.33 5,000 - 25th ABS 2019-03-15 2.44 5,000 - Asset Backed Short-Term Bond 2017-01-06 - - 8,800 Asset Backed Short-Term Bond 2017-01-06 - - 4,000 Asset Backed Short-Term Bond 2017-03-02 - - 2,000 Asset Backed Short-Term Bond 2018-02-08 2.20 15,000 - Asset Backed Short-Term Bond 2018-02-08 2.20 5,000 - Asset Backed Short-Term Bond 2018-02-12 2.10 10,000 - Asset Backed Short-Term Bond 2018-02-19 2.50 10,000 - Asset Backed Short-Term Bond 2018-02-22 2.50 10,000 - Asset Backed Short-Term Bond 2018-02-23 2.20 7,000 - Asset Backed Short-Term Bond 2018-03-13 2.30 7,000 -
2,270,173 2,048,904 Less: Current portion (1,100,673) (816,800) Discount on bonds payable (3,428) (4,241)
\ 1,166,072 \ 1,227,863
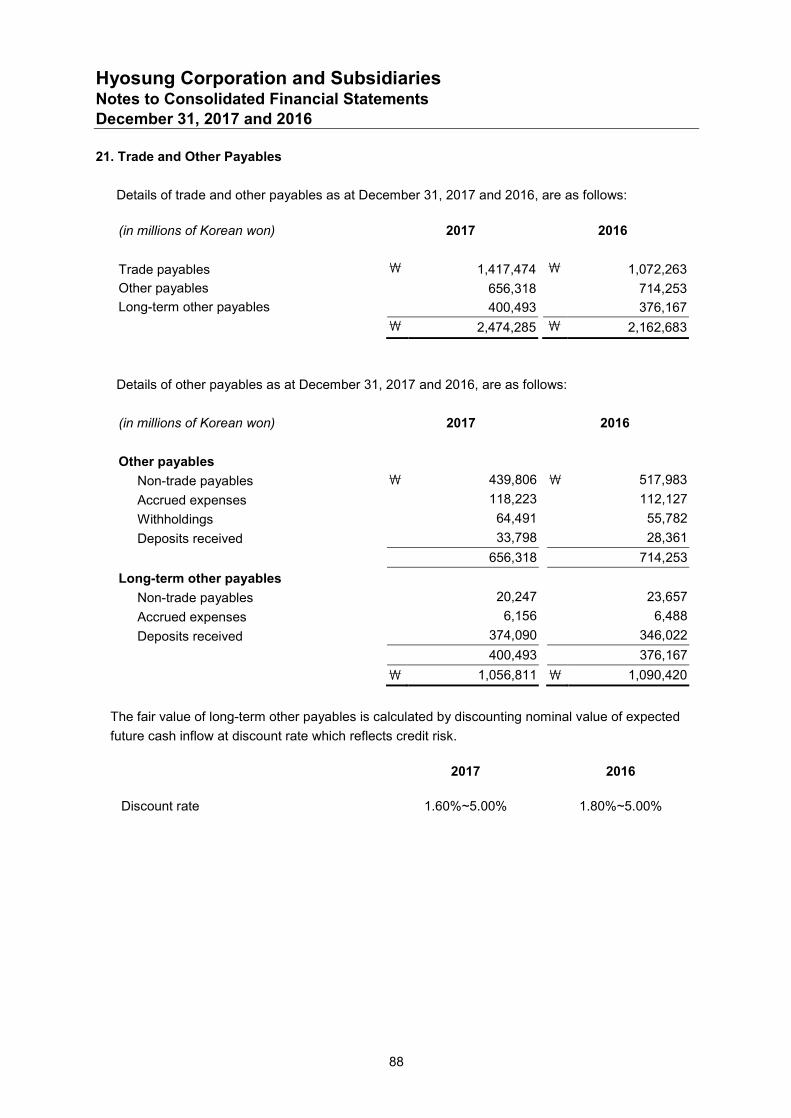
Hyosung Corporation and Subsidiaries Notes to Consolidated Financial Statements December 31, 2017 and 2016
88
21. Trade and Other Payables Details of trade and other payables as at December 31, 2017 and 2016, are as follows: (in millions of Korean won) 2017 2016 Trade payables \ 1,417,474 \ 1,072,263 Other payables 656,318 714,253 Long-term other payables 400,493 376,167 \ 2,474,285 \ 2,162,683
Details of other payables as at December 31, 2017 and 2016, are as follows: (in millions of Korean won) 2017 2016 Other payables
Non-trade payables \ 439,806 \ 517,983 Accrued expenses 118,223 112,127 Withholdings 64,491 55,782 Deposits received 33,798 28,361
656,318 714,253 Long-term other payables
Non-trade payables 20,247 23,657 Accrued expenses 6,156 6,488 Deposits received 374,090 346,022
400,493 376,167 \ 1,056,811 \ 1,090,420
The fair value of long-term other payables is calculated by discounting nominal value of expected future cash inflow at discount rate which reflects credit risk.
2017 2016
Discount rate 1.60%~5.00% 1.80%~5.00%

Hyosung Corporation and Subsidiaries Notes to Consolidated Financial Statements December 31, 2017 and 2016
89
22. Post-employment benefits Details of net defined benefit liabilities recognized in the consolidated statements of financial position as at December 31, 2017 and 2016, are as follows: (in millions of Korean won) 2017 2016 Present value of defined benefit obligations
₩ 456,270 ₩ 437,373
Fair value of plan assets1 (432,995) (393,874) Net defined benefit liabilities ₩ 23,275 ₩ 43,499
1 The contributions to the National Pension Fund of \ 462 million are included in the fair value of plan assets as at
December 31, 2017 (2016: \497 million).
The amounts recognized in the consolidated statements of profit or loss for the years ended December 31, 2017 and 2016, are as follows: (in millions of Korean won)
2017 2016
Current service cost
₩ 60,780
₩ 60,836
Interest expenses
9,723
8,537 Interest income (11,304) (10,143) Past service cost and gains(losses)
arising from settlements 6 -
₩ 59,205 ₩ 59,230
Line items including total expenses in the consolidated statements of profit or loss for the years ended December 31, 2017 and 2016, are as follows: (in millions of Korean won)
2017 2016
Cost of sales
₩ 32,984
₩ 34,965
Selling and administrative expenses
22,900
21,307 Research and development expenses
3,321
2,958
₩ 59,205
₩ 59,230
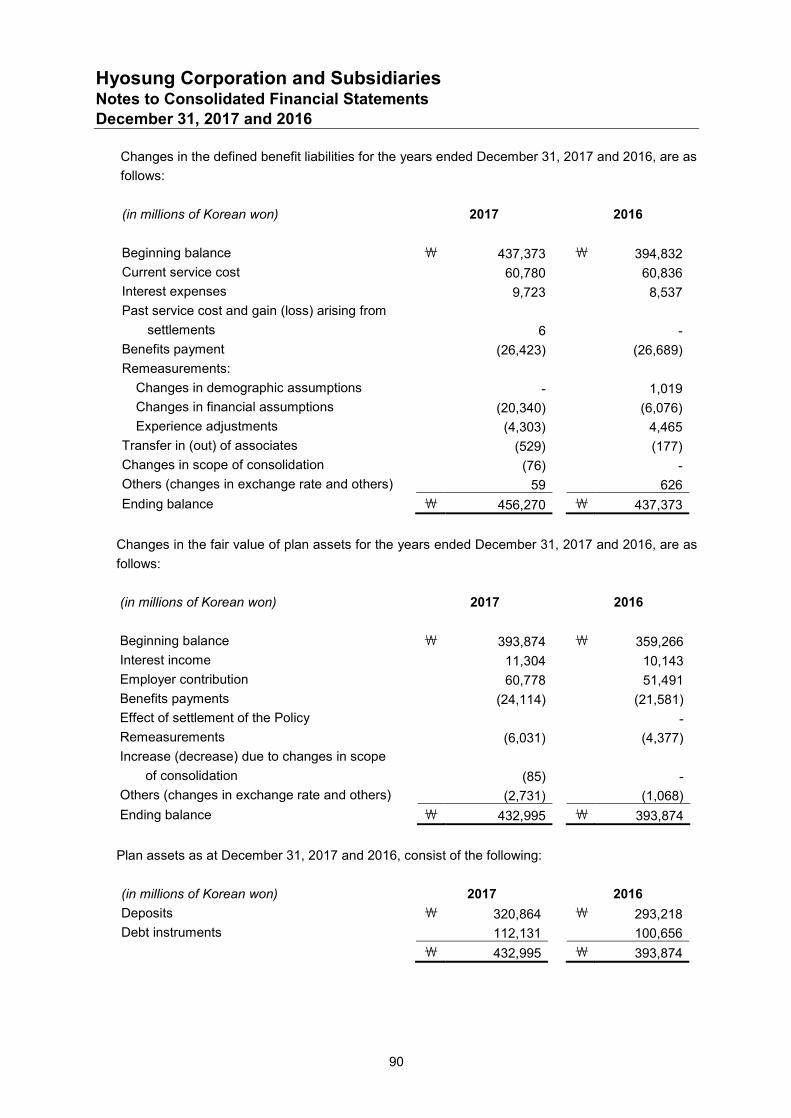
Hyosung Corporation and Subsidiaries Notes to Consolidated Financial Statements December 31, 2017 and 2016
90
Changes in the defined benefit liabilities for the years ended December 31, 2017 and 2016, are as follows:
(in millions of Korean won)
2017 2016
Beginning balance
₩ 437,373 ₩ 394,832
Current service cost
60,780 60,836 Interest expenses
9,723 8,537
Past service cost and gain (loss) arising from settlements
6 -
Benefits payment
(26,423) (26,689) Remeasurements:
Changes in demographic assumptions - 1,019 Changes in financial assumptions (20,340) (6,076) Experience adjustments (4,303) 4,465
Transfer in (out) of associates
(529) (177) Changes in scope of consolidation
(76) -
Others (changes in exchange rate and others)
59 626 Ending balance
₩ 456,270 ₩ 437,373
Changes in the fair value of plan assets for the years ended December 31, 2017 and 2016, are as follows: (in millions of Korean won) 2017 2016
Beginning balance ₩ 393,874 ₩ 359,266 Interest income 11,304 10,143 Employer contribution 60,778 51,491 Benefits payments (24,114) (21,581) Effect of settlement of the Policy - Remeasurements (6,031) (4,377) Increase (decrease) due to changes in scope
of consolidation
(85) - Others (changes in exchange rate and others) (2,731) (1,068) Ending balance ₩ 432,995 ₩ 393,874 Plan assets as at December 31, 2017 and 2016, consist of the following: (in millions of Korean won) 2017 2016 Deposits ₩ 320,864 ₩ 293,218 Debt instruments 112,131 100,656
₩ 432,995 ₩ 393,874

Hyosung Corporation and Subsidiaries Notes to Consolidated Financial Statements December 31, 2017 and 2016
91
Remeasurements of net defined benefit liabilities recognized as other comprehensive income for the years ended December 31, 2017 and 2016, are as follows: (in millions of Korean won) 2017 2016
Before income tax effects ₩ 18,612 ₩ (3,784) Income tax effects (4,608) 970 After income tax effects ₩ 14,004 ₩ (2,814) The principal actuarial assumptions as at December 31, 2017 and 2016, are as follows: 2017 2016 Discount rate 0.3%~3.39% 0.32%~2.82% Salary growth rate 1.02%~4.57% 1.02%~4.32%
The sensitivity of the defined benefit liability to changes in the weighted principal assumptions is:
Changes in principal assumption Effect on defined benefit liability
Discount rate 1.0% increase/decrease 1.44%~8.39% decrease/ 1.48%~9.85% increase
Salary growth rate 1.0% increase/decrease 1.47%~9.83% increase/ 1.46%~8.52% decrease
The above sensitivity analyses are based on a change in an assumption while holding all other assumptions constant. In practice, this is unlikely to occur, and changes in some of the assumptions may be correlated. The sensitivity of the defined benefit liability to changes in principal actuarial assumptions is calculated using the projected unit credit method, the same method applied when calculating the defined benefit liabilities recognized on the consolidated statement of financial position.
The methods and types of assumptions used in preparing the sensitivity analysis were not changed compared to the previous period.

Hyosung Corporation and Subsidiaries Notes to Consolidated Financial Statements December 31, 2017 and 2016
92
The Group reviews the funding level on an annual basis and has a policy of eliminating deficit from the fund. Expected contributions to post-employment benefit plans for the year ending December 31, 2018, are \ 50,003 million.
Expected maturity analysis of undiscounted pension benefits as at December 31, 2018, is as follows:
(in millions of Korean won) Less than 1
year Between 1 and 2 years
Between 2 and 5 years Over 5 years Total
Pension benefits \ 33,417 \ 27,987 \ 90,997 \ 750,024 \ 902,425
The weighted average duration of the defined benefit obligation is 1.75~10.4 years. Recognized expense related to the defined contribution plan for the year ended December 31, 2017, is \ 5,870 million (2016: \ 5,471 million).
23. Tax Expense and Deferred Tax
Income tax expense for the years ended December 31, 2017 and 2016, consists of: (in millions of Korean won) 2017 2016
Current tax:
Current tax on profit for the year \ 197,023 \ 235,190 Adjustments in respect of prior years
(92,439)
11,764
Total current tax
104,584
246,954 Deferred tax :
Origination and reversal of temporary
differences (66,760)
(25,847)
Impact of change in tax rate
2,082
5 Total deferred tax
(64,677)
(25,842)
Income tax expense \ 41,989 \ 221,112

Hyosung Corporation and Subsidiaries Notes to Consolidated Financial Statements December 31, 2017 and 2016
93
The tax on the Group’s profit before tax differs from the theoretical amount that would arise using the weighted average tax rate applicable to profits of the consolidated entities as follows: (in millions of Korean won)
2017 2016
Profit before income tax
\ 382,829 \ 696,514
Tax calculated at domestic tax rates applicable to profits in the respective countries 139,358 203,408
Tax effects of: Income not subject to tax (5,451) (5,548) Expenses not deductible for tax purposes 27,104 27,516 Adjustment in respect of prior year (92,439) 11,763 Tax credits (33,743) (38,099) Others 5,078 22,067
Impact of change in the tax rate 2,082 5 Income tax expense
\ 41,989 \ 221,112
The income tax effects related to components of the other comprehensive income (expenses) for the years ended December 31, 2017 and 2016, are as follows: (in millions of Korean won) 2017 2016
Before tax Tax effect After tax Before tax Tax effect
After tax
Gain (loss) on valuation of available-for-sale financial assets \ (2,060) \ 6,474 \ 4,414 \ 44,778 \ (6,425) \ 38,353
Remeasurements of net defined benefit liabilities (29,694) 15,907 (13,787)
(48,306)
20,515
(27,791)
Gain (loss) on valuation of derivatives 809 (196) 613 809 (196) 613
Change in equity from applying equity method 4,430 (736) 3,694 1,142 2,456 3,598
Cumulative effect of foreign currency translation (84,229) 561 (84,790) 22,165 (5,364) 16,801

Hyosung Corporation and Subsidiaries Notes to Consolidated Financial Statements December 31, 2017 and 2016
94
The analysis of deferred tax assets and deferred tax liabilities as at December 31, 2017 and 2016, are as follows: (in millions of Korean won) 2017 2016 Deferred tax assets
Deferred tax asset to be recovered after more than 12 months
₩ 327,986 ₩ 293,084
Deferred tax asset to be recovered within 12 months
46,505 46,288
374,491 339,372 Deferred tax liabilities
Deferred tax liability to be recovered after more than 12 months
(495,647) (537,706)
Deferred tax liability to be recovered within 12 months
2,479 14,980
(493,168) (522,726) Deferred tax assets (liabilities), net ₩ (118,677) ₩ (183,354)
The movements in the deferred income tax account for the years ended December 31, 2017 and 2016, are as follows: (in millions of Korean won) 2017 2016
Beginning balance ₩ (183,354) ₩ (209,196) Tax charged (credited) to components of profit
and loss
53,653
(34,238)
Tax charged (credited) to components of other comprehensive income
11,024
8,396 Ending balance ₩ (118,677) ₩ (183,354)
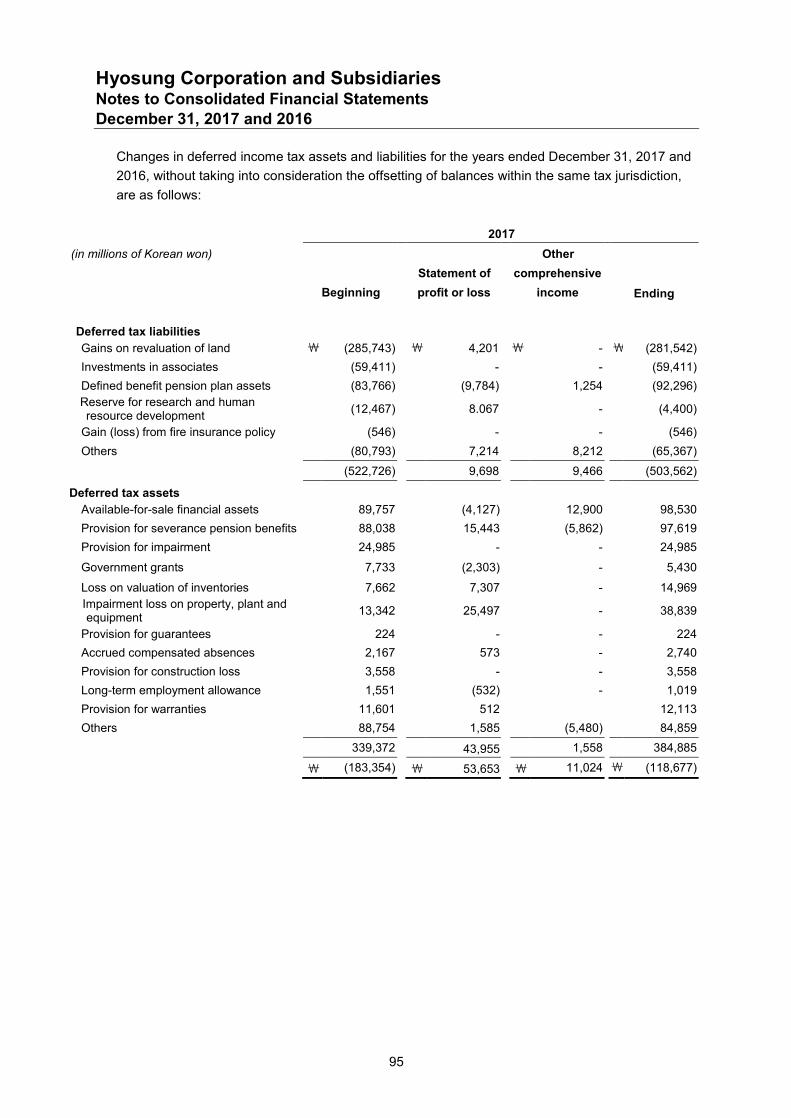
Hyosung Corporation and Subsidiaries Notes to Consolidated Financial Statements December 31, 2017 and 2016
95
Changes in deferred income tax assets and liabilities for the years ended December 31, 2017 and 2016, without taking into consideration the offsetting of balances within the same tax jurisdiction, are as follows:
2017 (in millions of Korean won)
Beginning Statement of profit or loss
Other comprehensive
income
Ending
Deferred tax liabilities Gains on revaluation of land ₩ (285,743) ₩ 4,201 ₩ - ₩ (281,542) Investments in associates (59,411) - - (59,411) Defined benefit pension plan assets (83,766) (9,784) 1,254 (92,296) Reserve for research and human resource development (12,467) 8.067 - (4,400)
Gain (loss) from fire insurance policy (546) - - (546) Others (80,793) 7,214 8,212 (65,367)
(522,726) 9,698 9,466 (503,562)
Deferred tax assets Available-for-sale financial assets 89,757 (4,127) 12,900 98,530 Provision for severance pension benefits 88,038 15,443 (5,862) 97,619 Provision for impairment 24,985 - - 24,985
Government grants 7,733 (2,303) - 5,430
Loss on valuation of inventories 7,662 7,307 - 14,969 Impairment loss on property, plant and equipment 13,342 25,497 - 38,839
Provision for guarantees 224 - - 224 Accrued compensated absences 2,167 573 - 2,740 Provision for construction loss 3,558 - - 3,558 Long-term employment allowance 1,551 (532) - 1,019 Provision for warranties 11,601 512 12,113 Others 88,754 1,585 (5,480) 84,859
339,372
43,955 1,558 384,885
₩ (183,354) ₩ 53,653 ₩ 11,024 ₩ (118,677)

Hyosung Corporation and Subsidiaries Notes to Consolidated Financial Statements December 31, 2017 and 2016
96
2016 (in millions of Korean won)
Beginning Statement of profit or loss
Other comprehensive
income
Ending
Deferred tax liabilities Gains on revaluation of land ₩ (285,743) ₩ - ₩ - ₩ (285,743) Investments in associates (38,836) (11,362) (9,213) (59,411) Defined benefit pension plan assets (76,270) (7,509) 13 (83,766) Reserve for research and human resource development (23,760) 11,293 - (12,467)
Gain (loss) from fire insurance policy (546) - - (546) Others (84,761) 4,885 (917) (80,793)
(509,916) (2,693) (10,117) (522,726)
Deferred tax assets Available-for-sale financial assets 87,211 3,888 (1,342) 89,757 Provision for severance pension benefits 78,901 8,188 949 88,038 Provision for impairment 19,461 5,524 - 24,985
Government grants 6,371 1,362 - 7,733
Loss on valuation of inventories 6,917 6,425 - 13,342 Impairment loss on property, plant and equipment 11,214 (3,552) - 7,662
Provision for guarantees 1,760 (1,536) - 224 Accrued compensated absences 1,584 583 - 2,167 Provision for construction loss 4,318 (760) - 3,558 Long-term employment allowance 1,428 123 - 1,551 Provision for warranties 10,096 1,505 - 11,601 Others 71,459 15,182 2,113 88,754
300,720
36,932 1,720 339,372
₩ (209,196) ₩ 34,239 ₩ (8,397) ₩ (183,354)
The ability to realize deferred tax asset depends on various components; such as, the Group’s ability to generate taxable income for period of the temporary difference realization, general economic environment and industrial expectation, and others. The Group periodically assesses its ability to realize deferred tax assets, and as at December 31, 2017, the Group recognized deferred tax assets for all deductible temporary difference except for the difference relating to investment in associates, which are unrealizable, amounted to \ 698,566 million (2016: \ 641,990 million). Deferred income tax assets are recognized for tax loss carryforwards to the extent that the realization of the related tax benefit through future taxable profits is probable. The Group did not recognize deferred income tax assets of \ 17,953 million (2016:\ 63,888 million). Unused tax losses carryforwards expire through 2027.

Hyosung Corporation and Subsidiaries Notes to Consolidated Financial Statements December 31, 2017 and 2016
97
24. Other Liabilities Details of other liabilities as at December 31, 2017 and 2016, are as follows: (in millions of Korean won) 2017 2016 Other current liabilities
Advances \ 412,328 \ 367,731 Unearned revenues 19,631 20,241 Provision1 12,332 50,178
444,291 438,150 Other non-current liabilities
Long-term advances 19,600 17,106 Provision1 107,144 55,709
126,744 72,815 \ 571,035 \ 510,965
1The Group accrued provision for warranties in relation to construction contract for the foreseeable expenses; such as,
defect repairs based on past experience. The Group also accrued provision for guarantees for the foreseeable expenses
relating to PF guarantees (Note 38).
Changes in the Group’s provision for the years ended December 31, 2017 and 2016, are as follows:
2017
(in millions of Korean won) Provision for warranties
Provision for guarantees Others Total
Beginning balance \ 50,522
\ 1,164
\ 54,201 \ 105,887
Increase 21,578 266 67,087 88,931Decrease (17,423) - (54,289) (71,712)Other - (1,168) (2,462) (3,630)Ending balance \ 54,677 \ 262 \ 64,537 \ 119,476
2016
(in millions of Korean won) Provision for warranties
Provision for guarantees Others Total
Beginning balance \ 40,693
\ -
\ 22,033 \ 62,726
Increase 31,137
1,164
56,301 88,602Decrease
(21,308)
- (24,133) (45,441)
Ending balance \ 50,522 \ 1,164
\ 54,201 \ 105,887
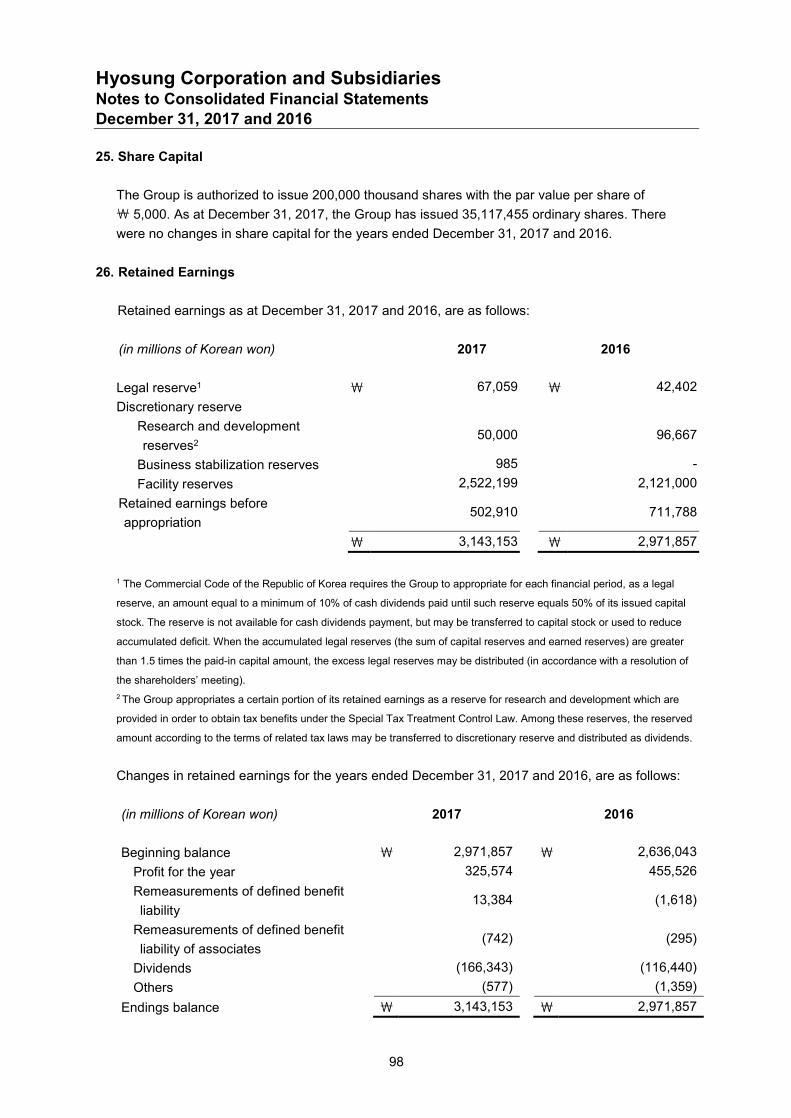
Hyosung Corporation and Subsidiaries Notes to Consolidated Financial Statements December 31, 2017 and 2016
98
25. Share Capital The Group is authorized to issue 200,000 thousand shares with the par value per share of ₩ 5,000. As at December 31, 2017, the Group has issued 35,117,455 ordinary shares. There were no changes in share capital for the years ended December 31, 2017 and 2016.
26. Retained Earnings
Retained earnings as at December 31, 2017 and 2016, are as follows: (in millions of Korean won) 2017 2016 Legal reserve1 \ 67,059 \ 42,402 Discretionary reserve
Research and development reserves2
50,000
96,667
Business stabilization reserves 985 - Facility reserves 2,522,199 2,121,000
Retained earnings before appropriation
502,910
711,788
\ 3,143,153 \ 2,971,857
1 The Commercial Code of the Republic of Korea requires the Group to appropriate for each financial period, as a legal
reserve, an amount equal to a minimum of 10% of cash dividends paid until such reserve equals 50% of its issued capital
stock. The reserve is not available for cash dividends payment, but may be transferred to capital stock or used to reduce
accumulated deficit. When the accumulated legal reserves (the sum of capital reserves and earned reserves) are greater
than 1.5 times the paid-in capital amount, the excess legal reserves may be distributed (in accordance with a resolution of
the shareholders’ meeting). 2 The Group appropriates a certain portion of its retained earnings as a reserve for research and development which are
provided in order to obtain tax benefits under the Special Tax Treatment Control Law. Among these reserves, the reserved
amount according to the terms of related tax laws may be transferred to discretionary reserve and distributed as dividends.
Changes in retained earnings for the years ended December 31, 2017 and 2016, are as follows: (in millions of Korean won)
2017 2016
Beginning balance
\ 2,971,857
\ 2,636,043
Profit for the year
325,574
455,526 Remeasurements of defined benefit liability
13,384
(1,618)
Remeasurements of defined benefit liability of associates
(742)
(295)
Dividends
(166,343)
(116,440) Others
(577)
(1,359)
Endings balance
\ 3,143,153
\ 2,971,857
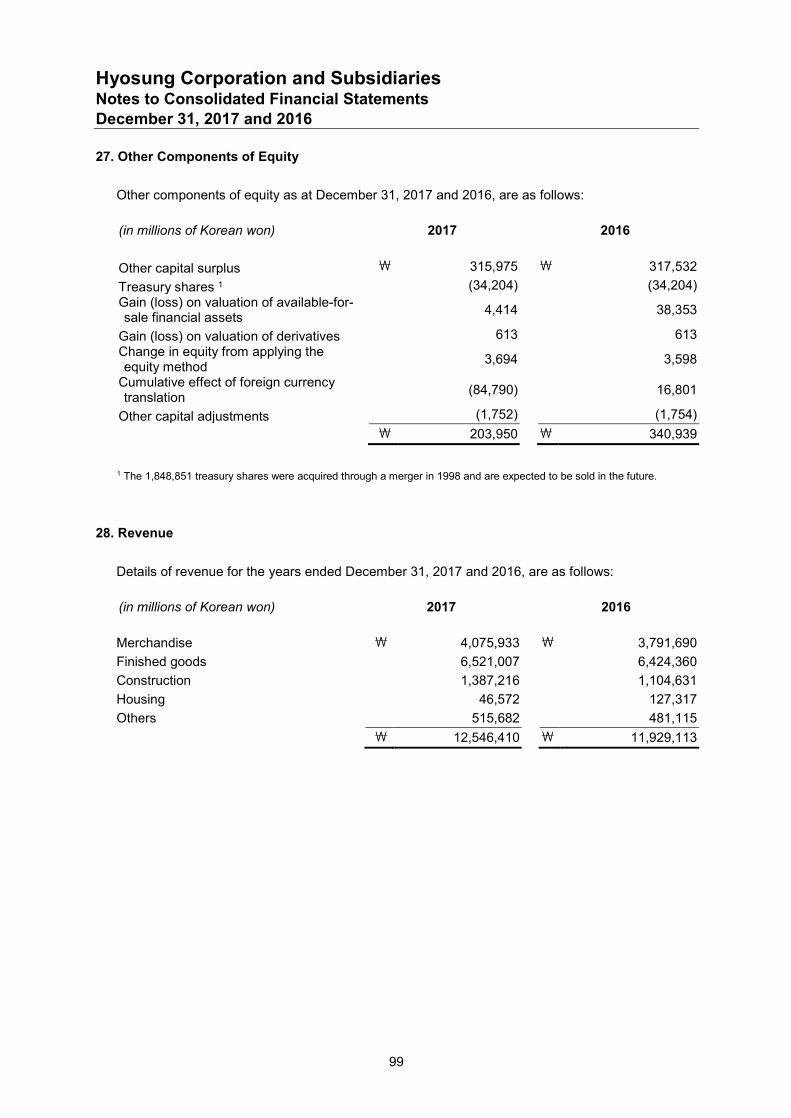
Hyosung Corporation and Subsidiaries Notes to Consolidated Financial Statements December 31, 2017 and 2016
99
27. Other Components of Equity Other components of equity as at December 31, 2017 and 2016, are as follows: (in millions of Korean won) 2017 2016 Other capital surplus \ 315,975 \ 317,532 Treasury shares 1 (34,204) (34,204) Gain (loss) on valuation of available-for-sale financial assets
4,414 38,353
Gain (loss) on valuation of derivatives 613 613 Change in equity from applying the equity method
3,694 3,598
Cumulative effect of foreign currency translation
(84,790) 16,801
Other capital adjustments (1,752) (1,754) \ 203,950 \ 340,939
1 The 1,848,851 treasury shares were acquired through a merger in 1998 and are expected to be sold in the future.
28. Revenue Details of revenue for the years ended December 31, 2017 and 2016, are as follows: (in millions of Korean won) 2017 2016 Merchandise \ 4,075,933 \ 3,791,690 Finished goods 6,521,007 6,424,360 Construction 1,387,216 1,104,631 Housing 46,572 127,317 Others 515,682 481,115 \ 12,546,410 \ 11,929,113
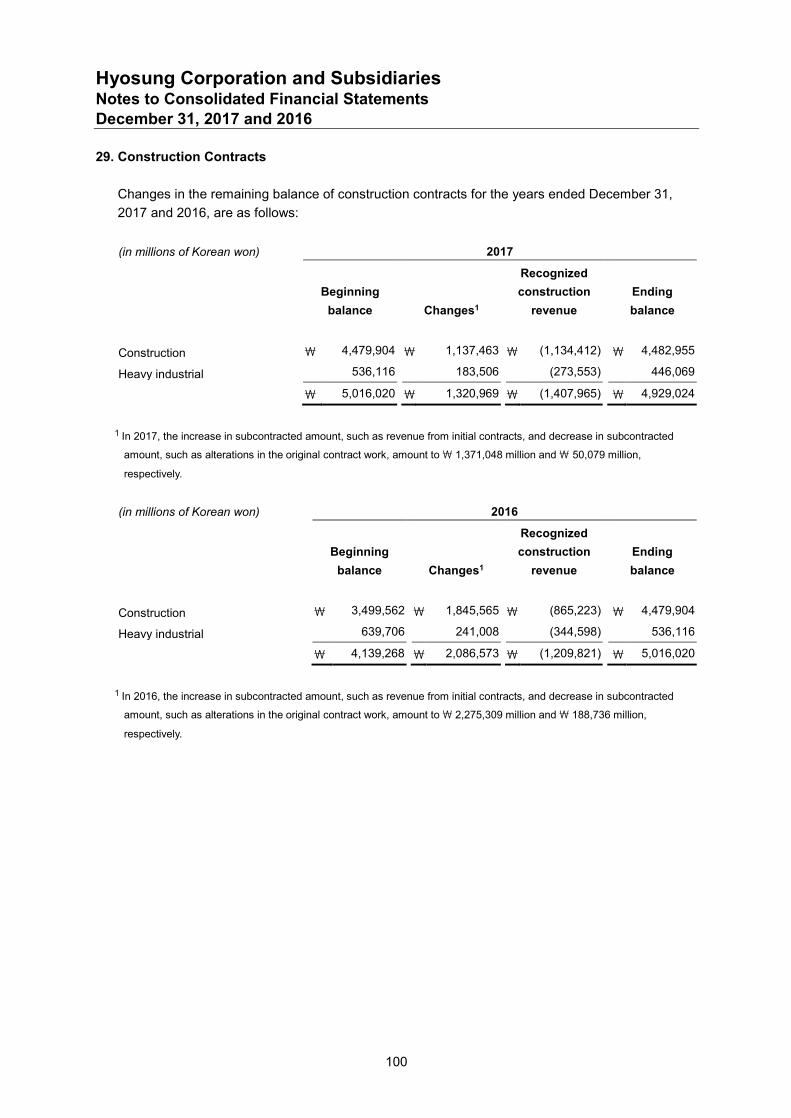
Hyosung Corporation and Subsidiaries Notes to Consolidated Financial Statements December 31, 2017 and 2016
100
29. Construction Contracts Changes in the remaining balance of construction contracts for the years ended December 31, 2017 and 2016, are as follows: (in millions of Korean won) 2017
Beginning
balance Changes1
Recognized construction
revenue Ending balance
Construction \ 4,479,904 \ 1,137,463 \ (1,134,412) \ 4,482,955
Heavy industrial 536,116 183,506 (273,553) 446,069
\ 5,016,020 \ 1,320,969 \ (1,407,965) \ 4,929,024
1 In 2017, the increase in subcontracted amount, such as revenue from initial contracts, and decrease in subcontracted
amount, such as alterations in the original contract work, amount to \ 1,371,048 million and \ 50,079 million,
respectively.
(in millions of Korean won) 2016
Beginning
balance Changes1
Recognized construction
revenue Ending balance
Construction \ 3,499,562 \ 1,845,565 \ (865,223) \ 4,479,904
Heavy industrial 639,706 241,008 (344,598) 536,116
\ 4,139,268 \ 2,086,573 \ (1,209,821) \ 5,016,020
1 In 2016, the increase in subcontracted amount, such as revenue from initial contracts, and decrease in subcontracted
amount, such as alterations in the original contract work, amount to \ 2,275,309 million and \ 188,736 million,
respectively.

Hyosung Corporation and Subsidiaries Notes to Consolidated Financial Statements December 31, 2017 and 2016
101
Details of ongoing construction contracts such as recognized construction profit or loss as at December 31, 2017 and 2016, are as follows: (in millions of Korean won) 2017
Accumulated construction
revenue
Accumulated construction
cost Accumulated profit or loss
Advance received
Retention1
Construction
\ 1,439,580
\ 1,328,466
\ 111,114
\ 42
\ -
Heavy industrial
1,331,366
1,277,462
53,904
687
44,484
\ 2,770,946 \ 2,605,928 \ 165,018 \ 729 \ 44,484
1 In the consolidated statements of financial position, the retention is recorded as long-term deposits provided.
(in millions of Korean won) 2016
Accumulated construction
revenue
Accumulated construction
cost Accumulated profit or loss
Advance received
Retention1
Construction
\ 1,388,368
\ 1,313,698
\ 74,670
\ 1,388
\ -
Heavy industrial
1,275,072
1,232,764
42,308
6,398
48,919
\ 2,663,440 \ 2,546,462 \ 116,978 \ 7,786 \ 48,919
1 In the consolidated statements of financial position, the retention is recorded as long-term deposits provided.
Amount due from and due to customers for contract work as at December 31, 2017 and 2016, are as follows:
(in millions of Korean won) 2017 2016
Due from
customers1 Due to
customers2 Due from
customers1 Due to
customers2
Construction \ 68,228 \ 50,342 \ 56,950 \ 52,543
Heavy industrial 72,127 28,067 60,032 45,735
\ 140,355 \ 78,409 \ 116,982 \ 98,278
Provisions of loss on construction amounting to 12,502 million (2016: 16,768 million) as at December 31, 2017 are included in amounts due from and due to customers for contract work 1 Recognized as due from customers for contract work in the consolidated statement of financial position. 2 Recognized as due to customers for contract work in the consolidated statement of financial position.

Hyosung Corporation and Subsidiaries Notes to Consolidated Financial Statements December 31, 2017 and 2016
102
Details of provision of loss on construction as at December 31, 2016 and 2017, are as follows: (in millions of Korean won) 2017 2016
Taejeon-dong APT, Gwangju \ 3,475 \ 8,055
Telecom center construction 25 114
Welfare facilities construction in downtown 79 120
Qatar MESAIEED Sewage disposal plant construction 4,091 1,727
India Mokokchung & Melriat project 1,058 1,816
India JHARKHAND project 419 775
Parkistan Gujarat project 454 1,285
Qatar ph10 turn-key construction project and etc. 2,901 2,876
\ 12,502 \ 16,768
Provisions of loss on construction are included in amounts due from and due to customers for contract work in the consolidated statement of financial position.
Contractual information that contract revenue for the year ended December 31, 2017 is more than 5% of previous revenues, are as follows:
(in millions of Korean won)
Contract date
Contractual completion
date
Percentage
-of-completion
Due from customers
Trade receivables (receivables from
construction contracts)
Gross
amount
Accumulated impairment
loss Gross
amount Provision for impairment
Urban Redevelopment Projects on the 4th Yongsan Region, Seoul
Dec, 2015 Nov, 2020 9.90% \ 1,245 \ - \ - \ -

Hyosung Corporation and Subsidiaries Notes to Consolidated Financial Statements December 31, 2017 and 2016
103
Details of contract that uses percentage-of-completion measured by reference to the contract costs incurred up to date as a percentage of total estimated costs for each operating segments are as follows:
(in millions of Korean won)
Provisions for expected
losses
Changes in construction
profit or loss Changes in estimated
total contract costs Due from customers
Changes in accounting
estimate Error
correction
Changes in accounting
estimate Error
correction Gross
amount
Accumulated impairment
loss
Construction \ 8,416 \ 2,575 \ - \ (383) \ - \ 68,228 \ - Heavy industry 4,086 15,059 - (7,681) - 72,127 -
\ 12,502 \ 17,634 \ - \ (8,064) \ - \ 140,355 \ -
Details of changes in estimated total contract costs, profits or loss for the year and the succeeding year, and the impact on due from customers for contract work are as follows:
Changes in estimated total
contract revenue
Changes in estimated
total contract cost
Impact on profit or loss for the year
Impact on profit or loss
for the succeeding
year
Changes in due from
customers for contract
work1,2 Construction \ 1,904 \ (383) \ 2,575 \ (288) \ 2,575 Heavy industry (10,752) (7,681) 15,059 (18,130) 15,059 Total \ (8,848) \ (8,064) \ 17,634 \ (18,418) \ 17,634
1 The impact on recognition of housing revenue are included. 2 The impact on sites of due to customers for contract work are included.
The impact on profit or loss for the year and the succeeding year is determined based on total contract costs, which are estimated based on the circumstances present from the start of the contract to the end of current year, and the estimated contract revenue as at December 31, 2017. The total contract costs and contract revenue may change in the future. When the estimated total contract costs increase by 5%, profit before income tax and net assets before income tax effects decrease by \ 126,924 million.

Hyosung Corporation and Subsidiaries Notes to Consolidated Financial Statements December 31, 2017 and 2016
104
30. Expenses by Nature Cost of sales, selling and administrative expenses and research and development expenses by nature for the years ended December 31, 2017 and 2016, are as follows: (in millions of Korean won) 2017 2016
Changes in inventories of finished goods and work-in-
process and others \ (1,270,225) \ (1,191,217)
Changes in merchandise
2,741,861
2,742,334 Raw materials and supplies used
5,488,693
4,502,986
Employee benefit expense (Note 31)
1,231,394
1,173,024 Depreciation and amortization
664,548
623,363
Electricity expense
374,267
354,495 Export expense
136,264
158,688
Fuel expense
138,758
120,679 Service expense
251,864
223,994
Outsourcing expense
981,531
1,048,781 Others
1,036,648
1,155,639
Total 1 \ 11,775,603 \ 10,912,766
1 Included in the cost of sales, selling and administrative expense, and research and development expenses in the
consolidated statements of profit or loss.
31. Employee Benefit Expense
(in millions of Korean won) 2017 2016
Salaries ₩ 1,023,952 \ 972,653 Employee welfare benefits
142,367 135,670
Pension costs - defined contribution plans
5,870 5,471 Pension costs - defined benefit plans (Note 22)
59,205 59,230
₩ 1,231,394 \ 1,173,024

Hyosung Corporation and Subsidiaries Notes to Consolidated Financial Statements December 31, 2017 and 2016
105
32. Selling and Administrative Expenses Selling and administrative expenses for the years ended December 31, 2017 and 2016, are as follows: (in millions of Korean won) 2017 2016
Salaries ₩ 278,117 ₩ 280,022 Severance pension benefits 25,314 23,097 Employee welfare benefits 35,495 34,229 Training 2,878 2,912 Transportation 32,126 30,785 Communications 7,322 7,578 Taxes and dues 22,253 24,591 Rent 40,560 37,302 Bad debt expenses 38,551 38,696 Depreciation 24,133 25,306 Amortization 20,572 26,863 Operating expenses for overseas branches 21,784 22,214 Advertising 48,323 40,425 Freight and storage expenses 68,418 69,164 Service fees 89,913 77,956 Export expenses
136,264
158,688
Entertainment
14,921
15,946 Others
96,668
109,395
₩ 1,003,612 ₩ 1,025,169

Hyosung Corporation and Subsidiaries Notes to Consolidated Financial Statements December 31, 2017 and 2016
106
33. Other Income and Other Expenses Details of other income and other expenses for the years ended December 31, 2017 and 2016, are as follows: (in millions of Korean won) 2017 2016
Other income
Rental income ₩ 2,017 ₩ 2,387 Gain on disposal of property, plant and equipment 1,746 5,396 Gain on disposal of intangible assets - 28 Gain on disposal of investment property 1,660 - Miscellaneous gains
47,447
46,581
Gain on derivative transactions 123 545 Gain on valuation of derivatives - 143 Reversal of provision for impairment loss on other
assets
941
129
Government grants 12,468 10,879 Dividends 422 188 Others 17 -
66,841
66,276
Other expenses
Loss on disposal of property, plant and equipment 3,377 7,353 Impairment loss on property, plant and equipment 106,582 39,188 Loss on disposal of intangible assets 36 756 Impairment loss on intangible assets 54,469 15,173 Loss on disposal of investment property 10,909 1,200 Miscellaneous losses
61,927
79,616
Donations 4,138 6,712 Other bad debt expenses 82,360 14,745 Nego fee 19,061 14,725 Loss on disposal of trade receivables
1,758
2,025
Commissions 89 21 Additional provisions for guarantees 50,505 3,476 Others (8) 310
395,203
185,300
₩ (328,362) ₩ (119,024)

Hyosung Corporation and Subsidiaries Notes to Consolidated Financial Statements December 31, 2017 and 2016
107
34. Finance Income and Expenses Details of finance income and expenses for the years ended December 31, 2017 and 2016, are as follows: (in millions of Korean won) 2017 2016
Finance income Interest income \ 4,557 \ 7,310 Gain on foreign currency transactions 151,985 192,684 Gain on foreign currency translation 202,376 196,259 Gain on disposal of financial assets
Available-for-sale financial assets - 14,036 Gain on derivative transactions 53,263 35,923 Gain on valuation of derivatives 29,848 4,750 Others 794 -
442,823 450,962 Finance costs Interest expenses 175,381 170,286 Loss on foreign currency transactions 154,811 248,124 Loss on foreign currency translation 135,282 218,804 Loss on disposal of financial assets
Available-for-sale financial assets
- 222 Impairment loss on available-for-sale financial
assets 17,053 1,492
Loss on derivative transactions 21,360 16,942 Loss on valuation of derivatives 5,491 24,217
509,378 680,087 \ (66,555) \ (229,125)
The Group recognizes income and expense relating to exchange difference as finance income and expenses.
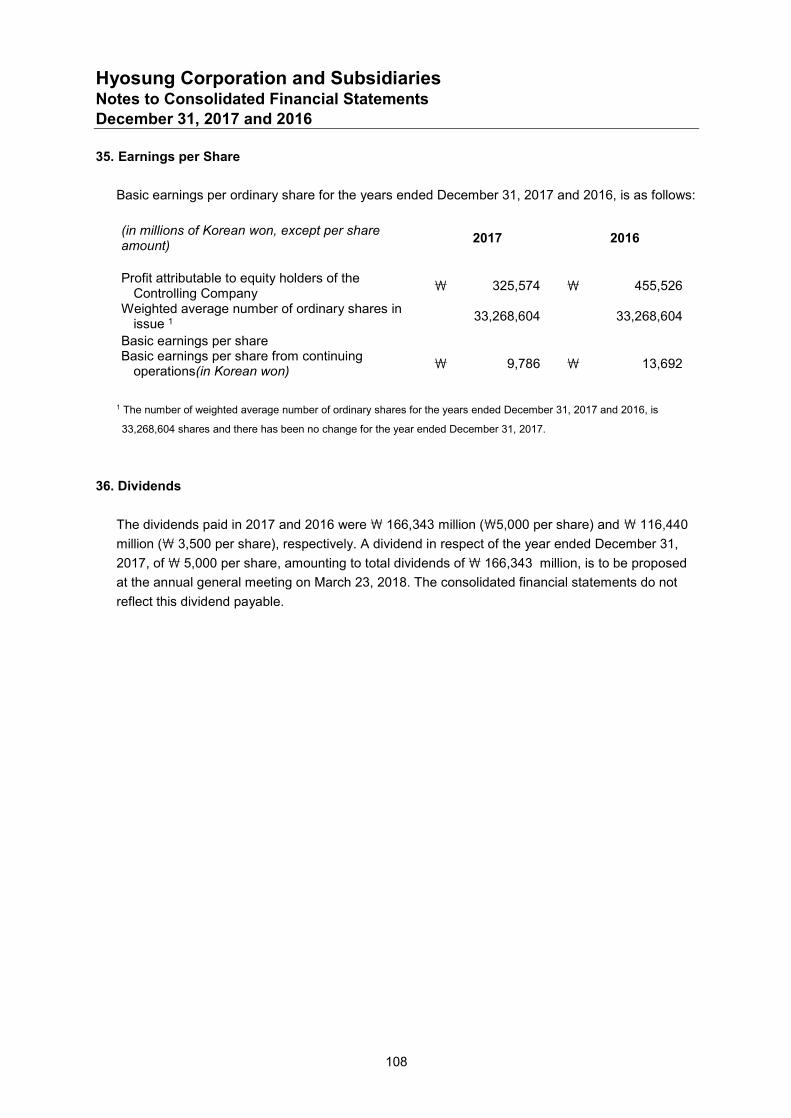
Hyosung Corporation and Subsidiaries Notes to Consolidated Financial Statements December 31, 2017 and 2016
108
35. Earnings per Share Basic earnings per ordinary share for the years ended December 31, 2017 and 2016, is as follows: (in millions of Korean won, except per share amount)
2017 2016
Profit attributable to equity holders of the Controlling Company
\ 325,574
\ 455,526
Weighted average number of ordinary shares in issue 1
33,268,604
33,268,604
Basic earnings per share Basic earnings per share from continuing operations(in Korean won)
\ 9,786
\ 13,692
1 The number of weighted average number of ordinary shares for the years ended December 31, 2017 and 2016, is
33,268,604 shares and there has been no change for the year ended December 31, 2017.
36. Dividends The dividends paid in 2017 and 2016 were \ 166,343 million (\5,000 per share) and \ 116,440 million (\ 3,500 per share), respectively. A dividend in respect of the year ended December 31, 2017, of \ 5,000 per share, amounting to total dividends of \ 166,343 million, is to be proposed at the annual general meeting on March 23, 2018. The consolidated financial statements do not reflect this dividend payable.

Hyosung Corporation and Subsidiaries Notes to Consolidated Financial Statements December 31, 2017 and 2016
109
37. Cash Generated from Operations Details of cash generated from operations for the years ended December 31, 2017 and 2016, are as follows: (in millions of Korean won) 2017 2016
Profit before income tax \ 382,829 \ 696,514 Adjustments for:
Interest income and expenses, net 80,787 75,728 Loss (Gain) on foreign currency translation (67,093) 22,337 Loss (Gain) on valuation of derivatives (24,711)
20,036 Depreciation and amortization 664,548
623,363 Loss on disposal of property, plant, equipment,
intangible assets and investment property
11,712
4,990
Impairment loss on property, plant, equipment, intangible assets, and investment property
161,043
54,361
Bad debts expense 172,036 99,527
Reversal of allowance for bad debts (1,045) (129)
Gain on disposal of financial assets (18,363) (15,091) Impairment loss on financial assets 17,053 1,492 Dividend income (16,761) (13,950) Post-employment benefits 59,204 59,230 Additional provisions adjustment 87,354
40,075 Loss on disposal of trade receivables 1,758
2,025 Gain on investments in subsidiaries and
associates
(6,938)
(28,315)
Long-term employee benefits 923 1,660 Others 67,880
13,976 Changes in assets and liabilities from operations:
Decrease (Increase) in trade receivables (380,001) 201,719
Increase in inventories (243,832) (23,350) Decrease (Increase) in other receivables (24,773) 15,073 Increase in unbilled amount (28,045) (23,541) Decrease in other financial assets 5,602
960 Increase in other assets (27,120)
(6,888) Increase in other financial business assets (2,886) (89,340) Decrease (Increase) in cumulative effect of foreign currency translation
(210,973)
560
Increase in trade payables 411,625 102,447
Increase (Decrease) in other payables (102,816) 257,362
Decrease in other financial liabilities (30,225) (19,063)
Payment of warranty expenses (17,423) (21,308) Payment of post-employment benefits (3,562) (5,122) Distribution to plan assets (60,778) (51,491) Others 408
(1,924) Cash generated from operations \ 857,417 \ 1,993,923
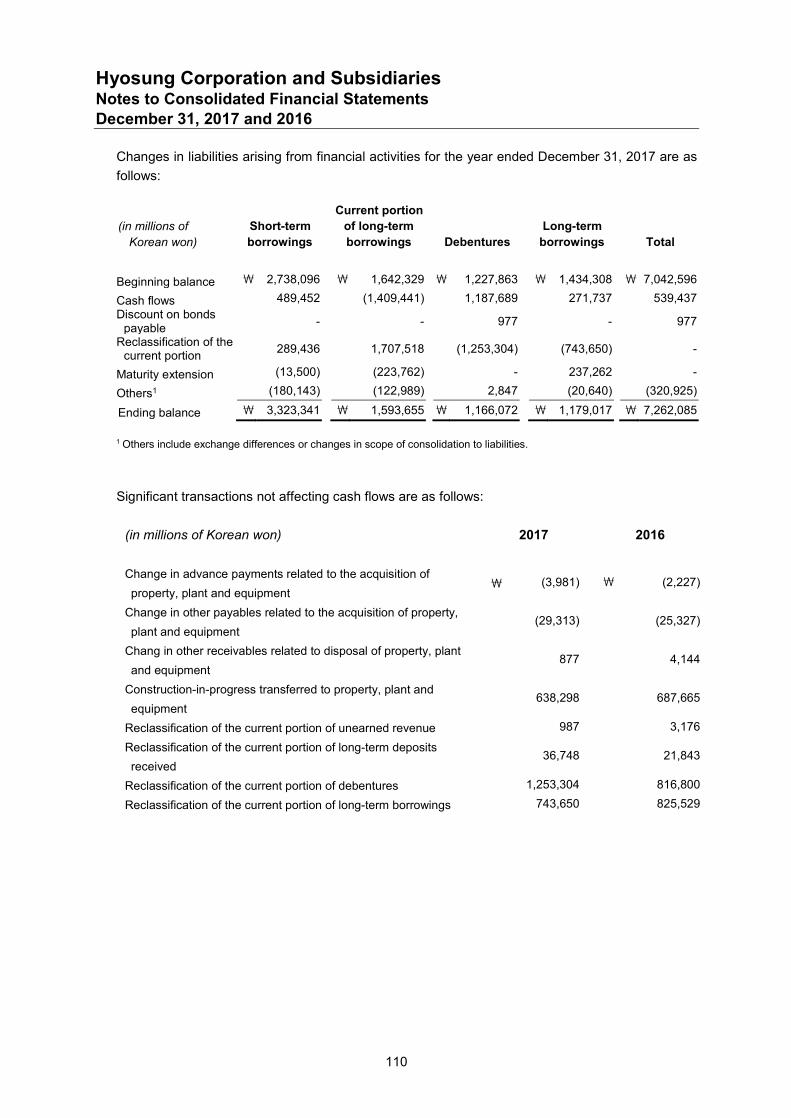
Hyosung Corporation and Subsidiaries Notes to Consolidated Financial Statements December 31, 2017 and 2016
110
Changes in liabilities arising from financial activities for the year ended December 31, 2017 are as follows:
(in millions of Korean won)
Short-term borrowings
Current portion of long-term borrowings
Debentures
Long-term borrowings Total
Beginning balance \ 2,738,096 \ 1,642,329 \ 1,227,863 \ 1,434,308 \ 7,042,596
Cash flows 489,452 (1,409,441) 1,187,689 271,737 539,437 Discount on bonds
payable - - 977 - 977
Reclassification of the current portion 289,436 1,707,518 (1,253,304) (743,650) -
Maturity extension (13,500) (223,762) - 237,262 -
Others1 (180,143) (122,989) 2,847 (20,640) (320,925)
Ending balance \ 3,323,341 \ 1,593,655 \ 1,166,072 \ 1,179,017 \ 7,262,085
1 Others include exchange differences or changes in scope of consolidation to liabilities.
Significant transactions not affecting cash flows are as follows:
(in millions of Korean won) 2017 2016
Change in advance payments related to the acquisition of property, plant and equipment
\ (3,981)
\ (2,227)
Change in other payables related to the acquisition of property, plant and equipment
(29,313)
(25,327)
Chang in other receivables related to disposal of property, plant and equipment
877
4,144
Construction-in-progress transferred to property, plant and equipment
638,298
687,665
Reclassification of the current portion of unearned revenue 987 3,176
Reclassification of the current portion of long-term deposits received
36,748
21,843
Reclassification of the current portion of debentures 1,253,304 816,800
Reclassification of the current portion of long-term borrowings 743,650 825,529
Hyosung Corporation and Subsidiaries Notes to Consolidated Financial Statements December 31, 2017 and 2016
111
38. Contingencies and Commitments (a) Notes and others provided as collaterals As at December 31, 2017, the Group has provided ten notes and seven checks to the customers and other as collaterals for borrowings and transaction agreements.
(b) Loan agreements and others The Group has commitments contracted with financial institution with a limit of ₩ 6,143,839 million, including bank overdrafts, trade bill discounts, open local L/C and general loans. Also, the Group has trade receivable discount agreements with a limit of ₩ 2,169,835 million as at December 31, 2017.
(c) Guarantees provided to others The Group has provided payment guarantees for others, amounting to ₩ 363,389 million (2016: ₩ 232,261 million) as at December 31, 2017, and the limits of the related guarantees are ₩ 572,710 million (2016: ₩ 458,512 million) as at December 31, 2017. Further, as at December 31, 2017, the Group provides joint and several guarantees of performing construction contracts amounting ₩ 3,062,719 million (2016: ₩ 3,195,726 million) in relation to the guarantees of housing distribution which developers obtained from Korea Housing & Urban Guarantee Co., Ltd. In addition, the Group has provided a fund supplemental commitment amounting to ₩ 247,400 million (2016: ₩ 364,400 million) to Grand Sixth Ltd. and others in relation to renewable energy business such as the solar power plant project in Romania as at December 31, 2017, and recognized \ 98,903 million as an expense, regarding this agreement. Meanwhile, the Group has loaned \ 125,853 million for the execution of the fund supplement agreements related to the project, and an additional loan amounting to \ 209,570 million has been provided after the reporting period(Note 10). In addition, the Group has been asked to take over debt amounting to \ 8,804 million due to the failure of completion guarantee regarding the UK biomass business, and a lawsuit is involved regarding this matter. Also, the Group has provided collaterals and payment guarantees for its associates, the related parties (Note 19).

Hyosung Corporation and Subsidiaries Notes to Consolidated Financial Statements December 31, 2017 and 2016
112
(d) Guarantees provided in relation to project financing Details of guarantees provided by the Group to developers as at December 31, 2017 and 2016, are as follows: (in millions of Korean won) 2017 2016 Liabilities take-over/fund supplemental commitments
\ 180,391 \ 180,391
Conditional liabilities take-over 665,000 569,000 Completion guarantee 3,973,300 3,128,000 \ 4,818,691 \ 3,877,391
Details of guarantees provided in relation to project financing as at December 31, 2017, are as follows: (in millions of Korean won)
Construction Creditor
Guarantee
limit
Carrying
amount of
borrowings
Details of
guarantees Guarantee period
Gwangju Taejeondong APT IB \ 132,000 \ 132,000 Debt take-over 2017.04~2018.04
Sunchun-si Resource
Recycling Center BTO
Project
Bank and
insurance 48,391 39,391 Joint guarantees 2015.06~2028.12
\ 180,391 \ 171,391
The Group provides conditional liabilities take-over guarantee amounting to ₩ 454,200 million in for Urban Redevelopment Projects on the 4th Yongsan Region, Seoul and other 5 construction projects with a limit of ₩ 665,000 million. In addition, the Group has committed to fulfill the obligations to complete the responsibilities for the construction of other 28 sites including the construction of Hoehyeon station complex. The related loan balance is \2,228,602 million and the guarantee limits is \ 3,973,300 million.

Hyosung Corporation and Subsidiaries Notes to Consolidated Financial Statements December 31, 2017 and 2016
113
(e) Guarantees provided by others Details of guarantees provided by others as at December 31, 2017, are as follows: (in millions of Korean won)
Guarantor Collaterals and guarantees provided Amount The Export-Import Bank of Korea, Woori Bank and others
Performance guarantee and others
\ 769,718
Kookmin Bank, Shinhan Bank and others
Payment guarantee in foreign currencies and others 81,562
Machinery Financial Cooperative Performance guarantee, Warranty guarantee and others 68,118
Seoul Guarantee Insurance Company Performance guarantee and others 24,359 Seoul Housing and Communities Corporation, Daewoo Engineering & Construction Co.,Ltd and others1 Payment guarantee in borrowing 28,677 Korea Construction Financial
Cooperative and others Construction performance and others 1,895,968
1 The Group has provided certain amount of the shares in Somesevit Coporation of the subsidiaries held by the remaining
shareholders (SHC Corporation, Daewoo Engineering & Construction Co.,Ltd and others) as collateral for borrowings.

Hyosung Corporation and Subsidiaries Notes to Consolidated Financial Statements December 31, 2017 and 2016
114
(f) Assets pledged as collaterals Details of assets pledged as collaterals for the Group’s borrowings as at December 31, 2017, are as follows: (in millions of Korean Won, in USD)
Assets pledged as collaterals Related borrowings Maximum credit
amount Lender
Cash, and cash equivalents KRW 98,400
KRW 127,920
NEW STAR HAECHI INC. and others
PP&E, Intangible assets and others3
Available-for-sale financial assets1 KRW - KRW 135,141 Committee of Creditor Banks of Chin Hung International Inc.
Trade receivables and others USD 43,000,000 USD 43,000,000 Wells Fargo Bank Property, plant, equipment and others KRW 565,535
KRW 1,794,937 Korea Development Bank, Shinhan
Bank and Others Trade receivables KRW 279,445 KRW 298,445 Woori Bank and Others
Available-for-sale financial assets KRW - KRW 3,504 Machinery Financial Cooperative
Available-for-sale financial assets KRW - KRW 4,373 Construction Financial cooperative
Property, plant, equipment2 KRW - KRW 10,000 JeonJu City
Cash, and cash equivalents KRW 165,000
KRW 221,000
Korea Federation Of Community Credit Cooperatives, National Credit Union
Federation of Korea and Others Intangible assets and others
1 The equity shares of Chin Hung International Inc. amounting to \ 135,141 million have been provided as collateral to the
Committee of Creditor Banks of Chin Hung International Inc. in accordance with the special agreement for plans for
normalization of the business of Chin Hung International Inc. (Notes 11 and 19). 2 The certain amount of the property, plant and equipment are provided as collateral to JeonJu City for receiving
government grants. 3 The claim of business Interruption Insurance for Somesevit business have been provided as collateral.
As at December 31, 2017, the Group has pledged its shares in Somesevit Corporation as collateral (with a maximum credit amount of \ 56,000 million) in relation to borrowings of Somesevit Corporation. Also, the Group has pledged its shares in Gongdeok Gyeongwoo Development as collateral (with a maximum credit amount of \ 165,000 million) in relation to borrowings of Gongdeok Gyeongwoo Development Corporation. Also, the Group has pledged its shares in Pyeongchang Wind Power Co., Ltd.(investments in associates, book value of \ 6,949 million) as collateral, relating to borrowings of Pyeongchang Wind Power Co., Ltd. (amount: \ 59,407 million). In addition, property, plant and equipment of the Group have been collateralized in relation to inventory finance of Hyosung Toyota Corp. (Notes 18, 19), Also, the Group has pledged its shares in Soonchon Eco Green Corporation (investments in associates, book value of \ -) as collateral (with maximum credit amount of \ 39,391 million) in relation to borrowing of Soonchon Eco Green Corporation (Note 19).
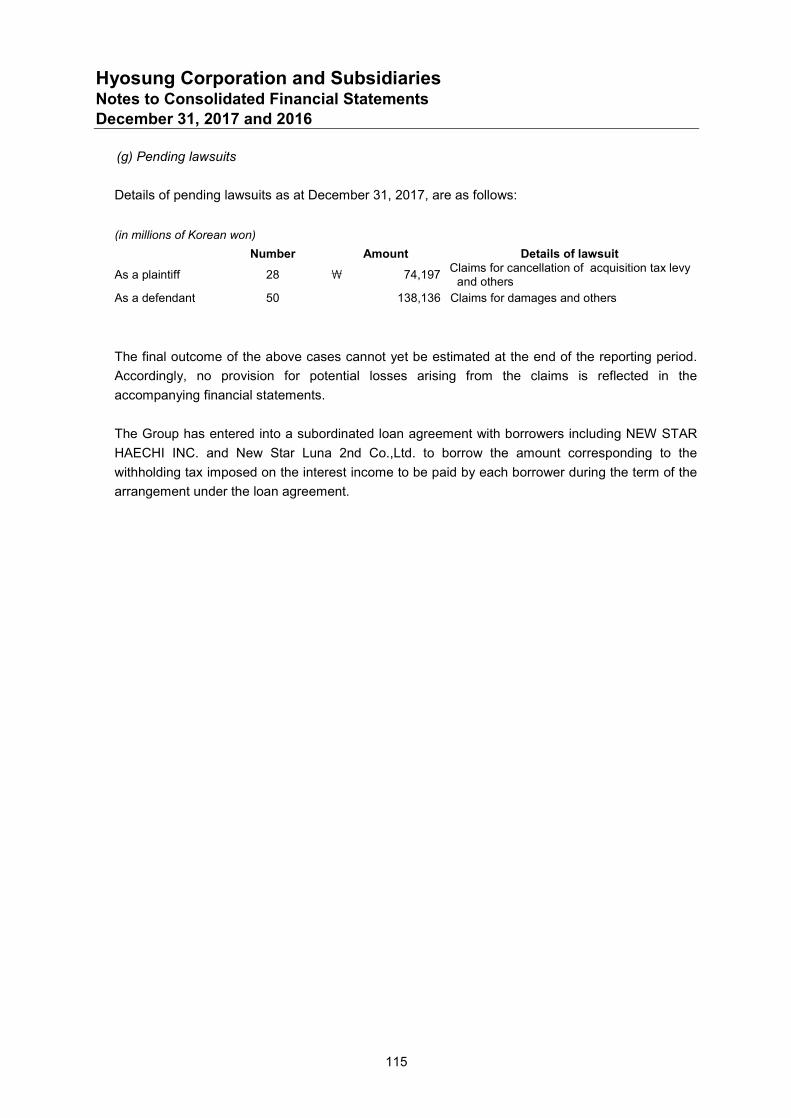
Hyosung Corporation and Subsidiaries Notes to Consolidated Financial Statements December 31, 2017 and 2016
115
(g) Pending lawsuits Details of pending lawsuits as at December 31, 2017, are as follows: (in millions of Korean won)
Number Amount Details of lawsuit
As a plaintiff 28 \ 74,197 Claims for cancellation of acquisition tax levy and others
As a defendant 50 138,136 Claims for damages and others
The final outcome of the above cases cannot yet be estimated at the end of the reporting period. Accordingly, no provision for potential losses arising from the claims is reflected in the accompanying financial statements. The Group has entered into a subordinated loan agreement with borrowers including NEW STAR HAECHI INC. and New Star Luna 2nd Co.,Ltd. to borrow the amount corresponding to the withholding tax imposed on the interest income to be paid by each borrower during the term of the arrangement under the loan agreement.

Hyosung Corporation and Subsidiaries Notes to Consolidated Financial Statements December 31, 2017 and 2016
116
39. Information on Non-controlling Interests
39.1 Changes in Accumulated Non-controlling Interests
The profit or loss allocated to non-controlling interests and accumulated non-controlling interests of subsidiaries that are material to the Group for the years ended December 31, 2017 and 2016, is as follows:
(in millions of Korean won) 2017 Non-
controlling interest
rate (%)
Accumulated non-controlling interests at the
beginning of the year
Profit or loss allocated to
non-controlling interests
Dividends paid to non-controlling interests
Others
Accumulated non-controlling interests at the end of the year
Hyosung Investment & Development Corporation
41.25 \ 6,274 \ (3,982) \ (20,130) \ 41,199 \ 23,361
HanaLandchip Private Real Estate Investment Trust No.39
22.99 334 447 - (893) (112)
Hyosung Capital Co., Ltd. 2.85 11,440 756 - (332) 11,864 Nautilus Hyosung Inc. 45.98 131,751 60 - 2,978 134,789 Hyosung Vietnam Co., Ltd. 11.79 52,972 13,095 - (38,251) 27,816 Other - 19,236 4,889 - (12,078) 12,047 \ 222,007 \ 15,265 \ (20,130) \ (7,377) \ 209,765
(in millions of Korean won) 2016 Non-
controlling interest
rate (%)
Accumulated non-controlling interests at the
beginning of the year
Profit or loss allocated to
non-controlling interests
Dividends paid to non-controlling interests
Others
Accumulated non-controlling interests at the end of the year
Hyosung Investment & Development Corporation
41.25 \ 30,328 \ (4,821) \ (18,480) \ (753) \ 6,274
HanaLandchip Private Real Estate Investment Trust No.39
22.99
(113) 447 - - 334 Hyosung Capital Co., Ltd. 2.85 10,958 232 - 250 11,440 Nautilus Hyosung Inc. 45.98 128,703 5,928 - (2,880) 131,751 Hyosung Vietnam Co., Ltd. 11.79 29,938 18,040 - 4,994 52,972 Other - 14,041 50 - 5,145 19,236 \ 213,855 \ 19,876 \ (18,480) \ 6,756 \ 222,007
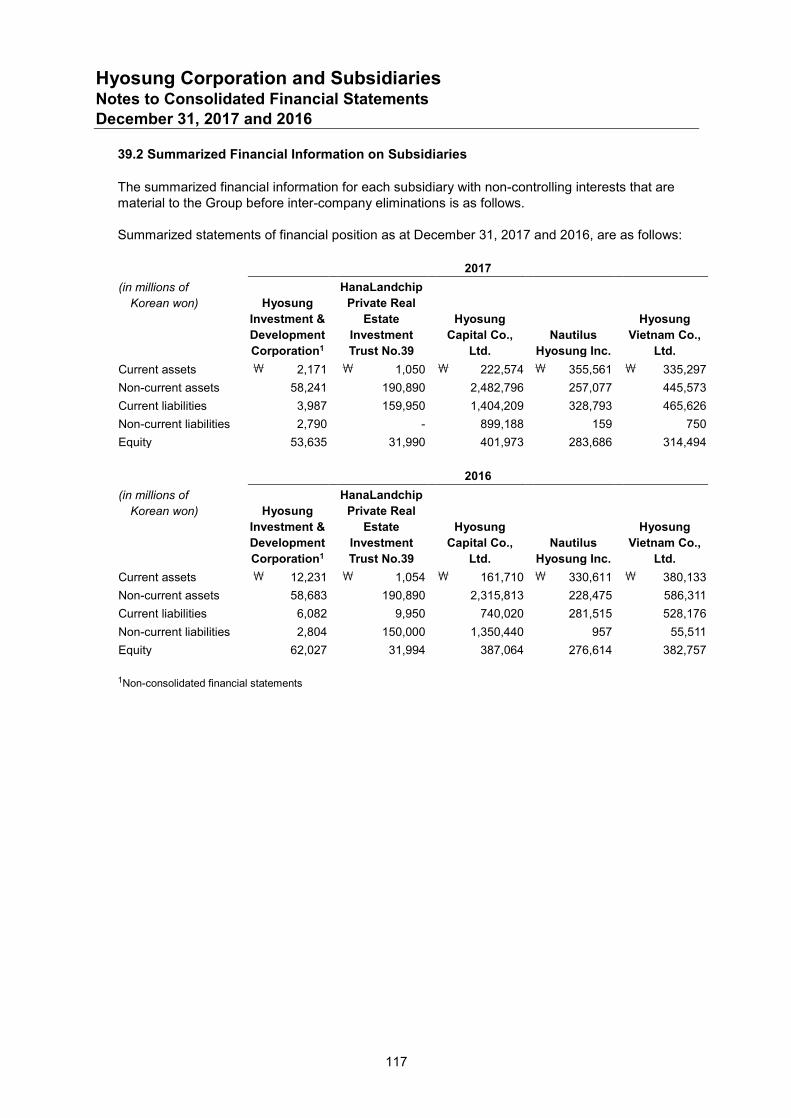
Hyosung Corporation and Subsidiaries Notes to Consolidated Financial Statements December 31, 2017 and 2016
117
39.2 Summarized Financial Information on Subsidiaries
The summarized financial information for each subsidiary with non-controlling interests that are material to the Group before inter-company eliminations is as follows. Summarized statements of financial position as at December 31, 2017 and 2016, are as follows:
2017
(in millions of Korean won)
Hyosung
Investment & Development Corporation1
HanaLandchip Private Real
Estate Investment Trust No.39
Hyosung Capital Co.,
Ltd. Nautilus
Hyosung Inc.
Hyosung Vietnam Co.,
Ltd. Current assets
\ 2,171 \ 1,050 \ 222,574 \ 355,561 \ 335,297
Non-current assets 58,241 190,890 2,482,796 257,077 445,573 Current liabilities 3,987 159,950 1,404,209 328,793 465,626 Non-current liabilities 2,790 - 899,188 159 750 Equity
53,635 31,990 401,973 283,686 314,494
2016
(in millions of Korean won)
Hyosung
Investment & Development Corporation1
HanaLandchip Private Real
Estate Investment Trust No.39
Hyosung Capital Co.,
Ltd. Nautilus
Hyosung Inc.
Hyosung Vietnam Co.,
Ltd. Current assets
\ 12,231 \ 1,054 \ 161,710 \ 330,611 \ 380,133
Non-current assets 58,683 190,890 2,315,813 228,475 586,311 Current liabilities 6,082 9,950 740,020 281,515 528,176 Non-current liabilities 2,804 150,000 1,350,440 957 55,511 Equity
62,027 31,994 387,064 276,614 382,757
1Non-consolidated financial statements

Hyosung Corporation and Subsidiaries Notes to Consolidated Financial Statements December 31, 2017 and 2016
118
Summarized statements of comprehensive income for the years ended December 31, 2017 and 2016, are as follows:
2017 (in millions of Korean won)
Hyosung
Investment & Development Corporation1
HanaLandchip Private Real
Estate Investment Trust No.39
Hyosung Capital Co.,
Ltd. Nautilus
Hyosung Inc.
Hyosung Vietnam Co.,
Ltd. Revenue
\ 1,050
\ 8,087 \ 222,286 \ 605,005 \ 1,224,618
Profit for the year 40,563 1,943 26,532 7,069 108,650 Other comprehensive income
(expenses) (154) - (11,623)
16 (39,934)
Total comprehensive income \ 40,409 \ 1,943 \ 14,909 \ 7,085 \ 68,716
2016 (in millions of Korean won)
Hyosung
Investment & Development Corporation1
HanaLandchip Private Real
Estate Investment Trust No.39
Hyosung Capital Co.,
Ltd. Nautilus
Hyosung Inc.
Hyosung Vietnam Co.,
Ltd. Revenue
\ 544
\ 8,065 \ 189,467 \ 693,424 \ 1,131,331
Profit for the year 38,127 1,945 8,157 25,998 148,795 Other comprehensive income
(expenses) (1,823) - 8,753
(1,681) 21,132
Total comprehensive income \ 36,304 \ 1,945 \ 16,910 \ 24,317 \ 169,927 1Non-consolidated financial statements

Hyosung Corporation and Subsidiaries Notes to Consolidated Financial Statements December 31, 2017 and 2016
119
Summarized statements of cash flows for the years ended December 31, 2017 and 2016, are as follows:
2017
(in millions of Korean won)
Hyosung Investment & Development Corporation1
HanaLandchip Private Real
Estate Investment Trust
No.39
Hyosung
Capital Co., Ltd.
Nautilus Hyosung Inc.
Hyosung
Vietnam Co., Ltd.
Cash flows from operating activities \ 38,827
\ 1,944 \ (134,150) \ 54,305 \ 195,676
Cash flows from investing activities 9,912 - (53,622) (46,197) 34,008 Cash flows from financing activities (48,752) (1,946) 232,108
46,634
(221,921) Net increase (decrease) in cash
and cash equivalents (13) (2) 44,336 54,742 7,763
Cash and cash equivalents at the beginning of year
141 670 121,256 45,810 8,444
Cash and cash equivalents at the end of year
\ 128 \ 668 \ 165,592 \ 100,552 \ 16,207
2016
(in millions of Korean won)
Hyosung Investment & Development Corporation1
HanaLandchip Private Real
Estate Investment Trust
No.39
Hyosung
Capital Co., Ltd.
Nautilus Hyosung Inc.
Hyosung
Vietnam Co., Ltd.
Cash flows from operating activities \ 41,641
\ 1,971 \ (36,831) \ 108,849 \ 268,503
Cash flows from investing activities 3,080 - (57,298) (15,588) (36,980)
Cash flows from financing activities (44,800) (1,934) 47,423
(108,509)
(230,712)
Net increase (decrease) in cash and cash equivalents
(79) 37 (46,706) (15,248) 811
Cash and cash equivalents at the beginning of year
221 633 167,962 61,057 7,633
Cash and cash equivalents at the end of year
\ 142 \ 670 \ 121,256 \ 45,809 \ 8,444
1Non-consolidated financial statements

Hyosung Corporation and Subsidiaries Notes to Consolidated Financial Statements December 31, 2017 and 2016
120
40. Unconsolidated Structured Entities
The nature of business unconsolidated structured entities as at December 31, 2017 and 2016, are as follows:
(in millions of Korean won)
Purpose of establishment
and activities Method of financing 2017 2016
Investment fund and
investment trust Enforcement of investment and
profit sharing Issuance of equity shares \ 3,182,494 \ 2,672,663
Mortgage loan Investment and in real property and collection through sales
Issuance of equity shares and borrowings
1,816,552 1,316,904
Securitization of assets Securitization and collection of assets
Issuance of ABL and ABCP
349,610 90,829
Investment in vessels Investment in vessels and profit sharing
Issuance of equity shares and borrowings
19,830 29,080
The risk of interest in unconsolidated structured entities as at December 31, 2017 and 2016, are as follows:
(in millions of Korean won)
2017 Book value of
available-for-sale financial assets
Book value of
receivables
Total Investment fund and investment trust \ 200,703 \ - \ 200,703 Mortgage loan - 101,856 101,856 Securitization of assets - 45,462 45,462 Investment in vessels - 9,742 9,742
(in millions of Korean won)
2016 Book value of
available-for-sale financial assets
Book value of
receivables
Total Investment fund and investment trust \ 145,280 \ - \ 145,280 Mortgage loan - 117,986 117,986 Securitization of assets - 5,000 5,000 Investment in vessels - 9,158 9,158 Maximum exposure to loss on interest in unconsolidated structured entities as at December 31, 2017 and 2016, is equal to the book amount.
Hyosung Corporation and Subsidiaries Notes to Consolidated Financial Statements December 31, 2017 and 2016
121
41. Restatement of Prior Year Financial Statements
The Group restated its prior year consolidated financial statements to correct the understatement of impairment losses on available-for-sale financial assets as at December 31, 2013. As a result, the retained earnings and other comprehensive income as at December 31, 2016, decreased and increased respectively by \ 24,403 million and there is no impact on the prior year's consolidated statement of profit or loss.
42. Events After the Reporting Period
42.1 Spin-off
In order to secure competitiveness of each business division and to strengthen its expertise, the Group will be divided into the Fabric and Trading business, the Heavy industrial and Construction business, the Industrial materials business and the Chemical business. The date of spin-off will be June 1, 2018. After the spin-off, the existing spin-off company, Hyosung Corporation, will remain as a listed corporation on the securities market and the new spin-off company will also be established as a listed corporation.
42.2 Establishment of new corporation
The Group decided to establish the new corporation in Vietnam (amount to be invested \196,164 million) to grow as the Global PP Maker by establishing a PP batch production system in accordance with the resolution by the Board of Directors held on February 6, 2018.


![Hyosung Corporation Catalog English 2010[1]](https://img.pdfslide.net/doc/110x75/547826335806b5fc188b46f4/hyosung-corporation-catalog-english-20101.jpg)