Embed Size (px)
Citation preview

doi.org/10.26434/chemrxiv.12859559.v1
Hypercrosslinked Polymers as a Photocatalytic Platform forVisible-Light-Driven CO2 Photoreduction Using H2OGiulia M. Schukraft, Robert Woodward, Santosh Kumar, Michael Sachs, Salvador Eslava, Camille Petit
Submitted date: 25/08/2020 • Posted date: 25/08/2020Licence: CC BY-NC-ND 4.0Citation information: Schukraft, Giulia M.; Woodward, Robert; Kumar, Santosh; Sachs, Michael; Eslava,Salvador; Petit, Camille (2020): Hypercrosslinked Polymers as a Photocatalytic Platform forVisible-Light-Driven CO2 Photoreduction Using H2O. ChemRxiv. Preprint.https://doi.org/10.26434/chemrxiv.12859559.v1
The design of robust, high-performance photocatalysts is key for the success of solar fuel production viaCO2conversion. Herein, we present hypercrosslinked polymer (HCP) photocatalysts for the selectivereduction of CO2 to CO, combining excellent CO2 sorption capacities, good general stabilities, and lowproduction costs. HCPs are active photocatalysts in the visible light range, significantly out-performing thebenchmark material, TiO2 P25, using only sacrificial H2O. We hypothesise that superior H2O adsorptioncapacities led to concentration at photoactive sites, improving photocatalytic conversion rates whencompared to sacrificial H2. These polymers are an intriguing set of organic photocatalysts, displaying nolong-range order or extended pi-conjugation. The as-synthesised networks are the sole photocatalyticcomponent, requiring no co-catalyst doping or photosensitiser, representing a highly versatile and excitingplatform for solar-energy conversion.
File list (4)
download fileview on ChemRxivHCP_CO2_250820_CP.pdf (551.49 KiB)
download fileview on ChemRxivESI_HCP_CO2_250820_CP.pdf (1.54 MiB)
download fileview on ChemRxivHCP_CO2_250820_CP.docx (441.26 KiB)
download fileview on ChemRxivESI_HCP_CO2_250820_CP.docx (17.53 MiB)

Hypercrosslinked polymers as a photocatalytic platform for visible-
light-driven CO2 photoreduction using H2O
Giulia E. M. Schukraft,[a] Robert T. Woodward,[a,b] * Santosh Kumar,[c] Michael Sachs,[d] Salvador
Eslava,[c] Camille Petit[a] *
[a] G. E. M. Schukraft, Dr R. T.Woodward, Dr. Camille Petit
Barrer Centre
Department of Chemical Engineering, South Kensington Campus
Imperial College London, London, SW7 2AZ
E-mail: [email protected]
[b] Dr. R. T. Woodward (current address)
Institute of Materials Chemistry and Research, Faculty of Chemistry
University of Vienna, Währinger Straße 42,
1090 Vienna, Austria
E-mail: [email protected]
[c] Dr. S. Kumar, Dr. S. Eslava
Department of Chemical Engineering
Imperial College London, London, SW7 2AZ
[d] Dr. M. Sachs
Department of Chemistry, White City Campus
Imperial College London, London, W12 0BZ

Abstract: The design of robust, high-performance photocatalysts is key for the success of solar fuel
production via CO2 conversion. Herein, we present hypercrosslinked polymer (HCP) photocatalysts
for the selective reduction of CO2 to CO, combining excellent CO2 sorption capacities, good general
stabilities, and low production costs. HCPs are active photocatalysts in the visible light range,
significantly out-performing the benchmark material, TiO2 P25, using only sacrificial H2O. We
hypothesise that superior H2O adsorption capacities led to concentration at photoactive sites,
improving photocatalytic conversion rates when compared to sacrificial H2. These polymers are an
intriguing set of organic photocatalysts, displaying no long-range order or extended pi-conjugation.
The as-synthesised networks are the sole photocatalytic component, requiring no co-catalyst doping
or photosensitiser, representing a highly versatile and exciting platform for solar-energy conversion.
Keywords: Carbon dioxide photoreduction • Hypercrosslinked polymers • Photocatalysis • Porous
organic polymers • Solar fuels

Introduction
The ever-increasing global energy demand requires a significant overhaul of current production
processes if humanity is to address climate change. Carbon management and renewable energy
must play a key role in our energy outlook, challenging researchers to reshape our energy portfolio.
Research efforts are focused on the development of efficient carbon capture, utilisation, and storage
(CCUS) technologies, as well as the improvement of methods to harness renewable energy.[1] The
use of sunlight shows promise towards the building of a sustainable chemical industry. Solar fuels
are synthetic fuels produced via the conversion of solar energy into chemical energy, namely H2 from
H2O, and C1 and C1+ chemicals from CO2. This conversion can be done by a variety of processes,
including photochemical (often named artificial photosynthesis), thermochemical, and
electrochemical reactions. However, overcoming the high thermodynamic and kinetic barriers to
conversion is challenging, and so a catalyst is required to improve energy efficiency and, ultimately,
render these processes viable.[2-3]
Here, we focus on a photochemical route to solar fuel production, namely photocatalysis, whose
main advantage lies in the simplicity of its implementation. To date, ‘traditional’ semiconductors, e.g.
metal oxide/sulfides and transition metal complexes, such as TiO2, CdS, ZnO, WO3, Ru-, Re- and
Pd-based complexes have received much attention as photocatalysts, owing to their ability to
generate charge carriers under light irradiation.[4-7] However, a lack of structural versatility and
notoriously difficult to tune frontier energy levels in inorganic materials often limit their performance,
while the requirement of rare-earth metals presents significant sustainability issues. Moreover,
traditional semiconductors are often predominantly active at ultraviolet wavelengths, constituting just
~4% of the solar spectrum, prompting great interest in the development of visible light-active
photocatalysts for improved efficiency.
The development of new classes of photoactive materials, including inorganic-organic hybrids,
such as metal-organic frameworks (MOFs), or organic-based materials, such as porous organic
polymers, have emerged as promising alternatives to traditional photocatalysts.[8-12] The structural
versatility of polymers enables photochemical tunability and, ultimately, optimisation of photocatalytic
performance. Owing to their general chemical inertness and non-metallic nature, porous organic
polymers are of particular interest in the design of new photocatalysts. Yang et al. reported triazine-
based conjugated microporous polymers (CMPs) for CO2 photoconversion to CO using visible
light.[13] The optical band gap of the materials was engineered by the inclusion of various electron-
withdrawing and electron-donating groups. Yu et al. employed Pd-catalysed Sonogashira–Hagihara
coupling to produced Eosin Y-functionalised porous polymers, able to photoreduce CO2 to CO with
92% selectivity, using visible light and sacrificial H2O.[14] More recently, Fu et al. reported rhenium-
doped covalent-organic frameworks (COFs), with high CO2 photoreduction rates in the presence of
acetonitrile and sacrificial triethanolamine.[12] Furthermore, a metal-free COF produced using
solvothermal condensation reactions was reported as a visible-light-driven photocatalyst for CO2
photoreduction in the presence of water.[12, 15] While demonstrating the potential of porous organic
polymers for CO2 photoreduction, the synthesis of porous organic polymer photocatalysts generally
requires the use of rare-earth metals, or specifically polymerisable monomeric units, presenting
implementation barriers due to relatively high-costs and poor sustainability.
Hypercrosslinked polymers (HCPs) represent a class of materials with excellent tunability and
relatively low costs. HCPs are densely crosslinked amorphous networks, produced using simple
Friedel-Crafts chemistry. Non-functional aromatic compounds (i.e. without specifically polymerisable
groups) can be ‘knitted’ together using an external crosslinker, requiring only iron(III) chloride as
catalyst.[16] The employment of external crosslinkers means a large array of aromatic compounds
can be considered as monomeric material, providing substantial scope for the design of HCPs.
Owing to their low cost and chemical versatility, HCPs are being developed for many different
applications such as gas separation and storage,[17-18] solid-state extraction,[19-20] and in catalysis.[21]
Recently, Wang et al. used an HCP-TiO2-graphene composite for the photoreduction of CO2, with
the HCP component aiding CO2 adsorption and diffusion.[22] The ability of HCPs alone to catalyse
solar fuel production, however, remains unknown.
Herein, we present HCPs as a new class of photocatalyst capable of selectively reducing CO2
to CO. Photocatalytic conversion was achieved using only visible light in the presence of sacrificial
H2O, without additional sacrificial agents or co-catalysts, significantly out-performing TiO2 P25 (x7.5
times). The influence of the reducing agent was investigated (i.e. H2 vs. H2O). Surprisingly, employing
sacrificial H2O led to significant improvements in photoconversion rates. We hypothesise that the
preferential adsorption of H2O concentrates the sacrificial agent at the HCP’s surface, driving
photocatalytic performance. Owing to their lack of requirement for precious-metal catalysts, as well
as their easily scaled chemistry, HCPs present an exciting platform for the further design and
discovery of high-performance organic photocatalysts.
Results and Discussion
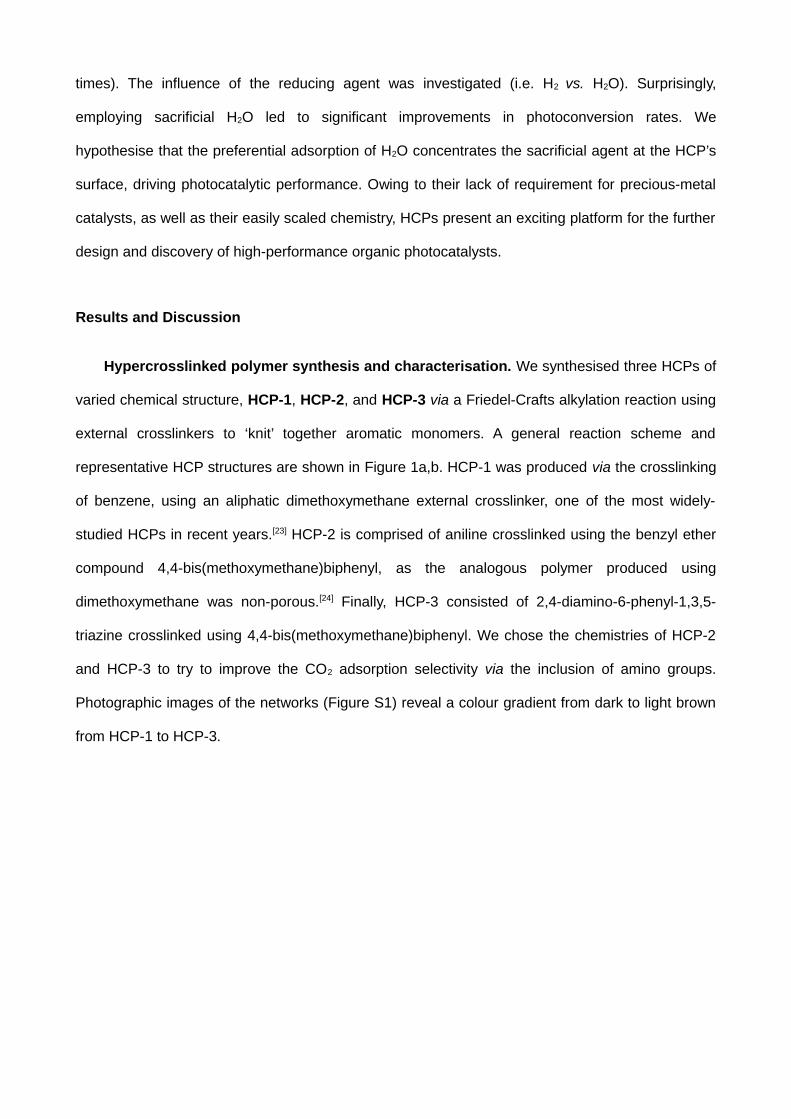
Hypercrosslinked polymer synthesis and characterisation. We synthesised three HCPs of
varied chemical structure, HCP-1, HCP-2, and HCP-3 via a Friedel-Crafts alkylation reaction using
external crosslinkers to ‘knit’ together aromatic monomers. A general reaction scheme and
representative HCP structures are shown in Figure 1a,b. HCP-1 was produced via the crosslinking
of benzene, using an aliphatic dimethoxymethane external crosslinker, one of the most widely-
studied HCPs in recent years.[23] HCP-2 is comprised of aniline crosslinked using the benzyl ether
compound 4,4-bis(methoxymethane)biphenyl, as the analogous polymer produced using
dimethoxymethane was non-porous.[24] Finally, HCP-3 consisted of 2,4-diamino-6-phenyl-1,3,5-
triazine crosslinked using 4,4-bis(methoxymethane)biphenyl. We chose the chemistries of HCP-2
and HCP-3 to try to improve the CO2 adsorption selectivity via the inclusion of amino groups.
Photographic images of the networks (Figure S1) reveal a colour gradient from dark to light brown
from HCP-1 to HCP-3.

Figure 1. a) Reaction scheme for the production of HCP-3 by Friedel-Crafts alkylation,
b) representative chemical structures of HCP repeat units, c) N2 adsorption isotherms at -
196 °C, filled symbols represent adsorption and empty symbols represent desorption, d) CO2 uptake
at 1 bar and 25 °C for HCPs in both ‘dry’ and ‘wet’ states, i.e. HCPs exposed to humid atmospheres
before measurement, e) pore size distributions of HCPs, calculated using DFT method.
We successfully incorporated the aromatic monomers into the networks, as confirmed using Fourier-
transfer infrared spectroscopy (FTIR), which showed distinct stretches for primary amines in HCP-2
and HCP-3, and the triazine tertiary amines in HCP-3 (Figure S2). HCP-2 and HCP-3 contain 1.3
and 7.9 at% N, respectively, as determined via X-ray photoelectron spectroscopy (XPS) survey
spectra (Figure S4 and Table S2). These values correspond to final polymer compositions of roughly
1:4 and 1:3 monomer to crosslinker ratios for HCP-2 and HCP-3, respectively. Scanning electron
micrographs revealed HCP-1 and HCP-3 as agglomerated spherical particles, whereas HCP-2
shows a more fibrous structure (Figure S4). Thermogravimetric analysis demonstrated the high
thermal stability of all HCPs, with decomposition temperatures of >300 °C in both N2 and air
atmospheres (Figure S5-6). Char yields in N2 at 900 °C were > 60% in all HCPs, while complete
degradation was observed in air at > 550 °C. Powder X-ray diffraction confirmed the amorphous
nature of all HCP networks (Figure S7).
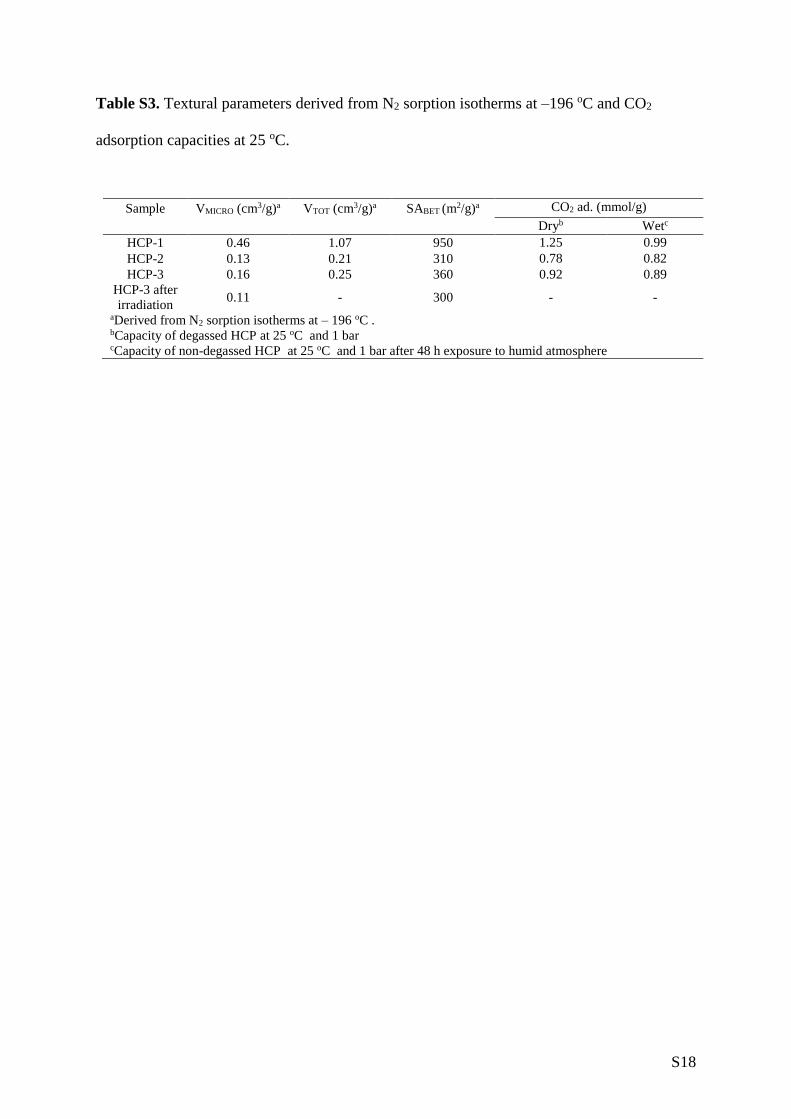
We used N2 sorption measurements at -196 °C to assess the porous nature of the networks.
HCP-1, HCP-2, and HCP-3 exhibited BET surface areas of 951, 311, and 357 m2/g, respectively
(Figure 1c and Table S3). All HCPs displayed a combination of type I and type IV isotherms,[25] with
significant microporosity, as indicated by the steep N2 uptake at low relative pressures, as well as
meso/macroporosity. Micropore volume was highest in HCP-1 (0.46 cm3/g), dropping to 0.13 and
0.16 cm3/g for HCP-2 and HCP-3, respectively, reflecting trends seen in the polymer’s BET surface
areas. Figure 1e highlights a multimodal pore size distribution for all networks, predominantly
concentrated in the micropore region. Pores of around 0.5 nm in size contribute noticeably to HCP-
1’s surface area, whereas both HCP-2 and HCP-3 do not show any significant area derived from
pores smaller than 1 nm in diameter.
To assess the CO2 uptake ability of HCPs, we collected adsorption isotherms at 25 °C up to 1
bar (full isotherms are shown in Figure S8). Although the HCPs followed the expected trend, i.e.
higher surface area polymers adsorbed more CO2, the CO2 capacities did not reflect the large
differences in surface areas (Table S3). The presence of the amino groups in HCP-2 and HCP-3,
which are known to impart CO2 selectivity to hypercrosslinked polymers,[26] increased uptake density
per unit of surface area due to more attractive interactions with the adsorbate CO2.[27-28]
The presence of adsorbed water was shown to impede CO2 uptake in polar HCPs, due to
competitive adsorption.[29] Therefore, we investigated the effect of H2O and CO2 co-adsorption, since
we used sacrificial H2O vapour in CO2 photoreduction (see below). We exposed the samples to
humid air (>99 % humidity) for at least 48 h before collecting CO2 adsorption isotherms at 25 °C up
to 1 bar. Crucially, samples were not degassed prior to CO2 adsorption measurements (details in
ESI), i.e. adsorbed H2O was not removed. These conditions are close to those in photoreduction
experiments. The CO2 sorption capacities at 1 bar are given in Figure 1d. The full isotherms of both
degassed, “dry”, and humidity-exposed, “wet”, HCPs are shown in Figure S8. Wet HCP-1 showed a
21% decrease in CO2 capacity in comparison to its dry equivalent, while the amine-containing HCP-
2 and HCP-3 showed negligible difference in CO2 uptake between the wet and dry networks. These
uptake capacities demonstrate the minimal impact of water co-adsorption, emphasising the selective

adsorption of CO2 by the polymers, particularly HCP-2 and HCP-3. During photoreduction
experiments, we did not expose HCPs to water vapour prior to CO2 reduction, but rather a stream of
CO2 containing water vapour. As such, the effect of co-adsorption is likely to be less significant in-
situ.
CO2 photoreduction activity of hypercrosslinked polymers
To evaluate the potential of HCPs for CO2 photoreduction, we investigated their optoelectronic
properties using UV-visible diffuse reflectance spectroscopy (UV-vis DRS). The UV-vis spectra show
all HCPs absorb light in both the UV and visible range, with absorption onsets of 348, 350, and 389
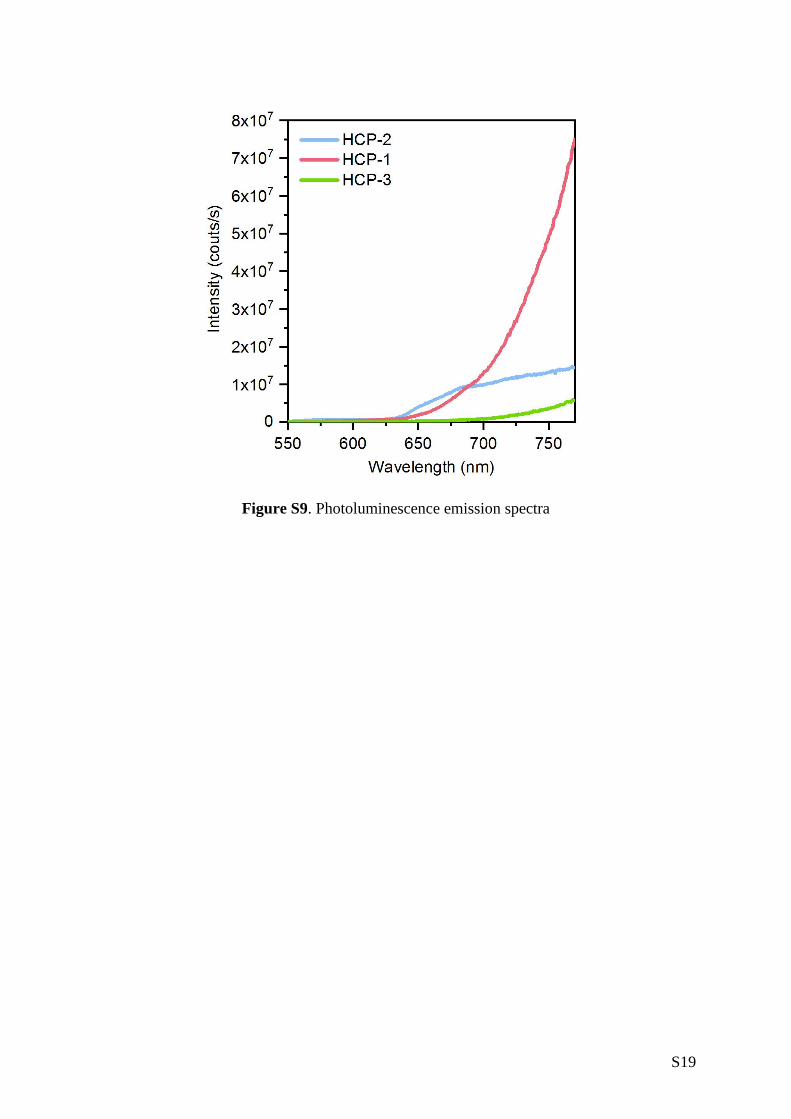
nm for HCP-1, HCP-2 and HCP-3, respectively (Figure 2a). All three HCPs exhibited
photoluminescence above 550 nm (Figure S9), and as shown in Figure 2b we probed their
photoluminescence lifetimes at 700 nm using time-correlated single photon counting (TCSPC) upon
282 nm excitation. The time at which the photoluminescence signal has decayed to half its initial
amplitude (half-lifetime) was 1.9 ns, 2.2 ns, and 3.2 ns for HCP-1, HCP-2, and HCP-3, respectively,
which demonstrates that HCP-3 has a substantially longer excited state lifetime than HCP-1 or HCP-
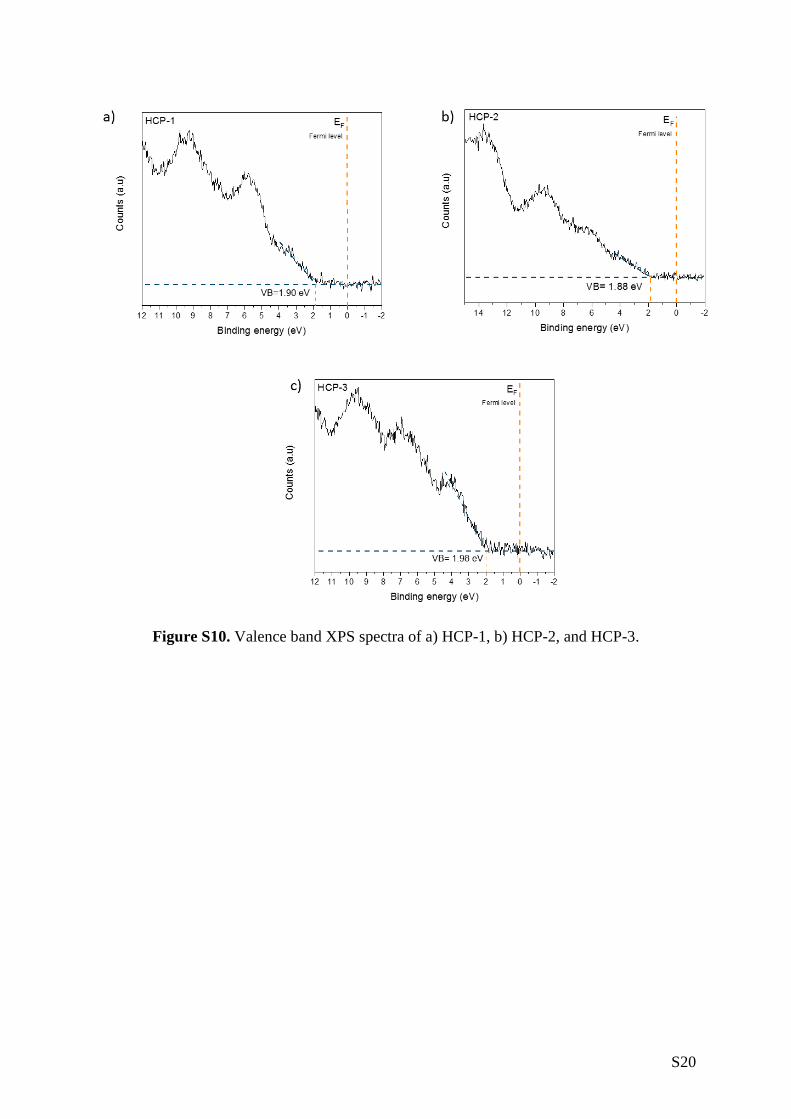
2. We estimated the HCP’s valence band (VB) and conduction band (CB) positions by
complementing our UV-vis DRS data with XPS measurements (Figure 2c). First, valence band XPS
measurements allowed us to ascertain the distance between the Fermi level (EF) and the VB onset,
also known as VB offset (Figure S10). Placing the VB offset on the absolute energy scale requires
knowledge of the position of the Fermi level, which was determined by measuring the secondary
electron cut-off through XPS work function measurements (Figure S11). Finally, we identified the CB
position using the UV-vis spectra absorption onset. For all HCPs, the CB is located above the
reduction potential of CO2/CO and the VB below the oxidation potential of both H2/H2O and O2/H2O.
Hence, the band diagrams point towards a sufficient thermodynamic driving force to enable the
reduction of CO2 to CO using either gaseous H2 or H2O as a sacrificial agent. The Fermi level of all
HCPs lies closer to the CB than the VB, suggesting electrons are the major charge carriers, which
is desirable for CO2 photoreduction. Overall, the narrow band gaps and visible light absorption
properties of HCPs, as well as their CO2 adsorption capacities, make them a priori attractive
candidates for CO2 photoreduction.

After establishing their CO2 adsorption ability and desirable optoelectronic properties, we tested
HCPs for the photocatalytic reduction of gaseous CO2. We conducted the tests in a heterogeneous
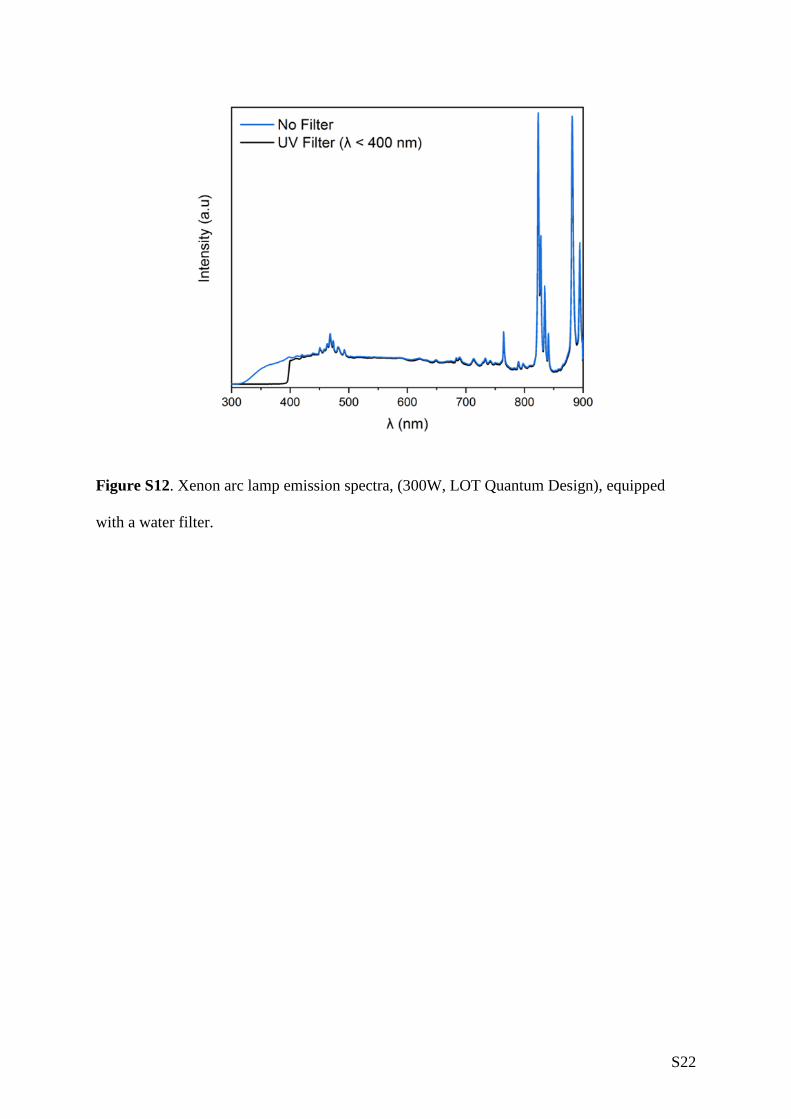
gas/solid photoreactor at ambient temperature, using either H2 or H2O as a sacrificial agent under
UV-vis or visible irradiation alone (Xe arc lamp, 300 W, Figure S12). No co-catalyst or photosensitiser
was required, but some residual iron is present from the HCP synthesis and may play a role in the
photoreduction activity (Table S1) as shown with Pd for other organic materials in the context of H2
evolution.[30-31] A representation sample of HCP-2 was found to contain 246 ppm of Fe. Under the
same conditions, digestion of HCP-1 and HCP-3 was unsuccessful and the iron content could not
be estimated. A gas phase reactor was chosen to combine CO2 capture and CO2 conversion,
avoiding limitations owing to poor CO2 solubility in some liquid phase reactions (Figure S13). In each
experimental set, we compared HCP performance to that of the benchmark TiO2 P25. For all HCPs,
after 3 hours of irradiation the primary carbonaceous product observed was CO, with a selectivity of
up to 96% and 95% using sacrificial H2 or H2O, respectively (Figure 2d and 2e, Table S4, Table S5).
Trace CH4 was also detected, representing the only other carbonaceous product measured.
Regardless of the sacrificial agent, HCP-2 exhibited the lowest CO production rate, while HCP-3
displayed the highest. The photocatalytic performance of HCP-3 was comparable to that of TiO2 P25
under UV-vis light and was up to 7.5 times better when irradiated with only visible light (Figure 2e,
Table S4). In fact, we observed photocatalytic activity for all HCPs under visible light alone, a
significant finding for organic materials requiring no doping or co-catalyst. The decrease in activity
under visible light compared to UV-vis is rationalised using their UV-vis absorption spectra (Figure
2a). As HCP-1 is the network that shows the highest light absorption in the visible region, its
photoactivity is the least affected by the absence of UV light.

Figure 2. a) UV-vis absorption coefficient spectra with absorption onsets indicated, b)
photoluminescence decay kinetics probed at 700 nm following excitation at 282 nm, along with the
instrument response function (IRF) probed at the excitation wavelength, c) band gap position, d)
photocatalytic production rates using sacrificial H2 in UV-vis, e) photocatalytic production rates using
sacrificial H2O in both UV-vis and visible light alone, f) HCP-3 recyclability test over 5 cycles of 3 h
irradiation using UV-vis light and sacrificial H2O.
Activity in the visible range is promising for the future of HCP photocatalysts in real-world applications
as visible light comprises a large portion of the sun’s output reaching the Earth’s surface. Targeted
network modifications might allow further optimisation of this visible light activity. The high photocatalytic
activity of HCP-3 likely arises from the presence of triazine groups. Lee et al. reported stronger
electrostatic CO2 interactions in triazines when compared to benzene and amino groups, as are present
in HCP-1 and HCP-2, respectively.[32] Triazine groups may also offer an additional delocalisation of the
electrons, favouring lower electron-hole recombination.[33-34] Time-resolved photoluminescence showed
that HCP-3 displayed the lowest electron-hole recombination rates (Figure 2b), offering more opportunity

for charges to migrate to the surface of the photocatalyst for CO2 photoconversion. To gain further
insights on the key parameters influencing CO2 adsorption and photoconversion, a systematic HCPs
screening is required.
Interestingly, CO2 photoreduction performance of HCPs improved by up to 2.5 times when replacing
H2 with sacrificial H2O (Figure 2 d,e). From a thermodynamic standpoint, such behaviour is intriguing as
H2O oxidation requires a higher driving force than H2 oxidation. We hypothesised that the increased
photoactivity in the presence of H2O is due to HCPs displaying significantly improved adsorption
capacities for H2O when compared to H2. This leads to an increased availability of the sacrificial agent
at the photoactive sites on the HCPs’ surface, improving photoreduction rates. To investigate this
hypothesis, we collected pure H2 and H2O adsorption isotherms for all HCPs (Figure 3). From the pure
adsorption isotherms, under operating conditions (atmospheric pressure, 25 °C) HCPs adsorbed <0.1
mmol/g of H2, in comparison to between 2 and 9.4 mmol/g for H2O, an increase of 2 orders of magnitude.
A higher concentration of sacrificial agent at the HCP’s surface should favour high CO2 photoreduction
rates, explaining the increase of photoactivity when using H2O as reducing agent.
To further investigate the importance of H2O adsorption on the photoactivity, we decreased the
humidity inside the photoreactor by decreasing the temperature of the H2O vapour saturator to ~ 1 °C.
At 1 oC, the partial pressure of H2O at saturation is reduced (6.6 mbar), dramatically reducing the
concentration of H2O introduced into the system. After sealing the reactor, we conducted CO2
photoreduction measurements at 25 °C, under atmospheric pressure. The decreased humidity of the
stream resulted in a 38% decrease in activity for HCP-3 (Figure S14). Indeed, H2O uptake in this network
is reduced to around 0.4 mmol/g at 6.6 mbar, as estimated from the pure water sorption isotherm (Figure
3b).

Figure 3. a) H2 and b) H2O adsorption isotherms at 25 oC. Filled symbols represent adsorption and empty
symbols represent desorption.
This further corroborates the importance of the adsorption of the sacrificial agents to the photocatalyst
surface. TiO2 also showed improvements when employing sacrificial H2O in place of H2. Sorescu et al.
outlined how co-adsorbed water on TiO2 can positively affect the adsorption capacities of CO2 through
the formation of hydrogen bonds.[35] Other materials such as ZrO and coal also exhibit increased CO2
adsorption and/or activation in the presence of co-adsorbed H2O.[36-38] In addition to ensuring the
presence of H2O molecules close to active sites, we speculate that co-adsorbed water may also favour
CO2 activation and/or the formation of bicarbonate species and facilitate its photoreduction, as suggested
elsewhere for other photocatalysts.[39-40] Nonetheless, further studies are required to understand the
influence of H2O on CO2 adsorption.
We examined further the photocatalytic properties under UV-vis irradiation of HCP-3, the most active
photocatalyst of this study. Kinetic studies point to a relatively linear production of CO up to 3 h of
0 5 10 15 20 25
0
2
4
6
8
10
Absolure Pressure (mbar)
H2O
Ad
so
rptio
n (
mm
ol.g
-1)
0 200 400 600 800 1000
0
2
4
6
8
10
Absolute Pressure (mbar)
H2 A
dso
rptio
n (
mm
ol.g
-1)
a)
b)
HCP-1
HCP-2
HCP-3
HCP-1
HCP-2
HCP-3
H2O
H2
0 200 400 600 800 1000
0
2
4
6
8
10
Absolute Pressure (mbar)
H2 A
dso
rptio
n (
mm
ol/g
)

irradiation (Figure S15). Recyclability tests were also performed. As shown in Figure 2f, after 5 cycles
the photoactivity decreased by 9%, which may be due to the formation of surface products or mild
degradation of the polymer. We also probed the structural and chemical stability of HCP-3 by collecting
N2 sorption isotherms and XPS and FTIR spectra before and after UV-vis irradiation. Elemental
composition, porosity and chemical bonds were maintained without significant alteration, with the
exception of a change in the shape of the N2 isotherm (Figure S3, S16 and Table S2). To verify the
evolution of CO from CO2 conversion over HCPs photocatalysts, we conducted a series of control
experiments, i.e.: in an inert atmosphere (N2/H2 or N2/H2O); without catalyst; without light; isotopic
labelling of 13CO2 (control experiments details are outlined in Table S4). In the absence of CO2, the
activity decreased by 77% to 88% depending on the atmosphere (N2/H2O vs N2/H2). We attribute the
trace CO detected under inert atmosphere arises from the degradation of the residual oxygen-containing
functional groups of the HCP crosslinkers. To verify the photocatalytic production of CO from CO2, we
conducted isotopic labelled 13CO2 tests using H2O as a sacrificial agent under UV-visible light irradiation.
We observe a 13CO peak (m/z= 29) after light irradiation, confirming the ability of HCPs to photoconvert
CO2 to CO (Figure S17).
Conclusion
We report hypercrosslinked polymers for the first time as a photocatalytic platform for CO2
photoreduction under both UV-vis and visible light irradiation. HCPs show promising photocatalytic
activity using only sacrificial H2O, without the requirement of any co-catalyst or photosensitiser,
significantly outperforming the benchmark material TiO2 P25 under visible light illumination. This was
rationalised by new insights into the concentration of sacrificial agents at the surface of HCPs via
selective adsorption, as networks showed significantly higher H2O adsorption capacity in comparison to
negligible H2 adsorption. The performance disparity between these reducing agents outlines a key
consideration when producing photocatalysts for yield efficient solar‐energy conversion. Their lack of
requirement for precious-metal catalysts, as well as their simple engineering, good general stabilities
and low costs, make HCPs an exciting and promising platform for the design of organic photocatalysts.

Acknowledgements
The authors thank Sophie Neumayer and Lukas Brandfellner for performing ICP analysis. The authors
also acknowledge the Engineering and Physical Sciences Research Council (EPSRC) for funding
through the CDT in Advanced Characterisation of Materials EP/L015277/1 (G. M. S. and C. P.). M.S.
thanks EPSRC for a Doctoral Prize Fellowship.
Supporting information for this article is given via a link at the end of the document.
References
[1] M. Bui, C. S. Adjiman, A. Bardow, E. J. Anthony, A. Boston, S. Brown, P. S. Fennell, S. Fuss, A.
Galindo, L. A. Hackett, J. P. Hallett, H. J. Herzog, G. Jackson, J. Kemper, S. Krevor, G. C.
Maitland, M. Matuszewski, I. S. Metcalfe, C. Petit, G. Puxty, J. Reimer, D. M. Reiner, E. S. Rubin,
S. A. Scott, N. Shah, B. Smit, J. P. M. Trusler, P. Webley, J. Wilcox, N. Mac Dowell, Energ.
Environ. Sci. 2018, 11, 1062-1176.
[2] E. V. Kondratenko, G. Mul, J. Baltrusaitis, G. O. Larrazabal, J. Perez-Ramirez, Energ. Environ.
Sci. 2013, 6, 3112-3135.
[3] J. H. Montoya, L. C. Seitz, P. Chakthranont, A. Vojvodic, T. F. Jaramillo, J. K. Norskov, Nat.
Mater. 2017, 16, 70-81.
[4] Z. Xiong, Z. Lei, Z. W. Xu, X. X. Chen, B. G. Gong, Y. C. Zhao, H. B. Zhao, J. Y. Zhang, C. G.
Zheng, J. Co2 Util. 2017, 18, 53-61.
[5] Y. H. Yang, F. Q. Zhan, H. Li, W. H. Liu, S. Yu, J. Solid State Electr. 2017, 21, 2231-2240.
[6] M. Reli, M. Kobielusz, L. Matejova, S. Danis, W. Macyk, L. Obalova, P. Kustrowski, A. Rokicinska,
K. Koci, Appl. Surf. Sci. 2017, 391, 282-287.
[7] K. Koci, P. Praus, M. Edelmannova, N. Ambrozova, I. Troppova, D. Fridrichova, G. Slowik, J.
Ryczkowski, J. Nanosci. Nanotechno. 2017, 17, 4041-4047.
[8] S. H. Luo, Z. T. Zeng, G. M. Zeng, Z. F. Liu, R. Xiao, P. Xu, H. Wang, D. L. Huang, Y. Liu, B. B.
Shao, Q. H. Liang, D. B. Wang, Q. Y. He, L. Qin, Y. K. Fu, J. Mater. Chem. A. 2020, 8, 6434-
6470.
[9] C. Xu, W. J. Zhang, J. T. Tang, C. Y. Pan, G. P. Yu, Front Chem 2018, 6.
[10] J. D. Xiao, H. L. Jiang, Acc. Chem. Res. 2019, 52, 356-366.
[11] T. X. Wang, H. P. Liang, D. A. Anito, X. S. Ding, B. H. Han, J. Mater. Chem. A. 2020, 8, 7003-
7034.

[12] Z. W. Fu, X. Y. Wang, A. Gardner, X. Wang, S. Y. Chong, G. Neri, A. J. Cowan, L. J. Liu, X. B.
Li, A. Vogel, R. Clowes, M. Bilton, L. J. Chen, R. S. Sprick, A. I. Cooper, Chem. Sci. 2020, 11,
543-550.
[13] C. Yang, W. Huang, L. C. da Silva, K. A. I. Zhang, X. C. Wang, Chem-Eur J. 2018, 24, 17454-
17458.
[14] X. X. Yu, Z. Z. Yang, B. Qiu, S. E. Guo, P. Yang, B. Yu, H. Y. Zhang, Y. F. Zhao, X. Z. Yang, B.
X. Han, Z. M. Liu, Angew. Chem. Int. Edit. 2019, 58, 632-636.
[15] K. Lei, D. Wang, L. Q. Ye, M. P. Kou, Y. Deng, Z. Y. Ma, L. Wang, Y. Kong, ChemSusChem
2020, 13, 1725-1729.
[16] B. Y. Li, R. N. Gong, W. Wang, X. Huang, W. Zhang, H. M. Li, C. X. Hu, B. E. Tan,
Macromolecules 2011, 44, 2410-2414.
[17] R. T. Woodward, Chem Comm 2020, 56, 4938-4941.
[18] R. T. Woodward, L. A. Stevens, R. Dawson, M. Vijayaraghavan, T. Hasell, I. P. Silverwood, A. V.
Ewing, T. Ratvijitvech, J. D. Exley, S. Y. Chong, F. Blanc, D. J. Adams, S. G. Kazarian, C. E.
Snape, T. C. Drage, A. I. Cooper, J. Am. Chem. Soc. 2014, 136, 9028-9035.
[19] R. T. Woodward, M. Kessler, S. Lima, R. Rinaldi, Green Chem. 2018, 20, 2374-2381.
[20] K. Schute, M. Rose, ChemSusChem 2015, 8, 3419-3423.
[21] X. Lu, S. Shi, G. Z. Zhu, L. Zhao, M. Wang, J. Gao, Z. T. Du, J. Xu, ChemistrySelect 2020, 5,
549-553.
[22] S. L. Wang, M. Xu, T. Y. Peng, C. X. Zhang, T. Li, I. Hussain, J. Y. Wang, B. E. Tan, Nat.
Commun. 2019, 10.
[23] B. Li, R. Gong, W. Wang, X. Huang, W. Zhang, H. Li, C. Hu, B. Tan, Macromolecules 2011, 44,
2410-2414.
[24] R. T. Woodward, Chem Commun (Camb) 2020.
[25] M. Thommes, K. Kaneko, A. V. Neimark, J. P. Olivier, F. Rodriguez-Reinoso, J. Rouquerol, K. S.
W. Sing, Pure Appl. Chem. 2015, 87, 1051-1069.
[26] R. Dawson, T. Ratvijitvech, M. Corker, A. Laybourn, Y. Z. Khimyak, A. I. Cooper, D. J. Adams,
Polymer Chemistry 2012, 3, 2034-2038.
[27] A. M. Varghese, G. N. Karanikolos, International Journal of Greenhouse Gas Control 2020, 96.
[28] K. Sumida, D. L. Rogow, J. A. Mason, T. M. McDonald, E. D. Bloch, Z. R. Herm, T. H. Bae, J. R.
Long, Chem Rev 2012, 112, 724-781.
[29] R. Dawson, L. A. Stevens, T. C. Drage, C. E. Snape, M. W. Smith, D. J. Adams, A. I. Cooper, J.
Am. Chem. Soc. 2012, 134, 10741-10744.
[30] J. Kosco, M. Sachs, R. Godin, M. Kirkus, L. Francas, M. Bidwell, M. Qureshi, D. Anjum, J. R.
Durrant, I. McCulloch, Advanced Energy Materials 2018, 8, 1802181.

[31] M. Sachs, H. Cha, J. Kosco, C. M. Aitchison, L. Francàs, S. Corby, C.-L. Chiang, A. Wilson, R.
Godin, A. Fahey-Williams, A. Cooper, S. Sprick, I. McCulloch, J. R. Durrant, J. Am. Chem. Soc.
2020. doi.org/10.1021/jacs.0c06104
[32] H. M. Lee, I. S. Youn, M. Saleh, J. W. Lee, K. S. Kim, Phys Chem Chem Phys 2015, 17, 10925-
10933.
[33] W. Che, W. R. Cheng, T. Yao, F. M. Tang, W. Liu, H. Su, Y. Y. Huang, Q. H. Liu, J. K. Liu, F. C.
Hu, Z. Y. Pan, Z. H. Sun, S. Q. Wei, J. Am. Chem. Soc. 2017, 139, 3021-3026.
[34] H. Zhong, Z. X. Hong, C. Yang, L. Y. Li, Y. S. Xu, X. C. Wang, R. H. Wang, ChemSusChem
2019, 12, 4493-4499.
[35] D. C. Sorescu, J. Lee, W. A. Al-Saidi, K. D. Jordan, J. Chem. Phys. 2012, 137.
[36] Z. Y. Gao, Y. Ding, J Mol Model 2017, 23.
[37] H. Li, C. Rameshan, A. V. Bukhtiyarov, I. P. Prosvirin, V. I. Bukhtiyarov, G. Rupprechter, Surf.
Sci. 2019, 679, 139-146.
[38] C. C. Lo, C. H. Hung, C. S. Yuan, J. F. Wu, Sol Energ Mat Sol C 2007, 91, 1765-1774.
[39] X. X. Chang, T. Wang, J. L. Gong, Energ. Environ. Sci. 2016, 9, 2177-2196.
[40] M. T. Nayakasinghe, Y. L. Han, N. Sivapragasam, D. S. Kilin, U. Burghaus, Chem Comm 2018,
54, 9949-9952.


download fileview on ChemRxivHCP_CO2_250820_CP.pdf (551.49 KiB)
Supporting Information
Hypercrosslinked polymers as a photocatalytic platform for visible-
light-driven CO2 photoreduction using H2O
Giulia E. M. Schukraft,a Robert T. Woodward,a,b* Santosh Kumar,c Michael Sachs,d Salvador
Eslava,c Camille Petita*
[a] G. E. M. Schukraft, Dr R. T.Woodward, Dr. Camille Petit
Barrer Centre
Department of Chemical Engineering, South Kensington Campus
Imperial College London, London, SW7 2AZ
E-mail: [email protected]
[b] Dr. R. T. Woodward (current address)
Institute of Materials Chemistry and Research, Faculty of Chemistry
University of Vienna, Währinger Straße 42,
1090 Vienna, Austria
E-mail: [email protected]
[c] Dr. S. Kumar, Dr. S. Eslava
Department of Chemical Engineering
Imperial College London, London, SW7 2AZ
[d] Dr. M. Sachs
Department of Chemistry, White City Campus
Imperial College London, London, W12 0BZ.

S1
Table of Contents
1. Experimental Section ..................................................................................................... S2
2. Characterisation ............................................................................................................. S3
3. Supplementary figures and tables ................................................................................ S9
4. References ..................................................................................................................... S34
S2
1. Experimental Section
Materials
TiO2 P25 (>99.5%, 21 nm primary particle size), benzene, dimethoxymethane, 2,4-diamino-6-
phenyl-1,3,5-triazine, aniline, 1,2-dichloroethane, N,N-dimethylformamide and iron(III)
chloride were all purchased from Sigma-Aldrich. 4,4'-bis(methoxymethyl)biphenyl was
purchased from Tokyo Chemical Industry (TCI) UK and methanol (reagent grade) was
purchased from VWR. All reagents were used as received. All gases were purchased from
BOC.
Hypercrosslinked Polymer Synthesis
HCP-1: Anhydrous 1,2-dichloroethane (20 mL) was added to benzene (0.78 g, 10 mmol) and
dimethoxymethane (2.28 g, 30 mmol) under N2, before the solution was purged with N2 for at
least a further 30 minutes. After purging, iron(III) chloride (4.87 g, 30 mmol) was quickly
added to the solution and the mixture was heated to 80 °C for a further 24 h, during which the
reaction was kept under an inert atmosphere. The resulting solid was allowed to cool before it
was filtrated using a Buchner funnel and washed with methanol until the filtrate was almost
colourless. The polymer was then further washed by Soxhlet extraction in methanol for 24 h.
Finally, the polymer was dried in a vacuum oven overnight at 70 °C.
HCP-2: The overall procedure remained the same as HCP-1 with 1,2-dichloroethane (20 mL)
added to aniline (0.28 g, 3 mmol) and 4,4'-bis(methoxymethyl)biphenyl (1.45 g, 6 mmol)
before iron(III) chloride (0.98 g, 6 mmol) was added.
HCP-3: Again, the overall procedure remained the same as HCP-1 with 1,2-dichloroethane
(20 mL) added to 2,4-diamino-6-phenyl-1,3,5-triazine (0.37 g, 2 mmol) and 4,4'-

S3
bis(methoxymethyl)biphenyl (0.97 g, 4 mmol) before iron(III) chloride (0.65 g, 4 mmol) was
added. After synthesis, a step was added in which HCP-3 was washed in chloroform by Soxhlet
extraction, to ensure the removal of any unreacted 2,4-diamino-6-phenyl-1,3,5-triazine. Yields
for HCP-1, HCP-2 and HCP-3 were 84 %, 66 % and 91%, respectively, based on hypothetical
100% polycondensation.
2. Characterisation
Chemical and structural properties
Fourier-transform infrared (FTIR) spectroscopy was performed in the range of 500 – 4000 cm-
1 on finely ground samples using a PerkinElmer Spectrum 100 FT-IR spectrometer equipped
with an attenuated total reflectance (ATR) accessory.
Thermal analyses were performed using a Netzsch TG209 F1 Libra thermogravimetric
analyser. At least 10 mg of sample was heated from room temperature to 900 °C at a rate of 10
°C min−1 under either air or N2 gas flow (flow rate 100 mL min−1). An initial isothermal step
of 1 h was included at 120 °C to ensure removal of adsorbates before heating continued.
X-ray photoelectron spectroscopy (XPS) measurements were carried out on a Thermo
Scientific K-Alpha+ X-ray photoelectron spectrometer equipped with a MXR3 Al Kα
monochromated X-ray source (hν = 1486.6 eV). Samples were ground and mounted on the
XPS holder using a conductive carbon tape. The X-ray gun power was set to 72 W (6 mA and
12 kV). Survey scans were acquired using 200 eV pass energy, 0.5 eV step size, and 100 ms
(50 ms x 2 scans) dwell times. Data analysis was performed using the Thermo Avantage data
analysis program.
S4
Nitrogen isotherms were measured using a porosity analyser (Micromeritics 3Flex) at -196 oC.
Prior to measurement, all samples were degassed overnight at 393 K at around 0.2 mbar
pressure. Samples underwent a further degas step at 393 K in-situ on the porosity analyser for
4 h, this time at around 0.003 mbar. Surface areas were calculated using the
Brunauer−Emmett−Teller (BET) method.[1] The total volume of pores (VTOT) was calculated
from the volume of N2 adsorbed at P/P0 = 0.97 and micropore volume (VMICRO) was determined
using the Dubinin−Astakhov method.[2] The pore size distribution was derived from the
adsorption isotherms by using an built-in software from Micromeritics and selecting the DFT
model for carbon slit shape pores (N2@77 on Carbon Slit Pores by NLDFT).
Powder X-ray diffraction (PXRD) measurements were recorded at room temperature on a
BRUKER 2D PHASE diffractometer operating at 30 kV and 10 mA with monochromatised
Cu Kα radiation (λ = 0.15418 nm).
The morphology of the samples was imaged using a scanning electron microscope (SEM, Leo
Gemini 1525, Zeiss) in secondary electron mode (InLens detector) at 5 kV. The samples were
ground, deposited on carbon tape, and coated with 20 nm of chromium to reduce charging.
For determination of Iron content in HCP-2, samples were first digested (~5 mg sample) using
4 mL conc. nitric acid (4 mL) and H2O2 (200 µL) using an open vessel graphite digestion
system (Labter, ODLAB; Distributor: AHF Analysentechnik AG; Germany). Samples were
twice heated to 150 °C and held at the target temperature for 1 h before cooling to 50 °C,
however this was not sufficient for sample digestion. Samples were then twice heated to 200
°C and held for 45 h before again cooling to 50 °C. After digestion the sample was diluted in
ultrapure water (18.2 MΩ cm, Milli-Q Advantage, Darmstadt, Germany). Digested samples
were analysed using an ICP-MS (an Agilent 7800, Agilent Technologies, Tokyo, Japan)
equipped with an Agilent SPS 4 autosampler (Agilent Technologies, Tokyo, Japan) and a

S5
MicroMist nebulizer at a sample uptake rate of approx. 0.2 ml/min. The Agilent MassHunter
software package (Workstation Software, Version C.01.04, 2018) was used for data evaluation.
The instrumental parameters for the ICP-MS are summarized in Table S1. A representation
sample of HCP-2 was found to contain 246 ppm of Fe, however under the above describe
conditions digestion of HCP-1 and HCP-3 was unsuccessful.
Table S1: Instrumental parameters for the ICP-MS measurements
RF power 1550 W
Sampling depth 8 mm
Nebulizer MicroMist
Spray chamber Scott double-pass
Spraying chamber temp. 2°C
Monitored Isotopes 56Fe, 57Fe, 115In, 185Re,
Measurement mode He, 5 L min-1
Plasma gas 15 L min-1
Nebulizer gas 1.09 L min-1
Auxiliary gas 0.90 L min-1
Cones Ni
Integration time 0.3 s
Optoelectronic properties
Valence band X-ray photoelectron spectroscopy (XPS) and work function measurements were
carried out on a Thermo Scientific K-Alpha+ X-ray photoelectron spectrometer equipped with
a MXR3 Al Kα monochromated X-ray source (hν = 1486.6 eV). Samples were ground and
mounted on the XPS holder using a conductive carbon tape. The X-ray gun power was set to
72 W (6 mA and 12 kV). Valence band spectra were obtained using 15 eV pass energy and
0.05 eV step size. Data analysis was performed using the software Thermo Avantage. The work
functions of the polymers were determined by measuring the secondary electron cut-off in the
low kinetic energy region. The sample holder contained a clean gold standard sample, which
was used as a reference material to ensure correct calibration. A sample bias of -29.47 V was
S6
applied to the samples using an ion gun and the cut-off spectra were obtained using a pass
energy of 10 eV. To account for potential variations across the surface of the material, the work
function was measured at three different locations and the average was taken. To convert the
valence band position and the work function to the absolute energy scale vs. vacuum with the
redox potential scale vs. SHE, a factor of 4.44 was required, as 4.44 eV on the former
corresponds to 0.00 V on the latter, at 25 °C.
Diffuse reflectance ultraviolet-visible (DR-UV-Vis) spectra were obtained using a Perkin-
Elmer Spectrum 100 Spectrometer equipped with an integrating sphere. Spectral band width
was set to 2 nm, with Spectralon as a standard.
Time-correlated single photon counting (TCSPC) experiments were carried out using a
commercial TCSPC setup (Horiba DeltaFlex) equipped with a pulsed LED excitation source
(Horiba NanoLED series) and a fast rise-time photomultiplier detector (Horiba PPD-650 and
PPD-900). The instrument response function (IRF) was measured at the wavelength of the
excitation source (282 nm). During all other measurements, a suitable long pass filter was
inserted between sample and detector to block off scattered excitation light.
Gas and water sorption
Water vapor, CO2 and H2 adsorption isotherms were collected at 25 °C using a Micromeritics
3Flex instrument, equipped with a liquid container in the case of H2O. HCPs were degassed
overnight at 120 oC at around 0.2 mbar pressure and again in-situ on the porosity analyser
(Micromeritics 3Flex) for 4 h down to around 0.003 mbar. Research grade (99.999%) CO2 and
H2 (99.9995%, Peak Scientific PH200 hydrogen generator) were used for CO2 and H2
isotherms. For H2O isotherms, miliQ water with a resistance > 18.2 micro-ohms was purified
by 4 freeze pump thraw cycles. Water isotherms were collected up to a relative pressure of 0.8

S7
to avoid condensation. For “wet” CO2 uptake, i.e. investigating CO2 uptake on HCPs pre-
exposed to H2O, HCPs were exposed to humid air (>99 % humidity) by placing HCPs in a
sealed vessel containing liquid water and a hygrometer for at least 48 hours at room
temperature. HCPs were not in contact with the liquid water during this process. After removal,
CO2 adsorption isotherms were performed at 25 °C up to 1 bar, skipping all prior degas steps.
The first pressure CO2 adsorption point was collected at around 10 mbar (~2 orders of
magnitude higher than a standard ‘dry’ measurement) to minimise water desorption. Resulting
isotherms for wet polymers gave negative adsorption values at low absolute pressures due to
some water desorption in the initial stages of measurement. Therefore, to allow comparison to
dry samples, a factor was applied to the isotherm, raising the lowest absolute pressure
measurement to 0 mmol/g adsorbed CO2. It is worth noting that some subsequent uptake may
be due to re-adsorption of desorbed water.
Photocatalytic properties
A gas/solid photoreactor was assembled to conduct CO2 photocatalytic measurements (Figure
S13). Tests were conducted at ambient temperature. The photocatalysts were deposited on a
stainless-steel plate with a fixed area of 9.6 cm2. To do so, 10-15 mg of the ground photocatalyst
was dispersed in DI water (1.2 mL), sonicated for 30 seconds and drop cast onto the sample
holder. Research grade (99.999%) CO2 and H2 (99.9995%, Peak Scientific PH200 hydrogen
generator) were flowed at controlled rates using mass flow controllers (Omega Engineering,
0–50 mL min-1). For experiments using H2 as sacrificial agent, the photoreactor (35 cm3) was
vacuumed and replenished with a gas mixture of CO2 and H2 (1.5 vol/vol ratio) six times. The
same gas mixture of CO2 and H2 was subsequently passed over the catalyst bed in the
photoreactor for 15 residence times before it was sealed at 1.25 bar and irradiated for 3 h. For
experiments using water as sacrificial agent, H2O vapour was generated from a saturator at

S8
room temperature (25°C), unless stated otherwise, providing a gas mixture of CO2 and H2O
(1.4 wt% H2O). The photoreactor was vacuumed and replenished with a gas mixture of CO2
and H2O at least six times prior to measurement. A xenon arc lamp (300 W, λ > 325 nm, LOT
Quantum Design) equipped with a water filter was used as the irradiation source. The distance
from the lamp to the sample was 9.5 cm with a broadband irradiance at the sample surface of
1830 W.m-2. For visible light measurements a long pass UV filter (λ < 400 nm) (LOT Quantum
Design) was used.
Evolved gases were analysed by a gas chromatograph mass spectrometer (GC-MS) with gas
sampling valves connected directly to the photoreactor. The GC (Agilent Technologies, 7890B)
was equipped with HayeSep (Agilent J&W 6 foot, 1/8 inch, 2mm, HayeSep Q Column 80/100
SST) and molecular sieve (Agilent J&W 6 foot, 1/8 inch, 2 mm, MolSieve 5A, 60/80,
preconditioned) packed columns in series, a thermal conductivity detector (TCD) and a flame
ionisation detector (FID). The MS was equipped with a GS-GASPRO capillary column
(Agilent J&W HP-5ms GC Column, 30 m, 0.25 mm, 0.25 μm). For recyclability tests, the
aforementioned process was repeated after each 3 h irradiation cycle without opening the
photoreactor. In addition, isotopic tracing experiments were performed with 13CO2 (BOC,
>98% atom 13CO2 compared to 12CO2, >99%). The photocatalytic CO2 reduction tests were
repeated 3 times for each material under the same reaction conditions.

S9
3. Supplementary Figures and Tables
Figure S1. Photographic images of: HCP-1, HCP-2 and HCP-3 (from left to right,
respectively).
HCP-1 HCP-3 HCP-2

S10
Figure S2. FTIR spectra of HCP-1 (blue), HCP-2 (green) and HCP-3 (red). Signals present in
all spectra are highlighted by dashed lines.
N-H
1000200030004000
Tra
nsm
itta
nce
/ A
.U.
Wavenumber /cm-1
N-H
C-N
C-H
N-H
C-N
(triazine ring)
N-H
C-O
C-C (aromatic)
HCP-1
HCP-2
HCP-3

S11
Figure S3. X-ray photoelectron spectroscopy survey spectra of: a) HCP-1, b) HCP-2, c)
HCP-3, and d) HCP-3 after 3 h of UV-vis light irradiation.

S12
Table S2. Atomic composition of HCP-1, HCP-2, HCP-3 and HCP-3 after irradiation,
determined using XPS survey spectra. The Fe content of HCP-2 determined using ICP-MS is
also included.
Atomic % of O Atomic % of N Atomic % of C Fe content (ppm)
HCP-1 4.5 - 95.5 -
HCP-2 4.2 1.3 94.5 246
HCP-3 4.5 7.9 87.6 -
HCP-3 after irradiation 4.7 8.3 87.0 -

S13
Figure S4. SEM images of a) HCP-1, b) HCP-2, and c) HCP-3.

S14
Figure S5. TGA thermograms up to 900 °C in a N2 atmosphere, heated at a ramp rate of 10
°C/min with a N2 flow rate of 100 mL/min. a) HCP-1, b) HCP-2, and c) HCP-3.
200 400 600 800
0
20
40
60
80
100
We
igh
t / %
Temperature / C
200 400 600 800
0
20
40
60
80
100
We
igh
t / %
Temperature / C
200 400 600 800
0
20
40
60
80
100W
eig
ht / %
Temperature / C
200 400 600 800
0
20
40
60
80
100
We
igh
t / %
Temperature / C
HCP-3 in N2HCP-1 in N2 HCP-2 in N2
a) b) c)
200 400 600 800
0
20
40
60
80
100
We
igh
t / %
Temperature / C
200 400 600 800
0
20
40
60
80
100
We
igh
t / %
Temperature / C
200 400 600 800
0
20
40
60
80
100W
eig
ht / %
Temperature / C
200 400 600 800
0
20
40
60
80
100
We
igh
t / %
Temperature / C
HCP-3 in N2HCP-1 in N2 HCP-2 in N2
a) b) c)
200 400 600 800
0
20
40
60
80
100
We
igh
t / %
Temperature / C
200 400 600 800
0
20
40
60
80
100
We
igh
t / %
Temperature / C
200 400 600 800
0
20
40
60
80
100
We
igh
t / %
Temperature / C
200 400 600 800
0
20
40
60
80
100
We
igh
t / %
Temperature / C
HCP-3 in N2HCP-1 in N2 HCP-2 in N2
a) b) c)

S15
Figure S6. TGA thermograms up to 900 °C in air, heated at a ramp rate of 10 °C/min with an
air flow rate of 100 mL/min. a) HCP-1, b) HCP-2, and c) HCP-3.

S16
Figure S7. PXRD patterns of a) HCP-1, b) HCP-2, and c) HCP-3.

S17
Figure S8. CO2 adsorption isotherms at 298 K of both dry and wet (i.e. exposed to humid air
for at least 48 h before measurement, 99% humidity) networks. a) HCP-1, b) HCP-2, and c)
HCP-3. Filled symbols represent adsorption, empty symbols represent desorption.
0 200 400 600 800 1000
0.0
0.2
0.4
0.6
0.8
CO
2 A
dso
rbe
d / m
mo
l/g
Absolute Pressure / mbar
HCP-2 (dry)
0 200 400 600 800 1000
0.0
0.2
0.4
0.6
0.8
CO
2 A
dso
rbe
d / m
mo
l/g
Absolute Pressure / mbar
HCP-2 (wet)
0 200 400 600 800 1000
0.0
0.2
0.4
0.6
0.8
1.0
1.2
CO
2 A
dso
rbe
d / m
mo
l/g
Absolute Pressure / mbar0 200 400 600 800 1000
0.0
0.2
0.4
0.6
0.8
1.0
1.2
CO
2 A
dso
rbe
d / m
mo
l/g
Absolute Pressure / mbar
HCP-1 (dry)
HCP-1 (wet)
0 200 400 600 800 1000
0.0
0.2
0.4
0.6
0.8
1.0
CO
2 A
dso
rbe
d / m
mo
l/g
Absolute Pressure / mbar
0 200 400 600 800 1000
0.0
0.2
0.4
0.6
0.8
1.0
CO
2 A
dso
rbe
d / m
mo
l/g
Absolute Pressure / mbar
HCP-3 (dry)
HCP-3 (wet)
a) b)
c)
S18
Table S3. Textural parameters derived from N2 sorption isotherms at –196 oC and CO2
adsorption capacities at 25 oC.
Sample VMICRO (cm3/g)a VTOT (cm3/g)a SABET (m2/g)a CO2 ad. (mmol/g)
Dryb Wetc
HCP-1 0.46 1.07 950 1.25 0.99
HCP-2 0.13 0.21 310 0.78 0.82
HCP-3 0.16 0.25 360 0.92 0.89
HCP-3 after
irradiation 0.11 - 300 - -
aDerived from N2 sorption isotherms at – 196 oC . bCapacity of degassed HCP at 25 oC and 1 bar cCapacity of non-degassed HCP at 25 oC and 1 bar after 48 h exposure to humid atmosphere
S19
Figure S9. Photoluminescence emission spectra
S20
Figure S10. Valence band XPS spectra of a) HCP-1, b) HCP-2, and HCP-3.

S21
Figure S11. Work function measurements at three different locations on a) HCP-2, b) HCP-3,
and c) HCP-1 to account for potential variations across the surface.
S22
Figure S12. Xenon arc lamp emission spectra, (300W, LOT Quantum Design), equipped
with a water filter.

S23
Figure S13. Photocatalytic gas-solid reactor setup used to evaluate photocatalytic CO2
reduction: 1) CO2 cylinder, 2) H2 generator, 3) mass flow controllers, 4) non-return valves,
5) H2O saturator, 6) photoreactor, 7) Xe arc lamp, 8) pressure transducer, 9) gas
chromatograph, 10) vacuum pump.[3]

S24
Table S4. Photocatalytic evolution rates of HCP-1, HCP-2, HCP-3, and TiO2 P25 and control
experiments
Sample UV-vis (Sacrificial H2) UV-vis (Sacrificial H2O) Visible (Sacrificial H2O)
CO* CH4* CO* CH4
* CO* CH4*
HCP-1 3.7 ± 0.1 0 8.6 ± 0.1 0.4 ± 0.1 4.2 0.1
HCP-2 1.6 ± 0.3 0.1 ± 0.1 4.6 ± 0.5 0.4 ± 0.2 1 0
HCP-3 6.3 ± 0.2 0.5 ± 0.1 15.6 ± 0.9 0.4 ± 0.1 5.2 0.1
P25 (TiO2) 6.4 ± 0.4 0.3 ± 0.2 14.7 ± 0.9 0.3 ± 0.1 0.69 0.2
N2/H2O, no
catalyst - - 0 - - -
N2/H2O a - - 3.58 (23% c) - - -
N2/H2O
repeat a,b - - 3.78 (24% c) - - -
N2/H2O a - - - - 0.82 (15% c)
-
N2/H2O
repeat a,b - - - - 1.06 (20% c) -
N2/H2 a 0.74 (12% c) - - - - -
N2/H2
repeat a,b 0.61 (10% c) - - - - -
CO2/ H2O, no
light a - - 0.16 (1% c) - - -
CO2/ H2O, no
catalyst - - 10 ppm - - -
* All data are given in μmol.g-1.h-1
a tests were performed on HCP-3, the leading material of this study b repeat samples were done on the same sample as the first one, without opening the photo-reactor
c percentage compared to the total activity of HCP-3
S25
Apparent quantum yield (AQY) calculations
The apparent quantum yield at a given wavelength 𝜆 is defined as:
𝐴𝑄𝑌 = 𝑁𝑒
𝑁𝑝=
𝑛𝑜.𝑜𝑓 𝑟𝑒𝑎𝑐𝑡𝑒𝑑 𝑒𝑙𝑒𝑐𝑡𝑟𝑜𝑛𝑠
𝑛𝑜.𝑜𝑓 𝑎𝑏𝑠𝑜𝑟𝑏𝑒𝑑 𝑝ℎ𝑜𝑡𝑜𝑛𝑠 𝑥100 (Equation S1)
Based on the stoichiometry of the CO evolution redox reaction:
𝐴𝑄𝑌 = 2𝑁𝐶𝑂
𝑁𝑝=
(2)(𝑛𝑜.𝑜𝑓 𝑒𝑣𝑜𝑙𝑣𝑒𝑑 𝐶𝑂 𝑚𝑜𝑙𝑒𝑐𝑢𝑙𝑒𝑠)
𝑛𝑜.𝑜𝑓 𝑎𝑏𝑠𝑜𝑟𝑏𝑒𝑑 𝑝ℎ𝑜𝑡𝑜𝑛𝑠 𝑥100 (Equation S2)
For a polychromatic light source, we must consider the total number of absorbed photons across
the wavelength range (270 – 900 nm for UV-vis and 400 – 900 nm for visible irradiation) and
the corresponding total moles of CO evolved during the irradiation time:
𝐴𝑄𝑌 = 2𝑁𝐶𝑂 (𝑡𝑜𝑡𝑎𝑙)
𝑁𝑝=
(2)( 𝑡𝑜𝑡𝑎𝑙 𝑛𝑜.𝑜𝑓 𝑒𝑣𝑜𝑙𝑣𝑒𝑑 𝐶𝑂 𝑚𝑜𝑙𝑒𝑐𝑢𝑙𝑒𝑠)
𝑛𝑜.𝑜𝑓 𝑎𝑏𝑠𝑜𝑟𝑏𝑒𝑑 𝑝ℎ𝑜𝑡𝑜𝑛𝑠 x100 (Equation S3)
The number of photons absorbed by the photocatalyst at a given wavelength 𝜆 is given by:
𝑁𝑃,𝑎𝑏𝑠𝑜𝑟𝑏𝑒𝑑 = (𝑃𝑎𝑏𝑠)(λ)(𝑡)
(ℎ𝑐) (Equation S4)
where 𝜆 denotes the wavelength, 𝑃 denotes the power of the irradiation source, 𝑡 denotes the
irradiation time, h denotes Planck’s constant and 𝑐 the speed of light.
Equation S4 can be written in terms of the intensity of the irradiation as a function of the
irradiation absorbed at wavelength λ, [𝐼𝑎𝑏𝑠(λ)], and irradiation area (S) as:
𝑁𝑃,𝑎𝑏𝑠𝑜𝑟𝑏𝑒𝑑 = [𝐼𝑎𝑏𝑠(λ)](𝑆)(λ)(𝑡)
(ℎ𝑐) (Equation S5)
To account for the number of photons absorbed by the photocatalyst at a given wavelength 𝜆,
we need to consider the absorbance (A𝑏𝑠) of the material at that wavelength and apply the
Beer-Lambert law:

S26
𝐴𝑏𝑠(λ) = −𝑙𝑜𝑔 [𝐼𝐹(λ)
𝐼𝐼(λ)] (Equation S6)
where 𝐼𝐼(λ) denotes the intensity emitted from the irradiation source at a given wavelength 𝜆
and 𝐼𝐹(λ) denotes the intensity after passing through the photocatalyst at the same wavelength
𝜆.
The intensity of irradiation absorbed by the photocatalyst at a given wavelength 𝜆 is given by:
𝐼𝑎𝑏𝑠(λ) = 𝐼𝐼(λ) − 𝐼𝐹(λ) (Equation S7)
which, using equation (S6), can be written as:
𝐼𝑎𝑏𝑠(λ) = 𝐼𝐼(λ) − 𝐼𝐼(λ)10−𝐴𝑏𝑠(λ) = 𝐼𝐼(λ)[1 − 10−𝐴𝑏𝑠(λ)] (Equation S8)
Substituting equation (S8) into equation (S5) gives
𝑁𝑃,𝑎𝑏𝑠𝑜𝑟𝑏𝑒𝑑 = 𝐼𝐼(λ)[1−10−𝐴𝑏𝑠(λ)](𝑆)(λ)(𝑡)
(ℎ𝑐) (Equation S9)
The total number of photons absorbed by the photocatalyst across the entire wavelength range
of the irradiation source is then given by:
𝑁𝑃,𝑎𝑏𝑠𝑜𝑟𝑏𝑒𝑑 (𝑡𝑜𝑡𝑎𝑙) = ∑𝐼𝐼(λ)[1−10−𝐴𝑏𝑠(λ)](𝑆)(λ)(𝑡)
(ℎ𝑐)
λ𝑒𝑛𝑑λ𝑠𝑡𝑎𝑟𝑡
(Equation S10)
𝑁𝑃,𝑎𝑏𝑠𝑜𝑟𝑏𝑒𝑑 (𝑡𝑜𝑡𝑎𝑙) = (𝑆)(𝑡)
(ℎ𝑐)∑ 𝐼𝐼(λ)[1 − 10−𝐴𝑏𝑠(λ)](λ)
λ𝑒𝑛𝑑λ𝑠𝑡𝑎𝑟𝑡
(Equation S11)
The total number of evolved CO molecules during a given reaction cycle can be written as
𝑁𝐶𝑂(𝑡𝑜𝑡𝑎𝑙) = (𝑁𝑎)(𝑛𝐶𝑂,𝑡𝑜𝑡𝑎𝑙) (Equation S12)

S27
where 𝑁𝑎 denotes Avagadro’s constant and 𝑛𝐶𝑂,𝑡𝑜𝑡𝑎𝑙 denotes the total moles of CO evolved
during the irradiation time.
Substituting equations (S11) and (S12) to (S3) gives us the final expression for the apparent
quantum yield for CO evolution:
𝐴𝑄𝑌 = (2) 𝑁𝐶𝑂 (𝑡𝑜𝑡𝑎𝑙)
𝑁P=
(2)(𝑁𝑎)(𝑛𝐶𝑂,𝑡𝑜𝑡𝑎𝑙)(𝑆)(𝑡)
(ℎ𝑐)∑ 𝐼𝐼(λ)[1−10−𝑎𝑏𝑠(λ)]
λ𝑒𝑛𝑑λ𝑠𝑡𝑎𝑟𝑡
(λ) x100 (Equation S13)

S28
Table S5. Apparent quantum yield calculation of HCP-3
Sample UV-vis irradiation
(sacrificial H2O)
Visible irradiation
(sacrificial H2O)
HCP-3 0.002 % 0.0005 %
*The apparent quantum yield was calculated from a polychromatic light source. The total number of absorbed
photons across the wavelength range (270 – 900 nm for UV-Vis and 400 – 900 nm for visible irradiation) was
taken into consideration.

S29
Figure S14. CO production rates of HCP-3 under UV-vis irradiation using different water
vapour contents.

S30
Figure S15. Photocatalytic CO evolution from HCP-3 under UV-vis irradiation as a function
of time.

S31
Figure S16. a) FTIR and b) N2 adsorption isotherms at 77 K of HCP-3 before and after 3h
UV-vis irradiation.

S32
Figure S17. Isotopic 13CO2 measurements. Mass spectrum chromatogram of HCP-3 illustrating
the 13CO (m/z = 29) peak observed with the photocatalytic 13CO2 reduction system after a) 0
min and b) 4h UV-vis irradiation.

S33
Figure S18. H2 production rates of HCPs under UV-vis irradiation using H2O as sacrificial
agent.

S34
4. References
1. Brunauer, S.; Emmett, P. H.; Teller, E., Adsorption of gases in multimolecular layers. Journal of the American chemical society 1938, 60 (2), 309-319. 2. Chen, S.; Yang, R., Theoretical basis for the potential theory adsorption isotherms. The Dubinin-Radushkevich and Dubinin-Astakhov equations. Langmuir 1994, 10 (11), 4244-4249.

download fileview on ChemRxivESI_HCP_CO2_250820_CP.pdf (1.54 MiB)
Hypercrosslinked polymers as a photocatalytic platform for visible-
light-driven CO2 photoreduction using H2O
Giulia E. M. Schukraft,[a] Robert T. Woodward,[a,b] * Santosh Kumar,[c] Michael Sachs,[d] Salvador
Eslava,[c] Camille Petit[a] *
[a] G. E. M. Schukraft, Dr R. T.Woodward, Dr. Camille PetitBarrer CentreDepartment of Chemical Engineering, South Kensington CampusImperial College London, London, SW7 2AZE-mail: [email protected]
[b] Dr. R. T. Woodward (current address)Institute of Materials Chemistry and Research, Faculty of ChemistryUniversity of Vienna, Währinger Straße 42, 1090 Vienna, AustriaE-mail: [email protected]
[c] Dr. S. Kumar, Dr. S. EslavaDepartment of Chemical EngineeringImperial College London, London, SW7 2AZ
[d] Dr. M. SachsDepartment of Chemistry, White City CampusImperial College London, London, W12 0BZ
Abstract: The design of robust, high-performance photocatalysts is key for the success of solar
fuel production via CO2 conversion. Herein, we present hypercrosslinked polymer (HCP)
photocatalysts for the selective reduction of CO2 to CO, combining excellent CO2 sorption
capacities, good general stabilities, and low production costs. HCPs are active photocatalysts in
the visible light range, significantly out-performing the benchmark material, TiO2 P25, using only
sacrificial H2O. We hypothesise that superior H2O adsorption capacities led to concentration at
photoactive sites, improving photocatalytic conversion rates when compared to sacrificial H2.
These polymers are an intriguing set of organic photocatalysts, displaying no long-range order or
extended pi-conjugation. The as-synthesised networks are the sole photocatalytic component,
requiring no co-catalyst doping or photosensitiser, representing a highly versatile and exciting
platform for solar-energy conversion.
Keywords: Carbon dioxide photoreduction • Hypercrosslinked polymers • Photocatalysis • Porous
organic polymers • Solar fuels
Introduction
The ever-increasing global energy demand requires a significant overhaul of current production
processes if humanity is to address climate change. Carbon management and renewable energy
must play a key role in our energy outlook, challenging researchers to reshape our energy
portfolio. Research efforts are focused on the development of efficient carbon capture, utilisation,
and storage (CCUS) technologies, as well as the improvement of methods to harness renewable
energy.[1] The use of sunlight shows promise towards the building of a sustainable chemical
industry. Solar fuels are synthetic fuels produced via the conversion of solar energy into chemical
energy, namely H2 from H2O, and C1 and C1+ chemicals from CO2. This conversion can be done by
a variety of processes, including photochemical (often named artificial photosynthesis),
thermochemical, and electrochemical reactions. However, overcoming the high thermodynamic
and kinetic barriers to conversion is challenging, and so a catalyst is required to improve energy
efficiency and, ultimately, render these processes viable.[2-3]
Here, we focus on a photochemical route to solar fuel production, namely photocatalysis, whose
main advantage lies in the simplicity of its implementation. To date, ‘traditional’ semiconductors,
e.g. metal oxide/sulfides and transition metal complexes, such as TiO2, CdS, ZnO, WO3, Ru-, Re-
and Pd-based complexes have received much attention as photocatalysts, owing to their ability to
generate charge carriers under light irradiation.[4-7] However, a lack of structural versatility and
notoriously difficult to tune frontier energy levels in inorganic materials often limit their performance,
while the requirement of rare-earth metals presents significant sustainability issues. Moreover,
traditional semiconductors are often predominantly active at ultraviolet wavelengths, constituting
just ~4% of the solar spectrum, prompting great interest in the development of visible light-active
photocatalysts for improved efficiency.
The development of new classes of photoactive materials, including inorganic-organic hybrids,
such as metal-organic frameworks (MOFs), or organic-based materials, such as porous organic
polymers, have emerged as promising alternatives to traditional photocatalysts. [8-12] The structural
versatility of polymers enables photochemical tunability and, ultimately, optimisation of

photocatalytic performance. Owing to their general chemical inertness and non-metallic nature,
porous organic polymers are of particular interest in the design of new photocatalysts. Yang et al.
reported triazine-based conjugated microporous polymers (CMPs) for CO2 photoconversion to CO
using visible light.[13] The optical band gap of the materials was engineered by the inclusion of
various electron-withdrawing and electron-donating groups. Yu et al. employed Pd-catalysed
Sonogashira–Hagihara coupling to produced Eosin Y-functionalised porous polymers, able to
photoreduce CO2 to CO with 92% selectivity, using visible light and sacrificial H2O.[14] More
recently, Fu et al. reported rhenium-doped covalent-organic frameworks (COFs), with high CO2
photoreduction rates in the presence of acetonitrile and sacrificial triethanolamine.[12] Furthermore,
a metal-free COF produced using solvothermal condensation reactions was reported as a visible-
light-driven photocatalyst for CO2 photoreduction in the presence of water.[12, 15] While
demonstrating the potential of porous organic polymers for CO2 photoreduction, the synthesis of
porous organic polymer photocatalysts generally requires the use of rare-earth metals, or
specifically polymerisable monomeric units, presenting implementation barriers due to relatively
high-costs and poor sustainability.
Hypercrosslinked polymers (HCPs) represent a class of materials with excellent tunability and
relatively low costs. HCPs are densely crosslinked amorphous networks, produced using simple
Friedel-Crafts chemistry. Non-functional aromatic compounds (i.e. without specifically
polymerisable groups) can be ‘knitted’ together using an external crosslinker, requiring only iron(III)
chloride as catalyst.[16] The employment of external crosslinkers means a large array of aromatic
compounds can be considered as monomeric material, providing substantial scope for the design
of HCPs. Owing to their low cost and chemical versatility, HCPs are being developed for many
different applications such as gas separation and storage,[17-18] solid-state extraction,[19-20] and in
catalysis.[21] Recently, Wang et al. used an HCP-TiO2-graphene composite for the photoreduction of
CO2, with the HCP component aiding CO2 adsorption and diffusion.[22] The ability of HCPs alone to
catalyse solar fuel production, however, remains unknown.
Herein, we present HCPs as a new class of photocatalyst capable of selectively reducing CO2
to CO. Photocatalytic conversion was achieved using only visible light in the presence of sacrificial
H2O, without additional sacrificial agents or co-catalysts, significantly out-performing TiO2 P25 (x7.5
times). The influence of the reducing agent was investigated (i.e. H2 vs. H2O). Surprisingly,
employing sacrificial H2O led to significant improvements in photoconversion rates. We
hypothesise that the preferential adsorption of H2O concentrates the sacrificial agent at the HCP’s
surface, driving photocatalytic performance. Owing to their lack of requirement for precious-metal
catalysts, as well as their easily scaled chemistry, HCPs present an exciting platform for the further
design and discovery of high-performance organic photocatalysts.
Results and Discussion
Hypercrosslinked polymer synthesis and characterisation. We synthesised three HCPs of
varied chemical structure, HCP-1, HCP-2, and HCP-3 via a Friedel-Crafts alkylation reaction using
external crosslinkers to ‘knit’ together aromatic monomers. A general reaction scheme and
representative HCP structures are shown in Figure 1a,b. HCP-1 was produced via the crosslinking
of benzene, using an aliphatic dimethoxymethane external crosslinker, one of the most widely-
studied HCPs in recent years.[23] HCP-2 is comprised of aniline crosslinked using the benzyl ether
compound 4,4-bis(methoxymethane)biphenyl, as the analogous polymer produced using
dimethoxymethane was non-porous.[24] Finally, HCP-3 consisted of 2,4-diamino-6-phenyl-1,3,5-
triazine crosslinked using 4,4-bis(methoxymethane)biphenyl. We chose the chemistries of HCP-2
and HCP-3 to try to improve the CO2 adsorption selectivity via the inclusion of amino groups.
Photographic images of the networks (Figure S1) reveal a colour gradient from dark to light brown
from HCP-1 to HCP-3.
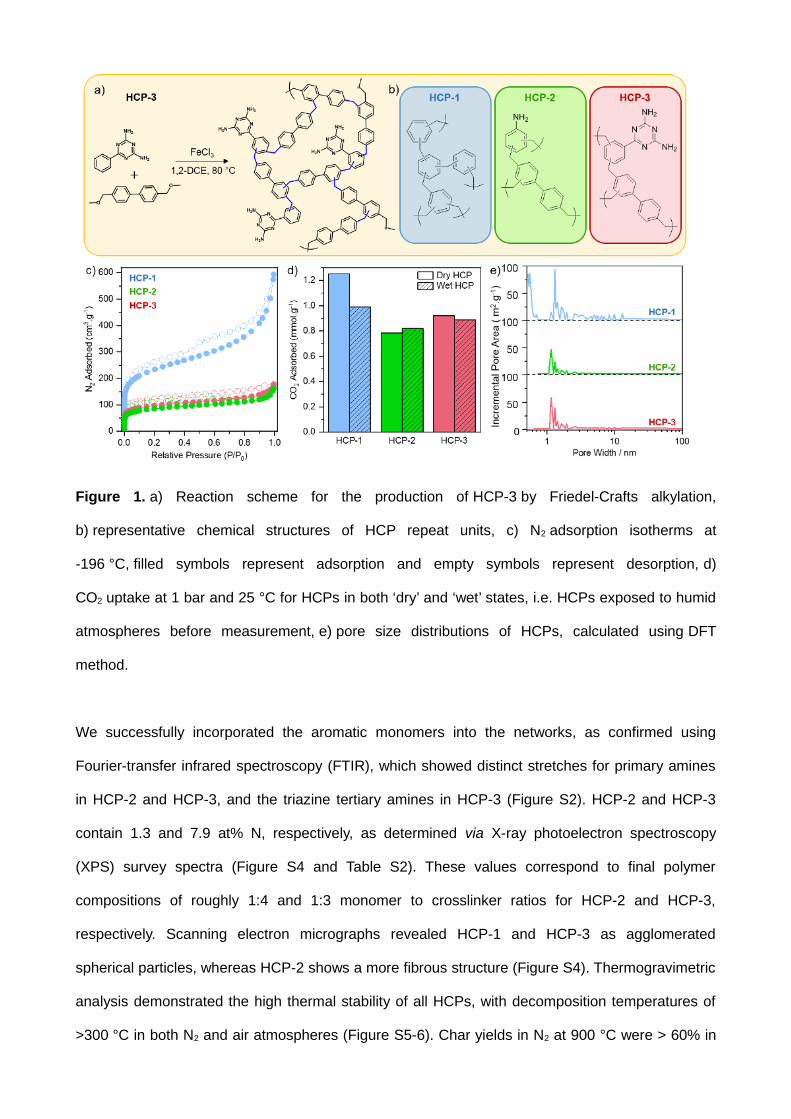
Figure 1. a) Reaction scheme for the production of HCP-3 by Friedel-Crafts alkylation,
b) representative chemical structures of HCP repeat units, c) N2 adsorption isotherms at
-196 °C, filled symbols represent adsorption and empty symbols represent desorption, d)
CO2 uptake at 1 bar and 25 °C for HCPs in both ‘dry’ and ‘wet’ states, i.e. HCPs exposed to humid
atmospheres before measurement, e) pore size distributions of HCPs, calculated using DFT
method.
We successfully incorporated the aromatic monomers into the networks, as confirmed using
Fourier-transfer infrared spectroscopy (FTIR), which showed distinct stretches for primary amines
in HCP-2 and HCP-3, and the triazine tertiary amines in HCP-3 (Figure S2). HCP-2 and HCP-3
contain 1.3 and 7.9 at% N, respectively, as determined via X-ray photoelectron spectroscopy
(XPS) survey spectra (Figure S4 and Table S2). These values correspond to final polymer
compositions of roughly 1:4 and 1:3 monomer to crosslinker ratios for HCP-2 and HCP-3,
respectively. Scanning electron micrographs revealed HCP-1 and HCP-3 as agglomerated
spherical particles, whereas HCP-2 shows a more fibrous structure (Figure S4). Thermogravimetric
analysis demonstrated the high thermal stability of all HCPs, with decomposition temperatures of
>300 °C in both N2 and air atmospheres (Figure S5-6). Char yields in N2 at 900 °C were > 60% in

all HCPs, while complete degradation was observed in air at > 550 °C. Powder X-ray diffraction
confirmed the amorphous nature of all HCP networks (Figure S7).
We used N2 sorption measurements at -196 °C to assess the porous nature of the networks.
HCP-1, HCP-2, and HCP-3 exhibited BET surface areas of 951, 311, and 357 m2/g, respectively
(Figure 1c and Table S3). All HCPs displayed a combination of type I and type IV isotherms, [25] with
significant microporosity, as indicated by the steep N2 uptake at low relative pressures, as well as
meso/macroporosity. Micropore volume was highest in HCP-1 (0.46 cm3/g), dropping to 0.13 and
0.16 cm3/g for HCP-2 and HCP-3, respectively, reflecting trends seen in the polymer’s BET surface
areas. Figure 1e highlights a multimodal pore size distribution for all networks, predominantly
concentrated in the micropore region. Pores of around 0.5 nm in size contribute noticeably to HCP-
1’s surface area, whereas both HCP-2 and HCP-3 do not show any significant area derived from
pores smaller than 1 nm in diameter.
To assess the CO2 uptake ability of HCPs, we collected adsorption isotherms at 25 °C up to 1
bar (full isotherms are shown in Figure S8). Although the HCPs followed the expected trend, i.e.
higher surface area polymers adsorbed more CO2, the CO2 capacities did not reflect the large
differences in surface areas (Table S3). The presence of the amino groups in HCP-2 and HCP-3,
which are known to impart CO2 selectivity to hypercrosslinked polymers,[26] increased uptake
density per unit of surface area due to more attractive interactions with the adsorbate CO2.[27-28]
The presence of adsorbed water was shown to impede CO2 uptake in polar HCPs, due to
competitive adsorption.[29] Therefore, we investigated the effect of H2O and CO2 co-adsorption,
since we used sacrificial H2O vapour in CO2 photoreduction (see below). We exposed the samples
to humid air (>99 % humidity) for at least 48 h before collecting CO2 adsorption isotherms at 25 °C
up to 1 bar. Crucially, samples were not degassed prior to CO2 adsorption measurements (details
in ESI), i.e. adsorbed H2O was not removed. These conditions are close to those in photoreduction
experiments. The CO2 sorption capacities at 1 bar are given in Figure 1d. The full isotherms of both
degassed, “dry”, and humidity-exposed, “wet”, HCPs are shown in Figure S8. Wet HCP-1 showed
a 21% decrease in CO2 capacity in comparison to its dry equivalent, while the amine-containing
HCP-2 and HCP-3 showed negligible difference in CO2 uptake between the wet and dry networks.
These uptake capacities demonstrate the minimal impact of water co-adsorption, emphasising the
selective adsorption of CO2 by the polymers, particularly HCP-2 and HCP-3. During photoreduction
experiments, we did not expose HCPs to water vapour prior to CO2 reduction, but rather a stream
of CO2 containing water vapour. As such, the effect of co-adsorption is likely to be less significant
in-situ.
CO2 photoreduction activity of hypercrosslinked polymers
To evaluate the potential of HCPs for CO2 photoreduction, we investigated their optoelectronic
properties using UV-visible diffuse reflectance spectroscopy (UV-vis DRS). The UV-vis spectra
show all HCPs absorb light in both the UV and visible range, with absorption onsets of 348, 350,
and 389 nm for HCP-1, HCP-2 and HCP-3, respectively (Figure 2a). All three HCPs exhibited
photoluminescence above 550 nm (Figure S9), and as shown in Figure 2b we probed their
photoluminescence lifetimes at 700 nm using time-correlated single photon counting (TCSPC)
upon 282 nm excitation. The time at which the photoluminescence signal has decayed to half its
initial amplitude (half-lifetime) was 1.9 ns, 2.2 ns, and 3.2 ns for HCP-1, HCP-2, and HCP-3,
respectively, which demonstrates that HCP-3 has a substantially longer excited state lifetime than
HCP-1 or HCP-2. We estimated the HCP’s valence band (VB) and conduction band (CB) positions
by complementing our UV-vis DRS data with XPS measurements (Figure 2c). First, valence band
XPS measurements allowed us to ascertain the distance between the Fermi level (EF) and the VB
onset, also known as VB offset (Figure S10). Placing the VB offset on the absolute energy scale
requires knowledge of the position of the Fermi level, which was determined by measuring the
secondary electron cut-off through XPS work function measurements (Figure S11). Finally, we
identified the CB position using the UV-vis spectra absorption onset. For all HCPs, the CB is
located above the reduction potential of CO2/CO and the VB below the oxidation potential of both
H2/H2O and O2/H2O. Hence, the band diagrams point towards a sufficient thermodynamic driving
force to enable the reduction of CO2 to CO using either gaseous H2 or H2O as a sacrificial agent.
The Fermi level of all HCPs lies closer to the CB than the VB, suggesting electrons are the major
charge carriers, which is desirable for CO2 photoreduction. Overall, the narrow band gaps and
visible light absorption properties of HCPs, as well as their CO2 adsorption capacities, make them
a priori attractive candidates for CO2 photoreduction.

After establishing their CO2 adsorption ability and desirable optoelectronic properties, we tested
HCPs for the photocatalytic reduction of gaseous CO2. We conducted the tests in a heterogeneous
gas/solid photoreactor at ambient temperature, using either H2 or H2O as a sacrificial agent under
UV-vis or visible irradiation alone (Xe arc lamp, 300 W, Figure S12). No co-catalyst or
photosensitiser was required, but some residual iron is present from the HCP synthesis and may
play a role in the photoreduction activity (Table S1) as shown with Pd for other organic materials in
the context of H2 evolution.[30-31] A representation sample of HCP-2 was found to contain 246 ppm
of Fe. Under the same conditions, digestion of HCP-1 and HCP-3 was unsuccessful and the iron
content could not be estimated. A gas phase reactor was chosen to combine CO2 capture and CO2
conversion, avoiding limitations owing to poor CO2 solubility in some liquid phase reactions (Figure
S13). In each experimental set, we compared HCP performance to that of the benchmark TiO2
P25. For all HCPs, after 3 hours of irradiation the primary carbonaceous product observed was
CO, with a selectivity of up to 96% and 95% using sacrificial H2 or H2O, respectively (Figure 2d and
2e, Table S4, Table S5). Trace CH4 was also detected, representing the only other carbonaceous
product measured. Regardless of the sacrificial agent, HCP-2 exhibited the lowest CO production
rate, while HCP-3 displayed the highest. The photocatalytic performance of HCP-3 was
comparable to that of TiO2 P25 under UV-vis light and was up to 7.5 times better when irradiated
with only visible light (Figure 2e, Table S4). In fact, we observed photocatalytic activity for all HCPs
under visible light alone, a significant finding for organic materials requiring no doping or co-
catalyst. The decrease in activity under visible light compared to UV-vis is rationalised using their
UV-vis absorption spectra (Figure 2a). As HCP-1 is the network that shows the highest light
absorption in the visible region, its photoactivity is the least affected by the absence of UV light.

Figure 2. a) UV-vis absorption coefficient spectra with absorption onsets indicated, b)
photoluminescence decay kinetics probed at 700 nm following excitation at 282 nm, along with the
instrument response function (IRF) probed at the excitation wavelength, c) band gap position, d)
photocatalytic production rates using sacrificial H2 in UV-vis, e) photocatalytic production rates using
sacrificial H2O in both UV-vis and visible light alone, f) HCP-3 recyclability test over 5 cycles of 3 h
irradiation using UV-vis light and sacrificial H2O.
Activity in the visible range is promising for the future of HCP photocatalysts in real-world applications
as visible light comprises a large portion of the sun’s output reaching the Earth’s surface. Targeted
network modifications might allow further optimisation of this visible light activity. The high
photocatalytic activity of HCP-3 likely arises from the presence of triazine groups. Lee et al. reported
stronger electrostatic CO2 interactions in triazines when compared to benzene and amino groups, as
are present in HCP-1 and HCP-2, respectively.[32] Triazine groups may also offer an additional
delocalisation of the electrons, favouring lower electron-hole recombination.[33-34] Time-resolved
photoluminescence showed that HCP-3 displayed the lowest electron-hole recombination rates (Figure

2b), offering more opportunity for charges to migrate to the surface of the photocatalyst for CO 2
photoconversion. To gain further insights on the key parameters influencing CO2 adsorption and
photoconversion, a systematic HCPs screening is required.
Interestingly, CO2 photoreduction performance of HCPs improved by up to 2.5 times when
replacing H2 with sacrificial H2O (Figure 2 d,e). From a thermodynamic standpoint, such behaviour is
intriguing as H2O oxidation requires a higher driving force than H2 oxidation. We hypothesised that the
increased photoactivity in the presence of H2O is due to HCPs displaying significantly improved
adsorption capacities for H2O when compared to H2. This leads to an increased availability of the
sacrificial agent at the photoactive sites on the HCPs’ surface, improving photoreduction rates. To
investigate this hypothesis, we collected pure H2 and H2O adsorption isotherms for all HCPs (Figure 3).
From the pure adsorption isotherms, under operating conditions (atmospheric pressure, 25 °C) HCPs
adsorbed <0.1 mmol/g of H2, in comparison to between 2 and 9.4 mmol/g for H2O, an increase of 2
orders of magnitude. A higher concentration of sacrificial agent at the HCP’s surface should favour high
CO2 photoreduction rates, explaining the increase of photoactivity when using H2O as reducing agent.
To further investigate the importance of H2O adsorption on the photoactivity, we decreased the
humidity inside the photoreactor by decreasing the temperature of the H2O vapour saturator to ~ 1 °C.
At 1 oC, the partial pressure of H2O at saturation is reduced (6.6 mbar), dramatically reducing the
concentration of H2O introduced into the system. After sealing the reactor, we conducted CO2
photoreduction measurements at 25 °C, under atmospheric pressure. The decreased humidity of the
stream resulted in a 38% decrease in activity for HCP-3 (Figure S14). Indeed, H2O uptake in this
network is reduced to around 0.4 mmol/g at 6.6 mbar, as estimated from the pure water sorption
isotherm (Figure 3b).

Figure 3. a) H2 and b) H2O adsorption isotherms at 25 oC. Filled symbols represent adsorption and
empty symbols represent desorption.
This further corroborates the importance of the adsorption of the sacrificial agents to the photocatalyst
surface. TiO2 also showed improvements when employing sacrificial H2O in place of H2. Sorescu et al.
outlined how co-adsorbed water on TiO2 can positively affect the adsorption capacities of CO2 through
the formation of hydrogen bonds.[35] Other materials such as ZrO and coal also exhibit increased CO2
adsorption and/or activation in the presence of co-adsorbed H2O.[36-38] In addition to ensuring the
presence of H2O molecules close to active sites, we speculate that co-adsorbed water may also favour
CO2 activation and/or the formation of bicarbonate species and facilitate its photoreduction, as
suggested elsewhere for other photocatalysts.[39-40] Nonetheless, further studies are required to
understand the influence of H2O on CO2 adsorption.
We examined further the photocatalytic properties under UV-vis irradiation of HCP-3, the most
active photocatalyst of this study. Kinetic studies point to a relatively linear production of CO up to 3 h
of irradiation (Figure S15). Recyclability tests were also performed. As shown in Figure 2f, after 5
cycles the photoactivity decreased by 9%, which may be due to the formation of surface products or
mild degradation of the polymer. We also probed the structural and chemical stability of HCP-3 by
collecting N2 sorption isotherms and XPS and FTIR spectra before and after UV-vis irradiation.
Elemental composition, porosity and chemical bonds were maintained without significant alteration,
with the exception of a change in the shape of the N2 isotherm (Figure S3, S16 and Table S2). To verify
the evolution of CO from CO2 conversion over HCPs photocatalysts, we conducted a series of control
experiments, i.e.: in an inert atmosphere (N2/H2 or N2/H2O); without catalyst; without light; isotopic
labelling of 13CO2 (control experiments details are outlined in Table S4). In the absence of CO2, the
activity decreased by 77% to 88% depending on the atmosphere (N2/H2O vs N2/H2). We attribute the
trace CO detected under inert atmosphere arises from the degradation of the residual oxygen-
containing functional groups of the HCP crosslinkers. To verify the photocatalytic production of CO from
CO2, we conducted isotopic labelled 13CO2 tests using H2O as a sacrificial agent under UV-visible light
irradiation. We observe a 13CO peak (m/z= 29) after light irradiation, confirming the ability of HCPs to
photoconvert CO2 to CO (Figure S17).
Conclusion
We report hypercrosslinked polymers for the first time as a photocatalytic platform for CO2
photoreduction under both UV-vis and visible light irradiation. HCPs show promising photocatalytic
activity using only sacrificial H2O, without the requirement of any co-catalyst or photosensitiser,
significantly outperforming the benchmark material TiO2 P25 under visible light illumination. This was
rationalised by new insights into the concentration of sacrificial agents at the surface of HCPs via
selective adsorption, as networks showed significantly higher H2O adsorption capacity in comparison to
negligible H2 adsorption. The performance disparity between these reducing agents outlines a key
consideration when producing photocatalysts for yield efficient solar‐energy conversion. Their lack of
requirement for precious-metal catalysts, as well as their simple engineering, good general stabilities
and low costs, make HCPs an exciting and promising platform for the design of organic photocatalysts.

Acknowledgements
The authors thank Sophie Neumayer and Lukas Brandfellner for performing ICP analysis. The authors
also acknowledge the Engineering and Physical Sciences Research Council (EPSRC) for funding
through the CDT in Advanced Characterisation of Materials EP/L015277/1 (G. M. S. and C. P.). M.S.
thanks EPSRC for a Doctoral Prize Fellowship.
Supporting information for this article is given via a link at the end of the document.
References
[1] M. Bui, C. S. Adjiman, A. Bardow, E. J. Anthony, A. Boston, S. Brown, P. S. Fennell, S. Fuss, A.
Galindo, L. A. Hackett, J. P. Hallett, H. J. Herzog, G. Jackson, J. Kemper, S. Krevor, G. C.
Maitland, M. Matuszewski, I. S. Metcalfe, C. Petit, G. Puxty, J. Reimer, D. M. Reiner, E. S.
Rubin, S. A. Scott, N. Shah, B. Smit, J. P. M. Trusler, P. Webley, J. Wilcox, N. Mac Dowell,
Energ. Environ. Sci. 2018, 11, 1062-1176.
[2] E. V. Kondratenko, G. Mul, J. Baltrusaitis, G. O. Larrazabal, J. Perez-Ramirez, Energ. Environ.
Sci. 2013, 6, 3112-3135.
[3] J. H. Montoya, L. C. Seitz, P. Chakthranont, A. Vojvodic, T. F. Jaramillo, J. K. Norskov, Nat.
Mater. 2017, 16, 70-81.
[4] Z. Xiong, Z. Lei, Z. W. Xu, X. X. Chen, B. G. Gong, Y. C. Zhao, H. B. Zhao, J. Y. Zhang, C. G.
Zheng, J. Co2 Util. 2017, 18, 53-61.
[5] Y. H. Yang, F. Q. Zhan, H. Li, W. H. Liu, S. Yu, J. Solid State Electr. 2017, 21, 2231-2240.
[6] M. Reli, M. Kobielusz, L. Matejova, S. Danis, W. Macyk, L. Obalova, P. Kustrowski, A.
Rokicinska, K. Koci, Appl. Surf. Sci. 2017, 391, 282-287.
[7] K. Koci, P. Praus, M. Edelmannova, N. Ambrozova, I. Troppova, D. Fridrichova, G. Slowik, J.
Ryczkowski, J. Nanosci. Nanotechno. 2017, 17, 4041-4047.
[8] S. H. Luo, Z. T. Zeng, G. M. Zeng, Z. F. Liu, R. Xiao, P. Xu, H. Wang, D. L. Huang, Y. Liu, B. B.
Shao, Q. H. Liang, D. B. Wang, Q. Y. He, L. Qin, Y. K. Fu, J. Mater. Chem. A. 2020, 8, 6434-
6470.
[9] C. Xu, W. J. Zhang, J. T. Tang, C. Y. Pan, G. P. Yu, Front Chem 2018, 6.
[10] J. D. Xiao, H. L. Jiang, Acc. Chem. Res. 2019, 52, 356-366.
[11] T. X. Wang, H. P. Liang, D. A. Anito, X. S. Ding, B. H. Han, J. Mater. Chem. A. 2020, 8, 7003-
7034.

[12] Z. W. Fu, X. Y. Wang, A. Gardner, X. Wang, S. Y. Chong, G. Neri, A. J. Cowan, L. J. Liu, X. B.
Li, A. Vogel, R. Clowes, M. Bilton, L. J. Chen, R. S. Sprick, A. I. Cooper, Chem. Sci. 2020, 11,
543-550.
[13] C. Yang, W. Huang, L. C. da Silva, K. A. I. Zhang, X. C. Wang, Chem-Eur J. 2018, 24, 17454-
17458.
[14] X. X. Yu, Z. Z. Yang, B. Qiu, S. E. Guo, P. Yang, B. Yu, H. Y. Zhang, Y. F. Zhao, X. Z. Yang, B.
X. Han, Z. M. Liu, Angew. Chem. Int. Edit. 2019, 58, 632-636.
[15] K. Lei, D. Wang, L. Q. Ye, M. P. Kou, Y. Deng, Z. Y. Ma, L. Wang, Y. Kong, ChemSusChem
2020, 13, 1725-1729.
[16] B. Y. Li, R. N. Gong, W. Wang, X. Huang, W. Zhang, H. M. Li, C. X. Hu, B. E. Tan,
Macromolecules 2011, 44, 2410-2414.
[17] R. T. Woodward, Chem Comm 2020, 56, 4938-4941.
[18] R. T. Woodward, L. A. Stevens, R. Dawson, M. Vijayaraghavan, T. Hasell, I. P. Silverwood, A. V.
Ewing, T. Ratvijitvech, J. D. Exley, S. Y. Chong, F. Blanc, D. J. Adams, S. G. Kazarian, C. E.
Snape, T. C. Drage, A. I. Cooper, J. Am. Chem. Soc. 2014, 136, 9028-9035.
[19] R. T. Woodward, M. Kessler, S. Lima, R. Rinaldi, Green Chem. 2018, 20, 2374-2381.
[20] K. Schute, M. Rose, ChemSusChem 2015, 8, 3419-3423.
[21] X. Lu, S. Shi, G. Z. Zhu, L. Zhao, M. Wang, J. Gao, Z. T. Du, J. Xu, ChemistrySelect 2020, 5,
549-553.
[22] S. L. Wang, M. Xu, T. Y. Peng, C. X. Zhang, T. Li, I. Hussain, J. Y. Wang, B. E. Tan, Nat.
Commun. 2019, 10.
[23] B. Li, R. Gong, W. Wang, X. Huang, W. Zhang, H. Li, C. Hu, B. Tan, Macromolecules 2011, 44,
2410-2414.
[24] R. T. Woodward, Chem Commun (Camb) 2020.
[25] M. Thommes, K. Kaneko, A. V. Neimark, J. P. Olivier, F. Rodriguez-Reinoso, J. Rouquerol, K. S.
W. Sing, Pure Appl. Chem. 2015, 87, 1051-1069.
[26] R. Dawson, T. Ratvijitvech, M. Corker, A. Laybourn, Y. Z. Khimyak, A. I. Cooper, D. J. Adams,
Polymer Chemistry 2012, 3, 2034-2038.
[27] A. M. Varghese, G. N. Karanikolos, International Journal of Greenhouse Gas Control 2020, 96.
[28] K. Sumida, D. L. Rogow, J. A. Mason, T. M. McDonald, E. D. Bloch, Z. R. Herm, T. H. Bae, J. R.
Long, Chem Rev 2012, 112, 724-781.
[29] R. Dawson, L. A. Stevens, T. C. Drage, C. E. Snape, M. W. Smith, D. J. Adams, A. I. Cooper, J.
Am. Chem. Soc. 2012, 134, 10741-10744.
[30] J. Kosco, M. Sachs, R. Godin, M. Kirkus, L. Francas, M. Bidwell, M. Qureshi, D. Anjum, J. R.
Durrant, I. McCulloch, Advanced Energy Materials 2018, 8, 1802181.
[31] M. Sachs, H. Cha, J. Kosco, C. M. Aitchison, L. Francàs, S. Corby, C.-L. Chiang, A. Wilson, R.
Godin, A. Fahey-Williams, A. Cooper, S. Sprick, I. McCulloch, J. R. Durrant, J. Am. Chem. Soc.
2020. doi.org/10.1021/jacs.0c06104
[32] H. M. Lee, I. S. Youn, M. Saleh, J. W. Lee, K. S. Kim, Phys Chem Chem Phys 2015, 17, 10925-
10933.
[33] W. Che, W. R. Cheng, T. Yao, F. M. Tang, W. Liu, H. Su, Y. Y. Huang, Q. H. Liu, J. K. Liu, F. C.
Hu, Z. Y. Pan, Z. H. Sun, S. Q. Wei, J. Am. Chem. Soc. 2017, 139, 3021-3026.
[34] H. Zhong, Z. X. Hong, C. Yang, L. Y. Li, Y. S. Xu, X. C. Wang, R. H. Wang, ChemSusChem
2019, 12, 4493-4499.
[35] D. C. Sorescu, J. Lee, W. A. Al-Saidi, K. D. Jordan, J. Chem. Phys. 2012, 137.
[36] Z. Y. Gao, Y. Ding, J Mol Model 2017, 23.
[37] H. Li, C. Rameshan, A. V. Bukhtiyarov, I. P. Prosvirin, V. I. Bukhtiyarov, G. Rupprechter, Surf.
Sci. 2019, 679, 139-146.
[38] C. C. Lo, C. H. Hung, C. S. Yuan, J. F. Wu, Sol Energ Mat Sol C 2007, 91, 1765-1774.
[39] X. X. Chang, T. Wang, J. L. Gong, Energ. Environ. Sci. 2016, 9, 2177-2196.
[40] M. T. Nayakasinghe, Y. L. Han, N. Sivapragasam, D. S. Kilin, U. Burghaus, Chem Comm 2018,
54, 9949-9952.


download fileview on ChemRxivHCP_CO2_250820_CP.docx (441.26 KiB)

Supporting Information
Hypercrosslinked polymers as a photocatalytic platform for visible-
light-driven CO2 photoreduction using H2O
Giulia E. M. Schukraft,a Robert T. Woodward,a,b* Santosh Kumar,c Michael Sachs,d Salvador
Eslava,c Camille Petita*
[a] G. E. M. Schukraft, Dr R. T.Woodward, Dr. Camille PetitBarrer CentreDepartment of Chemical Engineering, South Kensington CampusImperial College London, London, SW7 2AZE-mail: [email protected]
[b] Dr. R. T. Woodward (current address)Institute of Materials Chemistry and Research, Faculty of ChemistryUniversity of Vienna, Währinger Straße 42, 1090 Vienna, AustriaE-mail: [email protected]
[c] Dr. S. Kumar, Dr. S. EslavaDepartment of Chemical EngineeringImperial College London, London, SW7 2AZ
[d] Dr. M. SachsDepartment of Chemistry, White City CampusImperial College London, London, W12 0BZ.

Table of Contents
1.Experimental Section.......................................................................................................2
2.Characterisation..............................................................................................................3
3.Supplementary Figures and Tables..................................................................................9
4.References.....................................................................................................................35
S1

1. Experimental Section
Materials
TiO2 P25 (>99.5%, 21 nm primary particle size), benzene, dimethoxymethane, 2,4-diamino-
6-phenyl-1,3,5-triazine, aniline, 1,2-dichloroethane, N,N-dimethylformamide and iron(III)
chloride were all purchased from Sigma-Aldrich. 4,4'-bis(methoxymethyl)biphenyl was
purchased from Tokyo Chemical Industry (TCI) UK and methanol (reagent grade) was
purchased from VWR. All reagents were used as received. All gases were purchased from
BOC.
Hypercrosslinked Polymer Synthesis
HCP-1: Anhydrous 1,2-dichloroethane (20 mL) was added to benzene (0.78 g, 10 mmol) and
dimethoxymethane (2.28 g, 30 mmol) under N2, before the solution was purged with N2 for at
least a further 30 minutes. After purging, iron(III) chloride (4.87 g, 30 mmol) was quickly
added to the solution and the mixture was heated to 80 °C for a further 24 h, during which the
reaction was kept under an inert atmosphere. The resulting solid was allowed to cool before it
was filtrated using a Buchner funnel and washed with methanol until the filtrate was almost
colourless. The polymer was then further washed by Soxhlet extraction in methanol for 24 h.
Finally, the polymer was dried in a vacuum oven overnight at 70 °C.
HCP-2: The overall procedure remained the same as HCP-1 with 1,2-dichloroethane (20 mL)
added to aniline (0.28 g, 3 mmol) and 4,4'-bis(methoxymethyl)biphenyl (1.45 g, 6 mmol)
before iron(III) chloride (0.98 g, 6 mmol) was added.
HCP-3: Again, the overall procedure remained the same as HCP-1 with 1,2-dichloroethane
(20 mL) added to 2,4-diamino-6-phenyl-1,3,5-triazine (0.37 g, 2 mmol) and 4,4'-
S2
bis(methoxymethyl)biphenyl (0.97 g, 4 mmol) before iron(III) chloride (0.65 g, 4 mmol) was
added. After synthesis, a step was added in which HCP-3 was washed in chloroform by
Soxhlet extraction, to ensure the removal of any unreacted 2,4-diamino-6-phenyl-1,3,5-
triazine. Yields for HCP-1, HCP-2 and HCP-3 were 84 %, 66 % and 91%, respectively, based
on hypothetical 100% polycondensation.
2. Characterisation
Chemical and structural properties
Fourier-transform infrared (FTIR) spectroscopy was performed in the range of 500 – 4000
cm-1 on finely ground samples using a PerkinElmer Spectrum 100 FT-IR spectrometer
equipped with an attenuated total reflectance (ATR) accessory.
Thermal analyses were performed using a Netzsch TG209 F1 Libra thermogravimetric
analyser. At least 10 mg of sample was heated from room temperature to 900 °C at a rate of
10 °C min−1 under either air or N2 gas flow (flow rate 100 mL min−1). An initial isothermal
step of 1 h was included at 120 °C to ensure removal of adsorbates before heating continued.
X-ray photoelectron spectroscopy (XPS) measurements were carried out on a Thermo
Scientific K-Alpha+ X-ray photoelectron spectrometer equipped with a MXR3 Al Kα
monochromated X-ray source (hν = 1486.6 eV). Samples were ground and mounted on the
XPS holder using a conductive carbon tape. The X-ray gun power was set to 72 W (6 mA and
12 kV). Survey scans were acquired using 200 eV pass energy, 0.5 eV step size, and 100 ms
(50 ms x 2 scans) dwell times. Data analysis was performed using the Thermo Avantage data
analysis program.
S3
Nitrogen isotherms were measured using a porosity analyser (Micromeritics 3Flex) at -196
oC. Prior to measurement, all samples were degassed overnight at 393 K at around 0.2 mbar
pressure. Samples underwent a further degas step at 393 K in-situ on the porosity analyser for
4 h, this time at around 0.003 mbar. Surface areas were calculated using the
Brunauer−Emmett−Teller (BET) method.[1] The total volume of pores (VTOT) was calculated
from the volume of N2 adsorbed at P/P0 = 0.97 and micropore volume (VMICRO) was
determined using the Dubinin−Astakhov method.[2] The pore size distribution was derived
from the adsorption isotherms by using an built-in software from Micromeritics and selecting
the DFT model for carbon slit shape pores (N2@77 on Carbon Slit Pores by NLDFT).
Powder X-ray diffraction (PXRD) measurements were recorded at room temperature on a
BRUKER 2D PHASE diffractometer operating at 30 kV and 10 mA with monochromatised
Cu Kα radiation (λ = 0.15418 nm).
The morphology of the samples was imaged using a scanning electron microscope (SEM,
Leo Gemini 1525, Zeiss) in secondary electron mode (InLens detector) at 5 kV. The samples
were ground, deposited on carbon tape, and coated with 20 nm of chromium to reduce
charging.
For determination of Iron content in HCP-2, samples were first digested (~5 mg sample)
using 4 mL conc. nitric acid (4 mL) and H2O2 (200 µL) using an open vessel graphite
digestion system (Labter, ODLAB; Distributor: AHF Analysentechnik AG; Germany).
Samples were twice heated to 150 °C and held at the target temperature for 1 h before cooling
to 50 °C, however this was not sufficient for sample digestion. Samples were then twice
heated to 200 °C and held for 45 h before again cooling to 50 °C. After digestion the sample
was diluted in ultrapure water (18.2 MΩ cm, Milli-Q Advantage, Darmstadt, Germany).
Digested samples were analysed using an ICP-MS (an Agilent 7800, Agilent Technologies,
S4
Tokyo, Japan) equipped with an Agilent SPS 4 autosampler (Agilent Technologies, Tokyo,
Japan) and a MicroMist nebulizer at a sample uptake rate of approx. 0.2 ml/min. The Agilent
MassHunter software package (Workstation Software, Version C.01.04, 2018) was used for
data evaluation. The instrumental parameters for the ICP-MS are summarized in Table S1. A
representation sample of HCP-2 was found to contain 246 ppm of Fe, however under the
above describe conditions digestion of HCP-1 and HCP-3 was unsuccessful.
Table S1: Instrumental parameters for the ICP-MS measurements
RF power 1550 WSampling depth 8 mm
Nebulizer MicroMist
Spray chamber Scott double-pass
Spraying chamber temp. 2°C
Monitored Isotopes 56Fe, 57Fe, 115In, 185Re,
Measurement mode He, 5 L min-1
Plasma gas 15 L min-1
Nebulizer gas 1.09 L min-1
Auxiliary gas 0.90 L min-1
Cones Ni
Integration time 0.3 s
Optoelectronic properties
Valence band X-ray photoelectron spectroscopy (XPS) and work function measurements
were carried out on a Thermo Scientific K-Alpha+ X-ray photoelectron spectrometer
equipped with a MXR3 Al Kα monochromated X-ray source (hν = 1486.6 eV). Samples were
ground and mounted on the XPS holder using a conductive carbon tape. The X-ray gun
power was set to 72 W (6 mA and 12 kV). Valence band spectra were obtained using 15 eV
pass energy and 0.05 eV step size. Data analysis was performed using the software Thermo
Avantage. The work functions of the polymers were determined by measuring the secondary
electron cut-off in the low kinetic energy region. The sample holder contained a clean gold
S5

standard sample, which was used as a reference material to ensure correct calibration. A
sample bias of -29.47 V was applied to the samples using an ion gun and the cut-off spectra
were obtained using a pass energy of 10 eV. To account for potential variations across the
surface of the material, the work function was measured at three different locations and the
average was taken. To convert the valence band position and the work function to the
absolute energy scale vs. vacuum with the redox potential scale vs. SHE, a factor of 4.44 was
required, as 4.44 eV on the former corresponds to 0.00 V on the latter, at 25 °C.
Diffuse reflectance ultraviolet-visible (DR-UV-Vis) spectra were obtained using a Perkin-
Elmer Spectrum 100 Spectrometer equipped with an integrating sphere. Spectral band width
was set to 2 nm, with Spectralon as a standard.
Time-correlated single photon counting (TCSPC) experiments were carried out using a
commercial TCSPC setup (Horiba DeltaFlex) equipped with a pulsed LED excitation source
(Horiba NanoLED series) and a fast rise-time photomultiplier detector (Horiba PPD-650 and
PPD-900). The instrument response function (IRF) was measured at the wavelength of the
excitation source (282 nm). During all other measurements, a suitable long pass filter was
inserted between sample and detector to block off scattered excitation light.
Gas and water sorption
Water vapor, CO2 and H2 adsorption isotherms were collected at 25 °C using a Micromeritics
3Flex instrument, equipped with a liquid container in the case of H2O. HCPs were degassed
overnight at 120 oC at around 0.2 mbar pressure and again in-situ on the porosity analyser
(Micromeritics 3Flex) for 4 h down to around 0.003 mbar. Research grade (99.999%) CO2
and H2 (99.9995%, Peak Scientific PH200 hydrogen generator) were used for CO2 and H2
isotherms. For H2O isotherms, miliQ water with a resistance > 18.2 micro-ohms was purified
S6
by 4 freeze pump thraw cycles. Water isotherms were collected up to a relative pressure of
0.8 to avoid condensation. For “wet” CO2 uptake, i.e. investigating CO2 uptake on HCPs pre-
exposed to H2O, HCPs were exposed to humid air (>99 % humidity) by placing HCPs in a
sealed vessel containing liquid water and a hygrometer for at least 48 hours at room
temperature. HCPs were not in contact with the liquid water during this process. After
removal, CO2 adsorption isotherms were performed at 25 °C up to 1 bar, skipping all prior
degas steps. The first pressure CO2 adsorption point was collected at around 10 mbar (~2
orders of magnitude higher than a standard ‘dry’ measurement) to minimise water desorption.
Resulting isotherms for wet polymers gave negative adsorption values at low absolute
pressures due to some water desorption in the initial stages of measurement. Therefore, to
allow comparison to dry samples, a factor was applied to the isotherm, raising the lowest
absolute pressure measurement to 0 mmol/g adsorbed CO2. It is worth noting that some
subsequent uptake may be due to re-adsorption of desorbed water.
Photocatalytic properties
A gas/solid photoreactor was assembled to conduct CO2 photocatalytic measurements (Figure
S13). Tests were conducted at ambient temperature. The photocatalysts were deposited on a
stainless-steel plate with a fixed area of 9.6 cm2. To do so, 10-15 mg of the ground
photocatalyst was dispersed in DI water (1.2 mL), sonicated for 30 seconds and drop cast
onto the sample holder. Research grade (99.999%) CO2 and H2 (99.9995%, Peak Scientific
PH200 hydrogen generator) were flowed at controlled rates using mass flow controllers
(Omega Engineering, 0–50 mL min-1). For experiments using H2 as sacrificial agent, the
photoreactor (35 cm3) was vacuumed and replenished with a gas mixture of CO2 and H2 (1.5
vol/vol ratio) six times. The same gas mixture of CO2 and H2 was subsequently passed over
the catalyst bed in the photoreactor for 15 residence times before it was sealed at 1.25 bar and
S7

irradiated for 3 h. For experiments using water as sacrificial agent, H2O vapour was generated
from a saturator at room temperature (25°C), unless stated otherwise, providing a gas mixture
of CO2 and H2O (1.4 wt% H2O). The photoreactor was vacuumed and replenished with a gas
mixture of CO2 and H2O at least six times prior to measurement. A xenon arc lamp (300 W, λ
> 325 nm, LOT Quantum Design) equipped with a water filter was used as the irradiation
source. The distance from the lamp to the sample was 9.5 cm with a broadband irradiance at
the sample surface of 1830 W.m-2. For visible light measurements a long pass UV filter (λ <
400 nm) (LOT Quantum Design) was used.
Evolved gases were analysed by a gas chromatograph mass spectrometer (GC-MS) with gas
sampling valves connected directly to the photoreactor. The GC (Agilent Technologies,
7890B) was equipped with HayeSep (Agilent J&W 6 foot, 1/8 inch, 2mm, HayeSep Q
Column 80/100 SST) and molecular sieve (Agilent J&W 6 foot, 1/8 inch, 2 mm, MolSieve
5A, 60/80, preconditioned) packed columns in series, a thermal conductivity detector (TCD)
and a flame ionisation detector (FID). The MS was equipped with a GS-GASPRO capillary
column (Agilent J&W HP-5ms GC Column, 30 m, 0.25 mm, 0.25 μm). For recyclability
tests, the aforementioned process was repeated after each 3 h irradiation cycle without
opening the photoreactor. In addition, isotopic tracing experiments were performed with
13CO2 (BOC, >98% atom 13CO2 compared to 12CO2, >99%). The photocatalytic CO2 reduction
tests were repeated 3 times for each material under the same reaction conditions.
S8

3. Supplementary Figures and Tables
Figure S1. Photographic images of: HCP-1, HCP-2 and HCP-3 (from left to right, respectively).
S9
HCP-1 HCP-3HCP-2
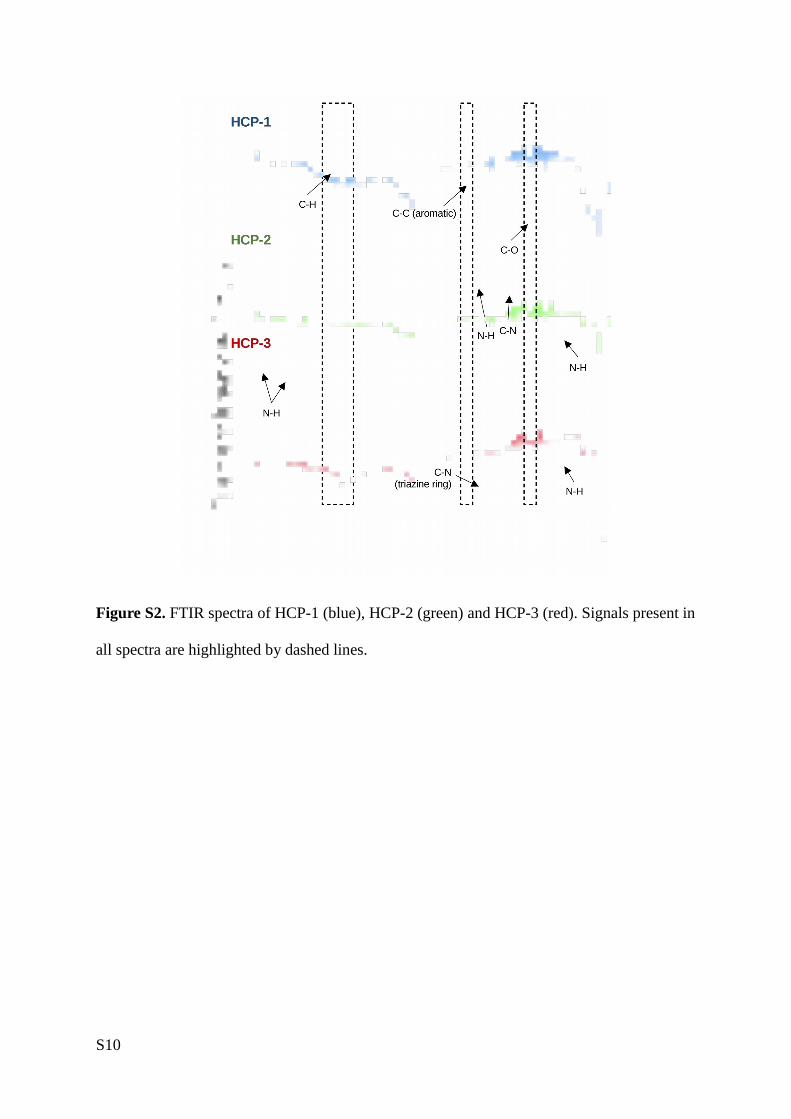
Figure S2. FTIR spectra of HCP-1 (blue), HCP-2 (green) and HCP-3 (red). Signals present in
all spectra are highlighted by dashed lines.
S10

Figure S3. X-ray photoelectron spectroscopy survey spectra of: a) HCP-1, b) HCP-2, c)
HCP-3, and d) HCP-3 after 3 h of UV-vis light irradiation.
S11
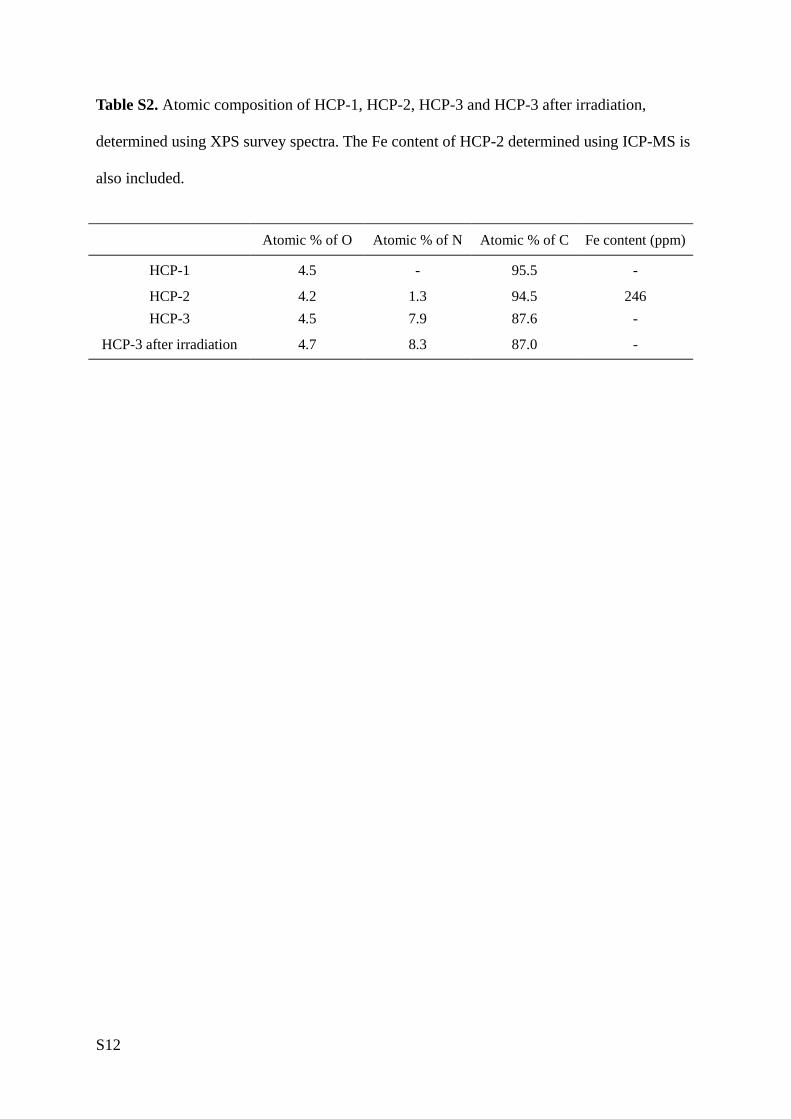
Table S2. Atomic composition of HCP-1, HCP-2, HCP-3 and HCP-3 after irradiation,
determined using XPS survey spectra. The Fe content of HCP-2 determined using ICP-MS is
also included.
Atomic % of O Atomic % of N Atomic % of C Fe content (ppm)
HCP-1 4.5 - 95.5 -
HCP-2 4.2 1.3 94.5 246
HCP-3 4.5 7.9 87.6 -
HCP-3 after irradiation 4.7 8.3 87.0 -
S12
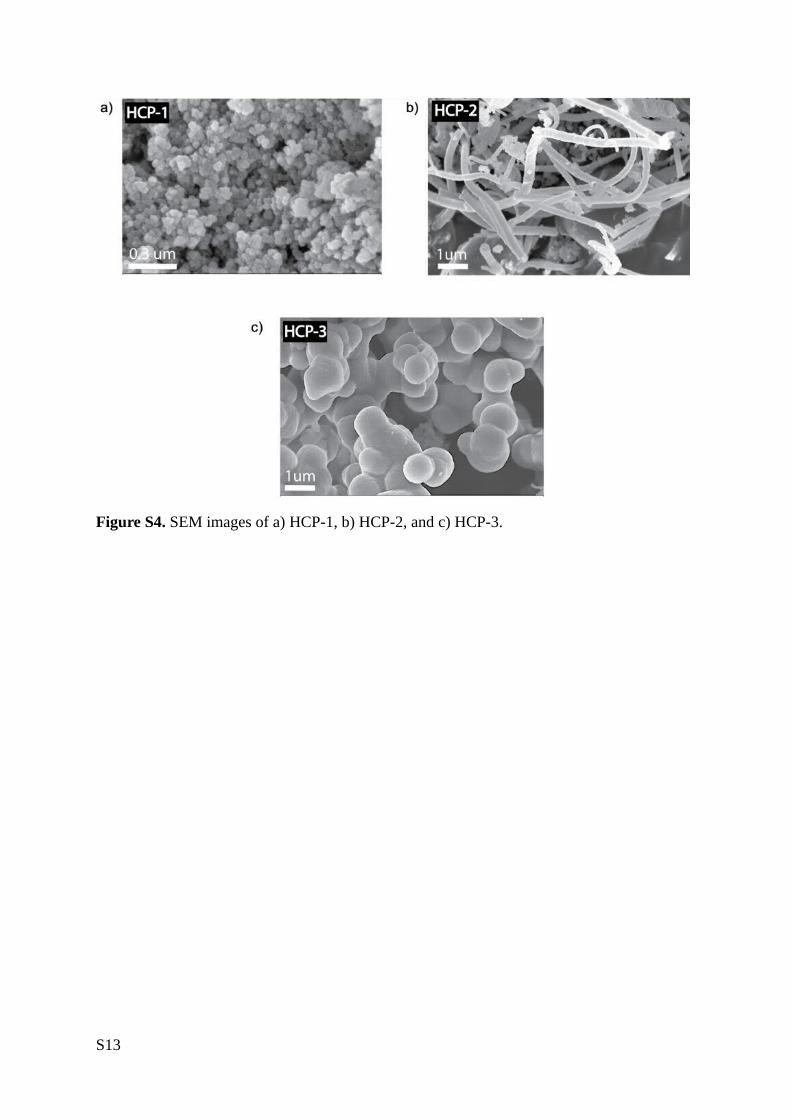
Figure S4. SEM images of a) HCP-1, b) HCP-2, and c) HCP-3.
S13

Figure S5. TGA thermograms up to 900
°C in a N2 atmosphere, heated at a
ramp rate of 10 °C/min with a N2 flow
rate of 100 mL/min. a) HCP-1, b) HCP-2,
and c) HCP-3.
S14

Figure S6. TGA thermograms up to 900 °C in air, heated at a ramp rate of 10 °C/min with an
air flow rate of 100 mL/min. a) HCP-1, b) HCP-2, and c) HCP-3.
S15

S16

Figure S7. PXRD patterns of a) HCP-1, b) HCP-2, and c) HCP-3.
S17
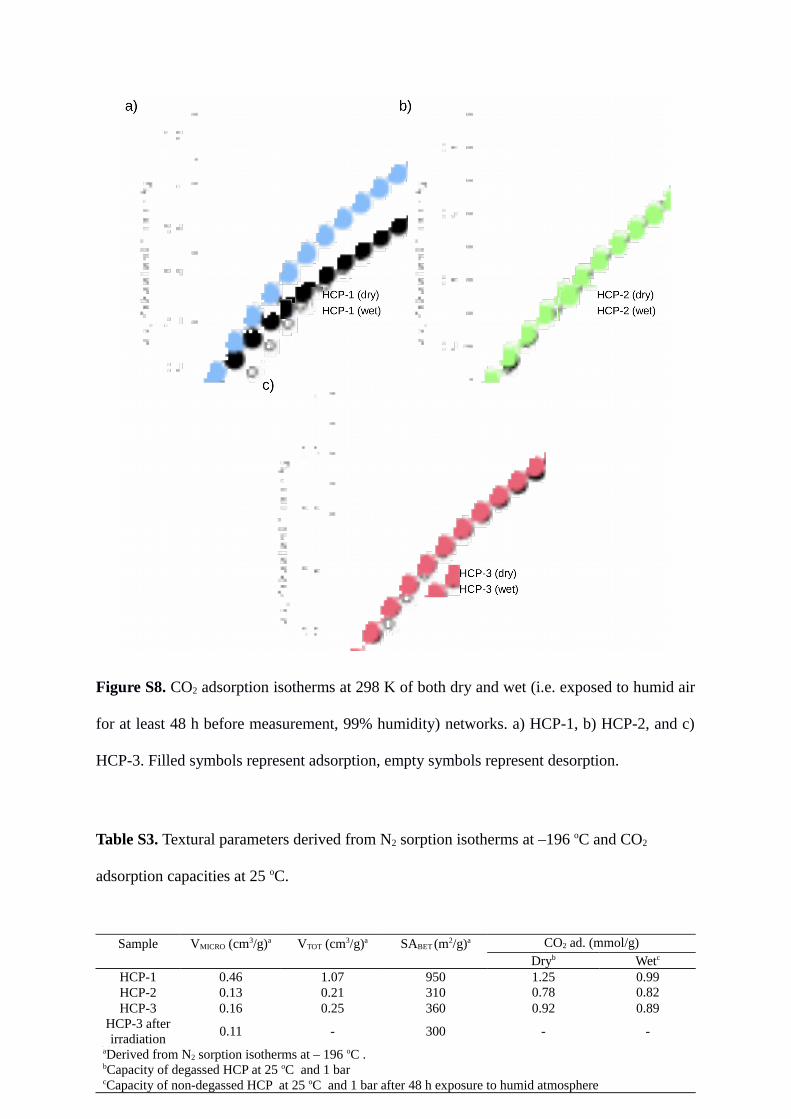
Figure S8. CO2 adsorption isotherms at 298 K of both dry and wet (i.e. exposed to humid air
for at least 48 h before measurement, 99% humidity) networks. a) HCP-1, b) HCP-2, and c)
HCP-3. Filled symbols represent adsorption, empty symbols represent desorption.
Table S3. Textural parameters derived from N2 sorption isotherms at –196 oC and CO2
adsorption capacities at 25 oC.
S18
Sample VMICRO (cm3/g)a VTOT (cm3/g)a SABET (m2/g)a CO2 ad. (mmol/g)Dryb Wetc
HCP-1 0.46 1.07 950 1.25 0.99HCP-2 0.13 0.21 310 0.78 0.82HCP-3 0.16 0.25 360 0.92 0.89
HCP-3 afterirradiation
0.11 - 300 - -aDerived from N2 sorption isotherms at – 196 oC .bCapacity of degassed HCP at 25 oC and 1 barcCapacity of non-degassed HCP at 25 oC and 1 bar after 48 h exposure to humid atmosphere

S19
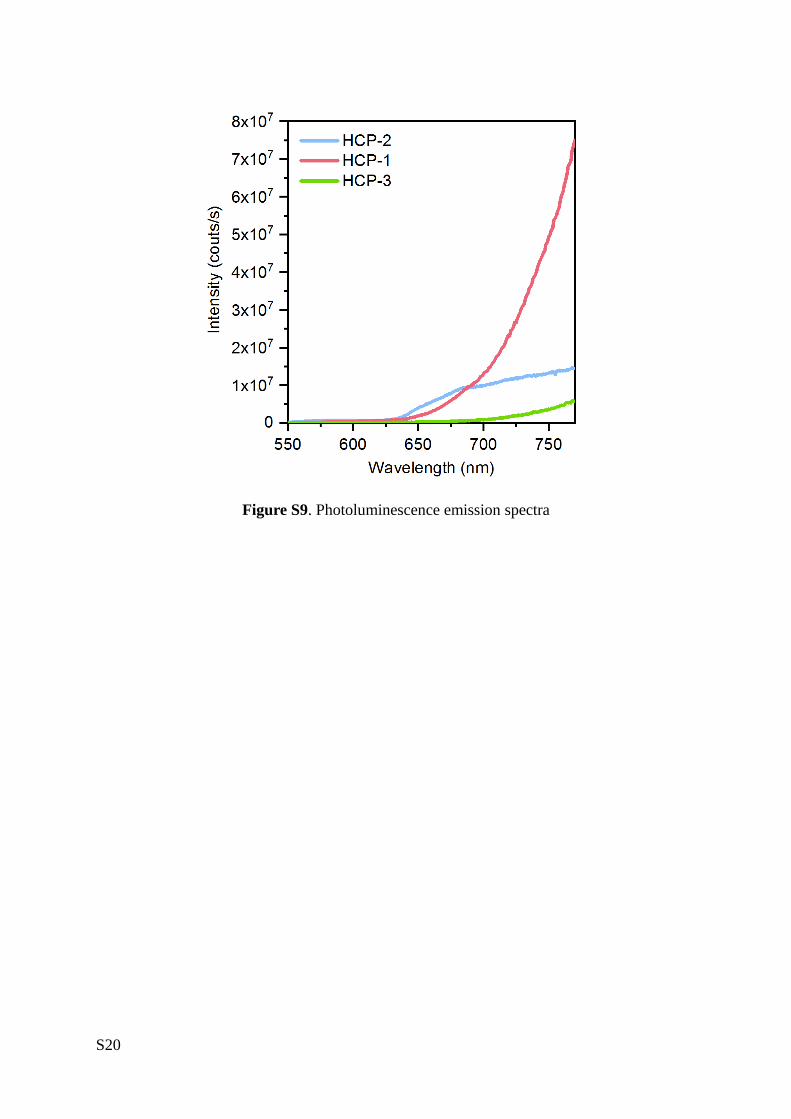
Figure S9. Photoluminescence emission spectra
S20
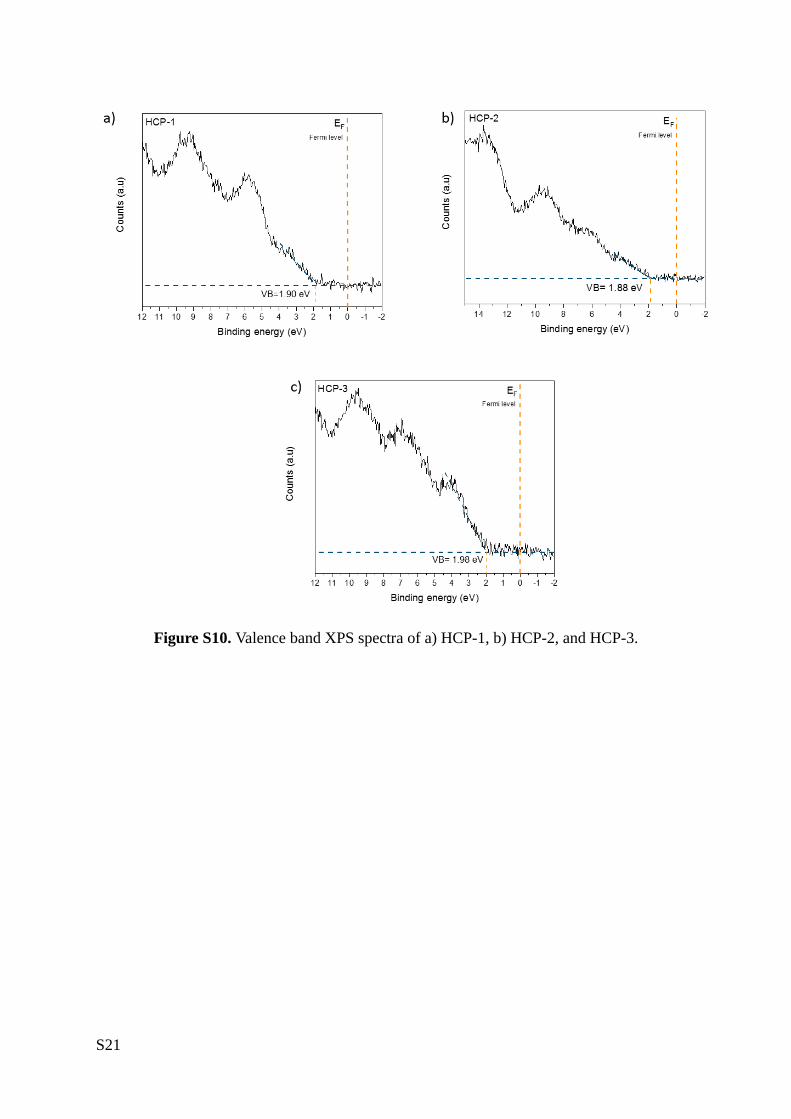
Figure S10. Valence band XPS spectra of a) HCP-1, b) HCP-2, and HCP-3.
S21
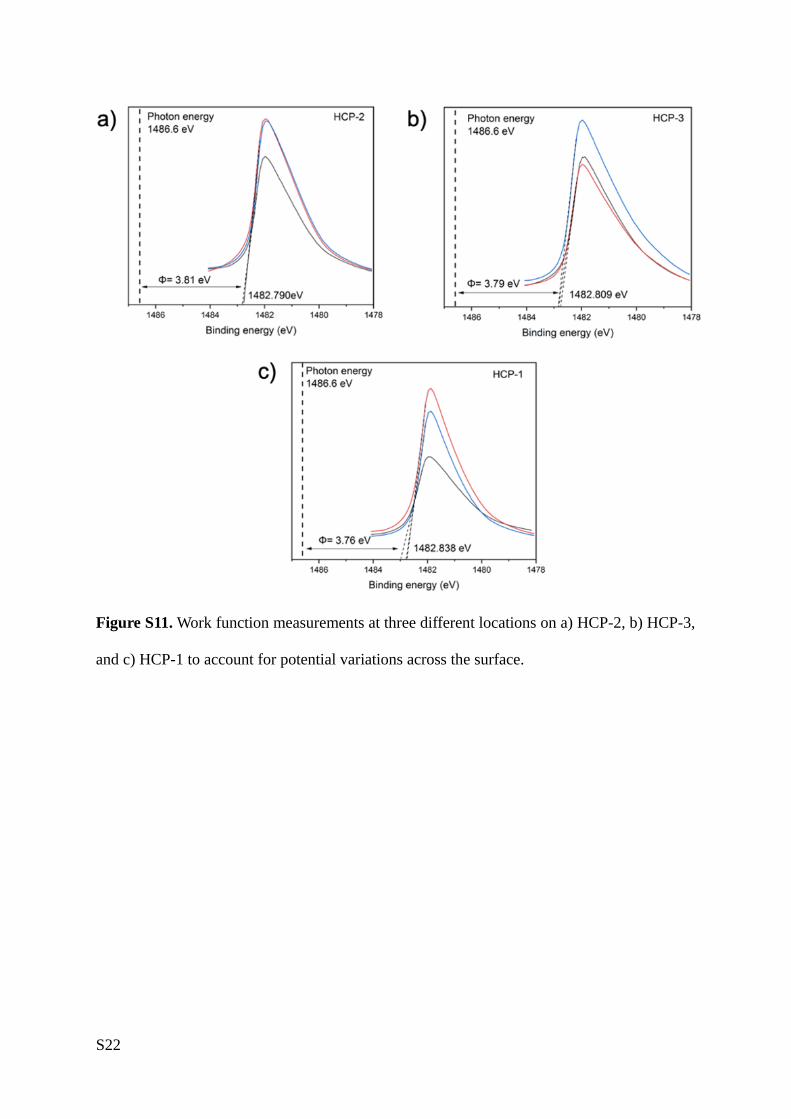
Figure S11. Work function measurements at three different locations on a) HCP-2, b) HCP-3,
and c) HCP-1 to account for potential variations across the surface.
S22

Figure S12. Xenon arc lamp emission spectra, (300W, LOT Quantum Design), equipped with
a water filter.
S23

Figure S13. Photocatalytic gas-solid reactor setup used to evaluate photocatalytic CO2
reduction: 1) CO2 cylinder, 2) H2 generator, 3) mass flow controllers, 4) non-return valves,
5) H2O saturator, 6) photoreactor, 7) Xe arc lamp, 8) pressure transducer, 9) gas
chromatograph, 10) vacuum pump.[3]
S24

Table S4. Photocatalytic evolution rates of HCP-1, HCP-2, HCP-3, and TiO2 P25 and control
experiments
Sample UV-vis (Sacrificial H2) UV-vis (Sacrificial H2O) Visible (Sacrificial H2O)
CO* CH4* CO* CH4
* CO* CH4*
HCP-1 3.7 ± 0.1 0 8.6 ± 0.1 0.4 ± 0.1 4.2 0.1
HCP-2 1.6 ± 0.3 0.1 ± 0.1 4.6 ± 0.5 0.4 ± 0.2 1 0
HCP-3 6.3 ± 0.2 0.5 ± 0.1 15.6 ± 0.9 0.4 ± 0.1 5.2 0.1
P25 (TiO2) 6.4 ± 0.4 0.3 ± 0.2 14.7 ± 0.9 0.3 ± 0.1 0.69 0.2
N2/H2O, nocatalyst
- - 0 - - -
N2/H2O a - - 3.58 (23% c) - - -
N2/H2O repeat a,b - - 3.78 (24% c) - - -
N2/H2O a - - - -0.82 (15% c)
-
N2/H2O repeat a,b - - - - 1.06 (20% c) -
N2/H2 a 0.74 (12% c) - - - - -
N2/H2 repeat a,b 0.61 (10% c) - - - - -
CO2/ H2O, nolight a - - 0.16 (1% c) - - -
CO2/ H2O, nocatalyst
- - 10 ppm - - -
* All data are given in μmol.g-1.h-1
a tests were performed on HCP-3, the leading material of this studyb repeat samples were done on the same sample as the first one, without opening the photo-reactor
c percentage compared to the total activity of HCP-3
S25
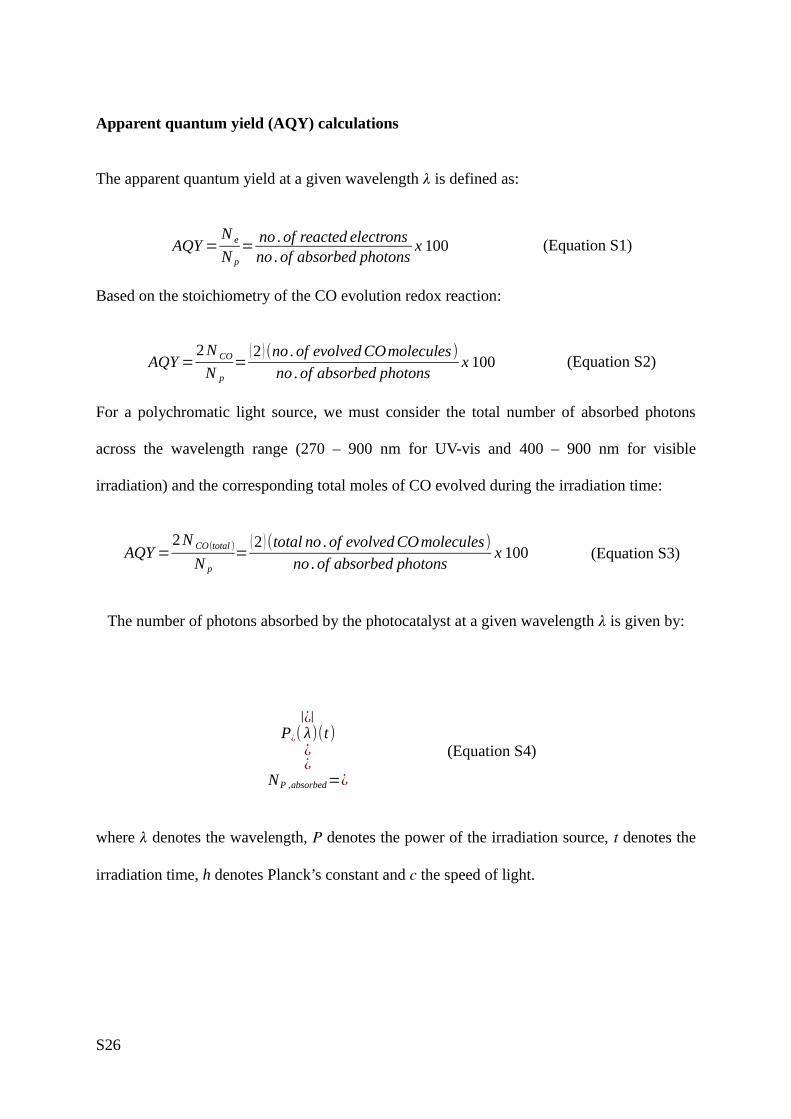
Apparent quantum yield (AQY) calculations
The apparent quantum yield at a given wavelength � is defined as:
AQY =N e
N p
= no .of reacted electronsno .of absorbed photons
x 100 (Equation S1)
Based on the stoichiometry of the CO evolution redox reaction:
AQY =2 N CO
N p
=(2 )(no . of evolved COmolecules)
no . of absorbed photonsx 100 (Equation S2)
For a polychromatic light source, we must consider the total number of absorbed photons
across the wavelength range (270 – 900 nm for UV-vis and 400 – 900 nm for visible
irradiation) and the corresponding total moles of CO evolved during the irradiation time:
AQY =2N CO(total )
N p
=(2 )(total no .of evolved COmolecules)
no .of absorbed photonsx 100 (Equation S3)
The number of photons absorbed by the photocatalyst at a given wavelength � is given by:
|¿|P¿( λ)(t)
¿¿
NP ,absorbed=¿
(Equation S4)
where � denotes the wavelength, � denotes the power of the irradiation source, � denotes the
irradiation time, h denotes Planck’s constant and � the speed of light.
S26

Equation S4 can be written in terms of the intensity of the irradiation as a function of the
irradiation absorbed at wavelength|¿|(λ)
I ¿
λ ,¿, and irradiation area (S) as:
|¿|(λ)I ¿¿
(S)(λ)(t)¿
NP ,absorbed=¿
(Equation S5)
To account for the number of photons absorbed by the photocatalyst at a given wavelength �,
we need to consider the absorbance (A��) of the material at that wavelength and apply the
Beer-Lambert law:
|( λ )|=−log [ I F( λ)I I ( λ) ] (Equation S6)
where I I ( λ ) denotes the intensity emitted from the irradiation source at a given
wavelength � and I F( λ) denotes the intensity after passing through the photocatalyst at
the same wavelength �.
The intensity of irradiation absorbed by the photocatalyst at a given wavelength � is given by:
|¿|( λ )=I I ( λ )−I F ( λ )I ¿
(Equation S7)
which, using equation (S6), can be written as:
Iλ
I¿ (¿)−I I ( λ ) 10−|( λ)|=I I ( λ ) [1−10−|( λ )|]¿
(Equation S8)
S27
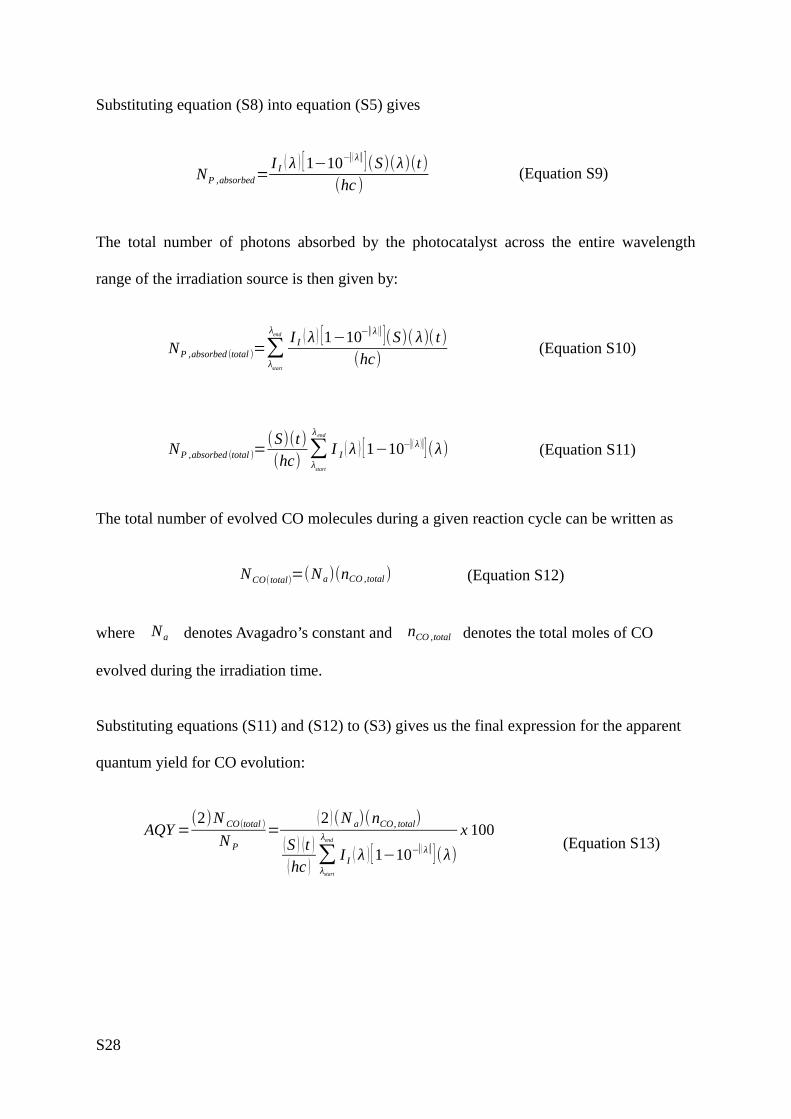
Substituting equation (S8) into equation (S5) gives
NP ,absorbed=I I ( λ ) [1−10−|( λ )|](S)(λ)(t)
(hc )(Equation S9)
The total number of photons absorbed by the photocatalyst across the entire wavelength
range of the irradiation source is then given by:
NP ,absorbed (total )=∑λstart
λend I I ( λ ) [1−10−|( λ )|](S)( λ)( t)(hc)
(Equation S10)
NP ,absorbed (total )=(S)(t)(hc)
∑λstart
λ end
I I ( λ ) [1−10−|( λ )|](λ) (Equation S11)
The total number of evolved CO molecules during a given reaction cycle can be written as
NCO(total)=(Na)(nCO ,total) (Equation S12)
where Na denotes Avagadro’s constant and nCO ,total denotes the total moles of CO
evolved during the irradiation time.
Substituting equations (S11) and (S12) to (S3) gives us the final expression for the apparent
quantum yield for CO evolution:
AQY =(2)N CO(total )
N P
=(2 )(N a)(nCO, total)
(S ) (t )(hc ) ∑λstart
λend
I I ( λ ) [1−10−|( λ )|](λ)
x 100 (Equation S13)
S28
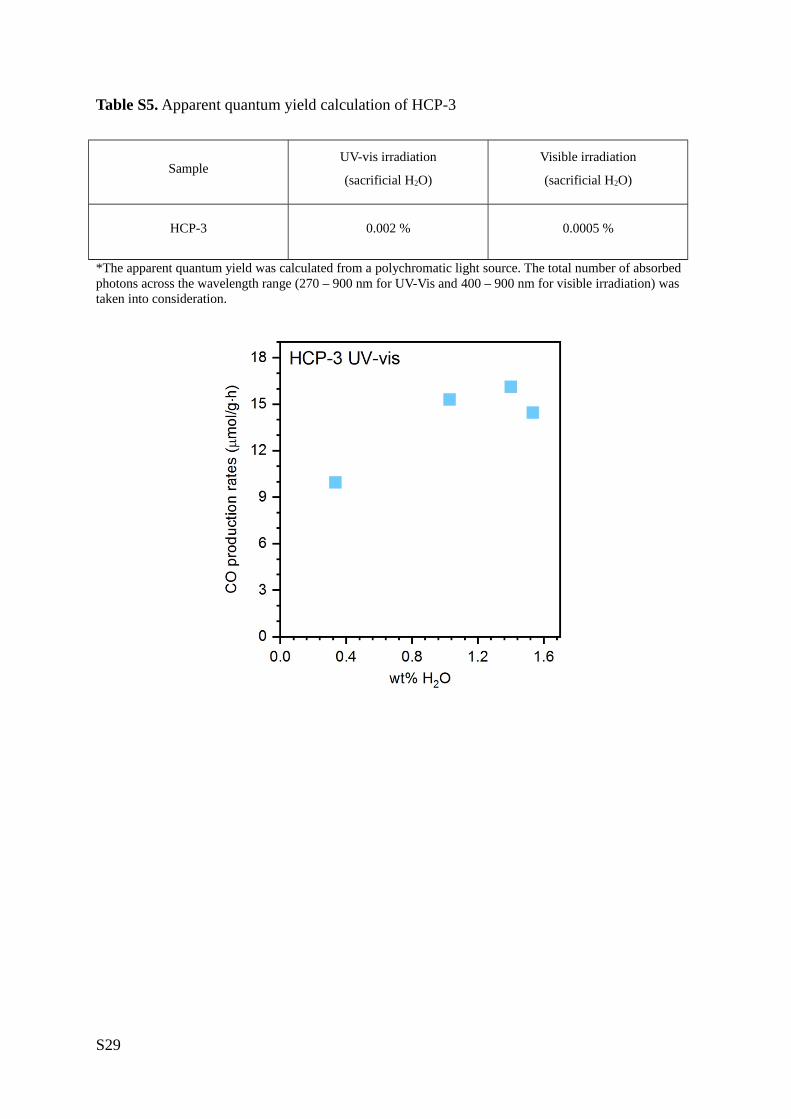
Table S5. Apparent quantum yield calculation of HCP-3
SampleUV-vis irradiation
(sacrificial H2O)
Visible irradiation
(sacrificial H2O)
HCP-3 0.002 % 0.0005 %
*The apparent quantum yield was calculated from a polychromatic light source. The total number of absorbed photons across the wavelength range (270 – 900 nm for UV-Vis and 400 – 900 nm for visible irradiation) was taken into consideration.
S29

Figure S14. CO production rates of HCP-3 under UV-vis irradiation using different water
vapour contents.
S30

Figure S15. Photocatalytic CO evolution from HCP-3 under UV-vis irradiation as a function
of time.
S31
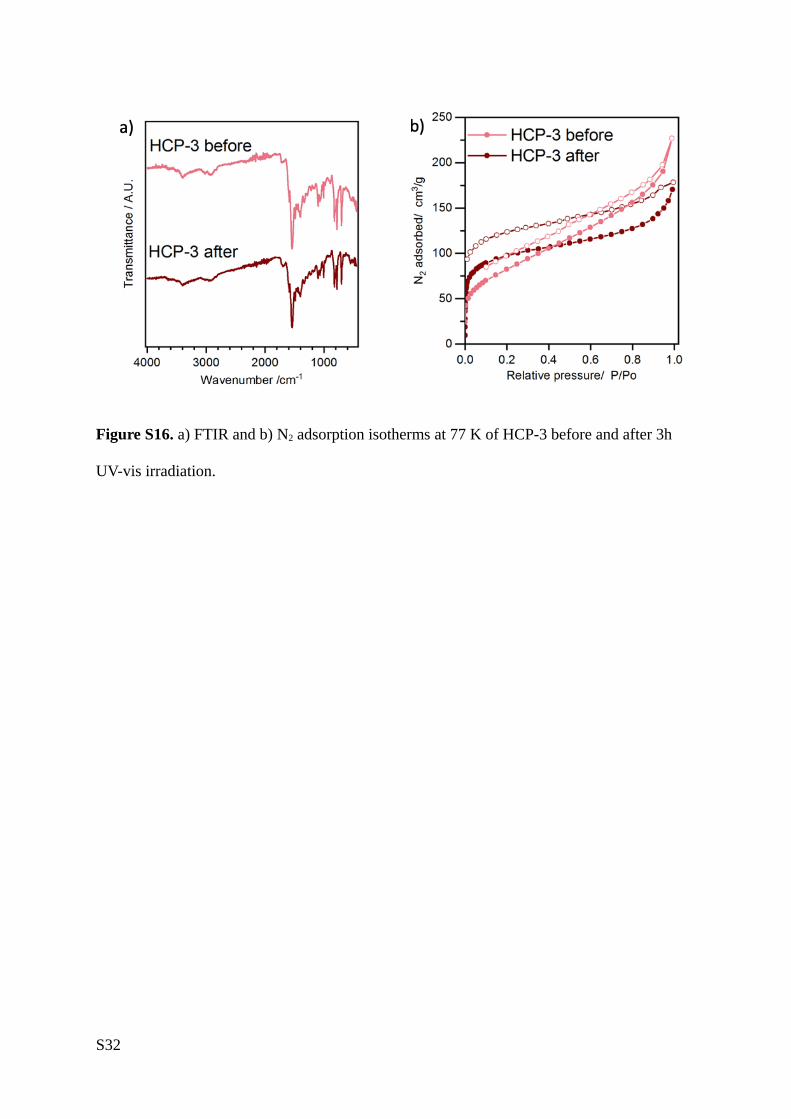
Figure S16. a) FTIR and b) N2 adsorption isotherms at 77 K of HCP-3 before and after 3h
UV-vis irradiation.
S32
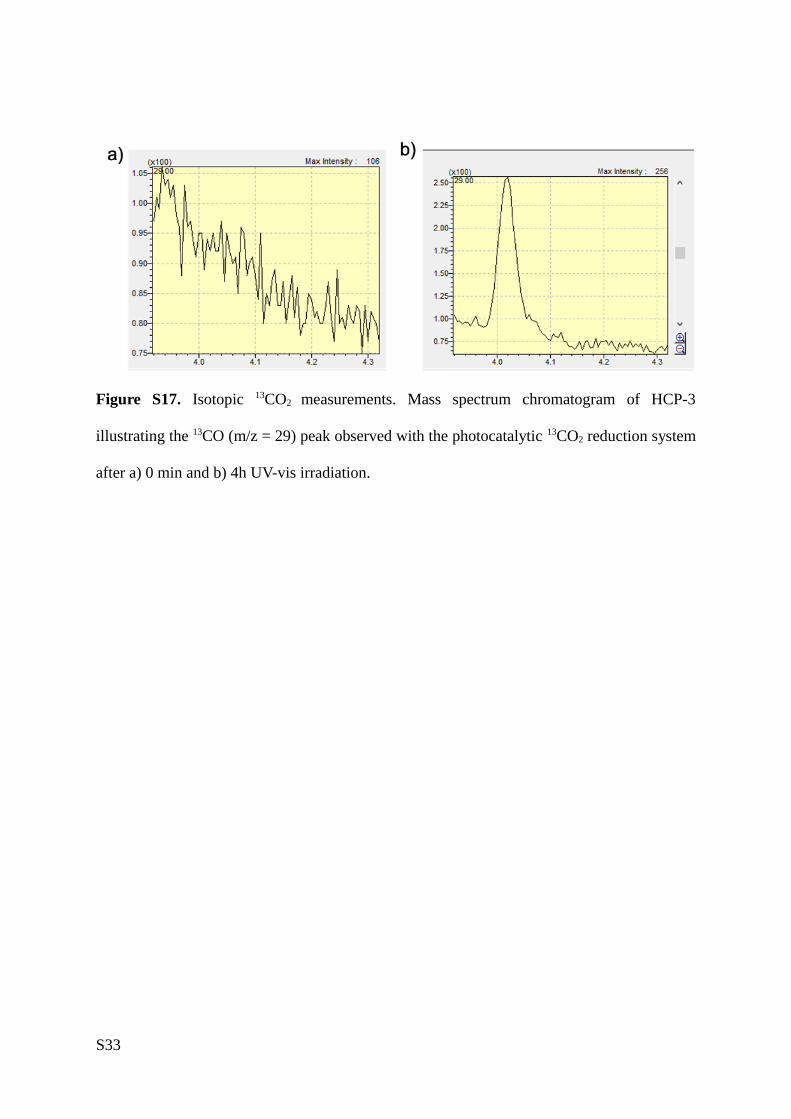
Figure S17. Isotopic 13CO2 measurements. Mass spectrum chromatogram of HCP-3
illustrating the 13CO (m/z = 29) peak observed with the photocatalytic 13CO2 reduction system
after a) 0 min and b) 4h UV-vis irradiation.
S33

Figure S18. H2 production rates of HCPs under UV-vis irradiation using H2O as sacrificial
agent.
S34

4. References
1. Brunauer, S.; Emmett, P. H.; Teller, E., Adsorption of gases in multimolecular layers. Journal of the American chemical society 1938, 60 (2), 309-319.2. Chen, S.; Yang, R., Theoretical basis for the potential theory adsorption isotherms. The Dubinin-Radushkevich and Dubinin-Astakhov equations. Langmuir 1994, 10 (11), 4244-4249.
S35

download fileview on ChemRxivESI_HCP_CO2_250820_CP.docx (17.53 MiB)


![Edinburgh Research Explorer...2017/06/26 · carbon nitride[43 –45], light harvesting polymers[46 48] or carbon quantum dots[49,50] being studied in composites with TiO 2 for photocatalytic](https://img.pdfslide.net/doc/110x75/5ebb1c93293c26209309971e/edinburgh-research-explorer-20170626-carbon-nitride43-a45-light-harvesting.jpg)