Embed Size (px)
Citation preview

NASA Technical Memoran_ 4435i
: -' °"--Tff
.=; ] •
- ;y-_j.'
J
/ •
J l :" ' " ,'"
/ ,
J- ":: V_J
Hypersonic Lateral a_d Directional
Stability Characte cs of;f
Aeroassist Flight EXperiment
Configuration in Air and CF 4
ZZ:ZI
7 =5 "
=
John R. Micol and William L. Wells:;:?ii_2_
q_2 '
=:7::_ZY ::: -7:-_-T,
JUNE 1993
(', ,'.:.-]" -_q35) HYPEv. S,._'IIC LAT:.kAL
_".._ .;I_'_CTICI_L STA31LITY
C_.ARACT_RISTICS C}F AEROASSIST
r-LICHT ±X_'FR[MC_,T CO_FIGU_,ATION IN
AIk ANI_ C_q (NASA) 42 p
';_3-:2 _166
Uncl as
HI/02 0174946
https://ntrs.nasa.gov/search.jsp?R=19930019977 2018-06-18T06:56:39+00:00Z


NASA Technical Memorandum 4435
Hypersonic Lateral and Directional
Stability Characteristics of
Aeroassist Flight Experiment
Configuration in Air and CF 4
John R. Micol and William L. Wells
Langley Research Center
Hampton, Virginia
National Aeronautics andSpace Administration
Office of Management
Scientific and TechnicalInformation Program
1993


Summary
Tile proposed Aeroassist Flight Experiment
(AFE) utilized a 14-ft-diameter raked and bhmted
elliptical cone to demonstrate the flight character-istics of space transfer vehicles (STV's). The AFE
was to be carried to orbit by and launched from
the Space Shuttle orbiter, where instrumentation for
10 on-board experiments would have obtained aero-dynamic and aerothermodynamic data for velocities
near 32000 ft/sec at altitudes above 245000 ft. A
preflight ground-based test program was initiated
to assess the aerodynamic arid aerothermodynamic
characteristics of the baseline concept and to pro-vide benchmark data for calibration of computational
fluid dynamics codes to be used in flight predictions.
The data reported herein are results from one phase
of this ground-based study. Static lateral and di-
rectional stability characteristics were obtained fortile AFE configuration at angles of attack from -10 °to 10 °. Tests were conducted in air at Mach num-
bers of 6 and l0 and in tctrafluoromethane (CF4)
at Mach 6 to examine tile effects of Mach number,Reynolds number, and normal-shock density ratio.
Changes in Mach number from 6 to 10 in air or
in Reynolds number by a factor of 4 at Mach 6 had
a negligible effect on the lateral and directional sta-
bility characteristics of the baseline AFE configura-tion. Variations in density ratio across the normal
portion of the bow shock from approximately 5 (air)
to 12 (CF4) had a measurable effect on lateral and di-
rectional aerodynamic coefficients, but no significant
effect on lateral and directional stability character-istics. The tests in air and CF4 indicated that the
configuration was laterally and directionally stable
through the test range of angle of attack.
Unfortunately, the AFE program was cancelledin late 1991. The realization of an AFE flight in the
future is possible but uncertain. Thus, this paper
documents the lateral and directional aerodynamiccharacteristics of the baseline AFE vehicle for use in
the design of fllture aeroassist space transfer vehicles.
Introduction
Among the space transportation systems pro-
posed for the future are space transfer vehicles
(STV's), which are designed to ferry cargo between
higher Earth orbits (for example, geosynchronous
and lunar orbits) and lower Earth orbit where theSpace Shuttle and Space Station Freedom will op-
erate. (This class of vehicle was formerly referredto as orbital transfer vehicles or OTV's.) Upon re-
turn of the vehicle from high Earth orbit, its velocity
must be greatly reduced to attain a nearly circular
low Earth orbit. This decrease in velocity can beachieved either by using retrorockets or by guiding
the vehicle through a portion of the atmosphere and
allowing aerodynamic drag forces to slow the vehi-
cle. Studies have shown that lower propellant loads
would be required for the aeroassist method (rcf. 1);thus, payloads could be increased.
Future STV's that will be designed to use Earth
atmosphere for deceleration are generally referred toms aeroassisted space transfer vehicles or ASTV's
(formerly AOTV's). These vehicles will have highdrag and a relatively low lift-to-drag ratio and will
fly at very high altitudes and velocities throughout
the atmospheric portion of the trajectory. Before theactual flight vehicle can be designed with optimal
aerodynamic and acrothcrmodynamic characteris-
tics, additional information about very high-altitude,
high-velocity flight is required. To obtain such in-
formation, a subscale flight was proposed wherebya 14-ft-diametcr ASTV configuration with 10 on-
board experiments would be launched from the Space
Shuttle and accelerated back into the atmosphere
with a rocket. This Aeroassist Flight Experiment
(AFE) would make a sweep through the atmosphereto an altitude of about 245 000 ft with a velocity of
nearly 32000 ft/sec to gain aerodynamic and aero-thermal information and return to low Earth orbit
for retrieval by the Space Shuttle. The on-board in-strumentation would measure and record the aero-
dynamic characteristics and aerothermodynamie en-
vironment of this entry trajectory, and the data
would be used to validate computational fluid dy-
namics (CFD) computer codes and ground-to-flightextrapolation of experimental data for use in future
ASTV designs. This flight experiment was proposed
because the high-velocity, low-density flow environ-
ment cannot be duplicated or simulated in presenttest facilities, nor can it be predicted with certainty
by existing techniques.
Naturally, the AFE wouht require an extensiveaerodynamic and aerothermodynamic experimental
and computational data base for its design and sue-
cessful flight. Present test facilities, in conjunction
with the best CFD codes, would provide this infor-
mation. For this reason, a preflight test programin ground-based hypersonic facilities (ref. 2) was
initiated to develop the required aerodynamic and
aerothermodynamic data base. This data base will
be used to perform the first phase of CFD computercode calibration. The experimental results presented
herein are part of an extensive ground-based test
program performed at the Langley Research Center.
Previous results are presented in references 3 6. The
details of the rationale for the flight experiment are

outlinedin reference7, and the set of experiments to
be performed is described in reference 8.
A primary concern for the AFE vehicle is the
aerothermal heating oil the fore- and aftbody thermal
protection system (TPS). Because of these aerother-mal concerns, low values of sideslip angles are desir-
able to minimize heating to the aftbody or payload
and to prevent large thermal fluctuations on the heatshield. Thus, an accurate knowledge of the lateral
and directional stability characteristics of the AFE is
required. (Lateral and directional stability require-ments for a low lift-to-drag aeromaneuvering vehicle
are discussed in ref. 9.)
CFD codes are not generally used to provide aero-
dynamic information for vehicles at sideslip angles.Computed lateral and directional stability charac-
teristics for the AFE would require calculations of
the entire body at various sideslip angles, thus in-
creasing computational time, complexity, and cost.Hence, determination of these stability characteris-
tics for the flight vehicle must rely on experimental
data obtained in ground-based facilities.
This paper addresses the effects of Mach number,
Reynolds nmnber, and normal-shock density ratio (a"real gas" simulation parameter) on lateral and direc-
tional aerodynamic characteristics measured on thebaseline AFE configuration. Tests were conductedat Mach 6 and 10 in air and at Mach 6 in tetra-
fluoromethane (CF4) through a range of angle of at-
tack and sideslip.
During the continuum-flow portion of the flight,the AFE vehicle is expected to undergo normal-shock
density ratios of about 18, whereas conventional hy-
personic wind tunnels that use air or nitrogen as the
test gas only produce ratios of 5 to 7. In flight, this
large density ratio results from dissociation of air asit passes into the high-temperature shock layer. This
real-gas effect may have a significant impact on shock
detachment distance, distributions of heating and
pressure, and aerodynamic characteristics (ref. 10).
For blunt bodies at hypersonic speeds, the pri-
mary factor that governs the shock stand-off distanceand inviscid forebody flow is the normal-shock den-
sity ratio. (See ref. 10.) Certain aspects of a real
gas can be simulated by the selection of a test gasthat has a low ratio of specific heats and provides
large values of density ratio. These conditions can
be obtained in the Langley Hypersonic CF4 Tun-nel, which provides a simulation of this phenomenon
by producing a density ratio of about 12 across the
shock. This tunnel, in conjunction with tile Lang-
ley 20-Inch Mach 6 Thnnel, provides the capability
to test a given model at the same free-stream Maeh
number and Reynolds number, but at two values of
density ratio (5.25 in air and 12.0 in CF4). Thus,
data for code calibration are provided that includethe effects of normal-shock density ratio. Tests were
performed in air at Mach 10 and through a range of
Reynolds numbers at Mach 6 to verify that aerody-
namic characteristics were independent of significantchanges in Math numbers and Reynolds numbers for
the blunt AFE configuration in hypersonic contin-UUln flOW.
However, the AFE program cancellation ended
the research efforts on this configuration. Thus,
this paper documents the lateral and directionalcharacteristics of the baseline AFE vehicle for use in
the design of future aeroassist space transfer vehicles.
Symbols
Cl
Cl 3
Cn f_
Cy
Cy_
d
M
P
q
Re2,d
S
T
U
X
X, y, z
rolling-moment coefficient,
Rolling momentqocdS
= ACI/A[3, per deg
yawing-moment coefficient,
Yawing momentqecdS
= ACn/A/3, per deg
side-force coefficient, Side forceqocS
= ACv/A[], per deg
model length ill symmetry plane,in.
Mach number
pressure_ psia
dynamic pressure, psia
unit free-stream Reynolds
number, ft- 1
postshock Reynolds immberbased on d
reference area, model base area,
in 2 (10.604 in 2 when d = 3.67 in.and 4.936 in 2 when d = 2.50 in.)
temperature, °R
velocity, ft/sec
moment transfer distance in axial
direction (fig. 4), in. (1.673 ill.when d = 3.67 in. and 1.559 in.
when d = 2.50 in.)
axial, lateral, and vertical coordi-
nates for AFE (fig. 4)

O_
/
P
monlent transfer distance in
normal direction (fig. 4), in.
(0.129 in. when d = 3.67 ill. and
0.0979 in. when d = 2.50 in.)
angle of attack, (leg
angle of sideslip, deg
ratio of specific heats of tile test
gas
density of tile test gas, lbm/in :_
Subscripts:
t total conditions
oc free-stream conditions
2 conditions behind the normalshock
AFE Configuration
The AFE flight vehicle wouM consist of a 14-ft-
diameter drag |)rake, an instrument carrier at thebase, a solid-rocket propulsion motor, and smallcontrol motors. A sketch of the vehicle is shown
in figure 1. The drag brake (fig. 2), which is the
forebody configuration, is derived from a bhmted60 ° half-angle elliptical cone that is raked at 73 °
to the cone centerline to produce a circular raked
plane. A skirt, with an arc radius equal to one-
tenth the rake-plane diameter and with an arc length
correspondiilg to 60 ° has I)('en attached to the rake
plane to reduce aerodynamic heating around the I)auset)eril)hery. The t)hmt nose is an ellipsoid with an
ellipticity equal to 2.0 in the symmetry plane. The
ellipsoid nose and the skirt are at a tangent at their
rest)ective intersections to the elliptical cone surface.A detailed description of the forebody analytical
shat)e is presented in reference 11.
Apparatus and Tests
Facilities
Langley 31-Inch Maeh 10 Tunnel. The
Langley 31-Inch Math 10 _iSnmel (formerly the Lang-ley Continuous Flow Hypersonic Tunnel) expands
dry air through a three-(limensional coIltoured nozzle
to a 31-in-square test secti(m to achieve a nonfinal
Math number of 10. The air is heated to approxi-mately 1850°R by an electrical resistance heater, and
the maximum reservoir pressure is approximately
1500 psia. The tunnel operates in the blowdown
mode with run times of approximately 60 sec. Forceand moment data can be obtained through a range
of angle of attack or sideslip during one run |)y uti-
lization of the t)itch-pause cat)al)ility of the model
support system. This tunnel is described in moredetail in reference 12.
Langley 20-Inch Mach 6 Tunnel. The 20-Inch Mach 6 _Dmnel is a blowdown win(t tunnel that
uses dry air as the test gas. The air may be heated to
a maxinmm temperature of approximately 1100°R byan electrical resistance heater: the maximum reser-
voir pressure is 525 psia. A tixed-geometry, two-
dimensional, contoured nozzle with parallel side walls
expands the flow to a Mach number of 6 at the 20-in-
square test. section. The Ino(tel injection mechanism
allows changes in angle of attack and sideslip during
a run. Run durations are usually 60 to 120 sec, al-though longer times can I)e attained by connection
to auxiliary vacuum storage. A description of this
facility and the calibration results are t)resented inreference 13.
Langley 20-Inch Maeh 6 CF, I Tunnel. The
20-Inch Mach 6 CF.1 Tunnel is a blowdown wind
tunnel that uses CF4 a,s the test gas. The CF4
can 1)e heated to a maxinmm temperature of 153(}°F1
by two molten lead t)ath heat exchangers comm('tedin t)aralM. The maxinmm pressure in the tunnel
reservoir is 2600 psia. Flow is exl)ande(t through an
axisymmetric, contoured nozzh' designed to generatea Math mmfl)er of 6 at the 20-in-diameter exit. This
facility has an open-jet test section. Run duration
can be as long as 30 sec, but 10 sec is sufficient
for most te.sts because the model injection system
is not presently cat)able of changing angle of attackor sideslip (luring a run. A detaih'(t description
of the 20-Inch Mach (i CFI tunnel is presented inreference 14.
Just before the present test series, the tunnel wa,s
modified extensiw_ly. Included in those modificationswere a new nozzle, a new test section and model in-
je(:tion system, a new diffuser, an(t iInprovements in
wiring of the controls and of the data acquisition
system. The new nozzle was designed to improve
flow quality along th(' centerline and to more ch)selymatch the Math number in the Math 6 air tunnel
that is often used to I)roduce data for comparison
with the CF4 data. Calibration results (ref. 15) thatwere obtained after the new nozzle was installed indi-
(:ate greatly improved flow unifornfity near the nozzlec(;nterline. For tim present test series, the model was
tested on the tunnel centerline. Previously, modelswere tested off centerline to avoid flow disturbances.
(See ref. 14.)
3

Models
Two aerodynamicmodelswerefabricatedandtested.Themodelswereidenticalexceptforsize;thebaseheights(d in fig.2)at thesymmetryplanewere3.67in. (2.2percentscale)asshownin figure 3(a) and
2.50 in. (1.5 percent scale) as shown in figure 3(b).
Tile 3.67-in-diameter model is made in three parts
a stainless steel forebody (aerobrake), an ahmfinum
aftbo(ly (instrument carrier and propulsion motor),and a stainless steel balance holder. The 2.50-
in-diameter model, shown mounted in tile Langley
20-Inch Ma(:h 6 CF 4 Tunnel in figure 3(c), is fabri-cated of aluminum and does not include the circu-
lar or hexagonally shaped aftbody and tile sinmlated
propulsion motor of previous models that were tested
(ref. 16). A cylinder protrudes from tile base to ac-cept the balance. The acute angle between the bal-
ance and cylinder axis and the base in the symmetry
plane is 73 °. Tile 2.50-in-diameter model was fabri-cated to provide an air gap between the end of tile
balance and the end of the cavity in the forebody;
its purpose was to reduce conductive heating. Forboth Inodels, shrouds were built to shield tile bal-ance from base-flow closure. The shrouds attach to
tile sting, and clearance was provided to avoid in-
terference with the balance during model movementwhen forces and moments were applied. The fore-
bodies were machined to the design size an(I shape
within a tolerance of +0.003 in. Angle of attack (see
fig. 2) and sideslip (see fig. 4) in this paper are refer-enced to the axis of the original elliptical cone.
Instrumentation
Aerodynamic force and moment data were mea-
sured with sting-supported, six-component, water-
cooled, internal strain gauge balances. Two ther-
mocouplcs were installed in the water jacket thatsurrounds tile measuring elements to monitor inter-
nal balance temperatures. The load rating for each
component of tile two balanccs (one for each model
size) is presented in table I. The calibration accuracyis 0.5 percent of the maximuin load rating for each
component.
Test Conditions
The tests were conducted at nominal free-stream
Mach numbers of 6 and 10 in air and at Mach 6
in CF4. (Nominal test conditions are presented in
table II.) The angles of attack for Mach 6 in air were
0° and -1-5° with nominal sideslip anglcs of 0°, -2 °,and -4 °. Tests at Mach 6 in CF4 were at angles of
attack of 0 ° , +5 ° , and +10 ° with nominal sideslip
angles of 0 °, +2.5 ° , and ±5°; at Mach 10 (exceptfor a = -2.5 °, where only a negative /_ sweep was
4
performed), the angles of attack were 00, ±2.5 °, ±5 °,and ± 10 ° with nominal sideslip angles of 0 °, ±2 °, and±4 ° .
Test Procedures
Bhmt models are conducive to heat conduction
through the forcbody face during a run, which gener-
ally produces a gradual increase in temperature gra-dients along the balance even though the balance is
water cooled. Because temperature gradicnts wcrc
not accounted for in the laboratory calibration of thebalance, efforts were made to minimize these gradi-
ents by limiting the test times. In the 20-Inch Mach 6CF4 Tunnel, the model was mounted at the desired
angle of attack and sideslip before the run. After thetest-stream flow was cstablishcd, the model was in-
jected to the test-stream ccntcrline. Data wcrc gath-crcd for approximately 5 sec, then the model was re-
tracted. In the air tunnels, the model was mounted
at (_ = fl = 0° before the run. After test-streamflow was established, the model was injected to the
stream ccnterlinc, then pitched to the next angle of
attack (or sideslip angle) by the pitch-pause mech-anism. Data wcrc taken while the model was sta-
tionary at each position. The balance thcrmocouplcswcrc monitored during each run to assure that the
temperature gradient within the balance remained
within an acceptable limit. Typical run timcs for a
set of _ and fl sweeps in the air facilities wcrc about15 sec.
Data Reduction and Uncertainty
Each of the thrcc test facilitics has a dedicated
stand-alone data system. Output signals from thebalances were sampled and digitized by an analog-
to-digital converter, then stored and processed by
a computer. The analog signals wcrc sampled at
a rate of 50 per second in the Mach 6 CF4 andMach 10 air tunnels and at 20 per second in the
Mach 6 air tunnel. A single value of data reported
herein represents an average of values measured for2 scc in the Mach 6 CF4 and Mach 6 air tunnels andfor 0.5 sec in the Mach 10 air tunnel. Corrections
were made for model tare weights at each angle ofattack and for interactions between different elements
of the balances. Corrections were not made for base
pressures.
Balance-related calculated uncertainties in the
measured static aerodynamic coefficients are given intable III. Thcsc uncertainties are based on balance
output signals related to forces and moments by a
laboratory calibration that is accurate to ±0.5 per-
cent of the rated load for each component. (S_e ta-
ble I.) For the AFE, the moment reference center is

locatedat thecenterof therakeplane.(Seefig. 4.)Thus,momentsreducedaboutthemodelrake-planecenterandreportedhereinhavegreateruncertainties
o
than those measured at the balance moment center.
The yawing and rolling moments at the balance have
an uncertainty of only +0.5 percent of the rated load,
whereas the moment at the rake-plane center also in-dudes uncertainties associated with the forces in the
transfer equation. The transfer equation is
Yawing momentR/, = Yawing monmntl/ - (X) (Side fi)rce)
and
Roiling moment/t/, = Rolling monmnt/_ - (Z) (Side force)
where the subscripts RP and B denote tile rake-plane
center and the balance moment center, respectively.
The transfer distances X and Z are defined in fig-
ure 4. In coefficient form, the uncertainty A relatedto the balance calibration for the side force is
=t=(0.005) (Force rating)
A C y = q:x:S
Tire uncertainty for the yawing moment is
=t=(0.005) (Moment rating)
q_dS
and an identical equation applies for the rolling mo-ment. These balance uncertainties are sufficient for
measurements at the balance moment center. How-
ever, at the rake-plane center, the yawing-momentmmertainty is
0.5
AC,,.x_p = :t: (AC,.t_) _ + AQ_ _-
and the rolling-moment mwcrtainty is
(}.5
[ /AG._p = :k (AG._) 2 + AC:j-_
Note that all the terms inclu<te the free-stream dy-
namic pressure in the denonfinator so that the m_-certainties are less at test conditions where qzc is
large that is, at a higher Reynolds number rather
than at a lower Reynohts mmfl)er. The uncertainty
in dynamic pressure is +3 percent. The flow condi-
tions for which the present uncertainties have beencalculated are presente(t in table II.
Results and Discussions
The aerodynamic data from the Mach 10 air testsare tabulated in table IV. The Mach 6 results arc
presented in tables V and VI for air and in table VIIfor CF4. The test Reynolds number and modeldiameter are indicated in each table title.
The aerodynamic coefficients Cy, Cn, and C l are
plotted for an angle-of-sideslip range at various an-gles of attack in each facility and presented in fig-
ures 5 -7 for Math 10 in air, Mach 6 in air, and Mach 6
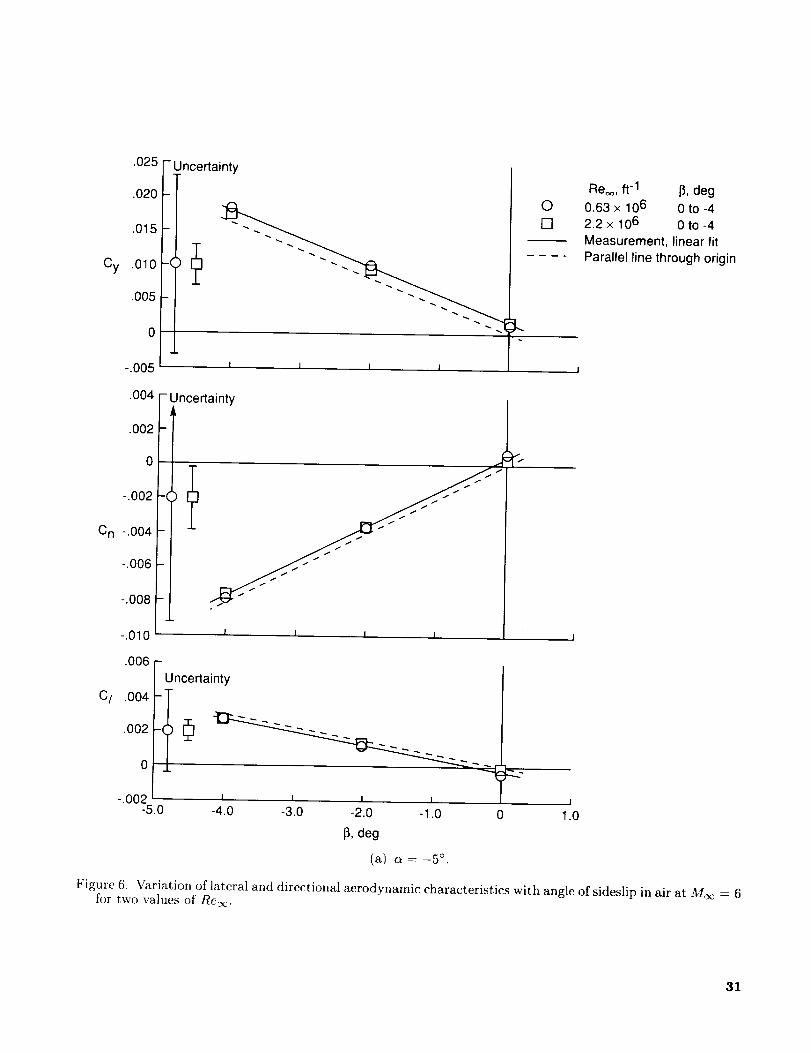
in CF4, respectively. Data obtained at Maeh 6 in
air (fig. 6) indicated no effect of Reynolds numberon measured lateral and directional coefficients for
a factor-of-4 increase in postshock Reynolds num-
ber. (Similar trends with respect to Reynolds num-
ber were also observed for AFE longitudinal acro-
dynamic characteristics presented in ref. 16 in which
a negligible effect of Reynohts number was notedfor Maeh 6 and 10 in air and at Mach 6 in CF4.)
Therefore, the assumption is made that the effect
of Reynolds number on measured lateral and direc-tional data at Mach 10 in air and Math 6 in CF4
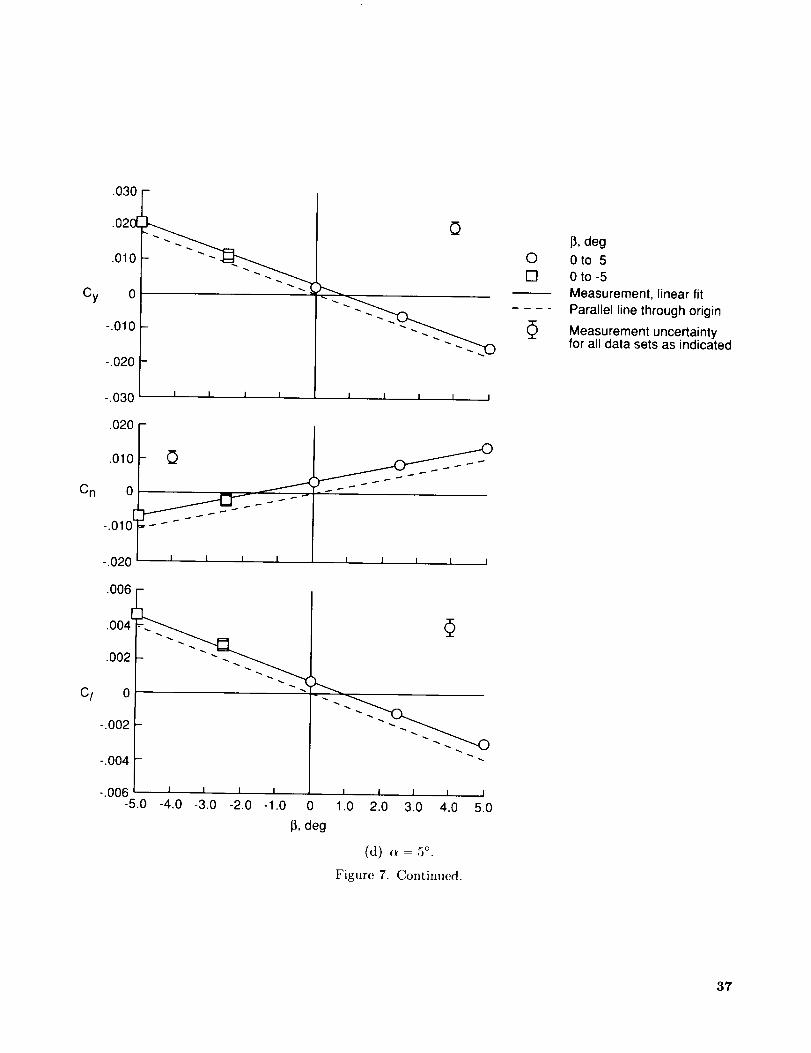
is also negligible. The data are amenable to linear
curve fit.s as shown in figures 5 7, for which the ordi-
nate scale is quite sensitive. These curves wouht be
expected to go through the origin because the mode/
wa,s symmetrical about the pitch plane. However, asobserved in figures 5 7, an offset exists. This offset
may be attributed to model misalignment or t.o any
small stray signal in the data system that could cause
a constant data offset because of the very small val-ues being measured relative to the load range of thebalance.
For example, if a slight misalignment of the model
in tire roll direction were introduced during modelsetup or if the balance location within the model were
slightly misaligned, thereby producing a small offset
in the center of gravity location (that is, within a
few thousandths of an inch) in the side plane (y di-rection in fig. 4), then the effect of the large axial-
force component on this small moment arm may pro-
duce a continuous bias in the measured quantities,For instance, from reference 16 at (_ = 3 = 0 °,
Re:,c = 0.46 x 10⁶/ft, and Mach 6 in CF4, the axial-
force coefficient is 1.382. The yawing-moment coeffi-cient, from table VII for similar conditions, is 0.004.
In much the same way as the change in the cen-
ter of pressure in longitudinal aerodynamics is lo-cated, forming the ratio of yawing-moment coeffi-
cient to axial-force coefficient yields the moment arm
in the y direction, which for this case is approxi-
mately 0.003 in. and thus within acceptat)le fabri-cation tolerances. A second linear curve, paralM 1o
the data-faired curve, is drawn through the origin in

each part of figures 5 7. Values from measurements
and the curve through the origin of figures 5 7 are
presented in tables IV VII. Use of the slopes of these
parallel curves through the origin to represent the
lateral and directional stability derivatives should be
valid because the data curves are linear through the
test sideslip range.
The lateral and directional stability derivatives
are presented in figure 8 and table VIII through the
range of angle of attack for which tests were per-
formed in each facility. For all test conditions, the
configuration was laterally and directionatly stable,
as indicated by the positive values of Cn;_ and nega-
tive values of Cl/_. A comparison of lateral and direc-
tional stability derivatives obtained at Mach num-
bers of 6 and 10 in air illustrates no significant
effect of Mach number on stability characteristics; a
comparison of these stability derivatives with those
obtained at Mach 6 in CF4 indicates a small but
measurable effect of normal-shock density ratio on
lateral and directional stability characteristics. Al-
though the numerical values for air and CF4 are not
greatly different, the data trends in air and CF4 ap-
pear to be opposite. (Similar trends were observed
in the longitudinal aerodynamic characteristics dis-
cussed in ref. 16.) This trend is most obvious for
Ci,3, wherein the small numerical values require an
expanded scale on the graph. The wind tunnel re-
sults in CF4 are believed to be a better sinmlation
of flight data than those in air because the shock de-
tachment distance for CF4 is closer to the distance
predicted tot the actual flight case. (For example, see
refs. 6 att(t 16.)
Concluding Remarks
Static lateral and directional stability character-
istics were obtained for the Aeroassist Flight Exper-
iment (AFE) configuration through a range of angle
of attack from -10 ° to 10 ° . Tests were conducted
on two different-sized models at Mach numbers of 6
and 10 in air and at a Mach number of 6 in tetra-
fluoromethane (CF4). The effects of Maeh number,
Reynolds number, and normal-shock density ratio on
lateral and directional stability characteristics were
examined.
Changes in Mach number from 6 to 10 in air or
in Reynolds number by a factor of 4 at Maeh 6 had
a negligible effect on the lateral and directional sta-
bility characteristics of the baseline AFE configura-
tion. Variations in density ratio across the normal
portion of thc bow shock from approximately 5 (air)
to 12 (CF4) had a measurable effect on lateral and
directional aerodynamic coefficients, but no signifi-
cant effect on lateral and directional stability char-
acteristics. The tests in air and CF4 indicated that
the configuration is laterally and directionally stable
through the test range of angle of attack as indicated
by the positive values of Cnz and negative values of
C/:_ (positive effective dihedral).
In late 1991, the AFE program was cancelled and
thus ended research efforts on this configuration. The
realization of an AFE flight in the future is possible
but uncertain. Hence, this paper documents the
lateral and directional aerodynamic characteristics
of the baseline AFE vehicle for use in the design of
future aeroassist space transfer vehicles.
NASA Langley Research Center
Hampton, VA 23681-0001
March 25, 1993
References
1. Walberg, Gerald D.: A Review of Aeroassisted Orbit
Transfer. AIAA-82-1378, Aug. 1982.
2. Wells, William L.: Wind-T_mnel Preflight Test Program
for Aeroassist Flight Experiment. Technical Papers
AIAA Atmospheric Flight Mechanics Conference,
Aug. 1987, pp. 151_ 163. (Available as AIAA-87-2367.)
3. Wells, William L.: Free-Shear-Layer Turning Angle in
Wake o| Aeroassist Flight Experiment (AFE) Vehicle at
Incidence in M = 10 Air and M = 6 CF4. NASA TM-
100479, 1988.
4. Micol, John R.: Experimental and Predicted Pressure, and
Heating Distributions for Aeroa,ssist Flight Experiment
Vehicle. ,l. TheTwmphys. _ Heat Transl., July Sept. 1991,
pp. 301 307.
5. Wells, William L.: Surface Flow and Heating Distributions
on a Cylinder in Near Wake of Aeroassist Flight Experi-
ment (AFE) Configuration at Incidence in Mach 10 Air.
NASA TP-2954, 1990.
6. Micol, John R.: Simulation of Real-Gas Effects on Pres-
sure Distributions for Aeroassist Flight Experiment Vehi-
cle and Comparison With Prediction. NASA TP-3157,
1992.
7. Jones, Jim J.: The Rationale for an Aeroassist Flight
Experiment. AIAA-87-1508, June 1987.
8. Walberg, G. D.; Siemers, P. M., III; Calloway, R. L.;
and Jones, J. J,: The Aeroassist Flight Experiment. IAF
Paper 87-197, Oct. 1987.
9. Gamble, Joe D.; Spratlin, Kenneth M.; and Skalecki, Lisa
M.: Lateral Directional Requirements for a Low L/D
Aeromaneuvering Orbital Transfer Vehicle. A Collection
of Technical Papers AIAA Atmospheric Flight Mechan-
ics Conference, Aug. 1984, pp. 402 413. (Availabh. as
AIAA-84-2123.)

10.Jones,RobertA., andHunt,JamesL. (appendixAbyJamesL. Hunt,KathrynA. Smith,andRobertB.ReynoldsandappendixBby,JamesL. HuntandLillianR.Boney):L,_eof Tetrafluoromethane To Si_rtulate Real-
Gas Effects on the Hypersonic Aerodynamics of Blunt
Vehicles. NASA TR R-312, 1969.
11. Cheatwood, F. McNeil; DeJarnette, Fred R.; and ttamil-
ton, H. Harris, II: Geometrical Description for a Pro-
posed Aeroassisted Fli,qht Experinzent l,'_h_ele. NASA TM-
877'14, 1986.
12. Miller, C. G.: Langley Hypersonic
Aerothermodynamic Testing Capabilities
Future. AIAA-90-1376, June 1990.
Aerodynamic/
Present and
13. Miller, Charles G., Ill; an(t Gnoffo. Peter A.: Pressure
Distributions and Shock" Shapes for 12.84°/7 ° On-Axis
and Bent-Nose Bieonies in Air at Maeh 6. NASA TM-
83222, 1981.
14. Midden, Raymond E.', and Miller, Charles G., IIl: De-
scription and Calibratior_ of the Langley Hypersome CF4
Tunnel A Facility for Simulating Low "_ Flow as Oeeutw
for a Real Gas. NASA TP-2381, 1985.
15. Micol. John R.; Midden, Raymond E.; and Miller, Charles
G., llI: Langh,y 20-In('h Hypersonic CF4 Tmmel: A Facil-
ity for Simulating Real-Gas Effects. AIAA-92-3939. July
1992.
16. Wells, William L.: Measured a_d Predicted Aerody_mmie
CoeJJicien_s and Shock Shapes for Aeroassist Fhght Exper-
iment (AFE) ConfiguratioTt. NASA TP-2956, 1990.

Table I. Balance Load Ratings Used in Tests
Load rating
Model size, in. Side, lbf Roll, in-lbf3
15
2.50
3.67 Yaw, in-lbf2 3
10 15
ft- l
1.09 x 10⁶ [
0.63 x 10 (;
2.21
Table II. Nominal Test Conditions
ll_] I T_' [- P_' T_ U_¢, q_ ------_in2 I R llbf/in2 R Moc I ft/see lbf/in 2 P2/P_c I
Re2,ft-1
70o118,00.017519,.719.9014651I 1.20I 6.oLangley 20-Inch Mach 6 Tunnel; air as test
30 845
126 910
Langley 31-Inch Maeh 10 Tunnel; air as test gas
I0.87 x 105 ]
gas
0.023 108.3 5.84 2975 0.54 5.2 0.96 x 10⁵
.084 112.5 5.94 3095 2.10 5.2 3.50
Langley 20-Inch Maeh 6 Tunnel; CF4 as test gas
0.46x10⁶ 1515 1280 0.063 1386 5.87 3000 I 1.29 11.8 1.77
2.23 11810 1.34
1.00 845 1.40
3.86 910 1.40
_ 2.54 1271 1.10
Table III. Balance-Related Uncertainties in Experimental Lateral
and Directional Aerodynamic Coefficients
Re2, d I d, in. I ACl, i ACn, -t- ACy, _
2$toc = 10 air as test gas
18042 l 2.50 l 0.0007 i 0.0019 l 0.0025
M_c = 6; air as test gas
29400 t 3.67 I 0.0024 0.0069 0.0131107000 3.67 .0006 .0018 .0034
Moc = 6; CF4 as test gas
37000 L 2.50 _ 0.0006 I 0.0017 l 0.0023
8

TableIV. MeasuredLateralandDirectionalAerodynanlieCharacteristicsin Airfor Aide,= 9.90,/Re_= 1.09x 10⁶/[t,Re'2.d = 18042, and d = 2.50 in.
[Numbers with asterisk are derived from curve through 0,(/in fig. 5]
(a) c_= 0°
_,deg
-0.019
.098
-.024
-.019-.015
-.054
-.031
.052-2.113
-2.157
-2.063
-2.085
2.242
2.0992.225
2.075
-4.296
-4.3024.364
4.350
O*-2.0*
2.0*
-4.0*4.0*
c_
0.00096
.00101
.00126
.00111
.00138
.00103.00155
.00171
.00281
.00309
.00251.00308
-.00041
-.00021
-.00034-.00039
.00426
.00463
-.00173-.00171
O*
.00145*
-.00145*.00290*
-.00290*
C71
0.00161.00328
.00197
.00181.00259
.00252
.00306
.00375
-.00248
-.00152-.00169
-.00103
.00589
.00597.00676
.00667
-.00666
-.00520.01030
.01058
O*-.00377"
.00377*
-.00755"
.00755*
Cy
-- 0.00826.00273
.00562
.00775
.00314
.00650
.00327
.00386
.01521
.01305
.01238.01323
-.00079
.00098
-.00464-.00221
.02418
.02051
-.00987
-.01067
O*.00740*
-.00740"
.01480*-.01480*
L
9

TableIV. Continued
(b) a = 2.5°
_, deg G C. Cy-0.011
-2.114
-4.316
-2.090
.065-.017
2.233
4.410
2.130-.003O*
-2.0*
2.0*
-4.0*4.0*
0.00104
.00282
.00438
.00253.00101
.00110
-.00032
-.00228-.00071
.00126O*
.00152'-.00152'
.00304*
-.00304*
0.OO188
.00222
.00699
.00221
.00241
.00192
.00632
.01057
.00645
.00282O*
-.00402*.00402*
-.00804*.00804*
0.00692
.01328
.02341
.01468
.00591
.00554
-.00226
-.00934-.00284
.00379O*
.00757*-.00757*
.01514*
-.01514"
(c) a = -2.5 °
_, deg
-0.022
-2.169
-4.280-2.083
.0550*
-2.0*
-4.0*
0.00126
.00240.00425
.00262
.00111O*
.00140'
.00280"
CTt
0.00219-.00261
-.00626
-.00168
.00265O*
-.00408"
-.00816*
0.00426
.01508
.02186
.01270
.00359O*
.00850*
.01700"
10

_, deg-0.006
2.2454.3802.076-.037-.013
-2.113-4.252-1.998
.078O*
-2.0*2.0"
-4.0*4.0*
TableIV. Continued
(d) a = 5.0°
CI
---_0.00116
-.00057
-.00225
-.00048
.00113
.00136
.00307
.00479
.00293
.00122
O*.00164*
-.00164*
.00328*
-.00328*
C71
0.00181.00682
.01168
.00674
.00227
.00206
-.00308
-.00775
-.00254
.00251
O*-.00452*
.00452*
-.00903*
.00903*
Cy
0.00645
-.00293
-.01189-.00302
.00667
.00528
.01548
.02400.01485
.00536
O*.00841*
-.00841*
.01681*
-.01681*
(e) a= -5.0 °
2, deg CI C,, C_0.00182 0.00544
-0.027
2.1914.379
2.050
-.065
-.018
-2.155-4.319
-2.057
.055
O*-2.0*
2.0*
-4.0*
4.0*
0.00127-.00045
-.00191
-.00036.00120
.00128
.00266
.00664
.01057.00660
.00249
.00202
-.00198
-.00389
-.01165-.00391
.00389
.00500
.01200
.00394
.00245.00092
O*
.00136*-.00136*
.00273*
-.00273*
-.00607
-.00172
.00225
0*-.00388*
.00388*
-.00777*
.00777*
.02079
.01178
.00498
O*
.00746*
-.00746*.01492*
-.01492*
11

TableIV. Concluded
(f) c_ = 10.0 °
/3, deg
-0.0152.237
4.334
2.096
.004
-.015-2.068
-4.203
-2.012
.1140*
-2.0*2.0*
-4.0*
4.0*
G0.00071
-.00148-.00346
-.00152
.00065
.00040
.00260
.00417
.00227
.00011O*
.00182*-.00182*
.00363*
-.00363*
0.00167
.00798.01335
.00780
.00264
.00224-.00342
-.00868
-.00260
.00331O*
-.00517*
.00517*
-.01034*
.01034*
0.00508
-.00585
-.01427
-.00523
.00383
.00421
.01295
.02153.01033
.00200O*
.00833*
-.00833*
.01665*
-.01665*
(g) (_= -10.0 °
3 deg
-0.017
2.209
4.2892.104
.011
-.015-2.141
-4.201
-1.999
.098O*
-2.0*
2.0*
-4.0*4.0*
0.00145
-.00054
-.00228-.00053
.00119
.00123
.00311
.0O472
.00303
,00129O*
.00167*
-.O0167*
.00334*
-.00334*
0.00066
.00590
.01080
.00669
.00212
.00056-.00414
-.00836
-.00340
.001920*
-.00460*.00460*
-.00920*
.00920*
0.00584
-.00347
-.01404
-.00536.00217
.00612
.01723.02457
.01536.00446
O*
.00933*
-.00933*.01865*
-.01865*
12

TableV. MeasuredLateralandDirectionalAerodynamicCharacteristics in Air for
Aim = 5.84, Rem= 0.63 × 10⁶/ft Re2,d = 29 400, and d = 3.67 in.
[Numbers with asterisk are derived from curve through 0,0 in fig. 6]
(a) _ = 0°
(3, deg CI Cn Cy
0.0
-2.0
-4.00*
-2.0*
-4.0*
-0.0004.0010
.0026
O*.0015"
.0030*
0,0003-.0036
-.0078
O*-.0043*
-.0085*
0.0018.0093
.0176
O*.0080"
.0159"
(b) a = 5 °
i3, deg CI C,_ C u
0.0
-2.0
-4.00*
-2.0*
-4.0*
-0.0003
.0013
.00310*
.0017"
.0034*
0.0006-.0040
-.0086
O*-.0046*
-.0092*
0.0022.0102
.0183
O*.0079*
.0158"
_,deg C1
0.0
-2.0
-4.0
0*
-2.0*-4.0*
-0.0004
.0012
.0027
O*
.0015'
.0030*
(c) a = -5 °
C_
0.0007
-.0036-.0078
O*
-.0041"
-.0081"
Cy
0.0018
.0101
.01840*
.0080*
.0160'
13

TableVI. MeasuredLateralandDirectionalAerodynamicCharacteristicsin Air forM_ = 5.94, Re_c = 2.21 x 10⁶/ft, Re2, d = 107000, and d = 3.67 in.
[Numbers with asterisk are derived from curve through 0,0 in fig. 61
,5', deg
0.0
-2.0
-4.0
O*
-2.0*
-4.0*
(a) a = 0°
@ c_-0.0002 0.0004
.0014 -.0039
.0030 -.00820* 0*
.0015" -.0043*
.0030" -.0085*
c_
.0097
.01780*
.0080*
.0159"
(b) a=5 °
_, deg
0.0
-2.0
-4.0O*
-2.0*
-4.0*
@-0.0003_
.0014
.0031O*
.0017".0034"
c_
0.0006_
-.0040-.00850*
-.0046*
-.0092*
c_0.0020
.0097
.0175O*
.0079*
.0158"
8, deg
0.0
-2.0-4.0
O*
-2.0*-4.0*
(c) a = _5 °
.0013
.00280*
.0015"
.0030*
c_
o.ooo-$_-.0035
-.0076O*
-.0041"
-.0081"
c_0.0019
.0095
.01740*
.0080*
.0160"
14

TableVII. MeasuredLateralandDirectionalAerodynamicCharacteristicsin CF4forMx_ = 5.87, Revc = 0.46 x 10⁶/ft, Re2,d = 37000, and d = 2.50 in.
[Numbers with asterisk are derived from curve through 0,0 in fig. 71
(a) c_= 0°
_, deg
0
0
2.502.50
5.0
5.0
-2.50-2.50
-5.0
-5.0
0*-2.5*
2.5*
-5.0*
5.0*
CI Cn
0.0000
.0008
-.0016
-.0015-.0035
-.0035
.0032
.0033
0.0037
.0036
.0094
.0094
.0144
.0148
-.0028-.0029
.0048
.0053
O*
.0024*-.0024*
.0047*
-.0047*
-.0084
-.0085
0*
-.0064*-.0064*
-.00128*
.00128*
Cy
0.0017
.0021
-.0084-.0086
-.0179
-.0187
.0136.0136
.0234
.0237
O*.0108"
-.0108"
.0215"-.0215"
(b) a = 5°
_,deg Cl Cn Cy0.0026
0.0
2.50
5.0-2.50
-5.0
O*-2.5*
2.5
-5.0*
5.0*
0.0007
-.0012-.0030
.0027
.0046
O*.0020*
-.0020*
.0039*-.0039*
0.0035
.0084.0133
-.0018
-.0066
O*-.0050*
-.0050*
-.0099*.0099*
-.0061-.0152
.0121
.0212
O*.0093*
-.0093*
.0185"-.0185"
15
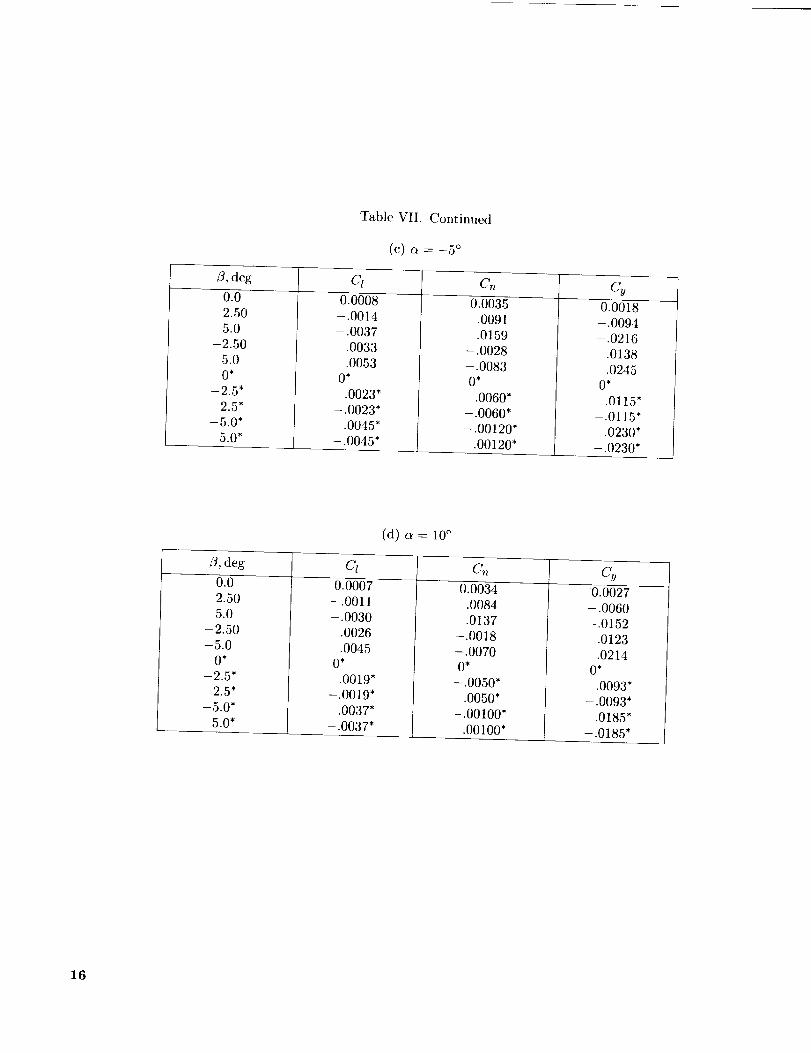
TableVII. Continued
(c) _ = -5 °
fl, deg Cl Cn Cy0.0
2.505.0
-2.50
-5.0O*
-2.5*
2.5*
-5.0*5.0*
0.0008
-.0014
-.0037
.0033
.0053O*
.0023*
-.0023*.0045*
-.0045"
0.0035
.0091
.0159-.0028
-.0083O*
-.0060"-.0060*
-.00120"
.00120*
0.0018
-.0094-.0216
.0138
.0245O*
.0115"
-.0115"
.0230"-.0230*
(d) a = 10 °
fl, deg Cl Cn Cy0.0
2.50
5.0
-2.50
-5.0O*
-2.5*2.5*
-5.0*
5.0*
0.0007-.0011
-.0030
.0026
.0045O*
.0019"
-.0019"
.0037*
-.0037*
0.0034
.0084
.0137
-.0018
-.0070O*
-.0050*
.0050*
-.00100'
.00100'
0.0027
-.0060
-.0152.0123
.0214O*
.0093*
-.0093"
.0185"
-.0185"
16

TableVII, Concluded
(e)a = -10°
i3, deg CI Cn C,_
0.0
2.505.0
-2.50
-5.0O*
-2.5*
2.5*
-5.0*
5.0*
0.0011
-.0011-.0029
.0031
.00490*
.0020'
-.0020*
.0040*
-.0040*
0.0035
.0086
.0138
-.0041
-.0078O*
-.0053*
.0053*
-.00106*.00106*
0.0010-.0101
-.0213
.0131
.0248O*
.0118'
-.0118"
.0235*-.0235*
17

TableVIII. LateralandDirectionalStabilityCharacteristics
(a) Mc¢ = 9.90; Reoc = 1.09 × 10⁶/ft; Re2, d --- 18 042; d = 2.50 in.; air as test gas
c_, Cyst, Cn_, Ct_s,
deg deg- 1 deg- 1 deg- 1
-9.80
-4.77-2.31
.21
2.73
5.26
10.35
-0.004663
-.003730
-.004249-.003700
-.003785
-.004203
-.004163
0.002299
.001942
.002040
.001887
.002010
.002258
.OO2585
-0.000834
-.000682
-.000699-.000725
-.000760
-.000821
-.000908
(b) M_c = 5.84; Re_c = 0.63 × 10⁶/ft; Re2, d = 29400; d = 3.67 in.; air as test gas
deg-5.0
0
5.0
cuz,deg- 1 deg - 1 deg- 1
-0.0040
-.0040
-.0040
0.0020
.0021
.0023
-0.00075-.00075
-.00084
(c) M_ = 5.94; Re_ = 2.21 × 10⁶/ft; Re2, d = 107000; d = 3.67 in.; air as test gas
deg deg -1 deg -1 deg -1-5.0 -0.0040 0.0020 -0.00075
0 -.0040 .0021 -.00075
5.0 -.0040 .0023 -.00084
(d) M_ = 5.87; Rec¢ -- 0.46 × 10⁶/ft; Re2, d = 37000; d = 2.50 in.; CF4 as test gas
deg deg -1 deg -1 deg -1-10.0
-5.00
5.0
10.0
-0.0047
-.0046
-.0043-.0037
-.0037
0.00212
.00240
.00256
.00198.00200
-O.OOO80
-.00090
-.00094
-.00078-.00074
18

Top view14 ft
Front view
b---t--
%
- Forebody(aerobrake)
C
[
[
tU_
I
\
Instrumentcarrier
_ Rocket
motor
Side view
Figure 1. AFE flight vehicle configuration.
19

I
!
Flow
Rake plane
Ellipsoid nose-skirt
junction --_
Ellipsoid region
\
Ellipsoidjunction
Cone re.(
/
d
Base plane
Rake plane
Cone-skirt junction
Figure 2. AFE vehicle forebody development from elliptical cone.
2O

BLACK AND WHITE PHOfOGRAFH
(a) The 3.67-in-diameter model, aftbody and balance holder.
Balance shroud
Figure 3.
=,i_:{ !:.._ -=
L-90-11872
(b) Tit{' 2.50-in-diameter model and balance shroud.
The AFE models used in lateral and directional aerodynamics tests.
21

#Jf-_Ac;_,. A,.,,_: +_w*_!TE. P_"IOTQ(_f'7A'Fh
(c) Tile 2.50-in-dianmter model mounted ill Langley 20-hmh Mach (i CF4 Tunnel.
Figure 3. Concluded.
L-90-14502
22

Side force
Y
Rolling moment
Flow_______----_p-
(o_= o°)
Referencemomentcenter
(rake-plane center)
+0_
f
Rake plane
/--- Balance/ moment
_ , _ _enter
_ Yawing moment
Z
Figure 4. System of axes with positive direction of forces, moments, velocities, and angles indicated.
23

Cy
.025
.020
.015
.010
.005
0
-,005
-.010
-.015
-.020
-.025
\
I I I I
-5.0 -4.0 -3.0 -2.0 -1.0 0.0
9, deg
\
}
\\\
I I i I I
1.0 2,0 3.0 4.0 5.0
13,deg
o 0 to 4.289
[] 0 to -4.201
Measurement, linear fitParallel line through origin
Measurement uncertaintyfor all data sets as indicated
O n
.014
.012
.010
.008
.006
.004
.002
0
-.002
-.004
-.006
-.008
-.010
-.012
-.014
tl
I i I I
J
I I , i
-5.0 -4.0 -3.0 -2.0 -1.0 0.0 1.0 2,0 3.0
i I
4.0 5.0
_,deg
CI
.OO5
.004
.003
.002
.001
0
-.001
-.002
-.003
-.004\
-.005 , , , , i i _ _ J-5,0-4.0-3.0-2.0-1.0 0.0 1.0 2.0 3.0 4.0 5.0
_, deg
(a) c_ =-10.0 °.
Figure 5. Variation of lateral and directional aerodynamic characteristics with angle of sideslip in air atM_o = 9.90 and Re_ = 1.09 x 10⁶/ft.
24

Cy
.025
.020
.015
.010
.005
0
-.005
-.010
-.015
-.020
-.025 I I I I
}
½
I I I I I
-5.0 -4.0 -3.0-2.0 -1.0 0.0 1.0 2.0 3.0
13,deg
4.0 5.0
I], deg
o 0 to 4.379
o 0 to -4.319
Measurement, linear fit
Parallel line through origin
Measurement uncertaintyfor all data sets as indicated
C n
.014
.012
.010
.008
.006
.004
.002
0
-.002
-.004
-.006
-.008
-.010
-.012
-.014
}/
/
I I I I I I I
-5.0 -4.0 -3.0-2.0 -1.0 0.0 1.0 2.0 3.0
/
I I
4.0 5.0
13,deg
.005
.004
.003
.002
.001
C / 0
-.001
-.002
-.00:
-.00,
-.005
"_ \i
I I I I I I
-5.0 -4.0 -3.0 -2.0 -1.0 0.0 1.0 2.0
[3, deg
(b) a =-5.0 °.
Figure 5. Continued.
• I I
3.0 4.0 5.0
25

.025
.02C
.01
.01
.00
Cy 13
-.005
-.0113
-.015
-.020
-.025
\
I I i i
-5.0 -4.0 -3.0-2,0 -1.0 0.0
_,deg
I i I I i
1.0 2.0 3.0 4.0 5.0
[3, deg
0 to -4.280
Measurement, linear fitParallel line through origin
Measurement uncertaintyfor all data sets as indicated
C n
.o141r
.012[
.010_
.0081"
.0061"
.oo41-
.002
0
-.002
-.004
-.006
-.008
-.010
-.012
-.0141
{
,.i
/
I I I I I I I
-5.0-4.0-3.0-2.0-1.0 0.0 1.0 2.0 3.0
_,deg
I I
4.0 5.0
.005i
.0041
.003!i
.oo2
.001
C / 0
-.001
-.002
-.003
-.004
-.005
B
%
%
m I i I
-5.0 -4.0 -3.0 -2.0 -1.0 0.0 1.0 2.0 3.0 4.0
J3,deg
(c) a =-2.5 °.
Figure 5. Continued.
I
50
26

Cy
.025 r A
o2o1:-o'__.o,C . {.o,o!.005 \
o \T_%
-oo5 F''_
-.010 / _ _ "_
-.015 \
-.020
-.025 , J , a , , I i ,-5.( -4.0-3.0-2.0-1.0 0.0 1.0 2.0 3.0 4.0 5.0
[_, deg
13, deg
o 0 to -4.302
o 0 to 4.35
0 to 4.364
A 0 to 4296
Measurement, linear fitParallel line through origin
Measurement uncertaintyfor all data sets as indicated
.014
.012
.010
.008
.006
.004
.002
Cn 0
-.002
-.O04
-.006
-.008
-.010
-.012
-.014
q
/,,
.f
I I I I
-5.0 -4.0 -3.0-2.0 -1.0 0.0
13, deg
I I I I I
1.0 2.0 3.0 4.0 5.0
.005
.004 I
.003
.002
.001
C I C
-.001
-.002
-.003 \
-,004
-.00 i , , i , ,-5.0-4.0-3.0-2.0-1.0 0.0 1.0 2.0
]3, deg
I I I
3.0 4.0 5.0
(d) (x = 0 °.
Figure 5. Continued.
2?

Cy
.025
.020
.0151
.01(
.00!
-.00
-.01{
-01. _
-.02G
-.02! i i i ,-5.0 -4.0 -3.0-2.0 -1.0 0.0
\
I_, deg
I I I I I
1.0 2.0 3.0 4.0 5.0
0rl
{
,B, deg
0 to 4.410
0 to -4.316
Measurement, linear fit
Parallel line through origin
Measurement uncertaintyfor all data sets as indicated
C n
.014
.012
.010
.008
.006
.004
.002
0
-.002
-.004
-.006
-.008
-.010
-.012
-.014
r
/
f J /
/
I i I I I I I I I
-5.0 -4.0 -3.0 -2.0 -1.0 0.0 1.0 2.0 3.0 4.0 5.0
_, deg
.OO5
.004
.003
.002
.001
C1 0
-.001
-.002
-.003!
-.004
-.005
=
I I I I
%
I I I I
-5.0-4.0-3.0-2.0-1.0 0.0 1.0 2.0 3.0 4.0
_,deg
(e) _=2.5 ° .
Figure 5. Continued.
I
5.0
28

Cy
.025
.020
.015
.010
.005
0
-.005
-.010
-.015
-.020
-.025
\.%
I I I I-5.0 -4.0 -3.0 -2.0 -1.0 0.0
I_, deg
\\
\
\
I I I I I1.0 2.0 3.0 4.0 5.0
0
[]
_, deg
0 to 4.380
0 to -4.252
Measurement, linear fitParallel line through origin
Measurement uncertaintyfor all data sets as indicated
Cn
.014
.012
.010
.008
.006
.004
.002,0
-.002
-.004
-.006
-.008
-.010
-.012
-.014 I I I I I I I I I
-5.0 -4.0 -30 -2.0 -1.0 0.0 1.0 2.0 3.0 4.0 5.0
#,deg
.OO5
.004
.003
.002
.001
C! 0
-.001
-.002
-.003
-.004
-.005 I I i I
\
-5.0 -4.0 -3,0 -2.0 -1.0 0.0 1.0
_,deg
(f) _ = 5.0°.
Figure 5. Continued.
\
I I I I
2.0 3.0 4.0 5.0
29

•0251.020.015!
.010
.005Cy 0!
-.005
-.010=
-.015
-.020
-.025
\
I I I I
t
\
I I I I i
-5.0 -4.0 -3.0 -2.0 -1.0 0.0 1.0 2.0 3.0 4.0 5.0
J3,deg
o
C]
t
9, deg
0 to 4.334
0 to -4.203
Measurement, linear fitParallel line through origin
Measurement uncertaintyfor all data sets as indicated
O n
.014
.012 _
.010
.008
.006
.004
.002
0
-.002
-.004
-.006
-.008
-.010
-.012 /
-.014 I I I I-5.0 -4.0 -3.0-2.0 -1.0 0.0
/ /
/
I I I I I
1.0 2.0 3.0 4.0 5.0
_,deg
.OO5
.004
.003
.002
.001
CI 0
-.001
-.002
-. 003
-.004
-.005
\ \
i i i i
k\
I I l l I3.0 4.0 5.0-5.0 -4.0 -3.0 -2.0 -1.0 0.0 1.0 2.0
_,deg
(g) a= 10.0 °.
Figure 5. Concluded.
3O
Cy
.025
.020
.015
.010
.005
0
-.005
Uncertainty
I I I 1
©[]
Re=, ft -1 13,deg
0.63 x 10⁶ 0 to -4
2.2 x 10⁶ 0 to -4
Measurement, linear fit
Parallel line through origin
Cn
.004
.002
0
-.002
-.004
-.006
-.008
-.010
-I-UncertaintyA 1
I I I J
C / .004
.002
0
.006 -
Uncertainty9"
-.002 I I J l J-5.0 -4.0 -3.0 -2.0 -1.0 0 1.0
13,deg
(a) _ =-5%
Figure 6. Variation of lateral and directional aerodynamic characteristics with angle of sideslip in air at 2rice = 6for two values of Re_c.
31

.O25
.020 -
,015 -
Cy .010 -(
.005
0
-.005
.O04
,002
0
-.O02
C n -.004 -
-.006 -
-.008
-.010
.006
C I .004
.002
0
-.002-5.0
-.Uncertainty
-I
1
I I I I
0[]
L.
_-Uncertainty_i t
I
-C _ _- _'1''_'_1"" ._._ /t.. •_'t"_'''1t
i
I I I I
Uncertainty
-
I I I 1
-4.0 -3.0 -2.0 -1.0
13,deg
(b) e = 0 °.
Figure 6. Continued.
Reoo, ft -1 13,deg
0.63 x 10⁶ 0 to -4
2.2 x 10⁶ 0 to -4
Measurement, linear fit
Parallel line through origin
I
1.0
32

.025
.020
.015
Cy .010
.005 I0
I
-.005
.004
.002 -
Ol
-.002
C n -.004 -
-.006 -
-.008 -
-.010
.006 -
C/ .004
.002
0
Uncertainty
0
0
-
I 1 I 1
- Uncertainty
Reoo, ft-1 13,deg
0.63 x 10⁶ 0 to -4
2.2 × 10⁶ 0 to -4
Measurement, linear fit
Parallel line through origin
-(
t I I I
Uncertainty
-.002 J J-5.0 -4.0 -3.0
I I
-2.0 -1.0
13,deg
(c) _ = s°.
Figure 6. Concluded.
I
0 1.0
33

Cy
"°30C_
-.0100 t •
0
I I 1 I I
0
[]
13,deg
Oto 5
0 to -5
Measurement, linear fit
Parallel line through origin
Measurement uncertaintyfor all data sets as indicated
O n
.020
.010
0
-.010 [
-.020
- 0
I I I I I I I I I
C!
oo6 .004 I---...
.-..-._
.002 - " -., ,_
--.,0
-.002 -
-.004 -
-.006 I I t [-5.0 -4.0 -3.0 -2.0 -1.0
I I I I I
0 1.0 2.0 3.0 4.0 5.0
13,deg
(a) a =-10 °.
Figure 7. Variation of lateral and directional aerodynamic characteristics with angle of sideslip in CI:4 at
Moo = 6 and Reoo = 0.46 x 10⁶/ft.
34

Cy
,030[_
-.010 f-.020
-.030 I I I I
O
I I I I I
.O20
.010
Cn 0
-.01C_
-.020 I I I I I I I I I
CI
.006I
.004
.0O2
0
-.0O2
-.004 -
-.006-5.0
I I l I
-4.0 -3.0 -2.0 -1.0 0
13,deg
I I I I I
1.0 2.0 3.0 4.0 5.0
(b) c_=-5 °,
Figure 7. Continued.
0
[]
tS,deg
Oto 5
0 to -5
Measurement, linear fit
Parallel line through origin
Measurement uncertaintyfor all data sets as indicated
35

Cy
Ca
CI
.030
.020 [
.010
0
-.010
-.020
-.030 I ! I I
0
I, I I 1 I
.020
.010
0
-.010_
-.020
m
_ _ _ _ _ _ _ S _
.006 -
E.004
.002
0
-.002
-.004
-.006-5.0
,I I 1 I
-4.0 -3.0 -2.0 -1.0I I I [ I
1.0 2.0 3.0 4.0 5.0
(c) ,_ = 0°.
Figure 7. Continued.
0
[]
13,deg
Oto 5
0 to -5
Measurement, linear fit
Parallel line through origin
Measurement uncertaintyfor all data sets as indicated
36
.030
.020[
.010
Cy 0
-.010 -
-.020
-.030
.020 -
.010
Cn 0
-.010 [
-.020
.006
.004 [
.002
C / 0
-.0O2
-.004 -
-.006-5.0
I I I I
0
I I I I I
I I I I I I I I I
B
I I I I , I I I I I
-4.0 -3.0 -2,0 -1.0 0 1.0 2.0 3.0 4.0 5.0
J], deg
(d) r_ = 5°.
Figure 7. Continued.
©
[]
13,deg
Oto 5
0 to -5
Measurement, linear fit
Parallel line through origin
Measurement uncertaintyfor all data sets as indicated
37

Cy
On
C/
.030
.020[
.010
0
-.010
-.020
-.030I I I I
0
0
[]
.020
.010
0
..010 [
-.020
I I I I I
oI I I I I I I I
I I I I I
1.0 2.0 3.0 4.0 5.0
(e) c_ = 10 °.
Figure 7. Concluded.
.006[_
.oo4I'--
.002 " - ..
0
-.002 -
-.004 -
-,006 I I I J-5.0 -4.0 -3.0 -2.0 -1.0
13,deg
Oto 5
0 to -5
Measurement, linear fit
Parallel line through origin
Measurement uncertaintyfor all data sets as indicated
38

-.006 -
_oo,___Cyl3,
deg-1 -.002
Moo Test Gas
O 6 CF 4
[] 6 Air
/_ 10 Air
_ A _
I I I I
_A_ 4_
I I I I I
.oo_Cnp' .00
deg -1 02__ A t_ A _ &
I I I I I I I I I
-.0010 -
-.ooo_
C/p,-.0006
deg-l_.o004 _
-.0002 -
0-10.0
A
A _ "0
I I I I I I I I I
-8.0 -6.0 -4.0 -2.0 0 2.0 4.0 6.0 8.0 10.0
_, deg
Figure 8. Lateral and directional stability characteristics in air and CF4. Note sign change in top and bottomfigures.
*U.S. GOVERNMENT PRINTING OFFICE: 1993-728-150/60053
39


Form Approved
REPORT DOCUMENTATION PAGE OMB No. 070#-0188
Public reporting burden for this collection of information is estimated to average I hour per response, including the time for reviewing instructions, searching existing data sources.gathering and maintaining the data needed, and completing and reviewing the collection of information Send comments regarding this burden estimate or any other aspect of thiscollection of reformation, including suggestions for reducing this burden, to Washington Headquarters Services, Directorate for Information Operations and Reports, 1215 JeffersonDavis Highway. Suite 1204, Arlington, VA 22202-4302, and to the Office of Management and Budget. Paperwork Reduction Project (0704-0188), Washington, DC 20503
1. AGENCY USE ONLY(Leaveb/ank) 2. REPORT DATE 3. REPORT TYPE AND DATES COVERED
June 1993 Technical Memorandum
4. TITLE AND SUBTITLE 5. FUNDING NUMBERS
Hypersonic Lateral and Directional Stability Characteristics of
Aeroassist Flight Experinlent Configuration in Air and CF4 WU 506-40-41-01
6. AUTHOR(S)
John R. Micol and William L. Wells
7. PERFORMING ORGANIZATION NAME(S) AND ADDRESS(ES)
NASA Langley Research Center
Hampton, VA 23681-0001
9. SPONSORING/MONITORING AGENCY NAME(S) AND ADDRESS(ES)
National Aeronautics and Space Administration
Vv_hington, DC 20546-0001
8. PERFORMING ORGANIZATION
REPORT NUMBER
L-17154
10, SPONSORING/MONITORING
AGENCY REPORT NUMBER
NASA TM-4435
11. SUPPLEMENTARY NOTES
12a. DISTRIBUTION/AVAILABILITY STATEMENT
Unclassified Uidimited
Subject Category 02
12b. DISTRIBUTION CODE
13. ABSTRACT (Maximum 200 words)
Hypersonic lateral and directional stability characteristics measured on a 60 ° half-angle elliptical cone, which
was raked at an angle of 73 ° from the cone centerline and with an ellipsoid nose (elliptieity equal to 2.0 in thesymmetry plane), are presented for angles of attack from - 10 ° to 10 °. The high normal-shock density ratio of
a real gas was simulated by tests at a Mach number of 6 in air and CF4 (density ratio equal to 5.25 and 12.0,
respectively). Tests were conducted in air at Maeh 6 and 10 and in CF 4 at Mach 6 to examine the effects of
Math number, Reynolds number, and normal-shock density ratio. Changes in Maeh number from 6 to 10 in
air or in Reynolds number by a factor of 4 at Mach 6 had a negligible effect on lateral and directional stabilitycharacteristics. Variations in nornml-shock density ratio had a mea,surable effect on lateral and directional
aerodynanlic coefficients, but no significant effect on lateral and directional stability characteristics. Tests in
air and CF4 indicated that the configuration was laterally and directionally stable through the test range olangle of attack.
i
14. SUBJECT TERMS
AFE; Aerodynamics; Real-gas simulation; Hypersonic; Blunt body
17. SECURITY CLASSIFICATION
OF REPORT
Unclassified
_ISN 7540-01-280-5500
18. SECURITY CLASSIFICATION
OF THIS PAGE
Unclassified
19. SECURITY CLASSIFICATION
OF ABSTRACT
15. NUMBER OF PAGES
40
16. PRICE CODE
A03
20. LIMITATION
OF ABSTRACT
iStandard Form 298(Rev, 2-89)Prescribed by ANSI Std Z39 18298- I02
NASA-Langley, 1993