Embed Size (px)
Citation preview

J Intell Robot Syst (2018) 90:551–570https://doi.org/10.1007/s10846-017-0689-0
Hyperspectral Imaging for Real-Time Unmanned AerialVehicle Maritime Target Detection
Sara Freitas1 ·Hugo Silva1 · Jose Almeida2 ·Eduardo Silva2
Received: 23 November 2016 / Accepted: 1 August 2017 / Published online: 16 October 2017© The Author(s) 2017. This article is an open access publication
Abstract This work address hyperspectral imaging sys-tems use for maritime target detection using unmannedaerial vehicles. Specifically, by working in the creation ofa hyperspectral real-time data processing system pipeline.We develop a boresight calibration method that allows tocalibrate the position of the navigation sensor related tothe camera imaging sensor, and improve substantially theaccuracy of the target geo-reference. We also develop anunsupervised method for segmenting targets (boats) fromtheir dominant background in real-time. We evaluated theperformance of our proposed system for target detection inreal-time with UAV flight data and present detection resultscomparing favorably our approach against other state-of-the-art method.
Keywords Unmanned aerial vehicles · Hyperspectralimaging · Surveillance · Target detection · Computer vision
� Sara [email protected]
Hugo [email protected]
Jose [email protected]
Eduardo [email protected]
1 INESC TEC, Porto, Portugal
2 INESC TEC, Instituto Superior de Engenharia do Porto, Porto,Portugal
1 Introduction
The importance of hyperspectral imaging systems hasgrown significantly in recent years. The huge increase inhyperspectral computational systems capacity, together withthe reduction of their dimensions and weight, has encour-aged its potential use in several domains such as: agricul-ture [28], industry [47], inspection [31] and surveillance[41]. Moreover, the development of novel computationalmethods and processors, some of them enabling parallelhardware/software implementations, thus more capable ofprocessing the vast amount of generated data contributed tothe increase hyperspectral cameras range of applications.
In this paper we address hyperspectral imaging acquisi-tion and processing in real time, using Unmanned AerialVehicles (UAV) for maritime surveillance applications. Wedevelop an unsupervised detection method that allows toseparate a target (boat) from the background image clutter inradiance spectrum domain. Therefore, decreasing the hugeamount of data that needs to be transmitted from the UAVto a remote ground station for further processing.
Up until now, hyperspectral imaging systems weremostly used in offline applications. The collected infor-mation was simply too much for the data to be acquiredand processed in real time. However, there is an increasingneed to detect novel features on heterogeneous applica-tions scenarios, and also to rush the decision call based onacquired hyperspectral imaging information. In order for thisto happen, information must become available on the fly.
The work presented in the paper displays develop-ments undertook during the SUNNY project (http://www.sunnyproject.eu/) framework. The project objectives aim

552 J Intell Robot Syst (2018) 90:551–570
to develop novel sensors and algorithms for autonomousaerial surveillance of European maritime borders. Briefly,summarizing the project idea. SUNNY uses a two-tierintelligent heterogeneous UAV network for providing largecoverage surveillance. The first tier sensors fly at mediumaltitude, using long-endurance UAVs and detecting suspi-cious targets while providing global situation awareness.The second-tier UAVs fed with information from the first-tier will carry other sensor payloads in order to recognizeand identify the target. Alloying to couple on-board sensorprocessing with preliminary results and innovative activesensor techniques, and replace technologies that rely onlyon sensor information communications to land, by a higherabstraction level of information.
For the hyperspectral imaging sensor, our purpose withinSUNNY is to detect the target solely using hyperspectralinformation. Based on this detection, we crop the hyper-spectral image data that contains the target information andsend it to a remote ground station, where it can be fur-ther analyzed. With this pre-processing on-board during theflight, we can diminish the amount of required data to betransmitted, and thus make hyperspectral information usefulfor flight analysis during the surveillance flights.
In order to be able to distinguish and process the hyper-spectral data on-board the UAV, we co-develop an hyper-spectral imaging real-time data processing pipeline. Toanalyze the hyperspectral data scan line throughput in flight.Based on this analysis the derivative unsupervised methoddetects the targets, geo-reference their position and performthe crops.
In this paper we detail the developments for building ahyperspectral processing pipeline and how to perform thetarget detections in real-time. We present results obtainedduring flights and compare our unsupervised approach againstother state-of-the-art approach. Furthermore complemen-tary results of the boresight calibration used to determine thedetect target position more accurately are also presented.
The remaining of the paper is structured in the followingway: in the ensuing section, holds the related work hyper-spectral imaging sensors. In Section 3 the hardware solutionis presented and all hardware components are detailed. Thehyperspectral data processing and the software implementa-tion, are presented in Section 4. In Section 5, the boresightcalibration results are presented, as well as, the detection ofmaritime targets using captured data in flight with ground-truth information. Finally the remaing section presents someconclusions and future work directions.
2 Related Work
This section starts with a brief introduction to hyperspectralcameras and hyperspectral imaging concepts. Subsequently,
we elaborate related work inherent with this type of cam-eras such as the atmospheric correction and the boresightcalibration. Existing applications, as well as, other comple-mentary information relative to our developments is alsopresented.
2.1 Hyperspectral Cameras
The use of an hyperspectral camera is becoming ubiqui-tous in remote sensing operations [6, 27]. Its use in datacollection campaigns is becoming frequent in applicationsthat range from agriculture, landscaping georeferencing,food processing, mineralogy to others such as surveil-lance and inspection tasks [13, 32]. One of most promisingfield of application is precision agriculture, where hyper-spectral imaging is used to collect data from seeds, anddetermine the germination of plant seeds [28]. Based onacquired information, the authors are able to detect sig-nificant changes in seed coat, responsible for the loss ofgermination. This technology can also be used to detectinternal defects in food products [47]. Another applicationis in biotechnology, for coral [5] and cells [31] studies. It isalso widely used for bacteria analysis [3, 22], and in envi-ronmental monitoring applications that allow to measuresurface CO2 emissions, map hydrological formations, trackpollution levels [19, 40].
2.1.1 Pushbroom Cameras
The pushbroom camera allows full simultaneous spectraldata acquisition with spatial line scanning over time. Thecamera acquires all spectral information exactly at the sametime, being insensitive to instrument/sample movement. Thehyperspectral system internal parts are always in a fixedposition, and can collect light from sample to camera 5 to 20times more efficiently than tunable spectral filter. Further-more, only a line across the sample needs to be illuminated,which leads to 10 to 30 times more light and consequentlymore speed. The data is received line by line, for allwavelengths at the same time. Meaning that for each lineindividual pixel spectrum is obtained. Figure 1 shows thedata acquisition scheme for the pushbroom camera system.
2.2 Atmospheric Correction
The hyperspectral data is captured at different wavelengths,and numerous interferences occurs with the acquisition ofsuch information. The interferences are mainly due to atmo-spheric effects that affect hyperspectral data collection.There is light directly from the light source, as well as otherreflections from the soil. Moreover, pushbroom sensors con-tain some non-uniformities (NUC). These derive mainlyfrom the variability in the response of the Focal Plane Array

J Intell Robot Syst (2018) 90:551–570 553
Fig. 1 UAV pushbroom scanmethodology
(FPA) elements and the small-scale roughness of the cameraentrance slit. The presence of dirt or condensation on theentrance slit can make this non-uniformities meaningful.For linear sensors, the NUC may consist of an offset and asingle multiplicative factor for each element on the FPA. Fornonlinear sensors, the NUC may require a higher-order rela-tionship. The offset value is commonly computed in-flightby collecting data with the camera aperture closed and thenaveraging that data to obtain what is called a ”dark frame”.
There are several methods for performing atmosphericcorrection. The methods are usually divided into two types:model-based methods, and empirical-based methods [6].In model-based methods, the radiance present at the sen-sor is modeled using radiative transfer models, and datafrom detailed atmospheric and sun information standarddatabases such as in MODTRAN [7]. Field measurementsare not required to perform atmospheric information, andmodel-based methods usually employ height and loca-tion, flight altitude, local visibility and acquisition timeinformation. There are several atmospheric correction algo-rithms that use model-based methods, namely: ATREM[14], ATCOR [34], ACORN [1], FLAASH [2], CAM5S[29], QUAC [8] and HATCH [33].
Concerning empirical-based methods, these only requirescene information and contrary to model-based methods donot require physical information. In empirical-based meth-ods, there are two types of methods, that are classified basedon the availability of ground truth information.
For the first type, the two common approaches are: flatfield methods [15], and internal apparent relative reflectancefactor methods [35]. In both cases, the raw spectral data ofeach pixel is divided by a reference spectrum (in flat field,a homogeneous bright target is used together with internalapparent relative reflectance factor, and an average of thescene spectrum). The main drawback of these approachesis that relies too much on the scene. Empirical Line [11]methods belong to second category. In this type of approach,
two (or more) targets in the scene are linearly correlated andcompared with the spectral signature obtained in laboratory.
2.3 Georectification
Unlike frame photography, each line of airborne pushbroomimages is collected at different time instants. Perspectivegeometry varies with each pushbroom line. Therefore, eachline has different 6-Degrees Of Freedom (DOF) exterior ori-entation parameters, leading to different line displacement,and thus turning the rectification process more difficult.However, one of the main purposes for acquiring hyperspec-tral data is to find and classify objects or materials withspectral signatures. Therefore, it is necessary to georefer-ence the hyperspectral data, which is the projection of thepoint from the image reference frame to the world referenceframe (ground).
To perform this step, there are three different approaches:
– Direct georetification;– Indirect georetification;– Integrated georetification.
The first case implies that the air vehicle is equipped withnavigation sensors, and the output is individual line exte-rior parameters obtained by the hyperspectral camera [12,16, 26, 27]. The method works regardless of control pointsexistence on the ground, being however quite susceptible topositioning errors between the camera and the navigationsensor. The position errors are called boresight errors, andare discussed in detail in the following subsection.
For indirect georectification methods, features from areference image are used and matched with features ofthe acquired lines to project them on the ground [36, 44,45]. Therefore, it is not required to use navigation sensorsinformation. Usually the methodology is to collect groundcontrol points, which can later be identified in the refer-ence image, or in the scan line, using a bundle adjustment

554 J Intell Robot Syst (2018) 90:551–570
process. The method requires human intervention to collectthe ground control points and match them from one datasetto another. The last approach, performs the georectificationusing a mixture of direct/indirect methods [9].
2.4 Boresight Calibration
Our system uses a direct georeferencing method. This typeof methods requires camera position and attitude informa-tion. Usually this information is obtained from the InertialNavigation System (INS) of the UAV or from the INS thatis attached to the camera. Since there are misalignmentsbetween the imaging sensor and the INS we need to correctthis angle difference, denoted as boresight angles. Boresighterrors are prone to increase with the UAV altitude. Usu-ally, the error leads to misalignment in all 3-axis. However,since the INS position is physically coupled with the cameraposition, the errors are constant and can be compensated.
Typical applications for determining boresight anglesuses control points on the ground, followed by bundleadjustment methods (such as iterative least squares method)to determine the value of boresight angles [46]. Some authorssuggest the use of digital elevation maps information forprojecting the points and finding the boresight errors [18,23]. There are other approaches that convert the hyperspec-tral data to RGB images, then acquire RGB images froma EO camera. Later, using bundle adjustment, combine thetwo RGB images to determine the boresight errors [4, 20].
2.5 Material Identification using Spectral Information
Hyperspectral imaging sensors are advanced digital colorcameras with fine spectral resolution at given wavelengthsof illumination. Instead of measuring the three colors -red, green and blue - these sensors measure the radiationreflected by each pixel at a large number of visible or invis-ible frequency (or wavelength) bands. Such an instrumentis called an imaging spectrometer. The spectrometers areinstruments that divide the impinging electromagnetic radi-ation into a number of finite bands and measure the energyin each band. Depending on the design of the spectrometer,the bands may be contiguous or not, and with equal width.Therefore, the measured discrete spectrum is usually not auniformly sampled version of a continuous one.
There are two main approaches for performing targetidentification based on spectral information:
– Spectral Anomaly Detection Algorithms [24]: This typeof algorithms do not require spectral information fromtargets of interest. Therefore, all pixels which spec-trum does not fit the background model are markedas targets. These methods do not allow to distinguishbetween spectral anomalies generated by man-made
objects, natural objects or targets of interest. Conse-quently, the atmospheric correction is not a prerequisitefor the application of anomaly detection algorithms;
– Spectral Matching Detection Algorithms [24]: Needspectral information on targets of interest, and attemptsto identify pixels whose spectrum display a high degreeof correlation with the desired spectral signature. Thespectral signature of the target can be obtained froma spectral library or from an identified scene in targetpixel.
An example of the first type of methods is the RX algo-rithm [10]. The method identifies a spectral zone or withdifferent colors within a region of tests which may be thewhole dataset or only a portion thereof. The RX algorithmuses the pixel being analyzed as signal matched, since it usesthe sample covariance matrix to take into account the sam-ple spectral correlation. It is ideal for situations where thetargets are small in comparison to the background.
In addition to this, there is a variation called KRX [42],which involves applying the same context as the previousalgorithm, but using a sliding window. However, its compu-tationally very expensive because it requires to calculate thecovariance matrix and its inverse for every single pixel.
As for the second type of methods, such as: ACE [30],GLRT [25] and JSD [37]. They make use of probabilisticmethods to model the target spectrum, and determine whatis the probability of this being a given pixel.
2.6 Real-time Algorithms
Up until now, there are not many approaches for hyperspec-tral real time data processing. The work presented by TrymVegard Haavardsholm et al. [17], describes a target detec-tion system in real time with GPU. It uses a hyperspectralsystem able to detect 160 wavelengths, and also able to seta background model. It detects possible targets that don’tmatch the background. Although it was tested in a UAV, theprocessing of CPU was not on-board. In the work devel-oped by Yuliya Tarabalka et al. [43], a model backgroundby fitting normal multivariate mix to a spatial subset of theimage was used, then a background probability for eachgiven pixel was computed, in order to detect and estimatedvalue that was afterwards use to detect anomalous pixelsbased on empirical values.
3 Hyperspectral Data Acquisition and Processing
The hyperspectral system setup, displayed in Fig. 2, com-prises the following subsystems:
– Hyperspectral System: contains the Hyperspectral PCand Control Electronics, hyperspectral camera and a

J Intell Robot Syst (2018) 90:551–570 555
Fig. 2 Hyperspectral hardware system
GPS/IMU unit. It is responsible for performing the cam-era acquisition and generate a timestamp navigationmessage for the georectification process:
– Hyperspectral camera: It comprises the sensor,spectrometer and lens necessary for data acquisi-tion in the frequency range. The sensor is a Bobcat640 CL-V,1 manufactured by Xenics. It collect databy Camera Link interface, while still allowing theuse of an external trigger that triggers the acquisi-tion of the image. Camera Link interface for dataacquisition guarantees sufficient transfer capacityeven at the maximum data rates from the camera;
– PC and Control Electronics:
• Computer motherboard (CPU) - With Win-dows 7 operating system;
• SSD in a swappable slot;• Framelink Express frame grabber (Camera
Link) - Device which makes the connectionbetween the sensor and the CPU, for acquirethe data;
• Hyperspectral Control Board, for synchroniza-tion between image data and GNSS/IMU dataacquisition with 0.1 ms accuracy, and also forthe hyperspectral camera shutter control.
• Power regulator.
– GPS/IMU: GPS receiver and inertial system. Itallows to detect the position and attitude of theUAV when the data was obtained. It is physicalcoupled to the camera and it’s necessary to per-form a calibration in order to eliminate alignmenterrors between the GPS/IMU and the sensor, called
1http://www.xenics.com/pt/camera/bobcat-640-cl
boresight calibration. If this is not performed,it can lead to significant errors during the geo-rectification of the collected points. The inertialsystem selected was the OXTS xNAV550 due to itssmall size and low weight.
– Data Processing System: its composed by the DataProcessing CPU (with Ubuntu 14.04) and an Elec-tro Optical camera. It is responsible for acquiring andprocessing the hyperspectral camera data, as well as,acquire and process data from an Electro-Optical (EO)Camera. The selected EO camera was the Blackfly 3.2MP Color GigE PoE (Sony IMX265) model.
The hyperspectral CPU connects directly to the hyper-spectral camera using serial and Camera Link interfaces.The serial connection is used to control the external camerahardware trigger based on the synchronization PPS trig-ger pulse that the hyperspectral CPU board receives fromthe GPS/IMU. The Camera Link interface deals with imagedata acquisition part. The Data Processing CPU receives theimages from the hyperspectral CPU board via Ethernet, andalso receives the PPS synchronization pulse via serial port.Therefore, the two boards are synchronized with a commontimestamp that is given by the GPS/IMU sensor.
Our objective is to acquire, process, detect and georef-erence targets position in real-time. To do so, first we needto perform boresight calibration, which requires a flight forpure calibration purposes. The flight must be conductedover land, typically passing through areas with runways.The data is then pos-processed to obtain the boresightcompensation angles, and thus be able to detect and geo-reference targets position in real-time. The full processingpipeline is illustrated in Fig. 3.
Our processing system is divided into two main steps:
– First, there is a offline procedure that computes the off-sets associated with the dark frames. The dark frames

556 J Intell Robot Syst (2018) 90:551–570
Fig. 3 Hyperspectral Software System - Processing pipeline
values change from flight to flight, and to obtainaccurate data values, dark frames should be captured atthe beginning of the flight.
– Second, concerning the data processing in flight. Theimage is acquired and synchronized with GPS/IMUdata. As soon as a valid target is detected based on hisspectral response when compared to the background, atarget crop with all spectral signatures is performed tobe dispatched to a remote station for further processing.The data transmitted data is already georeferenced.
3.1 Boresight Calibration
As aforementioned in the related work section, the bore-sight errors are responsible for inducing position errors inhyperspectral data georeference. In order to calibrate theboresight errors, a direct georeference method based ona bundle adjustment procedure is utilized. Ground controlpoints (GCP) belonging to the UAV runway treadmills areselected, and the control points are re-projected (3D-2D)from the ground plane to the image plane and comparedwith the points collected during the flight. Afterwards, abundle adjustment procedure is used to minimize the errordifference and compute the boresight angles, as described inEq. 1:
We also need to compensate the lens distortion. Forcompensating the lens calibration parameters, a laboratorycalibration is required to map each pixel to a correspondingincidence angle. By comparing these values, with the lensfield of view, we obtain a new pixel value to analyze.
pc = RSensorIMU
Rψ ′ θ ′ φ′ RIMUTRIMU
UT M(pWorld − pUAV ) (1)
being:
– pc is a vector that holds the ground control worldpoints re-projected to the camera reference frame, pc =
[pc1 , pc2 , pc3 , 0] in homogeneous coordinates. How-ever, in order to obtain the image coordinates of thepoint, this result must be normalized. The image coor-dinates xi and yi are given by:
xi = pc1
pc3
· (−f ) (2)
yi =(
pc2
pc3
· (−f )
)
+ 320 (3)
where f corresponds to the focal length in pixels.– RSensor
IMU is the rotation matrix from the IMU referenceframe to the camera reference frame;
– Rψ ′ θ ′ φ′ is the matrix that represents the angle betweenthe sensor and IMU in homogeneous coordinates (bore-sight angles);
– RIMUT
is the IMU rotation matrix that represent theangles (roll, pitch and yaw) during flight;
– RIMUUT M is the rotation matrix that converts the World
Reference frame to the IMU reference frame;– pworld are the ground control points in UTM coordinates;– pUAV is the UAV position in UTM coordinates.
The results of the re-projection error minimization usinga nonlinear least squares solver are the boresight angles.This values corresponds to calibration angles (roll, pitch,heading) between the image sensor and GPS/IMU position.
3.2 Spectrum Processing
Now we turn our attention to the actual hyperspectral dataprocessing. One of the first procedures that is requiredbefore analyzing spectral data is to use a reference pattern.The reference pattern is established by analyzing and sub-tracting to the acquired data the average of the dark framesvalue (dark frames are images taken with the camera shutter

J Intell Robot Syst (2018) 90:551–570 557
closed). Only then we can convert the raw sensor data intoradiance at-sensor values as defined in Eq. 4:
Lλ = Gain × P ixel V alue + Off set (4)
where the system offset is set to zero.After the data is converted into radiance at-sensor, it
can be further converted into reflectance factor by perform-ing the atmospheric correction. This procedure allows theelimination of almost all atmospheric effects, leaving onlythe surface materials and some residual among other com-ponents. However, for our maritime detection applicationradiance data is suffice, since in normal flight conditions thespectral response of the target (boat) material, will be signif-icantly different from the background (water). This assump-tion holds even when water has different light reflectionpatterns.
It is important to mention that is also necessary to takeinto account, that our maritime detection method must beable to detect targets (boats) built with different materi-als, making more difficult to use methods that require acomparison between spectrums for target detection.
Therefore, we implemented a processing method de-noted as Hyperspectral Derivative Anomaly Detection(HYDADE) that analyzes the transitions/existing peaks inthe spectrum response, by processing the first and secondderivative of the acquired spectrum for each pixel.
In order to segment the target pixels from the backgroundwith HYDADE, two procedures are met, namely: first, testif the first derivatives of a given pixel are higher than a pre-determined threshold (that was found empirically based onthe acquired data). If its higher than the threshold, it meansthat the pixel is a good candidate (possible target pixel), ifits value is below the threshold then the pixel is classified asbackground. This ”binarization” allows us to quickly sepa-rate target candidate pixels from the background. However,if only this procedure was used, we would end up with alarge amount of false positives candidate pixels. Thereforea deeper analysis to the candidate pixels spectral response isrequired.
For that we count the number of peaks of the first andsecond derivative of each candidate pixel. The number ofpeaks is compared with an adaptive threshold number foreach derivative. The adaptive thresholds are initialized withzero already in flight, when the aircraft reaches its cruisealtitude, and their value is changed throughout the flight,according to the data received. Based on this procedure weare able to quickly perceive the spectrum data smoothnessand detect transitions in the spectrum data between adjacentpixels in the camera pushbroom scan line. Since we detectthe transitions in the spectrum, we group the different pixelsinto clusters based on their similarity information. As soonas a cluster is closed and we get a candidate target (hyper-spectral data ”blob”), we perform a crop of the hyperspectraldata cube and dispatch this information to the ground wherethe cluster can be further analyzed.
At the same time, we are also able to determine the targetgeoposition, by converting the image point from the imageframe to the world reference frame (Fig. 4). The worldcoordinates are represented in UTM coordinates. For theIMU, the reference frame considered for the roll, pitch andheading angles was the North-East-Down (NED) referenceframe. We will also have the camera reference frame, thuswe are able to obtain the relation between the object coordi-nates measured in the image and the real world coordinates,as shown in Eq. 5.
⎛
⎝
x
y
z
⎞
⎠
UT M
Object
=f UT Mgeo
⎛
⎝
x
y
z
⎞
⎠
geo
Sensor
+ s RWorldIMU RIMU RIMU
Sensor
⎛
⎝
0yi
−f
⎞
⎠
Sensor
Object
(5)
where:
–
⎛
⎝
0yi
−f
⎞
⎠
Sensor
Object
corresponds to the target position in the
image. x is 0 due to the model of pushbroom camera,while yi corresponds to the Eq. 6, where N is the total
Fig. 4 World, Camera and IMUreference frames

558 J Intell Robot Syst (2018) 90:551–570
number of samples (pixels) of the image and i is thepixel to be analyzed, f is the focal length in pixels;
yi = −N − 1
2+ i, with i = 0, . . . , N − 1 (6)
– RIMUSensor is the Rotation matrix that converts sensor
reference frame to the IMU reference frame;– RIMU is the matrix that implements the rotations
obtained by the IMU. This matrix can be represented interms of Euler angles (roll (ψ), pitch (θ ) and yaw (φ)),according to the Eq. 7 [39].
RUT MIMU = Rx(ψ) Ry(θ) Rz(φ) (7)
– s corresponds to the scale factor. This can be approx-imated using the Ground sampling distance (GSPy),which corresponds to the resolution that is on the floor.The Ground sampling distance in y is given by the Eq.8, where �y is the pixel size, and h
fis considered an
approximation for the scale (h is the altitude of the UAV,and f is the focal length in pixels);
GSPy = �y · mb = �y · h
f(8)
– f UT Mgeo
⎛
⎝
x
y
z
⎞
⎠
geo
Sensor
is the vector containing the UAV
position when the target has been detected, in UTMcoordinates.
Even though computationally simple the method isvery useful for hyperspectral target maritime detection inSUNNY project (http://www.sunnyproject.eu/). Since themethod allows to positively separate the target from thebackground without using other spectrums for comparingscan line with scan line solely using hyperspectral datainformation in real-time. Meaning that there is the needto know the material of the boat, and we can also clusterdifferent materials on the boat (this depends on the flightaltitude since it depends on the pixel resolution), but mostof all allows us to dispatch only the target information from
the UAV to a ground station, where the data can be furtheranalyzed. Otherwise it would be difficult to send all thehyperspectral data cube through the UAV communicationsnetwork.
4 Results
In this section, we present the results for the hyperspec-tral imaging for real-time maritime target detection usingan unmanned aerial vehicle. To validate our proposed solu-tion, we installed the experimental setup into PortugueseAir Force UAV, and performed flight tests at OTA Air ForceBase for collecting synchronized data, in order to performboresight calibration.
The boresight calibration procedure consists on the useof multiple ground control points, that were obtained usinga RTK/GPS Septentrio receiver. For this procedure, we usedthe crosswalk at the end of OTA Air Force Base runway toobtain the control points.
The second flight tests were performed in a maritimesurveillance scenario at Santa Cruz, Peniche. The objectiveof these flight trials was to test the detection and georefer-ence of maritime targets using HYDADE method based onpurely hyperspectral imaging data. In both flights, UAV hasa altitude of 300m and 26 m/s velocity.
In order to validate HYDADE detection results, wecompare the performance with our implementation of theSpectral Angle Mapper (SAM) [21] state-of-the-art method,with manually annotate ground truth information.
4.1 Experimental Setup
The experimental setup was already described in detail in[38]. It was installed in a fixed-wing Portuguese Air ForceUnmanned Aerial Vehicle, called ANTEX shown in Fig. 5.
In Fig. 6, we see the payload configuration on the UAV.The sensors are placed in the bottom structure so that all thecameras can be placed near/outside the bottom fuselage ofthe UAV, while the data recording and processing CPUs areplaced on top layer.
Fig. 5 ANTEX UAV

J Intell Robot Syst (2018) 90:551–570 559
Fig. 6 UAV payload used in the data collection trials [38]
In Table 1 is displayed the SPECIM AisaKESTREL 16characteristics.
4.2 OTA Boresight Calibration Flights
The first flights occur at OTA Air Force Base, Alenquer.OTA Air Force Base is the primary center for PortugueseAir Force flight trials. The ANTEX UAV was the aircraftused to carry the sensor payload in the field tests.
Table 1 SPECIM AisaKESTREL 16 characteristics
Parameter KESTREL 16
Spectral range 600-1650 nm
Spectral sampling 4 nm
F/# F2.4
Smile/Keystone <0.15 pixels
Polariation sensitivity < ±2%
SNR (Peak) 800
Spatial resolution 320 or 640 pixels
Integration time Adjustable within frame period
FOV 21.7 or 40 degrees
Electro-mechanical shutter Yes
Data interface Cameralink 14-bit
The Antex UAV performed a pre-determined flight tra-jectory, that consisted on flying over the crosswalk indifferent directions in order to collect crosswalk image datawith different heading directions. Figure 7 depicts the UAVflight trajectory.
We collected control points with a RTK/GPS sensor,in stationary position at each control point position at therunway. Figure 8 shows the ground control points position.
The purpose of this flight was to perform boresightcalibration. We performed two tests: First, we used the nav-igation data from the GPS/IMU obtained during the flight;Second, we post-processed the navigation data, obtainedusing a manufacturer’s software, called RT Post-process.2
4.2.1 Results: Data GPS/IMU obtained during flight
We start by analyzing the results using the navigation dataobtained during the flight. For boresight angles using theoptimization procedure we obtained the following values:
– ψ’ = -0.2416◦– θ ’ = 0.6660◦– φ’ = -1.3151◦
Figure 9 shows the error (in pixels) in X and Y with andwithout the boresight calibration, where the dash lines arethe results without the boresight calibration, and the contin-uous lines represents the results with boresight calibration.The results match each flight passage over the crosswalk.
The boresight calibration represents a 86.72% improve-ment in X and 3.55% in Y , compared with the resultswithout calibration.
4.2.2 Results: Data GPS/IMU post processed
After the flight, the data obtained by the GPS/IMU wasprocessed, allowing a new analysis of the boresight angles.
With this, we computed the boresight angles, obtainingthe following values:
– ψ’ = -0.2815◦– θ ’ = 0.7567◦– φ’ = -1.0762◦
Figure 10 shows the error in X and Y with and with-out the boresight calibration, where the dash lines are theresults without the boresight calibration, and the continuouslines represents the results with the boresight calibration.The results are always analyzed for each passage overthe runway.
2http://www.oxts.com/rt-post-process-support-for-multiple-base-stations-improves-productivity/ accessed on 08/03/2016

560 J Intell Robot Syst (2018) 90:551–570
Fig. 7 UAV ANTEX flight path
The boresight calibration represents a 87.31% in X and4.97% in Y improvement compared with the results withoutapplying the calibration procedure.
In the Table 2 is possible to observe the mean and stan-dard deviation (considering absolute value) of the error foreach passage, considering the boresight angles equal to zero,and considering the values obtained for boresight error. It isnoteworthy that for all passages the error values are lowerwhen the boresight angles are considered.
Fig. 8 Ground control points collected at OTA Air Force Base runway
As show in Table 2, there is a difference between theresults obtained with the GPS/IMU data acquired duringflight and post processed for the heading. This offset isbecause the sensor used is of the Attitude and HeadingReference System (AHRS) type.
Finally, we present the projected points on the ground,with and without boresight angles, as shown in Fig. 11. Itis necessary to take into account that the Ground ControlPoints were obtained using a GPS RTK, with very highaccuracy. However, the satellite representation of GoogleEarth has a larger error, and in this case is only used forvisual reference, and should not be considered as groundtruth. Therefore, the Ground Control Points with the colorgreen in Fig. 11, are not exactly coincident with the pointsmarked in the Fig. 8.
4.3 Santa Cruz Maritime Detection Flights
For the maritime detection tests, the flights were performedat Santa Cruz Airfield, Peniche. The airfield is located in acoastal area, allowing the UAV to quickly head out to seaand fly over boats. The boat carries a RTK GPS sensor on-board, allowing to save the boat trajectory over time forground truth georeference purposes.
The ANTEX UAV flight trajectory and the vesselground-truth position information are displayed in Fig. 12.
During this flight, the UAV passed over the boat onthree separate occasions, for explanation purposes we willaddress this detections individually.

J Intell Robot Syst (2018) 90:551–570 561
Fig. 9 Error in X and Y for allpassages: dash lines are theresults without boresightcalibration, and the continuouslines represents the results withboresight calibration
We start by analyzing the spectral signature, comparingtwo pixels for each detection: a target pixel, and one pixel inthe background, to distinguish a target from the background.In order to verify the spectral results in detail, we usedENVI (http://www.harrisgeospatial.com/productsandsolutions/
geospatialproducts/envi.aspx) software. We also manuallyclassified all boat pixels in order to have ground-truth infor-mation of the detections, for comparison effects betweenHYDADE and a supervised state of the art method asSpectral-Angle-Mapper (SAM) processing results.
Fig. 10 Error in X and Y for allpassages: dash lines are theresults without boresightcalibration, and the continuouslines represents the results withboresight calibration

562 J Intell Robot Syst (2018) 90:551–570
Table 2 Boresight CalibrationWithout boresight With boresight
Error in pixels X Y X Y
Flight data
1 10.6 6.8 1.7 6.2
Mean 2 13.0 6.0 1.5 6.8
3 11.7 11.9 1.5 10.8
Standard 1 2.3 4.7 1.3 4.0
Deviation 2 2.1 3.9 1.0 4.0
3 2.1 9.3 1.0 7.7
Post-processed data
1 11.7 7.1 1.7 6.3
Mean 2 14.7 6.0 1.7 6.8
3 12.7 12.1 1.5 10.8
Standard 1 2.1 5.2 1.3 4.0
Deviation 2 1.8 3.9 1.0 4.0
3 2.0 9.6 1.2 7.6
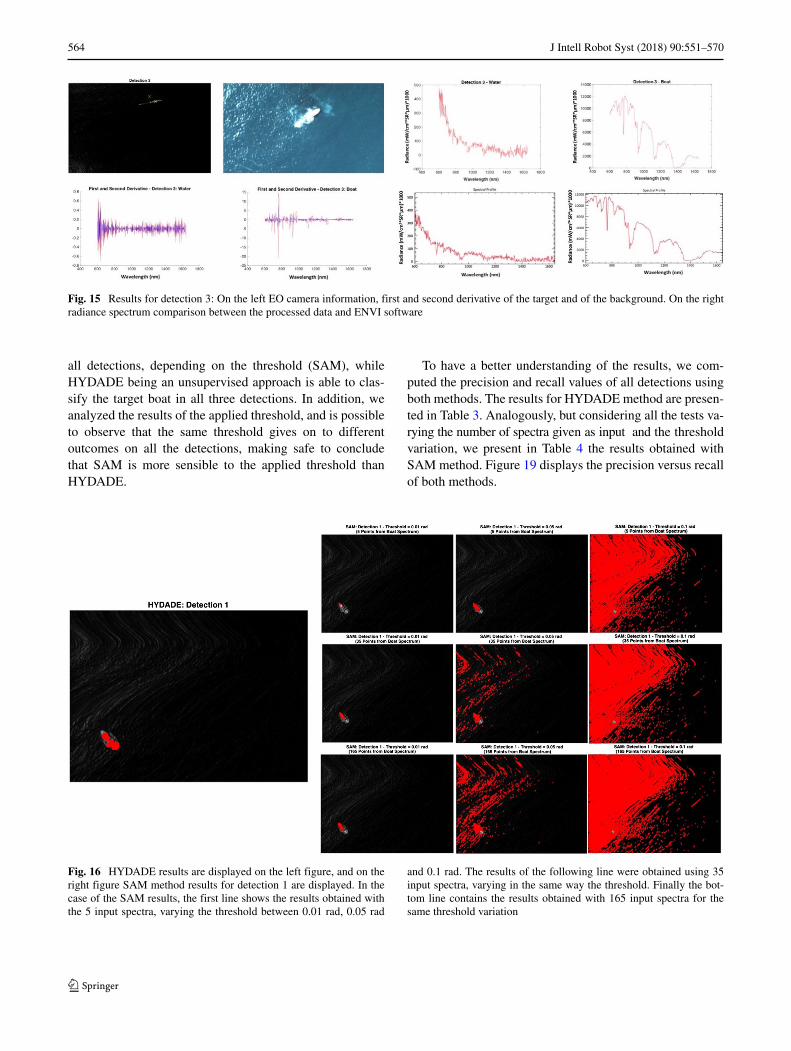
In Figs. 13, 14 and 15, we display the detections detailingthe following information:
– Comparison between the image obtained with hyper-spectral camera and with the EO image;
– Spectral analysis - background versus target;– First and second derivate of the spectrum analysis;– Presentation of the spectra obtained using ENVI;
Fig. 11 Points obtained with and without boresight corrections pro-jected on the ground. Green color represents the ground control points,yellow color represents the points without boresight. In red color theprojected points considering the boresights angles
– Results of georeference for the boat position.
For the three detections, we display the hyperspectralcamera versus EO camera (first and second image). The yel-low cross in the first image represents the point analyzed toobtain the spectrum of the boat, while the green cross marksthe water spectrum pixels. On the bottom figures in Figs. 13,14 and 15, we present the target and background first andsecond derivative (first and second image) and also the tar-get and background spectrum obtained with ENVI (thirdand fourth image).
Having analyzed the acquired data, and after trying toobtain ground-truth information of all the pixels to classifythe target (boat) for all three detections. We can now com-pare HYDADE unsupervised detection method results thatwere obtained in real-time during the flight, with the resultswe obtain using other supervised state of the art methodas Spectral-Angle-Mapper (SAM). In order to compare thedetection results, we implemented a version of SAM, whichis a supervised approach that requires reference spectra asinput, we perform three different tests, using different num-bers of boat pixels as reference input for SAM, namely: 5,35, and 165 boat pixels, the latter correspond to all boatpixels in detection 1. In addition, since SAM requires athreshold, for each previously described tests, three differ-ent thresholds were applied: 0.01 radians, 0.05 radians and0.1 radians. Figures 16, 17 and 18, depicts HYDADE versusSAM results for each target detection.
From the aforementioned figures, it is possible to observethat HYDADE does not produce lots of false positives, con-trary to SAM, that produces lots of false positives speciallygiven more boat pixel inputs as reference samples. Bothmethods are able to detect totally or partially the target on

J Intell Robot Syst (2018) 90:551–570 563
Fig. 12 In red color theANTEX UAV flight trajectoryduring the flight, and in whitecolor the boat ground-truthposition information
Fig. 13 Results for detection 1: On the left EO camera information, first and second derivative of the target and of the background. On the rightradiance spectrum comparison between the processed data and ENVI software
Fig. 14 Results for detection 2: On the left EO camera information, first and second derivative of the target and of the background. On the rightradiance spectrum comparison between the processed data and ENVI software
564 J Intell Robot Syst (2018) 90:551–570
Fig. 15 Results for detection 3: On the left EO camera information, first and second derivative of the target and of the background. On the rightradiance spectrum comparison between the processed data and ENVI software
all detections, depending on the threshold (SAM), whileHYDADE being an unsupervised approach is able to clas-sify the target boat in all three detections. In addition, weanalyzed the results of the applied threshold, and is possibleto observe that the same threshold gives on to differentoutcomes on all the detections, making safe to concludethat SAM is more sensible to the applied threshold thanHYDADE.
To have a better understanding of the results, we com-puted the precision and recall values of all detections usingboth methods. The results for HYDADE method are presen-ted in Table 3. Analogously, but considering all the tests va-rying the number of spectra given as input and the thresholdvariation, we present in Table 4 the results obtained withSAM method. Figure 19 displays the precision versus recallof both methods.
Fig. 16 HYDADE results are displayed on the left figure, and on theright figure SAM method results for detection 1 are displayed. In thecase of the SAM results, the first line shows the results obtained withthe 5 input spectra, varying the threshold between 0.01 rad, 0.05 rad
and 0.1 rad. The results of the following line were obtained using 35input spectra, varying in the same way the threshold. Finally the bot-tom line contains the results obtained with 165 input spectra for thesame threshold variation

J Intell Robot Syst (2018) 90:551–570 565
Fig. 17 Following the same demonstration as in the previous figure, on the left are the results with HYDADE method and in the right figure withSAM method for the detection 2. SAM does not work equally for all detections with the same threshold, and also detects many false positiveswith 165 boat spectrum
Fig. 18 Following the same demonstration as in the previous figures, on the left are the results with HYDADE method and in the right figurewith SAM method for the detection 3. In this case the same happens as in detection 2, besides that in certain situations it detects 0 or very fewpoints of the boat

566 J Intell Robot Syst (2018) 90:551–570
Table 3 HYDADE precisionand recall results Detection Ground truth number of
pixels p/ boatPrecision (%) Recall (%)
HYDADE 1 165 54,76 27,88
2 313 82,97 84,03
3 209 81,33 29,19
From the aforementioned tables and figure we canobserve that HYDADE has higher precision values thanSAM for most of the detections, and that SAM is verysensible to the threshold, which decreases its precisionresults, even though it has sometimes higher recall ratesthan HYDADE. Even in the best tuned SAM scenario (interms of input boat pixel and threshold), the results arecomparable to the ones obtained by HYDADE in all threedetections. Since our application is intended for detecting
the target and crop the hyperspectral data cube for transmis-sion, the fact that HYDADE produces less false positivesand is unsupervised will favor its application in maritimescenario.
To complete such statement and since we want to detectthe target during flight, it is still necessary to take intoaccount the method execution time. The processing time perreceived line was analyzed for each detection, using a stan-dard dual-core CPU, and the mean value is displayed in
Table 4 SAM precision and recall results
Detection Ground truth numberof pixels p/ boat
Number of pixels asreference input
Threshold (rad) Precision (%) Recall (%)
SAM 1 165 5 0.01 77,78 4,35
0.05 62,89 62,11
0.1 0,55 93,79
35 0.01 72,92 21,21
0.05 13,13 89,10
0.1 0,46 97,58
165 0.01 60,57 64,24
0.05 5,47 91,52
0.1 0,38 98,18
2 313 5 0.01 0 0
0.05 67,77 78,59
0.1 3,27 88,50
35 0.01 100 0,32
0.05 36,10 93,29
0.1 2,53 99,36
165 0.01 100 0,64
0.05 18,10 94,89
0.1 1,80 100
3 209 5 0.01 0 0
0.05 66,82 71,29
0.1 2,12 90,43
35 0.01 0 0
0.05 37,55 95,22
0.1 1,68 99,04
165 0.01 0 0
0.05 19,38 98,57
0.1 1,20 100

J Intell Robot Syst (2018) 90:551–570 567
Fig. 19 HYDADE versus SAM - Precision and Recall. With the ’*’marker are found the results with HYDADE method, while with the ’+’marker are presented the results with SAM method. The color differ-entiates the three detections: pink markers corresponds to the detection1, blue to detection 2 and green to detection 3
seconds, in Table 5 for the HYDADE and in the Table 6 forthe SAM.
As expected, SAM processing time increases signifi-cantly with the number of spectra that receives as input.However, even in the situation where it only receives fivespectra as input, the processing time per line is approxi-mately the double than the HYDADE method.
Finally, we also analyzed the target projection, in order toobtain the point in the world. The error difference betweenthe point obtained by RTK/GPS on the boat and the pro-jected point for all three detections is:
– Detection 1: 13 meters error;– Detection 2: 8 meters error;– Detection 3: 5 meters error;
Which given the fact that both the target and the UAV hadrelative motion is pretty accurate and suits the applicationneeds.
Table 5 HYDADE Processing time per hyperspectral scan line
HYDADE
Detection 1 Detection 2 Detection 3
0.0309 s 0.0290 s 0.0278 s
Table 6 SAM Processing time per hyperspectral scan line
SAM
Number of boatpixels as refer-ence input
Detection 1 Detection 2 Detection 3
5 0.0686 s 0.0795 s 0.0882 s
35 0.4468 s 0.4629 s 0.4419 s
165 2.4035 s 2.1373 s 1.9675 s
5 Conclusions and Future Work
Our work focused on the development of hyperspectralimaging techniques for real-time maritime target detectionand recognition. We developed the following methods andapplications:
– First, we co-develop and implemented an hyperspec-tral image acquisition solution, that allows to extractsynchronized image and navigation data of the hyper-spectral camera in near real-time.
– Second, we develop a boresight calibration procedure,that allows to calibrate the physical relation between thehyperspectral inertial navigation system and the imag-ing sensor. The boresight calibration procedure consistson the development of a bundle adjustment method thatoptimized the re-projection error between control pointson the ground and the observed image points.
– Third, we develop a method (HYDADE) that basedon the real-time data acquisition hyperspectral setup,detects based on the first and second derivative anal-ysis of the radiance spectrum the presence of targets(boats) on a pre-defined background (water). Allowingto reduce the amount of generated data that is requiredto be transmitted to a remote station. The crop of imagedata is georeferenced to provide accurate location of thetarget. We compared our approach to a standard state-of-the-art approach SAM, where our method proved toproduce high precision results comparable or better thanSAM in most situations, but with lower false positiverate.
– Finally, we integrated all previously mentioned con-tributions, into a unmanned aerial vehicle solution,that was validate in real flights for maritime bordersurveillance scenario with target ground-truth positioninformation.
Our future work efforts will be based on the followingprocedures:
– Further develop the data processing steps in order todevelop methods that can identify the type of material

568 J Intell Robot Syst (2018) 90:551–570
based on the radiance spectrum. The separation of thetarget spectrum from the one in the background isalready a improvement to current systems. Extend toactually identify the specter response will further extendthe range of applications of the current solution;
– Further improve the boresight calibration using factorgraphs. We can use EO information to complementthe hyperspectral data and help reduce the bundle-adjustment errors.
– Implement a dual target identification mechanism usingElectro-Optical information and Hyperspectral datainformation;
– Create a data spectrum library for maritime target iden-tification;
– Extend the range of applications of the develop systemto other scenarios.
Acknowledgments The authors would like to thank the PortugueseAir Force and the Portuguese Navy for providing the UAV andthe boats for the data collection. The authors would also like tothank SPECIM and XENICS for providing the Hyperspectral cam-era and the IR camera for the payload used in this dataset campaign.This work is financed by the ERDF - European Regional Devel-opment Fund through the Operational Program for Competitivenessand Internationalization - COMPETE 2020 Program within projectPOCI-01-0145-FEDER-006961, by the SUNNY Project funded by theEuropean Commission under the FP7 program Grant Agreement num-ber: 313243, and by National Funds through the FCT - Fundacaopara a Ciencia e a Tecnologia (Portuguese Foundation for Science andTechnology) as part of project UID/EEA/50014/2013.
Open Access This article is distributed under the terms of theCreative Commons Attribution 4.0 International License (http://creativecommons.org/licenses/by/4.0/), which permits unrestricteduse, distribution, and reproduction in any medium, provided you giveappropriate credit to the original author(s) and the source, provide alink to the Creative Commons license, and indicate if changes weremade.
References
1. ACORN: Atmospheric correction now. Analytical imaging andgeophysics LLC version 3.12
2. Adler-Golder, S., Berk, A., Bernstein, L.S., Richtsmeier, S.,Acharya, P., Matthew, M., Anderson, G., Allred, C.L., Jeong, L.S.,Chetwynd, J.: Flaash, a modtran4 atmospheric correction packagefor hyper-spectral data retrievals and simulations. In: Summariesof the Seventh JPL Airborne Earth Science Workshop (1998)
3. Bachar, A., Polerecky, L., Fischer, J.P., Vamvakopoulos, K., Beer,D.D., Jonkers, H.M.: Two-dimensional mapping of photopigmentdistribution and activity of chloroflexus-like bacteria in a hyper-saline microbial mat. FEMS Microbiol. Ecol. 65(3), 434–448(2008). https://doi.org/10.1111/j.1574-6941.2008.00534.x
4. Barbieux, K., Constantin, D., Merminod, B.: Correction of air-borne pushbroom images orientation using bundle adjustment offrame images. In: ISPRS - International Archives of the Pho-togrammetry, Remote Sensing and Spatial Information Sciences
XLI-B3, pp. 813–818 (2016). https://doi.org/10.5194/isprs-archives-XLI-B3-813-2016
5. Barott, K., Smith, J., Dinsdale, E., Hatay, M., Sandin, S.,Rohwer, F.: Hyperspectral and physiological analyses of coral-algal interactions. PLoS ONE 4(11), e8043 (2009). https://doi.org/10.1371/journal.pone.0008043
6. Ben-Dor, E.: Quality assessment of several methods to recoversurface reflectance using synthetic imaging spectroscopy data.Remote Sens. Environ. 90(3), 389–404 (2004). https://doi.org/10.1016/j.rse.2004.01.014
7. Berk, A., Conforti, P., Kennett, R., Perkins, T., Hawes, F., vanden Bosch, J.: MODTRAN6: a major upgrade of the MOD-TRAN radiative transfer code. In: Velez-Reyes, M., Kruse,F.A. (eds.) Algorithms and Technologies for Multispectral, Hyper-spectral, and Ultraspectral Imagery XX. SPIE (2014). https://doi.org/10.1117/12.2050433
8. Bernstein, L.S.: Quick atmospheric correction code: algorithmdescription and recent upgrades. Opt. Eng. 51(11), 111,719(2012). https://doi.org/10.1117/1.oe.51.11.111719
9. Bethel, J.S., Lee, C., Landgrebe, D.A.: Geometric registration andclassification of hyperspectral airborne pushbroom data. Int Arch.Photogramm. Remote Sens. XXXIII(B7) (2000)
10. Chang, C.I., Chiang, S.S.: Anomaly detection and classificationfor hyperspectral imagery. IEEE Trans. Geosci. Remote Sens.40(6), 1314–1325 (2002). https://doi.org/10.1109/tgrs.2002.800280
11. Conel, J.E., Green, R.O., Vane, G., Bruegge, C.J., Alley, R.E.,Curtiss, B.J.: Airborne imaging spectrometer-2: Radiometric spec-tral characteristics and comparison of ways to compensate for theatmosphere. In: Vane, G. (ed.) Imaging Spectroscopy II. SPIE(1987). https://doi.org/10.1117/12.942294
12. Cramer, M., Stallmann, D., Haala, N.: Direct georeferencing usinggps/inertial exterior orientations for photogrammetric applica-tions. In: International Archives of Photogrammetry and RemoteSensing, vol. 33, pp. 198–205 (2000)
13. Doneus, M., Verhoeven, G., Atzberger, C., Wess, M., Rus, M.:New ways to extract archaeological information from hyperspec-tral pixels. J. Archaeol. Sci. 52, 84–96 (2014). https://doi.org/10.1016/j.jas.2014.08.023
14. Gao, B.C., Heidebrecht, K.B., Goetz, A.F.: Derivation of scaledsurface reflectances from AVIRIS data. Remote Sens. Env-iron. 44(2-3), 165–178 (1993). https://doi.org/10.1016/0034-4257(93)90014-o
15. Goetz, A.F.H., Srivastava, V.: Mineralogical mapping in thecuprite mining district, nevada. In: Proceedings of the AirborneImaging Spectrometer Data (1985)
16. Haala, N., Stallmann, D., Cramer, M.: Calibration of directlymeasured position and attitude by aerotriangulation of three-lineairborne imagery (1998)
17. Haavardsholm, T.V., Arisholm, G., Kavara, A., Skauli, T.: Archi-tecture of the real-time target detection processing in an air-borne hyperspectral demonstrator system. In: 2010 2nd Work-shop on Hyperspectral Image and Signal Processing: Evolu-tion in Remote Sensing. IEEE (2010). https://doi.org/10.1109/whispers.2010.5594940
18. Holzwarth, S., Muller, R., Simon, C.: Determination and monitor-ing of boresight misalignment angles during the hymap campaignshyeurope 2003 and hyeurope (2004)
19. Keith, C.J., Repasky, K.S., Lawrence, R.L., Jay, S.C., Carlsten,J.L.: Monitoring effects of a controlled subsurface carbon dioxiderelease on vegetation using a hyperspectral imager. Int. J. Greenh.Gas Control 3(5), 626–632 (2009). https://doi.org/10.1016/j.ijggc.2009.03.003
20. Knauer, U., Seiffert, U.: An approach for automated registra-tion of hyperspectral images for boresight calibration. DGPFTagungsband (2013)

J Intell Robot Syst (2018) 90:551–570 569
21. Kruse, F., Lefkoff, A., Boardman, J., Heidebrecht, K., Shapiro,A., Barloon, P., Goetz, A.: The spectral image processing system(SIPS)—interactive visualization and analysis of imaging spec-trometer data. Remote Sens. Environ. 44(2-3), 145–163 (1993).https://doi.org/10.1016/0034-4257(93)90013-n
22. Kuhl, M., Polerecky, L.: Functional and structural imaging of pho-totrophic microbial communities and symbioses. Aquat. Microb.Ecol. 53, 99–118 (2008). https://doi.org/10.3354/ame01224
23. Lenz, A., Schilling, H., Perpeet, D., Wuttke, S., Gross, W., Mid-delmann, W.: Automatic in-flight boresight calibration consider-ing topography for hyperspectral pushbroom sensors. In: 2014IEEE Geoscience and Remote Sensing Symposium. IEEE (2014).https://doi.org/10.1109/igarss.2014.6947103
24. Manolakis, D., Lockwood, R., Cooley, T., Jacobson, J.: Isthere a best hyperspectral detection algorithm? In: Shen, S.S.,Lewis, P.E. (eds.) Algorithms and Technologies for Multispec-tral, Hyperspectral, and Ultraspectral Imagery XV. SPIE (2009).https://doi.org/10.1117/12.816917
25. Manolakis, D.G., Ingle, V.K., Kogon, S.M.: Statistical and Adap-tive Signal Processing: Spectral Estimation, Signal Modeling,Adaptive Filtering, and Array Processing Artech House (2005)
26. Mostafa, M.M., Schwarz, K.P.: A multi-sensor system for airborneimage capture and georeferencing. Photogramm. Eng. RemoteSens. 66(12), 1417–1423 (2000)
27. Muller, R., Lehner, M., Muller, R., Reinartz, P., Schroeder, M.,Vollmer, B.: A program for direct georeferencing of airborne andspaceborne line scanner images. In: Petri G, Kennie TJM (eds.)ISPRS, Commission I, WG I/5, pp. 1–3 (2002). Information avail-able at: http://www.isprs.org/commission1/proceedings02/paper/00072.pdf. Accessed 23 Jun 2016
28. Nansen, C., Zhao, G., Dakin, N., Zhao, C., Turner, S.R.: Usinghyperspectral imaging to determine germination of native aus-tralian plant seeds. J. Photochem. Photobiol. B: Biol. 145, 19–24(2015). https://doi.org/10.1016/j.jphotobiol.2015.02.015
29. O’Neill, N.T., Royer, A., Nguyn, M.N.: Canadian advanced mod-ified 5s (cam5s). Internal Report, CARTEL-1996-0202 Centred’applications et de recherches en teledetection (CARTELl). Uni-versitie de Sherbrooke, Sherbrooke (1996)
30. Plaza, A., Benediktsson, J.A., Boardman, J.W., Brazile, J., Bruz-zone, L., Camps-Valls, G., Chanussot, J., Fauvel, M., Gamba, P.,Gualtieri, A., Marconcini, M., Tilton, J.C., Trianni, G.: Recentadvances in techniques for hyperspectral image processing.Remote Sens. Environ. 113, S110–S122 (2009). https://doi.org/10.1016/j.rse.2007.07.028
31. Polerecky, L., Bissett, A., Al-Najjar, M., Faerber, P., Osmers,H., Suci, P.A., Stoodley, P., de Beer, D.: Modular spectral imag-ing system for discrimination of pigments in cells and microbialcommunities. Appl. Environ. Microbiol. 75(3), 758–771 (2008).https://doi.org/10.1128/aem.00819-08
32. Puckrin, E., Turcotte, C.S., Gagnon, M.A., Bastedo, J., Farley,V., Chamberland, M.: Airborne infrared hyperspectral imager forintelligence, surveillance, and reconnaissance applications. In:Airborne Intelligence, Surveillance, Reconnaissance (ISR) Sys-tems and Applications IX. SPIE (2012). https://doi.org/10.1117/12.918251
33. Qu, Z., Kindel, B., Goetz, A.: The high accuracy atmospheric cor-rection for hyperspectral data (hatch) model. IEEE Trans. Geosci.Remote Sens. 41(6), 1223–1231 (2003). https://doi.org/10.1109/tgrs.2003.813125
34. Richter, R.: A spatially adaptive fast atmospheric correctionalgorithm. Int. J. Remote Sens. 17(6), 1201–1214 (1996).https://doi.org/10.1080/01431169608949077
35. Roberts, D.A., Yamaguchi, Y., Lyon, R.J.P.: Comparison of vari-ous techniques for calibration of ais data. In: Proceedings of the2nd AIS Workshop (1986)
36. Rzhanov, Y., Pe’eri, S.: Pushbroom-frame imagery co-registration. Mar. Geodesy 35(2), 141–157 (2012). https://doi.org/10.1080/01490419.2011.634964
37. Schaum, A.: Hyperspectral detection algorithms: from old ideasto operational concepts to next generation. In: Shen, S.S.,Lewis, P.E. (eds.) Algorithms and Technologies for Multispec-tral, Hyperspectral, and Ultraspectral Imagery XII. SPIE (2006).https://doi.org/10.1117/12.665754
38. Silva, H., Almeida, J.M., Lopes, F., Ribeiro, J., Freitas, S., Amaral,G., Almeida, C., Martins, A., Silva, E.: Uav trials for multi-spectral imaging target detection and recognition in maritimeenvironment. In: OCEANS 2016 MTS/IEEE Monterey. IEEE(2016). https://doi.org/10.1109/oceans.2016.7761259
39. Slabaugh, G.G.: Computing euler angles from a rotation matrix40. Spangler, L.H., Dobeck, L.M., Repasky, K.S., Nehrir, A.R.,
Humphries, S.D., Barr, J.L., Keith, C.J., Shaw, J.A., Rouse, J.H.,Cunningham, A.B., Benson, S.M., Oldenburg, C.M., Lewicki,J.L., Wells, A.W., Diehl, J.R., Strazisar, B.R., Fessenden, J.E.,Rahn, T.A., Amonette, J.E., Barr, J.L., Pickles, W.L., Jacobson,J.D., Silver, E.A., Male, E.J., Rauch, H.W., Gullickson, K.S.,Trautz, R., Kharaka, Y., Birkholzer, J., Wielopolski, L.: A shal-low subsurface controlled release facility in bozeman, montana,USA, for testing near surface CO2 detection techniques andtransport models. Environ. Earth Sci. 60(2), 227–239 (2009).https://doi.org/10.1007/s12665-009-0400-2
41. Stein, D., Schoonmaker, J., Coolbaugh, E.: Hyperspectral imagingfor intelligence, surveillance and reconnaissance (2001)
42. Taitano, Y., Geier, B., Bauer, K.: A locally adaptable iterativeRX detector. EURASIP J. Adv. Signal Process. 2010(1), 341,908(2010). https://doi.org/10.1155/2010/341908
43. Tarabalka, Y., Haavardsholm, T.V., Kaasen, I., Skauli, T.: Real-time anomaly detection in hyperspectral images using mul-tivariate normal mixture models and GPU processing. Jour-nal of Real-Time Image Processing 4(3), 287–300 (2008).https://doi.org/10.1007/s11554-008-0105-x
44. Toth, C.K., Oh, J., Grejner-Brzezinska, D.A.: Airborne hyper-spectral image georeferencing aided by high-resolution satelliteimages. ISPRS TC VII Symposium (2010)
45. Tuo, H., Liu, Y.: A new coarse-to-fine rectification algo-rithm for airborne push-broom hyperspectral images. PatternRecogn. Lett. 26(11), 1782–1791 (2005). https://doi.org/10.1016/j.patrec.2005.02.005
46. Zhang, A., Hu, S., Meng, X., Yang, L., Li, H.: Toward high alti-tude airship ground-based boresight calibration of hyperspectralpushbroom imaging sensors. Remote Sens. 7(12), 17,297–17,311(2015). https://doi.org/10.3390/rs71215883
47. Zhang, X., Nansen, C., Aryamanesh, N., Yan, G., Boussaid, F.:Importance of spatial and spectral data reduction in the detectionof internal defects in food products. Appl. Spectrosc. 69(4), 473–480 (2015). https://doi.org/10.1366/14-07672
Sara Freitas received the MSc degree in Electrical and ComputerEngineering from Instituto Superior de Engenharia do Porto in 2016.She is a Researcher at INESC TEC (CRAS) and PhD Student in Elec-trical and Computer Engineering (University of Porto - Faculty ofEngineering). Her research activities are mainly focused in sensing,perception and navigation for field robotics applications. She is cur-rently working on European project SUNNY, which aims to createan intelligent border security solution using aerial unmanned systems(FP7).

570 J Intell Robot Syst (2018) 90:551–570
Hugo Silva was born in Porto, Portugal 1979. He finished is lic.degree in Electrical and Electronic Engineering from ISEP Porto Poly-technic School in 2004. He pursue further studies and obtained hisMaster in Electronics and Computers Engineering, from IST Univer-sity of Lisbon in 2008. In 2009 he obtained a PhD Scholarship fromPortuguese Science Foundation (FCT), and graduated (Phd) in Elec-tronics and Computers Engineering, from IST University of Lisbonin 2014. He currently works in INESC TEC as a senior researcher,where he is project member in several international FP7, H2020(SUNNY, VAMOS) projects. He is the main author of several researchpublications in the domains of computer vision and mobile roboticsapplications.
Jose Almeida researcher at INESC TEC and professor at PortoPolytechnic Institute. Principal investigator or researcher in severalresearch projects funded by entities such as Portuguese Science andTechnology Foundation, Portuguese Innovation Agency or NATOSfS programme. His main research area is sensing, perception andnavigation in mobile multi-robots systems.
Eduardo Silva is a Robotics Unit coordinator at INESC TEC. Has aPhD in Electrical and Computer Engineering, professor “adjunto” atPorto Polytechnic Institute. His main research area is Control Archi-tectures and Navigation for Autonomous Mobiles Robots. He hasparticipated in more than 25 research projects. He has more than 50publications in the area of the Field Robotics.