Embed Size (px)
Citation preview

Hyperspectral Imaging to Discern Benign and Malignant Canine
Mammary tumors
Control Sensor Network and Perception Laboratory
Electrical and Computer Engineering Department
Temple University
Philadelphia, PA 19122, U.S.A.
Amrita Sahu6th December, 2012

Outline
• Motivation• Research Objectives• Background• Data Acquisition• Experimental Setup• Data Preprocessing and Normalization • Data Analysis Methods• Preliminary Results• Discussion• Future Research Plan

Motivation
Mammary tumors • Originates in the mammary glands• Approximately 4.5 million dogs currently have mammary
tumors.• Once a tumor reaches metastatic stage, chances of
successful treatment becomes very low.
Canine mammary tumors are physiologically similar to breast tumors. If this experiment works for canine tumors , we can extend the project in future to breast cancer.
http://www.thepetcenter.com/gen/can.html

Motivation
• No good device to identify canine cancerous tumors.
• Doctors usually perform biopsy or just ‘wait and watch’.
• Biopsy is the gold standard for cancer detection.
• It is invasive and requires several days for the results to be determined.
To avoid the above disadvantages, we propose to use a non-invasive hyperspectral imaging system for characterizing canine mammary tumors.
http://www.beliefnet.com/healthandhealing/getcontent.aspx?
cid=14777

Research Objectives
• Design an experiment to acquire the hyperspectral images of mammary tumors from the canine patients.
• Find the best normalization and preprocessing techniques to normalize the spectra.
• Develop an algorithm to discern the malignant tumors from the benign tumors.

Background
Hyperspectral imaging measures and collects reflectance intensity information of more than hundred spectral bands across the electromagnetic spectrum.
http://www.nature.com/nphoton/journal/v3/n11/
fig_tab/nphoton.2009.205_F3.html

Applications of Hyperspectral Imaging
Applications of Hyperspectral Imaging are: • Agriculture• Mineralogy• Surveillance• Monitoring of Oil Drilling• Non-Invasive Tissue Analysis
http://www.markelowitz.com/Hyperspectral.html

Why is Near Infrared Spectral Range Used?
• Near Infrared Hyperspectral Imaging has been used in literature for the detection of various kinds of cancer.
• NIR light penetrates further into the tissue than light in any other spectrum, because tissue has low absorptivity in this region.
• NIR light is absorbed by certain chromophores in the tissue that are biochemically significant.
• In this project, we use the NIR spectral range (650nm to 1100nm) as the light transmission range.

Cancer Detection using Infrared Hyperspectral Imaging
• Breast Cancer• Prostate Cancer• Tongue Cancer• Gastric Cancer• Skin Cancer• Canine Mammary Cancer• Other diseases: intestinal ischemia, lung emphysema

Breast Cancer
• Results from 58 malignant breast tumors are reported.• A steady state spectrometer used (650-1100nm).• Six laser diodes used for illumination.• Fiber Optic cable delivers laser light to tissue.
Shah, N., A. E. Cerussi, D. Jakubowski, D. Hsiang, J. Butler, and B. J. Tromberg, The role of diffuse optical spectroscopy in the clinical
management of breast cancer. Dis. Markers 19:95–105, 2003.

Breast Cancer (Cont.)
• Hemoglobin, water and lipid content is different in malignant and benign tumors.
• Tissue Optical Index (TOI) was developed.
• Higher TOI indicates tumor malignancy.
Shah, N., A. E. Cerussi, D. Jakubowski, D. Hsiang, J. Butler, and B. J. Tromberg, The role of diffuse optical spectroscopy in the clinical
management of breast cancer. Dis. Markers 19:95–105, 2003.

Prostate Cancer• Experiment carried out on 11 mice with human prostate tumors on
their flanks.
• Data normalized using standard reflectances.
• Difference in reflectance properties observed between cancer and normal tissue.
• Algorithm was developed using Support Vector Machine (SVM).
• Results shows sensitivity and specificity of 92.8% and 96.9% respectively.
Akbari,Hamed, Halig,Luma V, Schuster, David M, Osunkoya, Adeboye, Master,Viraj, Nieh,Peter T, Chen,Georgia Z, Fei,Baowei, Hyperspectral imaging and quantitative analysis for prostate cancer detection, Journal of Biomedical Optics, 2012

Gastric Cancer
• Gastric tumors imaged from 10 human patients.• Each tumor imaged 10 times, to ensure repeatability of system.• Noise removed by median filtering. Normalization by reflectance boards.• Normalized Difference Cancer Index Method gave the best results.• Sensitivity and Specificity is 93% and 91%.
Hamed Akbari, Kuniaki Uto, Yukio Kosugi, Kazuyuki Kojima, Naofumi Tanaka, Cancer detection Using Infrared Hyperspectral Imaging, Cancer Science, pp: 852-857, 2011.
.
Canine Mammary Cancer
• Fluorescent dyes used.
• The dyes were administered in the vein of the canine patient
• For illumination, a 660nm laser diode beam used.
• The uptake and release rates of the dye varied in the diseased
and normal tissue.
M. Gurfinkel, A.B. Thompson, W. Ralston, T. L. Troy, A. L. Moore, T. A. Moore, J. Devens Gust, D. Tatman, J. S. Reynolds, B. Muggenburg, K. Nikula, R. Pandey, R. H. Mayer, D. J. Hawrysz and E. M. Sevick-Muraca, Pharmacokinetics of ICG and HPPH-car for the
Detection of Normal and Tumor Tissue Using Fluorescence, Near-Infrared Reflectance Imaging: A Case Study, Photochemistry and Photobiology, 2000, 72(1), 94-102

Experimental Flow
Data Acquisition From Canine Patients
• Data acquired in collaboration with the University of Pennsylvania Veterinary Hospital.
• Canine Patients had multiple mammary tumors in their abdomen.
• Animal Experiments approved by the Univ. Of Pennsylvania IACUC Protocol #803829.
• Tumors marked with a black marker so it can be recognized during image analysis.
• During image acquisition, dogs held by veterinary doctor.

Data Acquisition From Canine Patients (cont.)

Canine Tumor Data
Hyperspectral Imaging System Description
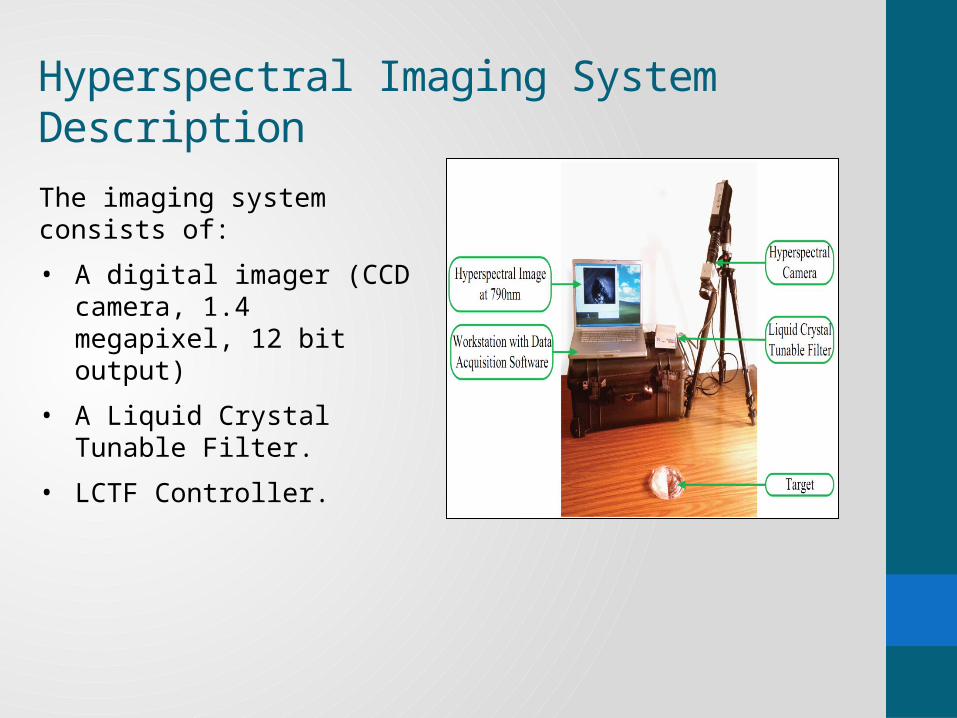
The imaging system consists of:
• A digital imager (CCD camera, 1.4 megapixel, 12 bit output)
• A Liquid Crystal Tunable Filter.
• LCTF Controller.

Hyperspectral Imaging System Description (cont.)
• A 500W dual quartz tungsten halogen lamps (360-2500nm) are used for illumination.
• The light should fall as uniformly on the subject as possible.
• An Apple Macbook Pro Laptop Computer used for spectral acquisition.
Preprocessing and Normalization of data
• Data should be preprocessed to eliminate noise.
• Data should be normalized to treat spectral non-uniformity of device.
• Raw data may change due to illumination, temperature and non-uniform contour of the subject.

PreprocessingMethods
• Filtering (to minimize noise)
a) Median Filtering
b) Savitzky-Golay Smoothing Process
Smoothing applied on raw
data to minimize noise

Normalization Technique using Standard Reflectance
• White reference and dark current captured.
• White reference is the spectrum of the white reference board (SRS-99 Labsphere Inc.).
• Dark current is measured by capturing the spectrum of 2% reflectance board (SRS-02 Labsphere Inc.).
This method will be used in future experiments!

Other Normalization Methods
• Area Normalization
• Unit Vector Normalization
• Mean Normalization
• Maximum Normalization
• Range Normalization

Other Normalization Methods (cont.)
0
0.2
0.4
0.6
0.8
1
1.2
680 690 700 710 720 730 740 750 760 770 780 790 800 810 820 830 840 850 860 870 880 890 900 910 920 930 940 950 960 970 980 990 1000 1010 1020 1030 1040 1050 1060 1070
Norm
alized
reflect
ance in
tensity
(a.u.)
Wavelength (nm)
After applying
range normaliz
ation

Identifying the Wavelengths of Chromophores
Applying second derivative method on the absorbance spectra

Data Analysis Methods
• Principal Component Analysis
• Linear Discriminant Analysis
• Support Vector Machine
• Tissue Optical Indices Methods

Principal Component Analysis
• Converts a larger number of correlated variables into a smaller number of linearly uncorrelated variables called principal components (PC).
• The first principal component has the highest variance, the second principal component has the second highest variance and so on.
• Each PC is orthogonal to each other.
http://cnx.org/content/
m11461/latest/
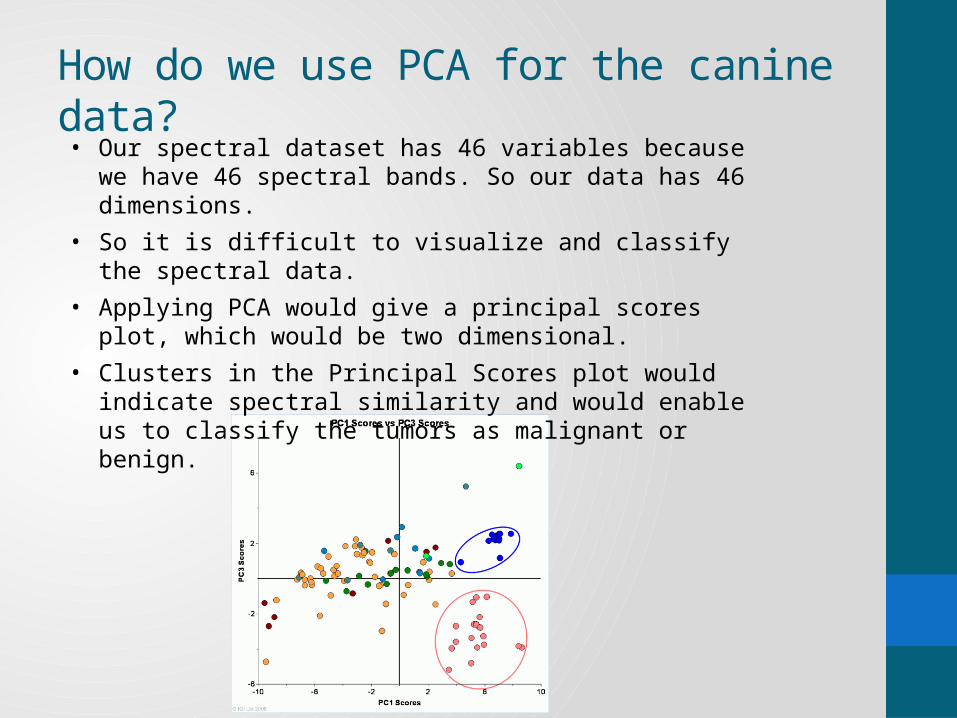
How do we use PCA for the canine data?• Our spectral dataset has 46 variables because we have 46
spectral bands. So our data has 46 dimensions.
• So it is difficult to visualize and classify the spectral data.
• Applying PCA would give a principal scores plot, which would be two dimensional.
• Clusters in the Principal Scores plot would indicate spectral similarity and would enable us to classify the tumors as malignant or benign.

Linear Discriminant Analysis
• Linear Discriminant Analysis is widely used in statistics, machine learning and pattern recognition.
• It finds a linear combination of features which characterized two or more classes of objects.
• It used Bayes’ Formula, and we assume that the prior probabilities for groups are given.
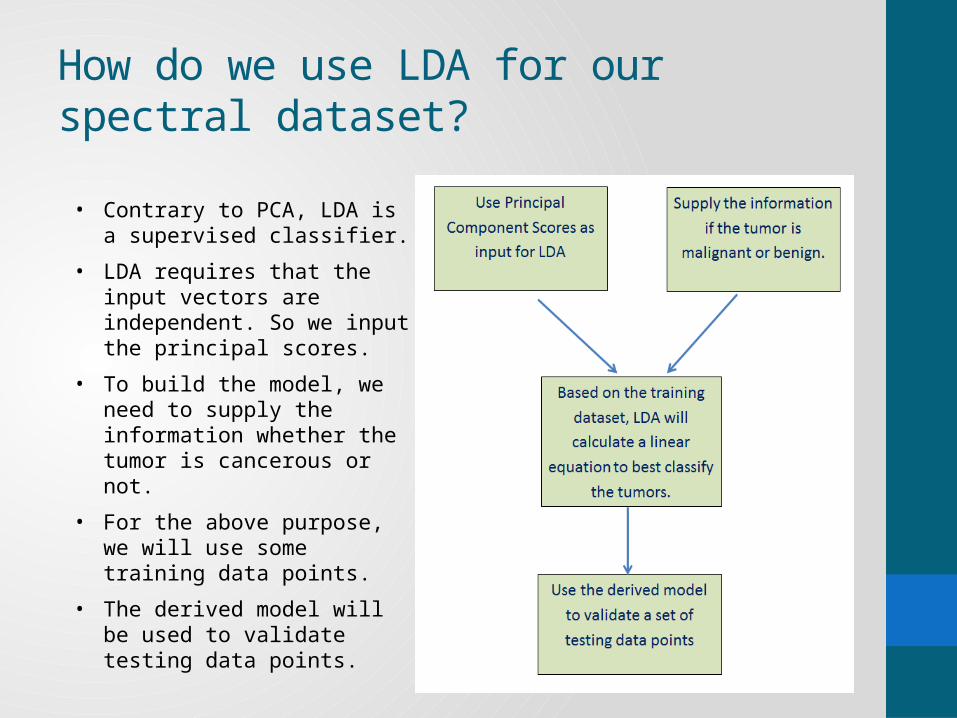
How do we use LDA for our spectral dataset?
• Contrary to PCA, LDA is a supervised classifier.
• LDA requires that the input vectors are independent. So we input the principal scores.
• To build the model, we need to supply the information whether the tumor is cancerous or not.
• For the above purpose, we will use some training data points.
• The derived model will be used to validate testing data points.

Support Vector Machine
• SVM finds optimal dividing hyperplane with maximum margin.• If a linear boundary is not feasible, it maps each object to a higher
dimensional space.• Kernel function is used for the mapping.
http://ccforum.com/content/11/4/R83/figure/F1

How do we use SVM for our spectral dataset?
The advantage of SVM over LDA is that it is a non-linear classifier.

Tissue Optical Indices Method
• Higher content of hemoglobin (HbT) suggests elevated blood volume and angiogenesis.
• Higher water content (H2O) suggest edema and increased cellularity
• Decreased StO2 (tissue oxygen saturation) indicated tissue hypoxia driven by metabolically active tumor cells
• Decreased lipid content reflects displacement of parenchymal adipose
• A higher TOI suggest that the tumor is malignant, because it indicates higher metabolic activity of the cells.
2
2
[ ][ ]
[ ][ ]
H O HbTTOI
Lipid StO

How do we use TOI method for our spectral dataset?
Malignant tumors should have higher value of TOI than benign tumors
Preliminary Results
• Smoothed spectral data from 2 canine patients shown.
• Cancer Tissue has relatively lower reflectance intensity compared to the benign and the normal tissue.
• Decreased reflectance intensity is due to higher metabolic activity (higher blood level) of cancer cells.

Preliminary Results
0
10
20
30
40
50
60
650 700 750 800 850 900 950 1000 1050 1100
Refle
ctanc
e int
ensit
y
Wavelength in nm
R1 (benign)
L3 (malignant)
Normal tissue 1
Normal tissue 2
Normal tissue 3
Normal tissue 4
0
10
20
30
40
50
60
70
80
90
650 700 750 800 850 900 950 1000 1050 1100
Refle
ctan
ce in
tens
ity
Wavelength in nm
L1 (malignant)
Normal tissue 1
Normal tissue 2
Normal tissue 3
Normal tissue 4

Discussion
• Preliminary Results are promising.
• We can differentiate malignant and benign spectra for a single canine patient.
• Some issues faced during experiment like lighting and normalization.

Discussion (cont.)
• The lighting should be as uniform as possible.
• Non-uniform light will introduce variability in the data.
• The temperature of the tungsten halogen lights are very high.
• Uncomfortable for patients.
• Use of fiber optic cable can mitigate can the problem.
Discussion (cont.)
44
• Normalization of the data is important.
• In future experiments, we should use the reflectance standards to
normalize data.
• This modality can be used by surgeons to determine tumor margin.
• A safe resection margin reduces operational mortality and morbidity.

Future Work
• Normalize the data.
a) Will apply normalization techniques like range, area, unit-vector,
maximum and mean normalization on the spectral data.
• Develop a malignancy detection algorithm.
a) Will apply the four algorithms on the spectral dataset: PCA, LDA,
SVM and TOI methods.
b) Calculate the sensitivity and specificity for each method.

Future Work (cont.)
Check repeatability of system.
• Conduct an experiment to image to the same sample over 7
consecutive days.
• Keep lighting conditions as similar as possible.
• Compare reflectance intensity plots to check if they are similar
or changing with time.

Future Work (cont.)
Find out the depth of interrogation of the system.
• In case of canine patients, most of the tumors were surface
tumors. So depth was not an issue here.
• However, if we extend this project to human cancer, then
depth of interrogation of the system will be an issue.
• I will conduct a literature search on how to find out the depth of
interrogation of the system.
Acknowledgement
I would like to thank the following people:• Dr. Chang-Hee Won for providing me the opportunity to work on this
project and for guiding me through the project.• My Committee Members: Dr. Joseph Picone and Dr. Nancy Pleshko.• Dr. Karin Sorenmo, for providing the canine patient data.• Dr. Cushla McGoverin, for her constant help, support and
encouragement.• Dr. Won and Firdous Saleheen, for their help in canine data
acquisition.• The members of the CSNAP lab.